

Abstract
Many physiologically important activities of oligodendrocyte progenitor cells (O-2A cells), including proliferation, migration and differentiation, are regulated by cytosolic Ca2+ signals. However, little is known concerning the mechanisms of Ca2+ signalling in this cell type. We have studied the interactions between Ca2+ entry, Ca2+ release from endoplasmic reticulum and Ca2+ regulation by mitochondria in influencing cytosolic Ca2+ responses in O-2A cells.
Methacholine (MCh; 100 μM) activated Ca2+ waves that propagated from several initiation sites along O-2A processes.
During a Ca2+ wave evoked by MCh, mitochondrial membrane potential was often either depolarized (21% of mitochondria) or hyperpolarized (20% of mitochondria), as measured by changes in the fluorescence of 5,5′,6,6′-tetrachloro-1,1′,3,3′-tetraethylbenzimidazole carbocyanine iodide (JC-1).
Stimulation with kainate (100 μM) evoked a slowly rising, sustained cytosolic Ca2+ elevation in O-2A cells. This also, in some cases, resulted in either a depolarization (15% of mitochondria) or hyperpolarization (12% of mitochondria) of mitochondrial membrane potential.
Simultaneous measurement of cytosolic (fluo-3 AM) and mitochondrial (rhod-2 AM) Ca2+ responses revealed that Ca2+ elevations in the cytosol evoked by either MCh or kainate were translated into long-lasting Ca2+ elevations in subpopulations of mitochondria. In some mitochondria, Ca2+ signals appeared to activate Ca2+ release into the cytosol.
Inhibition of the mitochondrial Na+-Ca2+ exchanger by CGP-37157 (25 μM) decreased kainate Ca2+ response amplitude and increased the rate of return of the response to basal Ca2+ levels.
Thus, both ionotropic and metabotropic stimulation evoke changes in mitochondrial membrane potential and Ca2+ levels in O-2A cells. Ca2+ uptake into some mitochondria is activated by Ca2+ entry into cells or release from stores. Mitochondrial Ca2+ release appears to play a key role in shaping kainate-evoked Ca2+ responses.
In the developing brain, progenitor cells of the oligodendrocyte lineage (O-2A cells) migrate from germinal zones in the brain or spinal cord to locations throughout the CNS (reviewed in Miller, 1996). In the adult CNS, O-2A cells can migrate towards lesion sites, thus potentially repopulating a damaged region with oligodendrocytes and leading to remyelination of nerve axons (Vignais et al. 1993). O-2A cells in culture also migrate in response to chemoattractants (Armstrong, Harvath & Dubois-Dalcq, 1990). Cellular migration is believed to depend upon subcellular gradients in [Ca2+], which enable appropriate attachment and detachment from the underlying matrix (Marks & Maxfield, 1990a,b; Wang et al. 1996). The mechanisms underlying this local control of Ca2+ levels in migratory cells remain poorly understood.
In addition, the development of O-2A cells into mature oligodendrocytes is under the control of extracellular cues mediated by cytoplasmic Ca2+ signals. Cultured cortical O-2A cells respond to muscarinic or glutamate receptor stimulation with large-amplitude cytosolic Ca2+ elevations (Holtzclaw, Gallo & Russell, 1995; Pende, Fisher, Simpson, Russell, Blenis & Gallo, 1997). These signals activate multiple signalling pathways, including phosphorylation of cyclic AMP response element binding protein (CREB) and induction of c-fos expression, and appear to play a key role in the regulation of O-2A cell proliferation and differentiation (Pende, Holtzclaw, Curtis, Russell & Gallo 1994; Liu & Almazan, 1995; Cohen, Molinaholgado & Almazan, 1996; Pende et al. 1997).
Both local and global aspects of Ca2+ homeostasis in many cell types are regulated in a complex manner by Ca2+-dependent modulation of multiple components of signalling cascades, predominantly localized to either the endoplasmic reticulum (ER) or the plasma membrane (Simpson, Challiss & Nahorski, 1995). Recent evidence indicates that a further layer of local regulation may be generated by interactions between cytosolic and mitochondrial compartments (Gunter, Gunter, Sheu & Gavin, 1994; Simpson & Russell, 1998). Studies in various cell types including glia and neurones have indicated that mitochondria may interact with ER Ca2+ release sites, or with plasma membrane Ca2+-permeable channels, in order to regulate cell activity and Ca2+ flux (Bindokas & Miller, 1995; White & Reynolds, 1996; Simpson & Russell, 1996, 1997). In certain cell types, mitochondria appear to be preferentially localized near to the plasma membrane, rather than near to the ER, which appears to allow such mitochondria to buffer Ca2+ entry, primarily, rather than Ca2+ release (Lawrie, Rizzuto, Pozzan & Simpson, 1996). Alternatively, localization of mitochondria close to ER membranes appears to facilitate interactions between these two organelles during Ca2+ waves (Rizzuto, Brini, Murgia & Pozzan, 1993; Jouaville, Ichas, Holmuhamedov, Camacho & Lechleiter, 1995; Simpson & Russell, 1996, 1997). However, little is known concerning the precise nature of the interactions between cytosolic, ER and mitochondrial Ca2+ regulation in subcellular microdomains.
We have, therefore, studied the role of interactions between Ca2+ entry, Ca2+ release from ER, and Ca2+ regulation by mitochondria in modulating Ca2+ responses within cytosolic microdomains in O-2A cells. We have investigated the spatiotemporal characteristics of muscarinic receptor-mediated Ca2+ responses, and examined the relationship between mitochondrial Ca2+ responses and elevations in cytosolic [Ca2+]. Interactions between cytosol and mitochondria were studied using a mitochondrial membrane potential-sensitive dye, JC-1, and by simultaneous measurement of cytosolic Ca2+ using fluo-3 AM and mitochondrial Ca2+ using rhod-2 AM. Overall, our findings indicate that both ionotropic and metabotropic Ca2+ responses in O-2A cells are modulated in a complex manner by interactions with mitochondria. Mitochondrial responses were found to differ markedly in different regions even within the same cell, which may enable mitochondria to play a role in sustaining subcellular heterogeneities in Ca2+ responses.
METHODS
Cell culture
O-2A cells were prepared from 2-day-old rat pups. Pups were cooled in a chamber containing dry ice for 2 min and then killed by decapitation with a small guillotine, as approved by the Animal Care and Use Committee (Animal protocol no. 95-004), National Institute of Child Health and Human Development. Cortices were removed and dissociated, and cells cultured in plastic flasks. After 8 days in vitro, the flasks were vigorously shaken overnight. The supernatant was repeatedly plated onto plastic dishes, to which endothelial cells, microglia and fibroblasts quickly attach. Non-adherent cells were then replated onto glass coverslips coated with 0.1 mg ml−1 polyornithine. Cells were cultured in Dulbecco's modified Eagle's medium-N1 (DME-N1) supplemented with 30% conditioned medium from cultures of the B104 neuroblastoma cell line, and maintained in 10% CO2-90% air. Alternatively, oligodendrocytes were prepared as described previously (Simpson & Russell, 1996). Cells were obtained as above and replated in DME-N1 containing 0.5% fetal bovine serum for 24 h, and thereafter in DME-N1 containing 2% fetal bovine serum, and maintained in 10% CO2-90% air, under which conditions the bipotential cells developed into oligodendrocytes. Culture medium was replaced every 3 days, and all cells were used 3-7 days after replating.
[Ca2+]i measurement
Experiments were performed in a Leiden coverslip chamber continuously perfused with balanced salt solution as described previously (Yagodin et al. 1994). For [Ca2+]i studies in whole cells, cells were incubated with 5 μM fura-2 AM (the acteoxymethyl ester form of fura-2) for 20 min at room temperature (20-22°C) as described previously (Simpson & Russell, 1996). Images were acquired every 0.5-1.0 s at 340 and 380 nm excitation (emission at 510 nm) through a microchannel plate intensifier with a CCD camera. Images were digitized, averaged (two frames at each wavelength) and wavelength ratios were calculated in a Trapix 55/4256 image processor. For the study of fast Ca2+ wave propagation in glial cell processes, cells were incubated with 5 μM fluo-3 AM (the acteoxymethyl ester form of fluo-3) for 20 min at room temperature as described previously (Yagodin, Holtzclaw, Sheppard & Russell, 1994; Simpson & Russell, 1996). Fluorescence images were acquired every 66 ms at 495 nm excitation wavelength (525 nm emission). Cells were divided for analysis into 0.8-1.6 μm-wide regions sequentially along the longitudinal axis of the cell (Simpson & Russell, 1996). Fluorescence intensity values in the non-zero pixels within each slice were averaged (F) and plotted as normalized fluorescence (ΔF/F) against time, where ΔF was calculated as the difference between the mean value of the first twenty data points prior to stimulation of the cell and F. From these data, local Ca2+ release kinetics were calculated as described previously (Yagodin et al. 1994; Simpson & Russell, 1997). Specifically, the peak Ca2+ amplitude (ΔF/F) of the response in each slice was calculated by subtraction of mean resting fluorescence values from the peak fluorescence. Rate of Ca2+ rise ((ΔF/F) s−1) was measured as the maximum slope of the rising phase of the Ca2+ response between 10 and 90% of the peak. Time to 50% of peak (s) was measured as the time point at which the local Ca2+ increase was half-maximal. All calculations were performed using macros within Synapse, a software environment which is capable of image acquisition and analysis in an Apple Macintosh computer (Synergistic Research Systems, Silver Spring, MD, USA).
Mitochondrial membrane potential measurement
Mitochondrial membrane potential within cells was measured using 5,5′,6,6′-tetrachloro-1,1′,3,3′-tetraethylbenzimidazole carbocyanine iodide (JC-1), a Nernstian dye, as previously described (Reers, Smiley, Mottola-Hartshorn, Chen, Lin & Chen, 1995; Simpson & Russell, 1996). Briefly, O-2A cells were incubated in 10 μg ml−1 JC-1 for 10 min, and red (J aggregate) fluorescence was monitored within individual mitochondria at 535 nm excitation (610 nm emission). High-resolution imaging enabled delimiting of individual mitochondria for analysis. For the comparison of mitochondrial location and activity with cytosolic Ca2+ responses, cells were loaded with fluo-3 AM and stimulated to evoke a Ca2+ wave, which was measured as described above. Cells were then incubated with 10 μg ml−1 JC-1 (10 min) while they remained on the microscope stage, and fluorescence images were acquired in both the green (495 nm excitation, 525 nm emission) and red (535 nm excitation, 610 nm emission) fluorescence emission bands of JC-1.
Simultaneous measurement of mitochondrial and cytosolic [Ca2+]
For comparison of Ca2+ responses in cytosol and mitochondria, cells were incubated with 5 μM rhod-2 AM (the acetoxymethyl ester form of rhod-2) for 30 min, and returned to culture medium for 24 h at 37°C, a protocol which results in removal of most cytosolic rhod-2 AM but leaves mitochondria still loaded with the dye (Hajnóczky, Robb-Gaspers, Seitz & Thomas, 1995; Simpson & Russell, 1996). Cells were subsequently incubated with 5 μM fluo-3 AM for 20 min. Fluo-3 AM and rhod-2 AM fluorescence were imaged using a filter set fitted with a dual-band dichroic mirror (520 and 575 nm) and band-pass filters (520 and 600 nm, 40 nm full width at half-maximum transmission; Chroma Technologies, Brattleboro, VT, USA). Cells were excited through narrow band-pass excitation filters alternately at exciting wavelengths for fluo-3 AM (485 nm, 15 nm full width at half-maximum transmission) and rhod-2 AM (530 nm, 45 nm full width at half-maximum transmission). Images were acquired every 0.5-1.0 s, with image intensifier gain being independently adjusted for the two fluorophores by computer control. Cells were divided into 0.8 μm-wide regions sequentially along the longitudinal axis as described above for analysis of cytosolic fluo-3 AM fluorescence. High-resolution imaging enabled delimiting of individual mitochondria for analysis of intramitochondrial rhod-2 AM fluorescence. Rhod-2 AM fluorescence changes were then compared with fluo-3 AM responses in cell slices juxtaposed to the mitochondrial boundaries. Responses were presented graphically within Kaleidagraph (Abelbeck Software). Rhod-2 AM fluorescence signals were not calibrated and represent a qualitative measure of intramitochondrial [Ca2+].
Cross-correlation analysis
The spatial patterns of Ca2+ responses and of mitochondrial distribution were compared within cells using a cross-correlation function derived from the Fast Fourier transformation of the data sets as a quantitative test for similarity (Simpson & Russell, 1996). The mean values of normalized fluorescence intensities were subtracted out, and the resulting zero mean waves were embedded in surrounding zeros in order to eliminate circular correlations, i.e. between the beginning and end of the data sets, due to the periodic nature of Fourier series. The data were then analysed via a Fast Fourier Transform algorithm, using standard functions in Mathematica (Wolfram Research Inc., IL, USA). Cross-spectra were formed as a product of one data set with the complex conjugate transformation of a second data set. The cross-correlation function was produced by inverse Fourier transformation of the cross-spectrum. Results are presented as means ±s.d.
Materials
Acetyl-β-methylcholine chloride (methacholine, MCh) and kainic acid were obtained from Sigma. Cyclosporin A, rhod-2 AM, fura-2 AM and fluo-3 AM were obtained from Research Biochemicals International. MitoTracker CMXRos and 5,5′,6,6′-tetrachloro-1,1′,3,3′-tetraethylbenzimidazole carbocyanine iodide (JC-1) were from Molecular Probes. CGP-37157 was a gift from Novartis (Basel, Switzerland).
RESULTS
Methacholine-evoked Ca2+ waves in O-2A cells
While Ca2+ waves have been reported in several glial cell types, their existence in immature glial progenitors has not been examined. Initial experiments were therefore designed to characterize Ca2+ responses in O-2A cells, as evoked by activation of G-protein-coupled muscarinic receptors, using a fluorescence microscope with the capability for video-rate image acquisition. Fluo-3 AM-loaded O-2A cells were stimulated with 100 μM methacholine (MCh), and images were acquired every 66 ms. Almost all O-2A cells (> 95%) responded to MCh with a [Ca2+]i increase, which initiated at several sites in a single process and propagated over most of the cell as a wave (Fig. 1). Figure 1A shows the outline of a single process of a bipolar O-2A cell (the second process stretched out of the field of view), sectioned into 1.6 μm-wide slices along the longitudinal axis. Wave propagation was analysed as described earlier for astrocytes and oligodendrocytes (Yagodin et al. 1994; Simpson & Russell, 1996; Simpson, Mehotra, Lange & Russell, 1997). Four sites of wave initiation were identified (Fig. 1B, asterisks) as sites at which the wave appeared earlier than in neighbouring cell regions, as shown by a plot of the time to 50% peak against cell length (Fig. 1B). In the cell shown, the rate of wave propagation from these sites and along the process was highly non-uniform, varying from 2 to 36 μm s−1 along the process (Fig. 1B).
Figure 1. Characteristics of Ca2+ waves in O-2A cells.

A, outline of the O-2A process which was analysed in this representative experiment. Numbers correspond to distance (in μm) along the cell axis (see x-axis in B and C). B, a plot of the time to 50% peak of the wave measured at successive serial sections of the process 1.6 μm apart (see Methods) against cell length shows a MCh (100 μM)-activated Ca2+ wave in an O-2A cell. This wave initiates at a site in the cell at one end of the process (asterisk furthest to the right) and propagates towards the cell body. There are 3 other sites along the process where local waves are initiated prior to the arrival of the original wave front (remaining 3 asterisks). These initiation sites correspond to minima in the plot of time to half-maximum response against distance in B. The rates of propagation (μm s−1) from these sites were calculated for each approximately linear region of propagation and are listed at the top of the panel. C, a plot of the peak Ca2+ amplitude (•) and the rate of rise of Ca2+ (▵) measured in each serial section of the process against length. The two kinetic parameters are markedly elevated at the same cellular domains (wave amplification sites).
We then examined the amplitude and slope of the local signals as measures of the magnitude of local Ca2+ release during the wave. A plot of the peak Ca2+ amplitude (ΔF/F) and rate of Ca2+ rise ((ΔF/F) s−1) against length showed that in discrete local regions of the process both parameters were markedly enhanced (Fig. 1C; cross-correlation coefficient of wave amplitude and rate of rise = 0.63 ± 0.19 at 0.5 ± 0.2 μm from phase, n = 14). These regions correspond to the wave amplification sites previously identified in other cell types (Yagodin et al. 1994; Simpson & Russell, 1996). We have previously reported that mitochondria are localized to wave amplification sites in the daughter cells of O-2A cells, oligodendrocytes (Simpson & Russell, 1996; Simpson et al. 1997). Since Ca2+ signals evoked by neurotransmitters are important for the proliferation and differentiation of O-2A cells, we tested if a similar cellular mechanism of wave propagation is operative in these glial progenitors. Ca2+ wave kinetics measured from fluo-3 AM fluorescence changes, and mitochondrial location measured using the dye JC-1 were compared in discrete consecutive sections along the O-2A cell axis. Cross-correlation analysis of the resulting distribution patterns indicated the presence of one or more mitochondria in close spatial association with each wave amplification site (not shown, see for example Simpson & Russell, 1996; Simpson et al. 1997). Mitochondria were found to be stationary in O-2A processes, enabling the study of changes in membrane potential and intramitochondrial Ca2+ ([Ca2+]m) in individual mitochondria over time, and the comparison of effects of different stimuli on a single mitochondrion (see later).
Consequences of agonist-evoked Ca2+ responses for mitochondria
In order to understand the role of mitochondria in the cytosolic Ca2+ response, we studied changes in mitochondrial membrane potential during a MCh-evoked Ca2+ wave. Cells were loaded with JC-1 for 10 min, and the red J aggregate fluorescence was measured within individual O-2A mitochondria. JC-1 is a carbocyanine dye which is selectively taken up into mitochondria, emitting a green fluorescence. At hyperpolarized mitochondrial membrane potentials it forms J aggregates in a rapidly reversible manner which emit a red fluorescence. It has previously been reported that JC-1 red emission, due to J aggregate formation (see Reers et al. 1995), is a reliable indicator of changes in mitochondrial membrane potential (Reers, Smith & Chen, 1991; Reers et al. 1995; Di Lisa et al. 1995; White & Reynolds, 1996). While some studies showed that the JC-1 monomer green fluorescence can also be used to assess at least large changes in membrane potential (Di Lisa et al. 1995), other experimental results suggest that changes in the green fluorescence cannot be used reliably for this purpose (Reers et al. 1995). Therefore, we only measured changes in JC-1 red fluorescence. We were able to measure fluorescence changes within individual mitochondria using a × 100 objective, which allowed us to investigate if any differences in responsiveness exist between mitochondria even within a single cell. The resting level of J aggregate red fluorescence varied markedly between different mitochondria in the same cell, as previously reported in another cell type (Reers et al. 1995). The mitochondrial localization of the dye was confirmed by the decrease in JC-1 fluorescence evoked by treatment with the mitochondrial uncoupler FCCP (carbonyl cyanide p-trifluoromethoxyphenylhydrazone, 1 μM; not shown) (see Simpson & Russell, 1996). In five separate experiments, several different effects of MCh (100 μM) on different mitochondria were consistently observed, without corresponding changes in the cell volume or mitochondrion volume or position. In these and subsequent experiments, the location of mitochondria within cells did not appear to determine their response characteristics (Kirischuk, Neuhaus, Verkratsky & Kettenmann, 1995). While no significant changes in J aggregate fluorescence were measured in many mitochondria (Fig. 2A and D), in a significant proportion MCh caused a gradual increase in J aggregate formation, indicating a rise in mitochondrial membrane potential (i.e. hyperpolarization; Fig. 2B). In other mitochondria, however, a slow-onset, persisting depolarization was evoked by MCh (Fig. 2C). The histogram in Fig. 2D summarizes the percentages of responsive mitochondria. Mitochondria in which changes in fluorescence were not readily distinguished from noise were classified as non-responding.
Figure 2. Effects of agonists on mitochondrial membrane potential.

J aggregate fluorescence of JC-1 was measured within individual mitochondria during agonist treatment. Responses are presented as arbitrary fluorescence units (a.u.) on an 8-bit scale. Cells were stimulated with MCh (100 μM; 4 experiments, 228 mitochondria; A-D) or with kainate (200 μM; 5 experiments, 283 mitochondria; E-H) for 90 s (open bars in A-C and E-G). A, MCh did not significantly change JC-1 red fluorescence in this mitochondrion. The majority of mitochondria were similarly unaffected by MCh. B, in a significant subpopulation of mitochondria, MCh evoked a slow-onset increase in fluorescence, indicative of a mitochondrial hyperpolarization, which outlasted the period of agonist treatment. C, in other mitochondria, MCh evoked a marked decrease in J aggregate fluorescence, indicative of mitochondrial depolarization. D, percentages of mitochondria in which membrane potential changes occurred in response to MCh are shown in this histogram: ▪, no membrane potential change;  , mitochondria depolarized by MCh; □, mitochondria hyperpolarized by MCh. E, kainate stimulation of the cell did not significantly change JC-1 red fluorescence in this mitochondrion. The majority of mitochondria were unaffected by treatment with kainate, as in the case of MCh treatment (Fig. 2A). F, in a subpopulation of mitochondria, kainate evoked a hyperpolarization, which continued to increase throughout and beyond the period of agonist treatment. G, in other mitochondria, kainate evoked a significant, persistent mitochondrial depolarization. H, histogram showing the percentages of mitochondria in which membrane potential changes occurred in response to kainate: ▪, no membrane potential change; , mitochondria depolarized by kainate; □, mitochondria hyperpolarized by kainate.
A parallel series of experiments was performed to examine the effects of the ionotropic glutamate receptor agonist kainate on mitochondrial membrane potential in O-2A cells. While the majority of mitochondria in these cells were unaffected by kainate treatment (200 μM; Fig. 2E), in a subpopulation a slow rise in the level of J aggregate fluorescence, indicative of kainate causing a hyperpolarization, was detected (Fig. 2F). In other mitochondria, kainate caused a slow-onset depolarization (Fig. 2G). The histogram in Fig. 2H shows the overall percentage of mitochondria that responded to kainate treatment with a membrane potential change. Fewer mitochondria were affected by kainate than were affected by MCh (Fig. 2D and H), and some mitochondria were unaffected by either agonist. While some processes were not invaded by cytosolic Ca2+ waves during activation with MCh (see Fig. 3D), the percentage of mitochondria in which no changes were observed (Fig. 2D) was higher than would be expected if cytosolic Ca2+ changes always activated changes in mitochondrial membrane potential.
Figure 3. Comparison of effects of MCh and kainate on the same mitochondria.
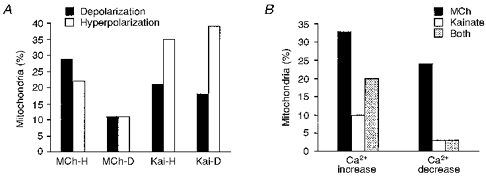
A, histogram showing the lack of dependence on the direction of the membrane potential change of a mitochondrion in response to one agonist on the response to the other. Mitochondria hyperpolarized by MCh (MCh-H) were approximately equally likely to be depolarized or hyperpolarized by kainate. Mitochondria depolarized by MCh (MCh-D) were also similarly depolarized or hyperpolarized by kainate. Mitochondria which were either hyperpolarized (Kai-H) or depolarized (Kai-D) by kainate were in both cases more frequently hyperpolarized than depolarized by MCh. B, histogram of Ca2+ changes in mitochondria adjacent to cell regions in which both MCh and kainate activated Ca2+ responses. MCh evoked changes in [Ca2+]i in a larger proportion of mitochondria compared with kainate. A substantial proportion of mitochondria displayed [Ca2+]i elevations to one agonist but not the other. An [Ca2+]i decrease in response to MCh was also measured in more mitochondria than for kainate, and few mitochondria showed a Ca2+ decrease in response to both agonists.
We also studied the responsiveness of the same mitochondria to treatment with MCh or kainate and found that the same mitochondrion often responded differently to the two agents. For example, the mitochondrion hyperpolarized by MCh in Fig. 2B is the same one shown being depolarized by kainate in Fig. 2G. Mitochondria hyperpolarized by MCh were hyperpolarized or depolarized by kainate treatment in a similar proportion of cases (Fig. 3A). Similarly, mitochondria depolarized by MCh were also found to be either depolarized or hyperpolarized by kainate treatment, with very comparable frequencies. Mitochondria which responded to kainate with hyperpolarization, or with depolarization, were in either case hyperpolarized by MCh more frequently than they were depolarized (Fig. 3A). Thus, the direction of the membrane potential change evoked by one agonist on a mitochondrion was not closely coupled to the response of that mitochondrion to the other stimulus.
Changes in [Ca2+]m during agonist-evoked calcium responses
To further examine the relationship between cytosolic Ca2+ responses and mitochondrial responses, we measured Ca2+ changes simultaneously in the mitochondrial matrix and the surrounding cytoplasm. We incubated O-2A cells with rhod-2 AM, then returned them to culture medium for 24 h to allow removal of cytosolic but not intramitochondrial rhod-2 AM (Hajnóczky et al. 1995). Cells were then incubated with fluo-3 AM at room temperature. Rhod-2 AM was used to track changes in Ca2+ within individual mitochondria, and changes in rhod-2 AM fluorescence were compared with fluo-3 AM changes within 0.8 μm-wide cytosolic regions juxtaposed to the mitochondrial boundaries. As shown in the example traces in Fig. 4A-C, MCh (100 μM) typically evoked a rapid-onset peak elevation of cytosolic Ca2+ in O-2A processes, which rapidly declined either to basal levels or to a modest plateau elevation (thick lines). In some cases, mitochondria exhibited no change in Ca2+ during the course of the experiment, despite a significant increase in Ca2+ within the neighbouring cytosol (Fig. 4A, thin line). This finding illustrates the good signal separation in our microscope set-up, such that there is no ‘bleed through’ of fluo-3 AM signal into the rhod-2 AM fluorescence band, and vice versa. Such results also indicate a lack of fidelity in coupling between cytosolic and mitochondrial Ca2+ changes, as observed in other cellular systems (Hajnóczky et al. 1995; Jou, Peng & Sheu, 1996). In a significant proportion of experiments, however, MCh-evoked elevation of local cytosolic Ca2+ resulted in an elevation of Ca2+ within mitochondria (Fig. 4B). The mitochondrial Ca2+ rise was typically almost simultaneous in onset with the cytosolic response, but had a very different time course. In the representative example shown in Fig. 4B, the cytosolic response was rapidly rising and transient, whereas the mitochondrial change was much more slowly rising, reaching its peak ∼15 s after the corresponding cytosolic Ca2+ peak, and was maintained for a considerable period of time after the removal of the agonist.
Figure 4. Effects of agonists on cytosolic and mitochondrial [Ca2+].

Fluo-3 AM responses were plotted as ΔF/F (thick lines), and rhod-2 AM changes as arbitrary fluorescence units (a.u., thin lines) on an 8-bit scale. Data were obtained from 8 experiments with each agonist. Agonist application is indicated by open bars in A-C and E-G. A, MCh (100 μM) evoked a transient peak and modest plateau elevation in this cytosolic region of an O-2A process. No corresponding change in Ca2+ was observed within the rhod-2 AM-loaded mitochondrion found in that region. B, MCh evoked a transient elevation of fluo-3 AM fluorescence in this cytosolic region. The juxtaposed mitochondrion responded with a Ca2+ rise. C, in this instance, MCh evoked a peak cytosolic Ca2+ rise followed by a slowly declining plateau phase. Ca2+ within the mitochondrion began to rise shortly after the rise in the cytosol, but then rapidly decreased to below basal levels. D, cumulative histogram of the data: ▪, percentage of total cell regions juxtaposed to mitochondria which displayed an elevation of Ca2+ (56 out of 83 regions, in 8 experiments); , percentage of mitochondria next to regions of cytosol with elevated Ca2+ which also displayed a Ca2+ elevation (such as in B; 29 of 56 mitochondria); □, percentage of mitochondria next to regions of cytosol with elevated Ca2+ which displayed a decrease in Ca2+ below basal levels (as in C; 8 of 56 mitochondria). E-G, kainate (200 μM) evoked a slowly rising, sustained elevation of cytosolic Ca2+ in many process regions. In the corresponding mitochondria, no corresponding change in Ca2+ was found (E), a slow, persisting Ca2+ elevation was evoked (F), or rhod-2 AM fluorescence decreased to below basal levels (G). H, cumulative histogram of the data: ▪, percentage of total cell regions juxtaposed to mitochondria which displayed an elevation of Ca2+ (52 out of 82 regions, in 8 experiments); , percentage of mitochondria next to regions of cytosol with elevated Ca2+ which also displayed a Ca2+ elevation (such as in B; 11 of 52 mitochondria); □, percentage of mitochondria next to regions of cytosol with elevated Ca2+ which displayed a decrease in Ca2+ below basal levels (as in G; 5 out of 52 mitochondria).
Ca2+ elevations in the cytosol in some cases caused release of Ca2+ from mitochondria, since a high Ca2+ load of the mitochondrial matrix can activate either the permeability transition pore (Ichas, Jouaville, Mazat & Holmuhamedov, 1994; Bernardi & Petronilli, 1996; Ichas, Jouaville & Mazat, 1997) or the Na+-Ca2+ exchanger (Gunter et al. 1994). In a proportion of mitochondria in O-2A cells, rhod-2 AM fluorescence rapidly decreased to a very low level, which was maintained after the removal of the stimulus (Fig. 4C). In the mitochondrion in Fig. 4C, there is a small initial rise in mitochondrial Ca2+ following the nearby cytosolic response, and it is possible that this rise in matrix Ca2+ triggered the large release of mitochondrial Ca2+ (Ichas et al. 1994, 1997; Bernardi & Petronilli, 1996). This may also explain the sustained plateau in cytosolic Ca2+ measured at this location. Ca2+ release from mitochondria was, in most cases, found only with a variable delay after agonist treatment was consistently evoked. The possible role of Ca2+ release during or after agonist stimulation in shaping ionotropic or metabotropic Ca2+ responses was studied further (see Figs 5 and 6). The cumulative data from eight experiments using MCh are presented in Fig. 4D. While almost all O-2A cells respond to MCh (see above), the cytosolic response permeates through most but not all of the cellular process network (▪). The hatched bar () corresponds to the percentage of mitochondria next to regions of cytosol with elevated Ca2+ which also displayed a Ca2+ elevation (as in Fig. 4B). The open bar (□) corresponds to the percentage of mitochondria next to regions of cytosol with elevated Ca2+ which displayed a decrease in Ca2+ below basal levels (as in Fig. 4C). Overall, it can be seen that MCh evoked a change in Ca2+ within most but not all mitochondria in O-2A cell regions invaded by the wave, and this change was typically a long-lasting slow elevation of Ca2+. In a small number of mitochondria, however, Ca2+ release occurred as the cytosolic Ca2+ wave passed by.
Figure 5. Effects of cyclosporin A and CGP-37157 on kainate responses.

Example traces from individual fura-2 AM-loaded cells. Cells were stimulated with 200 μM kainate for 90 s (open bars), then left to recover. Incubation with CysA or CGP-37157 was as indicated by filled bars. A, successive stimulations with kainate evoked slowly rising elevations of [Ca2+]i in an O-2A cell, which declined slowly after removal of the agonist. Pretreatment for 60 s with 5 μM CysA did not significantly alter the kainate-evoked response. B, successive stimulations with kainate evoked an elevation of [Ca2+]i which declined slowly after removal of the agonist. Pretreatment with 25 μM CGP-37157 for 60 s markedly reduced the amplitude of the response. C, experimental design is as shown in B. A proportion of O-2A cells was found in which CGP-37157 pretreatment did not significantly diminish the amplitude of the kainate-evoked [Ca2+]i response. In these cells, a second effect of this agent can be seen, as the rate of decline of the response after removal of agonist was markedly accelerated. D, CGP-37157 was applied in this experiment for 90 s immediately after removal of kainate. The rate of return to basal levels was increased by CGP-37157 treatment compared with that found in the control responses. E, kainate evoked large elevations of [Ca2+]i in oligodendrocytes as well as in O-2A cells. CGP-37157 was found to increase the rate of return of kainate-evoked [Ca2+]i responses to basal levels in many cells. CGP-37157 was also found to decrease kainate response amplitude in a proportion of oligodendrocytes (see Fig. 6).
Figure 6. Effects of cyclosporin A and CGP-37157 on agonist responses.
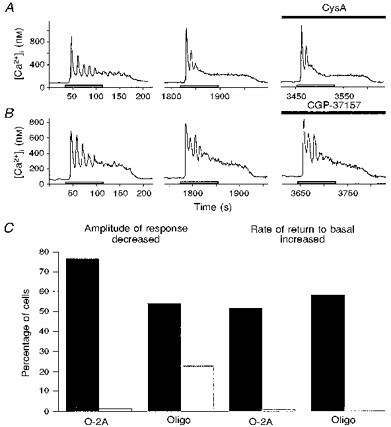
Example traces from individual fura-2 AM-loaded cells. Cells were stimulated with MCh (300 μM) for 90 s (open bars), then left to recover. Incubation with CysA or CGP-37157 was as indicated by filled bars. A, stimulation with MCh evoked a rapidly rising elevation of [Ca2+]i followed by oscillations on top of a sustained plateau. The response steadily returned to basal levels after removal of agonist. Pretreatment with 5 μM CysA for 60 s did not significantly alter either the amplitude or time course of the [Ca2+]i response. B, effect of CGP-37157 on the MCh-evoked Ca2+ response. MCh in another O-2A cell evoked a series of oscillations and a stable plateau phase which declined to basal levels with a lag time after removal of the agonist. Application of 25 μM CGP-37157 for 60 s did not alter either the amplitude or the rate of return of the response to basal levels. C, cumulative histogram showing the effect of CGP-37157 on kainate- and MCh-induced Ca2+ responses in O-2A cells and oligodendrocytes (Oligo): ▪, effect on kainate (200 μM) responses; □, effect on MCh (100-300 μM) responses. Pretreatment with CGP-37157 (25 μM, 60-120 s) caused a decrease in kainate response amplitude in a high percentage of O-2A cells and oligodendrocytes. MCh responses were inhibited in a much smaller percentage of oligodendrocytes and in virtually no O-2A cells. CGP-37157 before or after kainate increased the rate of return of the Ca2+ responses to basal levels in a significant percentage of O-2A and oligodendroglial cells, whereas the MCh-evoked responses were unaffected. n = 26-46 cells for oligodendrocyte experiments, n = 81-122 cells for O-2A experiments.
In a parallel series of experiments, we examined the effects of the ionotropic glutamate receptor agonist kainate on cytosolic and mitochondrial Ca2+ levels. More than 95% of O-2A cells responded to kainate (200 μM), typically with a relatively slowly rising, sustained elevation of cytosolic Ca2+ (Fig. 4E-G, thick lines). A similar response profile of O-2A cells to kainate has been observed previously by us and others (e.g. Holtzclaw et al. 1995; Pende et al. 1997). The slow and irregular responses precluded the use of the analysis paradigms we had developed to analyse MCh-evoked waves. The consequences of kainate-evoked cytosolic Ca2+ changes for [Ca2+]m, however, were analysed. Similar to the responses to MCh, kainate-induced changes in [Ca2+]m were highly variable. In many cases, even a large cytosolic Ca2+ response had no significant effect on [Ca2+]m in nearby mitochondria (Fig. 4E). In other mitochondria, however, Ca2+ began to rise approximately simultaneously with the onset of the Ca2+ response in the neighbouring cytoplasm. The mitochondrial response was very slow rising and prolonged, declining only slowly after the duration of the cytosolic response (Fig. 4F). In another group of mitochondria, the cytosolic Ca2+ rise caused by kainate did not cause any change in the juxtaposed mitochondrion initially, but after a delay caused a rapid decline in [Ca2+]m which did not recover after the removal of the stimulus (Fig. 4G). Results from eight such experiments are shown in Fig. 4H as a histogram. Almost all O-2A cells responded to kainate, and this response permeated through most but not all of the process network (▪). The hatched bar () corresponds to the percentage of mitochondria next to regions of cytosol with elevated Ca2+ which also displayed a concomitant change in [Ca2+]m (such as in Fig. 4F). Only a small proportion of mitochondria responded during a kainate-induced cytosolic Ca2+ change, and this population was smaller than the fraction of mitochondria which responded to MCh challenge (see Fig. 3B). The open bar (□) in Fig. 4H corresponds to the percentage of mitochondria next to regions of cytosol with elevated Ca2+ which displayed a decrease in Ca2+ below basal levels (as in Fig. 4G), and this number was comparable to the fraction of mitochondria that showed a decline in Ca2+ in response to MCh.
In a proportion of the cytosolic regions adjacent to mitochondria, both MCh and kainate were found to cause cytosolic Ca2+ elevations. It was therefore possible to compare the effects of MCh and kainate directly on the same mitochondria. Of the mitochondria juxtaposed to these regions, some were found to display a Ca2+ elevation in response to MCh only, a smaller proportion responded to kainate only, and some responded with a Ca2+ elevation to both agonists (Fig. 3B). Similarly, some mitochondria displayed a Ca2+ decrease in response to MCh only, while a smaller number displayed a decrease in response to kainate only or to both agonists (Fig. 3B). A substantial proportion of mitochondria were affected by only one of the two agonists, and more were affected by MCh than by kainate. This finding, alongside the results shown in Fig. 3A, may be supportive of the idea that mitochondrial responses are governed by their location in the cell, close to either plasmalemmal influx sites or ER release sites (Rizzuto et al. 1993; Lawrie et al. 1996).
Effects of inhibition of mitochondrial membrane transporters
In recent years, a number of pharmacological agents have been found to possess relatively potent and selective effects on mitochondrial channels and exchangers. These include cyclosporin A (CysA), an immunosuppressant agent which inhibits opening of the mitochondrial permeability transition pore (Brockemeier, Dempsey & Pfeiffer, 1989; Nieminen, Petrie, Lemasters & Selman, 1996). Another agent, CGP-37157, has been found to act as a selective inhibitor of the mitochondrial Na+-Ca2+ exchanger (Cox, Conforti, Sperelakis & Matlib, 1993; White & Reynolds 1996), which is the other major mechanism by which Ca2+ release from mitochondria can occur (reviewed in Gunter et al. 1994; Simpson & Russell, 1998). We utilized these two agents to investigate the possible importance of Ca2+ release from mitochondria in the cytosolic [Ca2+]i responses activated by kainate and MCh in O-2A cells.
Successive challenges with kainate (200 μM; open bars) evoked very similar responses at 20-30 min intervals (Fig. 5). A modest potentiation of responses was found after the first challenge in some experiments, but response amplitudes to subsequent challenges remained unchanged. After two consecutive control kainate responses, cells were incubated with 5 μM CysA for 30-60 s, and then challenged with kainate again in the continuing presence of CysA. CysA did not significantly alter the amplitude of the kainate response, which was 123.6 ± 3.3% of the initial control response (n = 103 cells; Fig. 5A). This compares closely with the second control response amplitude, which was 121.8 ± 2.4% of the initial control response. The time course of the response to kainate was also unaffected by CysA (Fig. 5A). Responses to MCh (100-300 μM) in fura-2 AM-loaded O-2A cells also showed a modest potentiation after the first challenge, and the subsequent responses at 20-30 min intervals were similar in amplitude to the second control challenge (see Fig. 6). Exposure to CysA (5 μM, 30-60 s) did not significantly alter the amplitude of MCh responses in O-2A cells, the peak amplitude being 141.0 ± 4.2% of the initial response (n = 67 cells; Fig. 6A). The second control response was 131.8 ± 2.8% of the initial peak. CysA also did not alter the time course of MCh-evoked responses (Fig. 6A).
In contrast, in a large percentage of O-2A cells, treatment with CGP-37157 (25 μM) for 60-120 s significantly decreased the amplitude of kainate responses (Figs 5B and 6C). The response, after CGP-37157 pretreatment for 60-120 s, was only 51.9 ± 2.9% of the initial response amplitude (n = 86 cells; Fig. 5B). The second control peak was 104.4 ± 3.0% of the initial peak response. In some cells, CGP-37157 was without effect on amplitude and in these cells the rate of return to basal Ca2+ levels was seen to be markedly accelerated (1.5- to 3-fold over control; Figs 5C and 6C). To try to dissociate these two effects of CGP-37157, another set of experiments was performed in which CGP-37157 was administered for 90 s immediately after removal of the kainate stimulus. In these experiments also, the return to basal [Ca2+]i was markedly accelerated (Figs 5D and 6C). These results are consistent with the interpretation that the persistent phase of the kainate-evoked Ca2+ response after removal of the agonist may be due to the slow release of Ca2+, accumulated into mitochondria during kainate-induced depolarization of the cell. This release appears to occur via the Na+-Ca2+ exchanger on the inner mitochondrial membrane rather than via the permeability transition pore.
The effect of CGP-37157 treatment on MCh-evoked responses was studied using an identical experimental protocol. MCh-evoked Ca2+ responses were unaffected by CGP-37157 treatment in O-2A cells (Fig. 6B and C). Neither the response amplitude nor the rate of return to basal Ca2+ levels was altered. The response amplitude in the presence of CGP-37157 (25 μM) was 134.0 ± 6.9% of the initial response (n = 88 cells; Fig. 6B). The rate of return was unaffected by CGP-37157 when added before (n = 85 cells, Fig. 6B) or immediately after MCh (n = 52 cells, not shown). The second control MCh response compared with the first was 125.7 ± 6.3% in peak amplitude. Thus, release of Ca2+ from mitochondria may not play a major role in shaping the MCh-evoked Ca2+ response.
In oligodendrocytes, the daughter cells of O-2As, CGP-37157 pretreatment had a similar effect on kainate- and MCh-induced Ca2+ responses. CGP-37157 predominantly decreased kainate but not MCh response amplitude in most oligodendrocytes (Fig. 6C), and CGP-37157 treatment before or after kainate accelerated the return to basal levels after removal of agonist. This effect was also not observed with MCh-evoked Ca2+ responses (Figs 5E and 6C).
DISCUSSION
The results of this study show that stimulation of ER Ca2+ release or Ca2+ entry via plasma membrane ion channels in O-2A cells evokes changes in both mitochondrial [Ca2+] and membrane potential, and that Ca2+ uptake into and release from mitochondria appear to be involved in shaping cytosolic Ca2+ signals. MCh activated Ca2+ release, resulting in Ca2+ waves in O-2A cells, which travelled along O-2A processes from several wave initiation sites via wave amplification sites at which the peak Ca2+ amplitude and the rate of Ca2+ rise were markedly elevated. Stimulation of ionotropic glutamatergic receptors with kainate resulted in Ca2+ entry that produced a global increase in intracellular Ca2+. Both MCh- and kainate-evoked cellular Ca2+ signals resulted in changes in the membrane potential of some mitochondria within O-2A processes and changes in intramitochondrial Ca2+ concentration. Inhibition of the mitochondrial Na+-Ca2+ exchanger decreased kainate [Ca2+]i response amplitude and increased the rate of return of the response to basal [Ca2+]i levels. Thus, both ionotropic and metabotropic stimulation can evoke changes in mitochondrial activity in O-2A cells.
Ca2+ responses have many consequences for O-2A cell activity and development, since it is believed that neurotransmitters play a crucial role in their proliferation and differentiation into oligodendrocytes. Signals evoked via glutamatergic and muscarinic receptors may be particularly important in the regulation of O-2A proliferation and differentiation (Gallo, Zhou, McBain, Wright, Knutson & Armstrong, 1996; Cohen et al. 1996; Pende et al. 1997). Cytosolic Ca2+ elevations evoked by both ionotropic glutamate and metabotropic muscarinic receptor activation result in Ca2+-dependent stimulation of immediate early gene expression (Pende et al. 1994; Cohen et al. 1996) and CREB phosphorylation (Pende et al. 1997) in these glial cells. Ca2+ signals may also have a role in the regulation of O-2A adhesion molecule expression (Wang et al. 1996), and muscarinic receptors have been reported to stimulate O-2A cell proliferation in a Ca2+-dependent manner (Cohen et al. 1996). Subcellular Ca2+ gradients may support the migration of glial progenitors from the subventricular zone to their multiple destinations (Marks & Maxfield, 1990a,b; Wang et al. 1996), where they differentiate into oligodendrocytes and myelinate neuronal axons (Miller, 1996). O-2A migration may be important throughout development, as a subpopulation of glia remain in the progenitor stage through adulthood (Wolswijk & Noble, 1992). In an animal model of multiple sclerosis, O-2A migration and differentiation into oligodendrocytes results in extensive remyelination of lesion sites and an almost complete recovery of motor function (Armstrong, Friedrich, Holmes & Dubois-Dalcq, 1990). Knowledge concerning the subcellular mechanisms which enable O-2A cells to migrate in neonatal or adult brain is currently limited, but this activity appears to be dependent on cytoskeletal and cell surface events activated by both Ca2+ entry and Ca2+ release from stores (Wang et al. 1996; P. B. Simpson & R. C. Armstrong, unpublished observations). The results of the present study indicate that O-2A Ca2+ signals are under local control by interactions between the cytosolic and mitochondrial compartments of the cell. Local regulation of Ca2+ signals, perhaps by mitochondrial Ca2+ uptake modulating ER Ca2+ release characteristics (Simpson & Russell, 1996; Simpson et al. 1997; Kupferman, Mitra, Hohenberg & Wang, 1997), may enable persisting subcellular Ca2+ gradients along the length of the cell.
Mitochondrial Ca2+ release appears to play a key role in shaping the amplitude and time course of kainate-evoked Ca2+ responses in these cells. Kainate-evoked cytosolic Ca2+ responses cause both Ca2+ uptake and Ca2+ release and changes in membrane potential in a small population of O-2A cell mitochondria. After removal of the agonist, the accumulated Ca2+ was apparently released into the cytosol via the Na+-Ca2+ exchanger, thus contributing to the total agonist-evoked cytosolic Ca2+ signal.
In neurones, large Ca2+ loads evoked by stimulation of NMDA receptors similarly result in Ca2+ buffering by mitochondria (White & Reynolds, 1996; Nieminen et al. 1996). Upon sustained large mitochondrial Ca2+ loads, the permeability transition pore opens, leading to release of Ca2+ and other mitochondrial components and subsequently to delayed-onset neurotoxicity (Nieminen et al. 1996; White & Reynolds, 1996). Such permeability transition-dependent release does not appear to occur to a significant extent in glial cells in the present study, as CysA had no effect on kainate- (or MCh-)evoked responses. The inhibitor of Na+- Ca2+ exchange across the mitochondrial inner membrane, CGP-37157, on the other hand, altered the rate of return of kainate-evoked cytosolic responses to basal levels. CGP-37157 also significantly decreased the amplitude of kainate-evoked [Ca2+]i elevations. This appears unlikely to be due to a non-specific effect on cell viability or responsiveness, as muscarinic responses were unaffected by pretreatment with this agent. Ca2+ transport by the Na+-Ca2+ exchanger is also important in the release of mitochondrial Ca2+ back into the cytosol after the termination of ionotropic stimulation in neurones (White & Reynolds, 1996). Thus, it appears that mitochondria decrease ionotropic response amplitude and extend response time, subtly altering the effects of the agonist in both glia and neurones.
The fact that mitochondria are stationary in O-2A cells suggests that they may be anchored at cellular sites via specific mechanisms (Leterrier, Rusakov, Nelson & Linden, 1994; Lawrie et al. 1996). In this way, a subpopulation of mitochondria may be specifically localized close to Ca2+ influx sites across the plasma membrane or Ca2+ release sites from ER (see Lawrie et al. 1996). Thus, mitochondria positioned near the mouth of AMPA/kainate receptor channels in the plasma membrane may be more responsive to kainate than to MCh, and mitochondria located near the mouth of inositol trisphosphate receptors may respond to MCh but not kainate. Ca2+ release from mitochondria near the mouth of the AMPA/kainate channel may regulate the activity and, thus, entry characteristics of the channel. The Ca2+ sensitivities of inositol trisphosphate receptors and AMPA/kainate channels differ, and the spatial proximity of these ion channels to mitochondria may also be significantly different. These differences may at least partially explain the differences in the contribution of mitochondrial Ca2+ release for the two responses. The methods used in this study lack the requisite resolution to differentiate unitary Ca2+ events arising from the plasmalemma or ER channels. An alternative interpretation of our findings is that the large, prolonged cytosolic Ca2+ elevation evoked by kainate could simply cause larger (or longer) elevations of Ca2+ levels within mitochondria than are activated by the transient peak and modest plateau cytosolic responses evoked by MCh.
Some previous studies have compared the overall time course of cytosolic and mitochondrial Ca2+ changes, and found that mitochondrial changes were generally slower and longer-lasting than cytosolic responses (Hajnóczky et al. 1995; Jou et al. 1996). Our results are in broad agreement with these findings. It is also clear that significant variations exist in resting activity and membrane potential in mitochondria even within a single cell (see Reers et al. 1995; Kirischuk et al. 1995). The present study is the first to show heterogeneity in responses within individual mitochondria to any stimulus. Mitochondrial Ca2+ uptake occurs at the expense of mitochondrial H+ entry (Gunter et al. 1994). A rise in intramitochondrial Ca2+ could stimulate oxidative phosphorylation (Mildaziene et al. 1996) and, thus, increase the electrochemical gradient by increasing electron transport. Alternatively, Ca2+ entry could directly dissipate the electrical component of the gradient, or activate the ATP synthase which utilizes the energy stored within the gradient (Gunter et al. 1994). The biphasic effects on mitochondrial membrane potential evoked by cytosolic Ca2+ load in the present study may, thus, result from the balance between these two counteracting consequences of mitochondrial Ca2+ uptake which might differ between individual mitochondria. While measuring overall mitochondrial fluorescence changes within cells (e.g. Jou et al. 1996; White & Reynolds, 1996) has greatly advanced our knowledge of cytosolic-mitochondrial interactions, it is clear that the ability to measure fluorescence changes within individual mitochondria makes O-2A cells an important model system for studying the interaction of individual mitochondria with other cellular Ca2+ compartments.
The results of this study indicate that mitochondrial Ca2+ uptake occurs during MCh stimulation of O-2A cells, which may modulate the kinetics of Ca2+ release via inositol trisphosphate receptors evoked by MCh. Also, mitochondrial Ca2+ release may directly contribute to the time course of the kainate-evoked Ca2+ signals. Thus, mitochondrial Ca2+ regulation significantly influences cytosolic Ca2+ signals due to both ionotropic and metabotropic stimulation in O-2A progenitors. The differential manner in which these interactions occur may permit discrete mitochondrial roles in separate signalling pathways in these cells. Regulation of neurotransmitter-induced Ca2+ response characteristics in a locally specific manner results in intracellular Ca2+ gradients which may be important in the migration and functional activity of these glial progenitors during development and remyelination.
Acknowledgments
We thank Lynne Holtzclaw and Xiaoqing Yuan for excellent technical and cell culture assistance where necessary during this project. We thank Novartis for the gift of CGP-37157.
References
- Armstrong R, Friedrich V L, Jr, Holmes K V, Dubois-Dalcq M. In vitro analysis of the oligodendrocyte lineage in mice during demyelination and remyelination. Journal of Cell Biology. 1990;111:1183–1195. doi: 10.1083/jcb.111.3.1183. 10.1083/jcb.111.3.1183. [DOI] [PMC free article] [PubMed] [Google Scholar]
- Armstrong R C, Harvath L, Dubois-Dalcq M E. Type 1 astrocytes and oligodendrocyte-type 2 astrocyte glial progenitors migrate toward distinct molecules. Journal of Neuroscience Research. 1990;27:400–407. doi: 10.1002/jnr.490270319. [DOI] [PubMed] [Google Scholar]
- Bernardi P, Petronilli V. The permeability transition pore as a mitochondrial calcium-release channel - a critical appraisal. Journal of Bioenergetics and Biomembranes. 1996;28:131–138. doi: 10.1007/BF02110643. [DOI] [PubMed] [Google Scholar]
- Bindokas V P, Miller R J. Excitotoxic degeneration is initiated at nonrandom sites in cultured rat cerebellar neurons. Journal of Neuroscience. 1995;15:6999–7011. doi: 10.1523/JNEUROSCI.15-11-06999.1995. [DOI] [PMC free article] [PubMed] [Google Scholar]
- Brockemeier K M, Dempsey M E, Pfeiffer D R. Cyclosporin A is a potent inhibitor of the inner membrane permeability transition in liver mitochondria. Journal of Biological Chemistry. 1989;264:7826–7830. [PubMed] [Google Scholar]
- Cohen R I, Molinaholgado E, Almazan G. Carbachol stimulates c-fos expression and proliferation in oligodendrocyte progenitors. Molecular Brain Research. 1996;43:193–201. doi: 10.1016/s0169-328x(96)00176-3. [DOI] [PubMed] [Google Scholar]
- Cox D A, Conforti L, Sperelakis N, Matlib M A. Selectivity of inhibition of Na+-Ca2+ exchange of heart mitochondria by benzothiazipine CGP-37157. Journal of Cardiovascular Pharmacology. 1993;21:595–599. doi: 10.1097/00005344-199304000-00013. [DOI] [PubMed] [Google Scholar]
- Di Lisa F, Blank P S, Colonna R, Gambassi G, Silverman H S, Stern M D, Hansford R G. Mitochondrial membrane potential in single living adult rat cardiac myocytes exposed to anoxia or metabolic inhibition. Journal of Physiology. 1995;486:1–13. doi: 10.1113/jphysiol.1995.sp020786. [DOI] [PMC free article] [PubMed] [Google Scholar]
- Gallo V, Zhou J M, McBain C, Wright P, Knutson P L, Armstrong R C. Oligodendrocyte progenitor cell proliferation and lineage progression are regulated by glutamate receptor-mediated K+ channel block. Journal of Neuroscience. 1996;16:2659–2670. doi: 10.1523/JNEUROSCI.16-08-02659.1996. [DOI] [PMC free article] [PubMed] [Google Scholar]
- Gunter T E, Gunter K K, Sheu S S, Gavin C E. Mitochondrial calcium transport: physiological and pathological relevance. American Journal of Physiology. 1994;267:C313–339. doi: 10.1152/ajpcell.1994.267.2.C313. [DOI] [PubMed] [Google Scholar]
- Hajnóczky G, Robb-Gaspers L D, Seitz M B, Thomas A P. Decoding of cytosolic calcium oscillations in the mitochondria. Cell. 1995;82:415–424. doi: 10.1016/0092-8674(95)90430-1. [DOI] [PubMed] [Google Scholar]
- Holtzclaw L A, Gallo V, Russell J T. AMPA receptors shape Ca2+ responses in cortical oligodendrocyte progenitors and CG-4 cells. Journal of Neuroscience Research. 1995;42:124–130. doi: 10.1002/jnr.490420114. [DOI] [PubMed] [Google Scholar]
- Ichas F, Jouaville L S, Mazat J-P. Mitochondria are excitable organelles capable of generating and conveying electrical and calcium signals. Cell. 1997;89:1145–1153. doi: 10.1016/s0092-8674(00)80301-3. [DOI] [PubMed] [Google Scholar]
- Ichas F, Jouaville L S, Mazat J P, Holmuhamedov E L. Mitochondrial calcium spiking: a transduction mechanism based on calcium-induced permeability transition involved in cell calcium signalling. FEBS Letters. 1994;348:211–215. doi: 10.1016/0014-5793(94)00615-6. 10.1016/0014-5793(94)00615-6. [DOI] [PubMed] [Google Scholar]
- Jouaville L S, Ichas F, Holmuhamedov E L, Camacho P, Lechleiter J D. Synchronization of calcium waves by mitochondrial substrates in Xenopus laevis oocytes. Nature. 1995;377:438–441. doi: 10.1038/377438a0. 10.1038/377438a0. [DOI] [PubMed] [Google Scholar]
- Jou M-J, Peng T-I, Sheu S-S. Histamine induces oscillations of mitochondrial free Ca2+ concentration in single cultured rat brain astrocytes. Journal of Physiology. 1996;497:299–308. doi: 10.1113/jphysiol.1996.sp021769. [DOI] [PMC free article] [PubMed] [Google Scholar]
- Kirischuk S, Neuhaus J, Verkratsky A, Kettenmann H. Preferential localization of active mitochondria in process tips of immature retinal oligodendrocytes. NeuroReport. 1995;6:737–741. doi: 10.1097/00001756-199503270-00008. [DOI] [PubMed] [Google Scholar]
- Kupferman R, Mitra P P, Hohenberg P C, Wang SS-H. Analytical calculation of intracellular calcium wave characteristics. Biophysical Journal. 1997;72:2430–2444. doi: 10.1016/S0006-3495(97)78888-X. [DOI] [PMC free article] [PubMed] [Google Scholar]
- Lawrie A M, Rizzuto R, Pozzan T, Simpson A W M. A role for calcium influx in the regulation of mitochondrial calcium in endothelial cells. Journal of Biological Chemistry. 1996;271:10753–10759. doi: 10.1074/jbc.271.18.10753. 10.1074/jbc.271.18.10753. [DOI] [PubMed] [Google Scholar]
- Leterrier J F, Rusakov D A, Nelson B D, Linden M. Interactions between brain mitochondria and cytoskeleton: evidence for specialized outer membrane domains involved in the association of cytoskeleton-associated proteins to mitochondria in situ and in vitro. Microscopy Research and Technique. 1994;27:233–261. doi: 10.1002/jemt.1070270305. [DOI] [PubMed] [Google Scholar]
- Liu H N, Almazan G. Glutamate induces c-fos proto-oncogene expression and inhibits proliferation in oligodendrocyte progenitors: receptor characterization. European Journal of Neuroscience. 1995;7:2355–2363. doi: 10.1111/j.1460-9568.1995.tb01032.x. [DOI] [PubMed] [Google Scholar]
- Marks P W, Maxfield F R. Local and global changes in cytosolic free calcium in neutrophils during chemotaxis and phagocytosis. Cell Calcium. 1990a;11:181–190. doi: 10.1016/0143-4160(90)90069-7. 10.1016/0143-4160(90)90069-7. [DOI] [PubMed] [Google Scholar]
- Marks P W, Maxfield F R. Transient increases in cytosolic free calcium appear to be required for the migration of adherent human neutrophils. Journal of Cell Biology. 1990b;110:43–52. doi: 10.1083/jcb.110.1.43. 10.1083/jcb.110.1.43. [DOI] [PMC free article] [PubMed] [Google Scholar]
- Mildaziene V, Baniene R, Nauciene Z, Marcinkeviute A, Morkuniene R, Borutaite V, Kholodenko B, Brown G C. Ca2+ stimulates both the respiratory and phosphorylation subsystems in rat heart mitochondria. Biochemical Journal. 1996;320:329–334. doi: 10.1042/bj3200329. [DOI] [PMC free article] [PubMed] [Google Scholar]
- Miller R H. Oligodendrocyte origins. Trends in Neurosciences. 1996;19:92–96. doi: 10.1016/s0166-2236(96)80036-1. 10.1016/S0166-2236(96)80036-1. [DOI] [PubMed] [Google Scholar]
- Nieminen A-L, Petrie T G, Lemasters J J, Selman W R. Cyclosporin A delays mitochondrial depolarization induced by N-methyl-D-aspartate in cortical neurons: evidence of the mitochondrial permeability transition. Neuroscience. 1996;75:993–997. doi: 10.1016/0306-4522(96)00378-8. 10.1016/0306-4522(96)00378-8. [DOI] [PubMed] [Google Scholar]
- Pende M, Fisher T L, Simpson P B, Russell J T, Blenis J, Gallo V. Neurotransmitter- and growth factor-induced cAMP response element binding protein phosphorylation in glial cell progenitors: role of calcium ions, protein kinase C and mitogen-activated protein kinase/ribosomal S6 kinase pathway. Journal of Neuroscience. 1997;17:1291–1301. doi: 10.1523/JNEUROSCI.17-04-01291.1997. [DOI] [PMC free article] [PubMed] [Google Scholar]
- Pende M, Holtzclaw L A, Curtis J L, Russell J T, Gallo V. Glutamate regulates intracellular calcium and gene expression in oligodendrocyte progenitors through the activation of dl-alpha-amino-3-hydroxy-5-methyl-4-isoxazolepropionic acid receptors. Proceedings of the National Academy of Sciences of the USA. 1994;91:3215–3219. doi: 10.1073/pnas.91.8.3215. [DOI] [PMC free article] [PubMed] [Google Scholar]
- Reers M, Smiley S T, Mottola-Hartshorn C, Chen A, Lin M, Chen L B. Mitochondrial membrane potential monitored by JC-1 dye. Methods in Enzymology. 1995;260:406–417. doi: 10.1016/0076-6879(95)60154-6. [DOI] [PubMed] [Google Scholar]
- Reers M, Smith T W, Chen L B. J-aggregate formation of a carbocyanine as a quantitative fluorescent indicator of membrane potential. Biochemistry. 1991;30:4480–4486. doi: 10.1021/bi00232a015. [DOI] [PubMed] [Google Scholar]
- Rizzuto R, Brini M, Murgia M, Pozzan T. Microdomains with high Ca2+ close to IP3-sensitive channels that are sensed by neighboring mitochondria. Science. 1993;262:744–747. doi: 10.1126/science.8235595. [DOI] [PubMed] [Google Scholar]
- Simpson P B, Challiss R A J, Nahorski S R. Neuronal Ca2+ stores: activation and function. Trends in Neurosciences. 1995;18:299–306. doi: 10.1016/0166-2236(95)93919-o. 10.1016/0166-2236(95)93919-O. [DOI] [PubMed] [Google Scholar]
- Simpson P B, Mehotra S, Lange G D, Russell J T. High density distribution of endoplasmic reticulum proteins and mitochondria at specialized Ca2+ release sites in oligodendrocyte processes. Journal of Biological Chemistry. 1997;272:22654–22661. doi: 10.1074/jbc.272.36.22654. 10.1074/jbc.272.36.22654. [DOI] [PubMed] [Google Scholar]
- Simpson P B, Russell J T. Mitochondria support inositol 1,4,5-trisphosphate-mediated Ca2+ waves in cultured oligodendrocytes. Journal of Biological Chemistry. 1996;271:33493–33501. doi: 10.1074/jbc.271.52.33493. 10.1074/jbc.271.52.33493. [DOI] [PubMed] [Google Scholar]
- Simpson P B, Russell J T. Role of sarcoplasmic-endoplasmic reticulum Ca2+ATPases in mediating Ca2+ waves and local Ca2+ release microdomains in cultured glia. Biochemical Journal. 1997;325:239–247. doi: 10.1042/bj3250239. [DOI] [PMC free article] [PubMed] [Google Scholar]
- Simpson P B, Russell J T. Role of mitochondrial Ca2+ regulation in neuronal and glial cell signalling. Brain Research Reviews. 1998 doi: 10.1016/s0165-0173(97)00056-8. in the Press. [DOI] [PubMed] [Google Scholar]
- Vignais L, NAITOumesmar B, Mellouk F, Gout O, Labourdette G, BARON Evercooren A, Gumpel M. Transplantation of oligodendrocyte precursors in the adult demyelinated spinal cord: migration and remyelination. International Journal of Developmental Neuroscience. 1993;11:603–612. doi: 10.1016/0736-5748(93)90049-j. 10.1016/0736-5748(93)90049-J. [DOI] [PubMed] [Google Scholar]
- Wang C, Pralong W-F, Schulz M-F, Rougon G, Aubry J-M, Pagliusi S, Robert A, Kiss J Z. Functional N-Methyl-d-aspartate receptors in O-2A glial precursor cells: a critical role in regulating polysialic acid-neural cell adhesion molecule expression and cell migration. Journal of Cell Biology. 1996;135:1565–1581. doi: 10.1083/jcb.135.6.1565. 10.1083/jcb.135.6.1565. [DOI] [PMC free article] [PubMed] [Google Scholar]
- White R J, Reynolds I J. Mitochondrial depolarization in glutamate-stimulated neurons - an early signal specific to excitotoxin exposure. Journal of Neuroscience. 1996;16:5688–5697. doi: 10.1523/JNEUROSCI.16-18-05688.1996. [DOI] [PMC free article] [PubMed] [Google Scholar]
- Wolswijk G, Noble M. Cooperation between PDGF and FGF converts slowly dividing O-2Aadult progenitor cells to rapidly dividing cells with the characteristics of O-2Aperinatal progenitor cells. Journal of Cell Biology. 1992;118:889–900. doi: 10.1083/jcb.118.4.889. 10.1083/jcb.118.4.889. [DOI] [PMC free article] [PubMed] [Google Scholar]
- Yagodin S V, Holtzclaw L, Sheppard C A, Russell J T. Nonlinear propagation of agonist-induced cytoplasmic calcium waves in single astrocytes. Journal of Neurobiology. 1994;25:265–280. doi: 10.1002/neu.480250307. [DOI] [PubMed] [Google Scholar]