

Abstract
Dual intracellular recording was used to examine the interactions between neighbouring spiny (excitatory) and smooth (inhibitory) neurones in layer 4 of cat visual cortex in vitro. Synaptic connections were found in seventeen excitatory-inhibitory neurone pairs, along with one inhibitory-inhibitory connection.
Fast excitatory inputs onto smooth neurones (basket cells) from spiny cells (spiny stellate or pyramidal cells) (n = 6) produce large excitatory postsynaptic potentials (EPSPs) of up to 4 mV mean amplitude, whereas basket cells evoke slower inhibitory postsynaptic potentials (IPSPs) in their postsynaptic targets (n = 17), of smaller amplitude (up to 1.6 mV at membrane potentials of -60 mV).
Both types of PSP appear to be multiquantal, and both may exhibit depression of up to 60% during short trains of presynaptic spikes. This depression can involve presynaptic and/or postsynaptic factors.
One-third (n = 5) of the spiny cell-smooth cell pairs tested were reciprocally connected, and in the one pair for which the suprathreshold interactions were comprehensively investigated, the pattern of basket cell firing was strongly influenced by the activity in the connected excitatory neurone. The basket cell was only effective in inhibiting spiny cell firing when the excitatory neurone was weakly driven.
The flow of information through the neocortex depends on the combined activity of many interconnected excitatory and inhibitory neuronal elements, as is evident at the first stage of visual processing in primary visual cortex. The ‘simple’ cells of layer 4 have receptive fields that are created by the interaction of thalamic and intracortical excitation, and intracortical inhibition, which in its most elemental form is revealed by antagonism between the spatially separate ‘on’ and ‘off’ subfields that are one of the defining features of simple cells (Hubel & Wiesel, 1962). As Palmer & Davis (1981) concluded after an extensive study of simple cell receptive field substructure, ‘It is as if the simple cells are dominated by inhibitory processes’.
Layer 4 simple cells also show direction and orientation selectivity, unlike their thalamic afferents, and inhibition has been proposed to underlie these properties (Benevento, Creutzfeldt & Kuhnt, 1972; Sillito, 1975b; Berman, Douglas, Martin & Whitteridge, 1991). While the topic is controversial, and there is evidence that both properties are a consequence of afferent thalamic action (Ferster, Chung & Wheat, 1996), intracellular studies reveal the ubiquitous presence of inhibition during natural stimulation (Benevento et al. 1972; Ferster, 1988; Berman, Douglas & Martin, 1992) and the effects on simple cell visual responses of blocking inhibitory circuitry reflect the importance of inhibition in contributing to the selective properties of receptive fields (Sillito, 1975b).
Most of the GABAergic neurones in layer 4 are basket cells. They can have either simple or complex receptive fields (Gilbert & Weisel, 1979; Martin, Somogyi & Whitteridge, 1983; Kisvárday, Martin, Whitteridge & Somogyi, 1985; Ahmed, Anderson, Martin & Nelson, 1997). Their axonal projections form dense and patchy local connections (see Kisvárday et al. 1985; Ahmed et al. 1997). Accordingly, as neighbouring cells receive common inputs, the strongest inhibition occurs concurrently with the strongest excitation at a given location, i.e. when a simple cell is stimulated with its optimal stimulus (Ferster, 1986, 1988; Berman et al. 1991).
Virtually nothing is known about the synaptic interactions between individual inhibitory neurones and their neighbours in layer 4. In the present study we sought to fill this gap by recording intracellularly in vitro from basket cells and simultaneously from their synaptic targets in layer 4 of cat visual cortex. The results indicate that basket cells are monosynaptically excited by neighbouring spiny neurones and in turn monosynaptically inhibit their neighbours, including both spiny and smooth neurones.
METHODS
Slice preparation
Recordings were made in slices of visual cortex taken from 12- to 16-week-old cats (1.0-1.6 kg). Anaesthesia was induced with pentobarbitone (Sagatal, Sigma, 60 mg kg−1, i.p. or i.m.) and maintained with Saffan (Sigma, i.v., as needed). The visual cortex was accessed by craniotomy, and a block of cortex excised after removal of the dura. Slice preparation and maintenance techniques were similar to those reported in Mason, Nicoll & Stratford (1991). Slices of 400 or 500 μm thickness were cut on a vibrating microtome (Vibroslice, Campden Instruments, Loughborough, UK) and maintained at 34-36°C in an interface-type recording chamber supplied with artificial cerebro-spinal fluid (ACSF) and warmed, humidified carbogen (95% O2-5% CO2). Slices remained in the recording chamber for at least 2 h before intracellular impalements were attempted. In some cases, slices were held in an interface ‘holding’ chamber, and transferred to the recording chamber during the experiment. The composition of the ACSF used for slice preparation and recovery was (mM): NaCl, 124; KCl, 2.3; MgSO4, 1.0; KH2PO4, 1.3; CaCl2, 2.5; NaHCO3, 26; and glucose, 10 (pH 7.4). For recording, 50 μM DL-2-amino-5-phosphopentanoic acid (AP-5; Sigma) was added to the ACSF to block N-Methyl-d-aspartate (NMDA)-mediated currents.
Intracellular recording and electrophysiological analysis
Recording electrodes were filled with 0.5 M potassium methyl sulphate with 5 mM potassium chloride and 2% biocytin (Sigma). The first electrode, positioned in the upper portion of layer 4, was advanced obliquely using a microdrive (SCAT-01, Digitimer, Welwyn Garden City, UK) until we obtained a stable impalement; we often sought an excitatory cell first. Cells were provisionally identified as excitatory or inhibitory on the basis of their firing patterns in response to depolarizing current injection, and these predictions matched the synaptic influence and/or recovered morphology of the cell whenever these became known. A second electrode was then placed on the slice surface in layer 4 just deeper than and parallel to the first (electrode entry points were 200 μm apart laterally on average, such that tips converged), and advanced until a second stable impalement was obtained. We tested whether this second cell was presynaptic to the first (with membrane depolarization when checking for inhibitory connections); if the second impalement was stable enough, we also checked whether it was postsynaptic to the first cell. If no connection was found in either direction, we abandoned the second impalement (after a total duration of only a few minutes, usually insufficient for biocytin to fill a cell), and sought another cell with the second electrode in a different location, keeping the first impalement until a connection was found or the cell was lost, after which we moved to a new area of the slice, to avoid possible ambiguity in matching physiology to labelled neurones. Positions of the pipette penetrations in the slice were plotted precisely with the aid of an eyepiece micrometer and the angle and depth of penetration were noted before moving to a new site.
It is not a straightforward matter to quantify connectivity on the basis of in vitro dual impalements. Slice viability is one factor that may greatly affect the apparent prevalence of connections. Considering in detail a subset of the layer 4 experiments that yielded the results presented here, as well as numerous spiny cell-spiny cell connections reported elsewhere (Stratford, Tarczy-Hornoch, Martin, Bannister & Jack, 1996), the ratio of connected pairs to pairs formally tested, pooling data from different experiments, was 9%; for individual experiments, however, this figure varied from 3 to 28%. Since some portions of axon are eliminated in slices, true connectivity is likely to be higher. On the other hand, these figures could be overestimates of the average connectivity, because of the selection inherent in the process of establishing a second impalement: an advancing electrode evokes injury discharge in the cells it encounters, effectively a quick informal test of their presynaptic connectivity.
All synaptic responses were filtered at 2 kHz and recorded with 5 kHz digitization using a CED 1401 interface (Cambridge Electronic Design, Cambridge, UK) and SIGAVG software (Cambridge Electronic Design). The duration of simultaneous stable impalement of two cells varied from several minutes to 4 h. Thus in the shortest recordings we were only able to record 100 trials of a given PSP at a single membrane potential, enough to measure amplitude and variance, and half-width from the averaged waveform; otherwise we went on to explore as many attributes of the response as possible, such as voltage dependence and temporal dynamics, before one of the cells was lost. Time permitting, we also recorded voltage responses to small 0.5 ms current pulses and 100 ms current steps, and firing responses to 900 ms current injections, to determine input resistances, current-voltage relations and suprathreshold properties of presynaptic and postsynaptic cells. For analysis of synaptic responses, we used in-house software to extract the amplitudes of individual synaptic events from raw data traces. These were measured as differences between averages taken over short windows at baseline and at signal peak, whose positions were defined relative to action potential peak. In the case of trains of PSPs at short interpulse intervals, where the measurement windows for later events fell on the decay phase of previous PSPs, a correction for this decaying baseline was made for individual trials on the basis of a template average waveform derived from the responses to repeated single action potentials. For every trace, we also measured the amplitude difference, during the baseline period, between windows of the same size and separation as used for measuring the response, to determine the variance of the background noise. Noise-corrected coefficients of variation of PSPs were calculated as: √((s.d. of PSP)2 - (s.d. of noise)2)/(mean of PSP).
Histology
Following recording from cells, slices were immediately fixed in 4% paraformaldehyde-0.5% glutaraldehyde-0.2% picric acid in 0.1 M phosphate buffer (PB), pH 7.4, and left overnight. Slices were then washed several times in PB and transferred through a graded series of sucrose solutions (10 through to 30%) before being freeze-thawed in liquid nitrogen. Each slice was then re-sectioned to a thickness of 60 or 80 μm, preceding a standard biocytin reaction technique (Mason et al. 1991). The sections were incubated in a solution of avadin-biotin complex (ABC; Vector Labs Ltd, Peterborough, UK), 2% in PB, overnight at 4°C. After several washes in PB the sections were transferred to a 0.16% solution of Hanker-Yates reagent (Sigma) in PB for 15 min. A solution of hydrogen peroxide was then added to give a final concentration of 0.004% and the reaction monitored under a dissecting microscope. When the cell had become sufficiently dark the reaction was stopped by rinsing several times with PB. The sections were then osmicated in a 1% solution of OsO4 (in PB), dehydrated through a graded series of ethanol solutions and then mounted on microscope slides in epoxy resin (Araldite or Durcupan; Fluka) with coverslips. In later experiments diaminobenzidine rather than Hanker-Yates reagent was used, and the ABC reaction was preceded by a 10 min preincubation in 3% hydrogen peroxide to decrease background staining. Cells were drawn and reconstructed using the TRAKA reconstruction system (Anderson, Douglas, Martin & Nelson, 1994).
RESULTS
Seventeen IPSPs and six EPSPs (Tables 1 and 2) were recorded in layer 4 of area 17 of cat visual cortex, from eighteen connected pairs involving at least one inhibitory neurone. One was a pair of inhibitory cells, but the others were inhibitory-excitatory pairs. Five of fifteen inhibitory-excitatory pairs tested in both directions were reciprocally connected. All the recovered inhibitory neurones had smooth beaded dendrites and were classified as layer 4 basket cells on the basis of their close resemblance to the morphology of basket cells reported in in vivo studies (see Kisvárday, 1992). The excitatory cells were spiny stellates or layer 4 pyramidal cells (including star pyramids). During the recording, neurones were provisionally classified as smooth or spiny based on suprathreshold firing characteristics (e.g. smooth cells showed 3- to 4-fold greater increments in firing frequency for a given increment of current; McCormick, Connors, Lighthall & Prince, 1985; Thomson, Deuchars & West, 1993; Hirsch, 1995). Such classification was never found to be in error and has therefore been used when morphology or synaptic evidence was lacking.
Table 1.
Properties of IPSPs
| IPSP | Amp (μV) | CV (%) | HW (ms) | Erev (mV) | Rin (MΩ) | Gt (pS s) | Source | Target | Distance (μm) |
|---|---|---|---|---|---|---|---|---|---|
| 1 | 475 | 19 | 16.8 | – | 44 | 15.1 | bc | – | 105 |
| 2 | 915 | 26 | 24.4 | –75 | 108 | 16.6 | bc | ss | 66 |
| 3 | 1596 | 17 | 27.4 | –77 | 107 | 35.4 | bc | ss | 31 |
| 4 | 1304 | 16 | 20.0 | –73 | 60 | 45.0 | bc | – | 68 |
| 5 | 655 | 20 | 19.6 | –77 | 64 | 11.5 | bc | ss | 155 |
| 6 | 296 | 24 | 15.0 | – | – | – | – | pc | 200 |
| 7 | 962 | 17 | 9.4 | –79 | 52 | 17.9 | – | – | 144 |
| 8 | 250 | 31 | 19.2 | –77 | – | – | bc | – | 108 |
| 9 | 240 | 21 | 13.2 | – | – | – | bc | – | 108 |
| 10 | 173 | 12 | 16.8 | – | 19 | 21.8 | – | – | 98 |
| 11 | 704 | 20 | 17.4 | –68 | 26 | 49.9 | – | – | 56 |
| 12 | 849 | 21 | 26.0 | –75 | 84 | 30.2 | bc | ss | 288 |
| 13 | 979 | 22 | 41.0 | – | 53 | 33.2 | – | ss | 90 |
| 14 | 1261 | 21 | 28.6 | – | – | – | – | pc | 102 |
| 15 | 1442 | 21 | 22.6 | –73 | 67 | 36.6 | – | ss | 199 |
| 16 | 987 | 19 | 23.6 | –77 | 48 | 44.8 | bc | ss or pc | 70 |
| 17 | 888 | 28 | 6.9 | –81 | 38 | 11.2 | bc | bc | 49 |
| Mean* | 818.0 | 20.4 | 21.3 | –75.1 | 61.0 | 29.8 | – | – | 118.0 |
| S.D.* | 448.3 | 4.3 | 7.4 | 3.1 | 27.8 | 13.1 | – | – | 65.8 |
Electrophysiological properties of IPSPs recorded in spiny cells. Voltage-standardized amplitude at 1 Hz stimulation rate (Amp), noise-corrected coefficient of variation (CV), half-width (HW), reversal potential (Erev), input resistance (Rin) of postsynaptic cell, time integral of conductance change (Gt), recovered morphology of presynaptic cell (‘Source’ bc, basket cell), morphology of postsynaptic cell (‘Target’ ss, spiny stellate; pc, layer 4 pyramidal cell; bc, basket cell), and estimated or measured (italics) lateral distance between cells. For IPSP 16 two adjacent cells (somata touching) were recovered, both contacted by the inhibitory cell axon, so it was not possible to tell which one was recorded. IPSPs 1–16 were onto excitatory cells; IPSP 17 was onto an inhibitory cell. IPSPs 1–5 were recorded from reciprocally connected cell pairs; the reciprocal EPSPs are EPSPs 1–5 in Table 2. Amplitude is extrapolated to 15 mV positive to measured reversal potential; where reversal potential was not determined, amplitude is extrapolated to −60 mV assuming a reversal potential of −75 mV.
Means and s.d. values exclude IPSP 17.
Table 2.
Properties of EPSPs in basket cells
| EPSP | Amp (μV) | CV (%) | HW (ms) | Rin (MΩ) | Target | Source | Distance (μm) |
|---|---|---|---|---|---|---|---|
| 1 | 685 | 26 | 3.6 | 48 | bc | – | 105 |
| 2 | 3812 | 20 | 1.4 | 29 | bc | ss | 66 |
| 3 | 1939 | 18 | 3.8 | – | bc | ss | 31 |
| 4 | 651 | 45 | 3.8 | 63 | bc | – | 68 |
| 5 | 155 | 45 | 3.7 | – | bc | ss | 155 |
| 6 | 1589 | 97 | 1.8 | – | – | – | 43 |
| Mean | 1471.8 | 41.8 | 3.0 | 46.7 | – | – | 78.0 |
| s.d. | 1321.8 | 29.5 | 1.1 | 17.1 | – | – | 45.5 |
Electrophysiological properties of EPSPs recorded in smooth cells. Amplitude at 1 Hz stimulation rate (Amp), noise–corrected coefficient of variation (CV), half-width (HW), input resistance (Rin) of postsynaptic cell, recovered morphology of postsynaptic cell (‘Target’ bc, basket cell), morphology of presynaptic cell (‘Source’ ss, spiny stellate), and estimated or measured (italics) lateral distance between presynaptic and postsynaptic cells. EPSPs 1 to 5 were recorded from reciprocally connected cell pairs; the reciprocal IPSPs are IPSPs 1–5 in Table 1.
A smooth-spiny cell pair is shown in Fig. 1, and the IPSP and reciprocal EPSP recorded from it are illustrated in Fig. 2. The mean amplitude of the IPSP (Fig. 2A, upper trace, averaged) produced by the basket cell action potential (lower trace; note the deeper after-hyperpolarization than in the case of the spiny cell action potential in Fig. 2D) was 1596 μV at 15 mV from reversal potential. Consecutive raw traces (Fig. 2B) show trial-to-trial amplitude fluctuations. IPSP and baseline noise amplitude distributions (Fig. 2C; 90 trials) indicate very few failures; this was true of most PSPs recorded. The coefficient of variation (CV) of this IPSP, 17%, was typical (see Table 1). The EPSP in Fig. 2D had a mean amplitude of 1939 μV, and CV of 18%. Inter-trial variation is seen in the consecutive raw traces of Fig. 2E and the amplitude histogram (Fig. 2F; 110 trials). EPSPs in basket cells were much briefer than IPSPs in spiny cells (mean half-width 3 ms versus 21 ms). This is expected from the different conductances involved, but also reflects the short membrane time constants of basket cells. Thus, the one IPSP recorded in a basket cell (IPSP 17) was briefer than IPSPs in spiny cells, although it did not differ in other respects from IPSPs in spiny cells. The electrophysiological properties of all IPSPs and EPSPs recorded are summarized in Tables 1 and 2, respectively.
Figure 1. Morphology of a neurone pair in layer 4 of cat visual cortex (area 17).
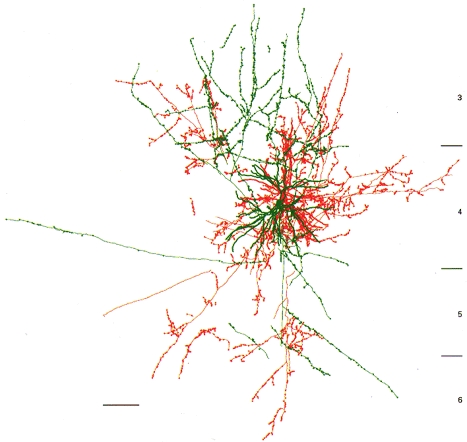
Reciprocally connected spiny stellate (red) and smooth basket (green) cells, from which IPSP 3 and EPSP 3, respectively, were recorded. Somata are separated by about 31 μm (coronal view; scale bar, 100 μm).
Figure 2. Synaptic physiology of a reciprocal connection.
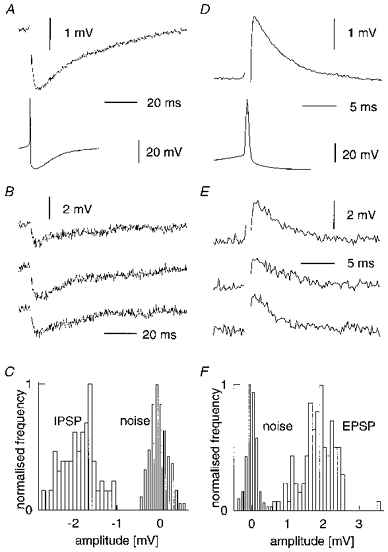
A-C show the physiology of an IPSP onto a spiny stellate cell (IPSP 3 in Table 1, recorded at resting membrane potential of −60 mV, i.e. 17 mV from reversal potential; cell pair reconstruction shown in Fig. 1). A, average (40 trials at 1 Hz) postsynaptic potential (upper trace) and presynaptic action potential (lower trace). B, 3 consecutive raw traces (spike artefacts omitted). C, amplitude histograms for both IPSP and noise (measured in the pre-stimulus baseline). D-F show the physiology of the reciprocal EPSP recorded in the basket cell (EPSP 3 in Table 2). A, average (100 trials at 1 Hz) postsynaptic potential (upper trace) and presynaptic action potential (lower trace). E, 3 consecutive raw traces. F, amplitude histograms for both EPSP and noise (measured in the pre-stimulus baseline).
Inhibitory postsynaptic potentials recorded in spiny cells
IPSP amplitudes were highly voltage dependent, with a mean reversal potential of -75 mV. Figure 3A (IPSP 4) shows averaged responses at four different membrane potentials. Below -73 mV (interpolated value; Fig. 3B) the IPSP became depolarizing, but was strongly rectified, as would be expected for IPSPs generated by GABAA channels (Seeburg et al. 1990). We have standardized all IPSP mean amplitudes (Table 1) to a membrane potential 15 mV positive to reversal potential, assuming a linear relationship. At this driving force IPSPs in spiny cells average 818 μV. Since EPSPs reverse around 0 mV, their amplitudes (mean 1472 μV; Table 2), recorded at about -70 mV, were not standardized.
Figure 3. Voltage dependence of IPSPs.
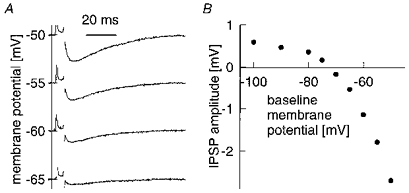
A, averaged traces (50 trials) of an IPSP evoked at different baseline membrane potentials. B, IPSP amplitude as a function of baseline membrane potential. Reversal at -73 mV. Data from IPSP 4.
To quantify inhibitory synaptic conductances, we calculated the time integral of synaptic conductance over the course of each IPSP (Table 1) from the time integral of voltage, the postsynaptic input resistance and the driving force for synaptic current. Whilst we do not have a measure of the conductance time course for these channels, we might assume one similar to that of GABAA receptor-mediated inhibitory currents in rat dentate gyrus. The average measured time integral of synaptic conductance of 30 pS s corresponds, then, to a peak conductance of the order of 1 nS (Edwards, Konnerth & Sakmann, 1990).
The amplitude of a given IPSP varied with the history of synaptic activity. The effects of various temporal factors are illustrated in detail in Fig. 4 for an IPSP recorded in a spiny stellate neurone (IPSP 2 in Table 1). Figure 4A (average of 350 trials) shows the amplitude (895 μV) of the IPSP produced by single action potentials evoked at 1 Hz. We then evoked trains of action potentials (firing rate 140 spikes s−1) with 100 ms current steps repeated at a rate of either 1 Hz (Fig. 4B, continuous trace, average of 100 trials) or 0.2 Hz (dotted trace, average of 50 trials). The first IPSP in a train evoked at 1 Hz is smaller (649 μV; top asterisk to left of first spike artefact) than the response to single spikes evoked at 1 Hz. With longer rests between trains, the first IPSP is enhanced (1104 μV; lower asterisk), as is the overall postsynaptic membrane potential deflection.
Figure 4. Effect of temporal pattern of stimulation on an IPSP.
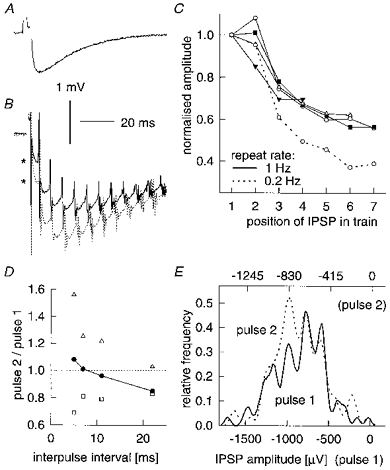
A, averaged trace of single IPSP evoked at 1 Hz. B, averaged traces of 140 Hz train of IPSPs, evoked for 100 ms and repeated at 1 Hz (continuous line) and 0.2 Hz (dotted line). C, mean amplitude (normalized to first pulse) of successive IPSPs in trains of different frequencies repeated at 1 Hz (continuous lines; ○, 140 Hz; ▪, 100 Hz; ▵, 70 Hz; ▾, 40 Hz) or 0.2 Hz (dashed line). Mean amplitudes for the first IPSP in the train were between 811 and 905 μV for the three lower frequencies, 649 μV for 140 Hz trains evoked at 1 Hz and 1104 μV for 140 Hz trains evoked at 0.2 Hz. D, paired-pulse behaviour in trains of different frequencies corresponding to different intervals between first and second pulses (repeat rate, 1 Hz). Mean amplitude indicated by filled circles joined by continuous line. Quantal size (□) and release probability (▵) were calculated assuming 8 release sites (see ‘peaky’ histogram in E and text for details of calculations). E, amplitude histograms of first and second pulses at 22 ms interpulse interval; note that the scale of pulse 2 amplitude axis is expanded relative to pulse 1 to preserve the same relative peak spacing (i.e. quantal size has decreased for pulse 2). All data are from IPSP 2 in Table 2, recorded in a postsynaptic cell held at -60 mV with -0.05 nA of holding current. Amplitude histograms smoothed using a Fourier filter (see Methods).
During trains, the net membrane hyperpolarization reflects temporal summation across the first four IPSPs, decreasing thereafter as a result of fatigue within the train, or a decrement in amplitude of successive IPSPs. In the averaged traces of Fig. 4B, some of the apparent decrement is due to jitter in spike timing (note blurring of later spike artefacts). However, measurements taken from each individual trial reveal a genuine decrement in mean amplitude for successive IPSPs in a train, as shown in Fig. 4C for trains corresponding to different rates of presynaptic discharge (frequencies are adapted firing rates; amplitudes are normalized to the first IPSP in the train). After rapid initial depression, the IPSP settles at about 60% of initial size at 1 Hz repeat rates, regardless of the firing frequency during the train. Proportionately more depression is seen with the 0.2 Hz repetition rate for the fastest trains, but since the initial amplitude is larger, the final absolute amplitude reached is similar.
As an approximation to a standard ‘paired-pulse’ protocol we determined the ratio of amplitudes of the first and second IPSPs in trains of different firing frequencies, as a function of the different first interspike intervals (Fig. 4D, filled symbols; 1 Hz repeat rates). Slight facilitation occurred on the second pulse of 140 Hz trains, i.e. with the shortest interval; with longer intervals, the ‘pulse 2’ response was depressed relative to the ‘pulse 1’ response. A hint as to the underlying mechanism was obtained from the smoothed amplitude histograms (Fig. 4E) of all the pulse 1 and pulse 2 responses (100 trials each) recorded from 40 Hz trains, i.e. at a mean interval of 22 ms, which gave a 15% depression in mean amplitude. Each distribution is roughly symmetrical and shows nine peaks, suggesting a minimum of eight release sites. However, note that the pulse 1 and pulse 2 abscissa scales differ by 17%, to produce peak alignment: pulse 1 and pulse 2 responses differ in that the interpeak separation, or apparent quantal size, of the second IPSP is reduced by about 17%. Thus the second pulse at this interval seems to give a slight increase in release probability, combined with a decrease in quantal size due perhaps to receptor desensitization (see review by Jones & Westbrook, 1996).
Assuming eight release sites, and a simple binomial release process with constant n in the short term (for details of the method, see Larkman, Jack & Stratford, 1997), we calculated, from pulse 1 and pulse 2 amplitudes and CVs, the relative changes in both release probability (Fig. 4D, open triangles) and quantal size (open squares) on second pulses. At 22 ms intervals, pulse 2 shows a 17% drop in quantal size, exactly as estimated from the amplitude histograms. With shorter interpulse intervals quantal size drops more, but release probability increases on the second pulse (due perhaps to a short-lived residual calcium effect). The balance of changes in quantal size and release probability at a given interval determines the net paired-pulse change. Note that the pulse 2 change in release probability observed, e.g. in 140 Hz trains (5 ms intervals), depends not only on the pulse 1-pulse 2 interval per se, but also on the first pulse release probability. Thus when 140 Hz trains were evoked at 0.2 Hz, resulting in a higher first pulse release probability, pulse 2 release probability hardly changed.
We also considered what happens between the first and last pulse in a train, to account for the overall decrement in response amplitude. Again assuming eight release sites, release probability drops 13% from 0.44 for the first IPSP to 0.38 by the seventh IPSP in a 140 Hz train evoked at 1 Hz; thus the initial increase in probability seen on the second pulse does not persist. But the amplitude by the seventh pulse has dropped well over 13%, due to a 36% drop in quantal size, from 185 to 118 μV, presumably as a result of accumulated receptor desensitization from preceding pulses. With the same train delivered at 0.2 Hz, quantal size again drops, from 187 to 110 μV, but release probability also drops 34%, from its higher starting value of 0.74 down to 0.49 by the seventh pulse.
On examination of the relationship between CV and the mean IPSP amplitude (single IPSPs evoked at 1 Hz) for different connections (Fig. 5A), we found only a small range of CVs (16%-34%) not varying systematically with amplitude. One explanation for this might be that the release probabilities are all relatively high, and variation in amplitude across these IPSPs is dominated by differences in quantal size along with different numbers of release sites. When we looked at the relationship between IPSP amplitude and the intersomatic distance (i.e. the physical distance between the somata of the two cells in the connection, as measured either from the 3-D reconstruction (large circles) or estimated from the electrode penetrations (small circles), see Fig. 5B), we also found no clear correlation. From the axonal anatomy, it would be expected that these basket cells make mostly local connections. Interestingly, it does not appear that IPSP amplitude drops off sharply within the first 300 μm.
Figure 5. PSP amplitudes in relation to CV and intercellular distance.
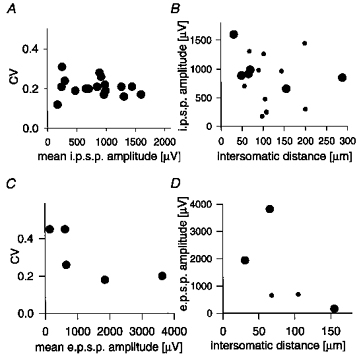
A, CV as a function of mean for 17 different dual-recorded IPSPs. B, IPSP amplitudes (standardized for resting membrane potential of -60 mV, see text) as a function of the measured (large symbols, derived from 3-D reconstruction) or estimated (small symbols, calculated as the 3-D geometric distance between the electrode tips) distance between inhibitory cell and target. C, CV as a function of mean for 5 different dual-recorded EPSPs (1-5 in Table 2). D, EPSP amplitudes as function of the measured (large symbols, derived from 3-D reconstruction) or estimated (small symbols, calculated as the distance between the electrode tips) lateral distance between excitatory cell and inhibitory target.
Excitatory postsynaptic potentials recorded in smooth cells
Excitatory inputs to small basket cells were also analysed for temporal behaviour. Figure 6 illustrates this in detail for the excitatory connection reciprocal to the inhibitory input described above (EPSP 2 in Table 2). ‘Paired-pulses’ were studied, again, by driving the spiny stellate cell at different frequencies for 100 ms periods and comparing the amplitudes of responses to the first and second impulses in the train (Fig. 6A and B). The EPSP was brief in duration and showed the equivalent of paired-pulse depression (compare pulse 2 amplitudes at intervals of 6 and 36 ms in the averages shown in Fig. 6A). Depression was greatest at the shortest intervals, and was not seen beyond 30 ms. The amplitude distributions of first and second pulses separated by 6 ms are shown in Fig. 6C (150 trials each). The drop in mean amplitude on pulse 2 is accompanied by a broadening of the distribution: the CV of the second pulse response is 32%, compared with 21% for pulse 1. This would be consistent with depression resulting from a reduction in release probability on the second pulse.
Figure 6. Effect of temporal pattern of stimulation on an EPSP.
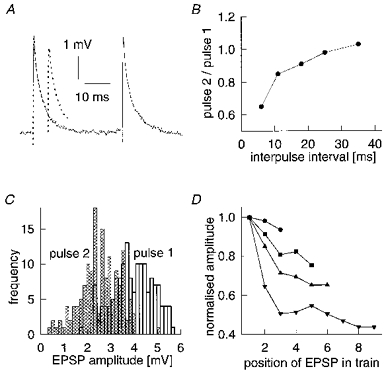
A, averaged traces of first two EPSPs in trains evoked driving the presynaptic neurone at two different frequencies for 100 ms. This approximates ‘paired-pulse’ behaviour. First pair separated by 36 ms (continuous line), second by 6 ms (dotted line) intervals (artifact of presynaptic action potential removed). B, ‘paired-pulse’ behaviour in trains of EPSPs evoked at different frequencies, which correspond to different intervals between first and second pulses (repeat rate, 1 Hz). C, amplitude histograms of first and second EPSPs in train, here separated by a ‘paired-pulse’ interval of 6 ms (see A). D, mean amplitude (normalized to first pulse) of successive EPSPs in trains of different frequencies (•, 40 Hz; ▪, 45 Hz; ▴, 60 Hz; ▾, 80 Hz) evoked by 100 ms current pulses, repeated at 1 Hz (mean first EPSP amplitude ranged from 3730 to 3960 μV).
During trains of action potentials evoked at 1 Hz, the mean amplitudes of successive EPSPs showed depression over the course of the train (Fig. 6D, amplitudes normalized to that of the first EPSP in the train). Proportionately greater depression by the end of the train (from similar starting amplitudes) was observed for trains of higher firing frequencies, with much of the decrease occurring on the second EPSP (Fig. 6B). The final absolute amplitudes reached were also lower. As the mean amplitude dropped over the course of a high-frequency train of EPSPs, the CV underwent a corresponding increase (not shown), consistent with continued, further depression of presynaptic release probability beyond the second pulse.
In addition to looking at brief trains of different firing frequencies, we systematically varied the repetition rate of a single action potential in the presynaptic spiny stellate cell. The amplitude histograms (200 trials each) for single EPSPs evoked at the extremes of the rates tested (5 and 0.1 Hz; Fig. 7A) show that with increased stimulation frequency, amplitude fell and the histogram broadened. Amplitude and CV (steady state reached after each transition) varied systematically with repetition rate, as summarized in Fig. 7B. The inset of Fig. 7B plots the inverse of CV2 against the mean amplitude for different stimulation rates (normalized to values for the standard 1 Hz). If we postulate that the only difference between different slow repeat rates is a change in release probability, then using data from 0.1 and 0.2 Hz, and assuming simple binomial release statistics, we can calculate that release probability is about 0.64 at 0.1 Hz, and there are thirty-eight release sites. Assuming a constant number of release sites, release probability drops to 0.38 at 1 Hz. The continuous curve in the inset in Fig. 7B; is the theoretical prediction for the relationship, in a simple binomial process, between mean and 1/CV2 as presynaptic release probability alone is varied from a reference (normalizing) value of 0.38, with no change in quantal size or number of release sites. Although the initial assumption of an isolated change in release probability concerned only the two slowest rates, all data for rates of 1 Hz and lower fit the prediction of pure presynaptic change well, validating the initial assumption and resulting calculations. The presynaptic frequency dependence of mean amplitude over the range described is to be expected if the differences in the degree of receptor desensitization persisting from one trial to the next at intervals of over 1 s are negligible.
Figure 7. Effect of temporal pattern of stimulation on an EPSP.
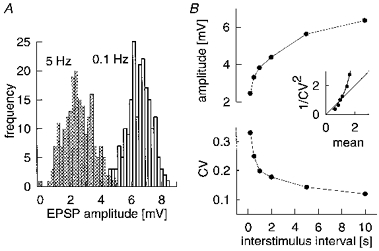
A, amplitude histograms of single EPSPs evoked at different repeat rates, 0.1 Hz (right-hand histogram) and 5 Hz (left-hand histogram). Note that higher repeat rate results in considerable depression of amplitudes. B, mean amplitude and CV for a single EPSP evoked at different repeat rates (0.1-5 Hz). Inset, 1/CV as a function of mean amplitude for different repeat rates (both normalized to values at 1 Hz repeat rate). Shape indicates EPSP depression is due to a change in probability of transmitter release. All data are from EPSP 2 in Table 2.
In contrast to data shown for IPSPs (Fig. 5A), the CV for different EPSPs appeared to vary with the mean amplitude (Fig. 5C) in a manner consistent with significant variation between EPSPs in release probabilities as well as in their number of release sites, with both factors influencing the strength of any given connection. It also appears that the amplitude may drop off as a function of intersomatic distance (Fig. 5D), which might point to a reduction in the average number of release sites mediating more distant connections. Note, however, that no connections separated by more than 150 μm were recorded, although we typically probed a region up to 300 μm from the postsynaptic cell when attempting to find a presynaptic partner. This may be due to the relative sparseness and patchiness of the spiny cell axonal collaterals compared with those of layer 4 basket cells (e.g. Gilbert & Wiesel, 1979; Martin & Whitteridge, 1984; Kisvárday et al. 1985).
The findings presented in detail for one IPSP and one EPSP above were true generally. Paired-pulse depression (defined as ≥10% change) was observed for all EPSPs onto basket cells, with the exception of EPSP 6 in Table 2 (for which the only interval tested, however, was > 60 ms). Paired-pulse facilitation (≥ 10%) was never seen. Paired-pulse behaviour was tested in seven IPSPs, and depression was again the rule, with IPSP 2 at 5 ms intervals (described above) as the only exception. IPSP 8, for example, showed 33% paired-pulse depression at an interval of 8 ms. Depression of PSP amplitude over the course of a train of presynaptic action potentials, and decreases in amplitude with higher overall stimulus repetition rates, were regularly observed.
Reciprocal connections
The discovery that one-third of the spiny cell-smooth cell pairs tested were reciprocally connected led us to consider the mutual influence of simultaneous activity in the neurones of such a pair (Fig. 8; IPSP 2 in Table 1 and EPSP 2 in Table 2). The spike discharge of each neurone during 100 ms suprathreshold current steps delivered to one or both of them is presented as a series of raster plots in Fig. 8A and B. Figure 8A shows a sequence of over 100 consecutive trials; until about trial 25, the basket cell was held below firing threshold while trains of action potentials were evoked in the spiny stellate cell by steps of depolarizing current. Then, until about trial 70, current steps were also injected into the basket cell, while the spiny stellate cell continued to receive the same current as before. Single EPSPs evoked action potentials in the depolarized basket cell (note that this EPSP averaged nearly 4 mV on the first spike in a train). The basket cell faithfully followed the rate set by the spiny stellate cell. Each basket cell spike produced an IPSP in the spiny stellate cell, but apart from a possible increase in precision of the interspike timing of the spiny stellate cell around trials 40-60, the firing rate of the spiny stellate cell did not change. Beyond trial 70, the spiny stellate cell was no longer stimulated, but the smooth cell continued to get the same current steps. Alone these were sufficient to evoke a regular first action potential, which occurred later than most of the first action potentials seen with simultaneous spiny stellate stimulation. Later action potentials were sporadic in the absence of entraining EPSPs received from the spiny cell.
Figure 8. Suprathreshold interactions of a reciprocally connected basket cell and spiny stellate pair (IPSP 2 in Table 1 and EPSP 2 in Table 2).
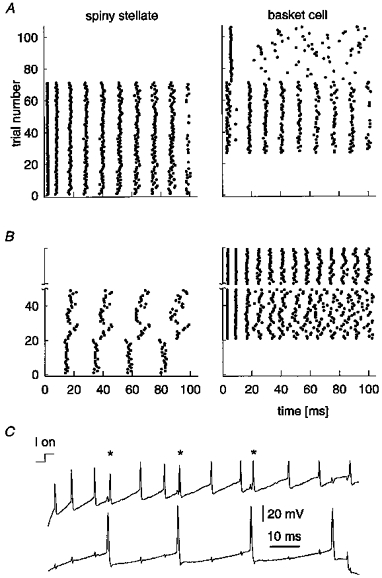
A, firing (each dot indicates a spike in raster plot) of cells receiving step current injections one at a time (trials 1-26 for strongly driven spiny stellate and trials 72-105 for weakly driven basket cell), and simultaneously (trials 27–71) with same injected currents as controls. Note the lack of significant effect of inhibition despite strong activation of the basket cell. B, firing of cells alone (trials 1-20 for a weakly driven spiny stellate cell and trials after break for a strongly driven basket cell) and simultaneously (trials 21-50) with same injected currents as controls. Note increased irregularity of firing in basket cell during period of spiny stellate activation. C, raw traces of the firing of a basket cell (top) and a spiny stellate cell (bottom) in a single trial from the period of simultaneous current injection in B (21–50); asterisks show basket cell spikes triggered by EPSPs from the spiny stellate cell. Note short latency of response. The basket cell evoked IPSPs in the spiny stellate cell following spike artifacts in the bottom trace. I on, onset of current step.
This experiment was repeated, this time with different relative rates of firing in the two cells. The spiny stellate cell was moderately excited by a positive current step (b; trials 1-20). Initially the basket cell was not depolarized, but then was given current injection to evoke a high firing rate (beyond trial 20). This basket cell activity produced clear slowing of spiny stellate cell discharge, and some irregularity in interspike intervals from trial to trial. Basket cell firing was also irregular after the third spike in each train, because EPSPs from the spiny stellate cell were directly evoked by additional spikes, disrupting the pattern and phase of repetitive firing. On its own, the basket cell fired regularly (consecutive trials after the ‘break’ in B). The single traces in Fig. 8C (from the period of trials 20-50 in B) show spiny stellate cell firing (bottom trace) evoking ‘extra’ action potentials (asterisks) in the basket cell (top trace).
DISCUSSION
This study provides the first direct evidence for a number of earlier inferences about the neurones involved in inhibition in layer 4 of cat visual cortex. Basket cells have been characterized physiologically in vivo, and studied by light and electron microscopy (see e.g. Martin et al. 1983; Kisvárday et al. 1985). They have smooth dendrites, and their axons form symmetrical (type 2) synapses (Kisvárday et al. 1985). On the basis of these data it was inferred that the basket cells provide local inhibition in layer 4.
The present in vitro study shows that these layer 4 basket cells are indeed inhibitory, confirming that neocortical basket cells are closely related to the basket cells of archaecortex and cerebellum. Local spiny stellate, pyramidal and smooth neurones are targets of layer 4 basket cell inhibition, and basket cells receive excitatory input from neighbouring spiny neurones, as expected on indirect evidence. We have further demonstrated reciprocal connections between pairs of layer 4 excitatory and inhibitory neurones. Our data yield quantitative estimates of the amplitudes and temporal properties both of inhibitory synaptic actions in layer 4, and of intracortical excitatory inputs to inhibitory neurones. Although we have not yet tried to establish by light and electron microscopic investigations the number of contacts made by presynaptic axons, the IPSPs show trial-to-trial variation, and sometimes ‘peaky’ amplitude distributions, which are one indication of possible multiple release sites. Unitary EPSPs onto basket cells also seem to be multiquantal, in some cases involving many sites.
We did not study the pharmacology of the IPSPs, but their time course and reversal potential make it likely that they were GABAA receptor mediated. Indeed, GABAA antagonists block virtually all the inhibitory effect of exogenous GABA in visual cortex, together with visually evoked inhibitory processes (Sillito, 1975a, b). However, GABAB inhibition is seen in visual cortex upon extracellular stimulation or application of baclofen in vitro and in vivo (Connors, Malenka & Silva, 1988; Douglas, Martin & Whitteridge, 1989; Douglas & Martin, 1991). GABAB receptors may be involved in connections other than those we studied in layer 4, or may be recruited only by multi-fibre activity releasing larger amounts of GABA.
Several in vivo intracellular studies have concluded that visually evoked inhibition involves neither large hyperpolarizations nor large ‘shunting’ conductances (Douglas, Martin & Whitteridge, 1988; Berman et al. 1991; Ferster & Jagadeesh, 1992; Pei, Vidyasagar, Volgushev & Creutzfeldt, 1994). From our in vitro data it seems that a single inhibitory afferent firing repetitively (e.g. at 100 Hz, with a time integral of conductance for each IPSP evoked of 18 pS s, taking around 40% depression during trains into account) would produce an average maintained conductance increase of between 1 and 2 nS, i.e. of the order estimated by Berman et al. (1991) in visually evoked inhibition. This is puzzling, because it implies that if inhibitory conductance increases of similar magnitude occur in vivo, either they must be masked, for instance by concurrent decreases in voltage-sensitive (e.g. NMDA) conductances, or else very few inhibitory afferents are synchronously active during visual stimulation in vivo.
Albus (1975) has shown that cells less than 200 μm apart in area 17 mostly differ in orientation preference by less than 30 deg. Thus, we have probably studied connections between cells of similar receptive field position and preferred orientation selectivity. The connections we have studied might thus be the substrate for the antagonism between ‘on’ and ‘off’ subfields that is a characteristic of layer 4 simple cells (Hubel & Wiesel, 1962). While dual impalement procedures may have biased against even closer connections, cells were on average around 100 μm apart laterally, consistent with layer 4 basket cell axonal arborizations (Kisvárday et al. 1985).
As important as the spatial aspects of basket cell inhibition are the temporal properties, such as the duration of single IPSPs, the firing pattern of basket cells, and the dependence of IPSP amplitude on firing pattern. As we have found (the authors’ unpublished observations), layer 4 basket cells can fire at high frequencies without correspondingly strong rate adaptation. In vivo, layer 4 basket cells in the cat visual cortex have conventional receptive fields and thus respond with trains of spikes to an optimal visual stimulus moving through the receptive field. However, we would expect their effects on their post-synaptic targets to vary constantly during the visual stimulation. For example, we found that while IPSPs show temporal summation, the amplitudes of the individual IPSPs depress during a train, due in part to reduction in quantal size. IPSP amplitude depends also on the longer history of firing: the first few IPSPs in each train reflect enhanced release probability if bursts are only fired every few seconds. Local excitatory inputs to layer 4 basket cells can also be powerful initially and show depression during trains of stimuli, in contrast to connections from pyramidal cells to inhibitory interneurones in rat neocortex, which often produce no response on the first spike, and then facilitate (Thompson et al. 1993).
A significant proportion (1/3) of the connected smooth cell-spiny cell pairs tested were reciprocally connected, including nearly all the pairs involving excitation of basket cells. Suprathreshold interactions between the cells were explored in one of these pairs. The inhibitory neurone had the most influence when it was strongly excited, and its target weakly. In the reverse case, all the action potentials fired by the smooth cell were attributable to EPSPs from the spiny cell. The recurrent inhibition thus evoked in the spiny cell through the recurrent inhibitory connection had virtually no effect on its firing, for two reasons: the influence of an IPSP on the next spike is at a minimum if it arrives just after the occurrence of an action potential in the postsynaptic neurone, and, moreover, inhibitory conductances have less effect in the face of high postsynaptic cell discharge rates, as theory predicts (Douglas & Martin, 1991) and in vitro experiments show (Connors et al. 1988; Berman et al. 1991).
Work in the hippocampus (Cobb, Buhl, Halasy, Paulsen & Somogyi, 1995; Whittington, Traub & Jefferys, 1995) has suggested that the inhibitory neurone is the key element synchronizing the spike output of spiny neurones. However, we have demonstrated here that the pattern of smooth cell firing can be strongly influenced by the activity of local excitatory sources, because the amplitude of the EPSPs produced in the basket cells by neighbouring spiny cells can be sufficiently large to drive a depolarized basket cell to fire a spike consistently. Of course, the specific effects seen here cannot be directly extrapolated to the behaviour of an intact neuronal circuit in vivo: in these experiments, two neurones were firing in isolation from the rest of the population, and they were activated by constant current injection rather than by the barrage of EPSPs and IPSPs that result from visual stimulation of the cortex. Nonetheless, the general observations are relevant to the idea of ‘precise timing’ in neuronal firing (see e.g. Abeles, Prut, Bergman & Vaadia, 1994).
Acknowledgments
This work was supported by The Wellcome Trust, the Medical Research Council and the Swiss National Science Foundation. We thank John Anderson especially for reconstructing the cells, and Tom Binzegger for the graphics and plotting of Fig. 1. Duncan Fleming provided the animals. K.T.-H. was a Wellcome Prize student.
References
- Abeles M, Prut Y, Bergman H, Vaadia E. Synchronization in neuronal transmission and its importance for information processing. Progress in Brain Research. 1994;102:395–404. doi: 10.1016/S0079-6123(08)60555-5. [DOI] [PubMed] [Google Scholar]
- Ahmed B, Anderson J C, Martin K A C, Nelson J C. A map of the synapses onto layer 4 basket cells of the primary visual cortex of the cat. Journal of Comparative Neurology. 1997;380:230–242. 10.1002/(SICI)1096-9861(19970407)380:2<230::AID-CNE6>3.3.CO;2-T. [PubMed] [Google Scholar]
- Albus K. A quantitative study of the projection area of the central and the paracentral visual field in area 17 of the cat. II. The spatial organisation of the orientation domain. Experimental Brain Research. 1975;24:181–202. doi: 10.1007/BF00234062. [DOI] [PubMed] [Google Scholar]
- Anderson J C, Douglas R C, Martin K A C, Nelson J C. Synaptic output of physiologically identified spiny stellate neurons in cat visual cortex. Journal of Comparative Neurology. 1994;341:16–24. doi: 10.1002/cne.903410103. [DOI] [PubMed] [Google Scholar]
- Benevento L A, Creutzfeld O D, Kuhnt U. Significance of intracortical inhibition in the visual cortex. Nature. 1972;238:124–126. doi: 10.1038/newbio238124a0. [DOI] [PubMed] [Google Scholar]
- Berman N J, Douglas R J, Martin K A C. GABA-mediated inhibition in the neural networks of visual cortex. Progress in Brain Research. 1992;90:443–476. doi: 10.1016/s0079-6123(08)63626-2. [DOI] [PubMed] [Google Scholar]
- Berman N J, Douglas R J, Martin K A C, Whitteridge D. Mechanisms of inhibition in cat visual cortex. Journal of Physiology. 1991;440:697–722. doi: 10.1113/jphysiol.1991.sp018731. [DOI] [PMC free article] [PubMed] [Google Scholar]
- Cobb S R, Buhl E H, Halasy K, Paulsen O, Somogyi P. Synchronization of neuronal activity in hippocampus by individual GABAergic interneurons. Nature. 1995;378:75–78. doi: 10.1038/378075a0. [DOI] [PubMed] [Google Scholar]
- Connors B W, Malenka R C, Silva L R. Two inhibitory postsynaptic potentials, and GABAA and GABAB receptor mediated responses in neocortex of rat and cat. Journal of Physiology. 1988;406:443–468. doi: 10.1113/jphysiol.1988.sp017390. [DOI] [PMC free article] [PubMed] [Google Scholar]
- Douglas R J, Martin K A C. A functional microcircuit for cat visual cortex. Journal of Physiology. 1991;440:735–769. doi: 10.1113/jphysiol.1991.sp018733. [DOI] [PMC free article] [PubMed] [Google Scholar]
- Douglas R J, Martin K A C, Whitteridge D. Selective responses of cells do not depend on shunting inhibition. Nature. 1988;332:642–644. doi: 10.1038/332642a0. 10.1038/332642a0. [DOI] [PubMed] [Google Scholar]
- Douglas R J, Martin K A C, Whitteridge D. A canonical microcircuit for neocortex. Neural Computation. 1989;1:480–488. [Google Scholar]
- Edwards F A, Konnerth A, Sakmann B. Quantal analysis of inhibitory synaptic transmission in the dentate gyrus of rat hippocampal slices: a patch-clamp study. Journal of Physiology. 1990;430:213–249. doi: 10.1113/jphysiol.1990.sp018289. [DOI] [PMC free article] [PubMed] [Google Scholar]
- Ferster D. Orientation selectivity of synaptic potentials in neurons of cat primary visual cortex. Journal of Neuroscience. 1986;6:1284–1301. doi: 10.1523/JNEUROSCI.06-05-01284.1986. [DOI] [PMC free article] [PubMed] [Google Scholar]
- Ferster D. Spatially opponent excitation and inhibition in simple cells of the cat visual cortex. Journal of Neuroscience. 1988;8:1172–1180. doi: 10.1523/JNEUROSCI.08-04-01172.1988. [DOI] [PMC free article] [PubMed] [Google Scholar]
- Ferster D, Chung S, Wheat H. Orientation selectivity of thalamic input to simple cells of cat visual cortex. Nature. 1996;380:249–252. doi: 10.1038/380249a0. 10.1038/380249a0. [DOI] [PubMed] [Google Scholar]
- Ferster D, Jagadeesh B. EPSP-IPSP interactions in cat visual cortex studies with in vivo whole-cell patch recording. Journal of Neuroscience. 1992;12:1262–1274. doi: 10.1523/JNEUROSCI.12-04-01262.1992. [DOI] [PMC free article] [PubMed] [Google Scholar]
- Gilbert C D, Wiesel T N. Morphology and intracortical projections of functionally identified neurons in cat visual cortex. Nature. 1979;280:120–125. doi: 10.1038/280120a0. [DOI] [PubMed] [Google Scholar]
- Hirsch J A. Synaptic integration in layer IV of the ferret striate cortex. Journal of Physiology. 1995;483:183–199. doi: 10.1113/jphysiol.1995.sp020577. [DOI] [PMC free article] [PubMed] [Google Scholar]
- Hubel D H, Wiesel T N. Receptive fields, binocular interaction and functional architecture in the cat's visual cortex. Journal of Physiology. 1962;160:106–154. doi: 10.1113/jphysiol.1962.sp006837. [DOI] [PMC free article] [PubMed] [Google Scholar]
- Jones M V, Westbrook G L. The impact of receptor desensitization on fast synaptic transmission. Trends in Neurosciences. 1996;19:96–101. doi: 10.1016/s0166-2236(96)80037-3. 10.1016/S0166-2236(96)80037-3. [DOI] [PubMed] [Google Scholar]
- Kisvárday Z F. GABAergic networks of basket cells in the visual cortex. Progress in Brain Research. 1992;90:385–405. doi: 10.1016/s0079-6123(08)63623-7. [DOI] [PubMed] [Google Scholar]
- Kisvárday Z F, Martin K A C, Whitteridge D, Somogyi P. Synaptic connections of intracellularly filled clutch cells: a type of small basket cell in the visual cortex of the cat. Journal of Comparative Neurology. 1985;241:111–137. doi: 10.1002/cne.902410202. [DOI] [PubMed] [Google Scholar]
- Larkman A U, Jack J J B, Stratford K J. Quantal analysis of excitatory synapses in rat hippocampal CA1 in vitro during low-frequency depression. Journal of Physiology. 1997;505:457–471. doi: 10.1111/j.1469-7793.1997.457bb.x. [DOI] [PMC free article] [PubMed] [Google Scholar]
- Martin K A C, Somogyi P, Whitteridge D. Physiological and morphological properties of identified basket cells in the cat's visual cortex. Experimental Brain Research. 1983;50:193–200. doi: 10.1007/BF00239183. [DOI] [PubMed] [Google Scholar]
- Martin K A C, Whitteridge D. Form, function and intracortical projections of spiny neurones in striate visual cortex of the cat. Journal of Physiology. 1984;353:463–504. doi: 10.1113/jphysiol.1984.sp015347. [DOI] [PMC free article] [PubMed] [Google Scholar]
- Mason A, Nicoll A, Stratford K. Synaptic transmission between individual pyramidal neurons of the rat visual cortex in vitro. Journal of Neuroscience. 1991;11:72–84. doi: 10.1523/JNEUROSCI.11-01-00072.1991. [DOI] [PMC free article] [PubMed] [Google Scholar]
- McCormick D A, Connors B W, Lighthall J W, Prince D A. Comparative electrophysiology of pyramidal and sparsely spiny stellate neurons of the neocortex. Journal of Neurophysiology. 1985;54:782–806. doi: 10.1152/jn.1985.54.4.782. [DOI] [PubMed] [Google Scholar]
- Palmer L A, Davis T L. Receptive-field structure in cat striate cortex. Journal of Neurophysiology. 1981;46:260–276. doi: 10.1152/jn.1981.46.2.260. [DOI] [PubMed] [Google Scholar]
- Pei X, Vidyasagar T R, Volgushev M, Creutzfeldt O D. Receptive field analysis and orientation selectivity of postsynaptic potentials of simple cells in cat visual cortex. Journal of Neuroscience. 1994;14:7130–7140. doi: 10.1523/JNEUROSCI.14-11-07130.1994. [DOI] [PMC free article] [PubMed] [Google Scholar]
- Seeburg P H, Wisden W, Verdoorn T A, Pritchett D B, Werner P, Herb A, Luddens H, Sprengel R, Sakmann B. The GABAA receptor family: molecular and functional diversity. Cold Spring Harbor Symposia on Quantitative Biology. 1990;55:29–40. doi: 10.1101/sqb.1990.055.01.006. [DOI] [PubMed] [Google Scholar]
- Sillito A M. The effectiveness of bicuculline as an antagonist of GABA and evoked inhibition in the cat's striate cortex. Journal of Physiology. 1975a;250:287–304. doi: 10.1113/jphysiol.1975.sp011055. [DOI] [PMC free article] [PubMed] [Google Scholar]
- Sillito A M. The contribution of inhibitory mechanisms to the receptive field properties of neurons in the striate cortex of the cat. Journal of Physiology. 1975b;250:305–329. doi: 10.1113/jphysiol.1975.sp011056. [DOI] [PMC free article] [PubMed] [Google Scholar]
- Stratford K J, Tarczy-Hornoch K, Martin K A C, Bannister N J, Jack J J B. Excitatory synaptic inputs to spiny stellate cells in cat visual cortex. Nature. 1996;382:258–261. doi: 10.1038/382258a0. 10.1038/382258a0. [DOI] [PubMed] [Google Scholar]
- Thomson A M, Deuchars J, West D C. Single axon excitatory postsynaptic potentials in neocortical interneurons exhibit pronounced paired pulse facilitation. Neuroscience. 1993;54:347–360. doi: 10.1016/0306-4522(93)90257-g. 10.1016/0306-4522(93)90257-G. [DOI] [PubMed] [Google Scholar]
- Whittington M A, Traub R D, Jefferys J G. Synchronized oscillations in interneuron networks driven by metabotropic glutamate receptor activation. Nature. 1995;373:612–615. doi: 10.1038/373612a0. 10.1038/373612a0. [DOI] [PubMed] [Google Scholar]