Abstract
Recordings of the activity of the large conductance Ca2+-activated K+ (BK) channel from over 90 % of inside-out patches excised from acutely dissociated hippocampal CA1 neurones revealed an inactivation process dependent upon the presence of at least 1 μM intracellular Ca2+. Inactivation was characterized by a sudden switch from sustained high open probability (Po) long open time behaviour to extremely low Po, short open time channel activity. The low Po state (mean Po, 0.001) consisted of very short openings (time constant (τ), ≈0.14 ms) and rare longer duration openings (τ, ≈3.0 ms).
Channel inactivation occurred with a highly variable time course being observed either prior to or immediately upon patch excision, or after up to 2 min of inside-out recording. Inactivation persisted whilst recording conditions were constant.
Inactivation was reversed by membrane hyperpolarization, the rate of recovery increasing with further hyperpolarization and higher extracellular K+. Inactivation was also reversed when the intracellular Ca2+ concentration was lowered to 100 nM and was permanently removed by application of trypsin to the inner patch surface. In addition, inactivation was perturbed by application of either tetraethylammonium ions or the Shaker (Sh)B peptide to the inner membrane face.
During inactivation, channel Po was greater at hyperpolarized rather than depolarized potentials, which was partly the result of a greater number of longer duration openings. Depolarizing voltage steps (−40 to +40 mV) applied during longer duration openings produced only short duration events at the depolarized potential, yielding a transient ensemble average current with a rapid decay (τ, ≈3.8 ms).
These data suggest that hippocampal BK channels exhibit a Ca2+-dependent inactivation that is proposed to result from block of the channel by an associated particle. The findings that inactivation was removed by trypsin and prolonged by decreasing extracellular potassium suggest that the blocking particle may act at the intracellular side of the channel.
Large conductance Ca2+-activated K+ (BK) channels are present in many cell types (for review see Latorre, Oberhauser, Labarca & Alvarez, 1989). In hippocampal pyramidal neurones, BK channels are activated during an action potential by membrane depolarization, together with a rise in the intracellular Ca2+ concentration ([Ca2+]i). The resulting K+ current is largely responsible for action potential repolarization and generation of the fast after-hyperpolarization (Storm, 1987; Lancaster & Nicoll, 1987), which delays the return of the membrane potential to firing threshold. Therefore, the activity of these channels is critical in setting the degree of neuronal excitability, which in turn determines the rate of action potential firing and burst firing patterns.
BK channels are both voltage and calcium dependent (Barrett, Magleby & Pallotta, 1982; Latorre, Vergara & Hidalgo, 1982) and typically display sustained activity under constant recording conditions. However, activity with different kinetics has been reported. For example, the activity of BK channels from skeletal muscle, either from cultured cells or reconstituted into a lipid bilayer, show long shut periods (hundreds of milliseconds) in the presence of high [Ca2+]i (between 10 μM and 20 mM). This behaviour has been attributed to pore block by contaminating Ba2+ or by Ca2+ itself (Latorre et al. 1982; Barrett et al. 1982; Vergara & Latorre, 1983; Neyton & Miller, 1988; Diaz, Wallner, Stefani, Toro & Latorre, 1996; Neyton, 1996). However, others have described more complex activity of rat muscle BK channels consisting of two kinetically distinct periods of low activity which were not all attributable to block by Ba2+ ions but may result from inherent gating of the channel (Rothberg, Bello, Song & Magleby, 1996) or inactivation (Pallotta, 1985). One of these behaviours, termed the ‘low activity mode’ was dependent upon the presence of between 10 and 1000 μM Ca2+ and was considered to be functionally equivalent to a sojourn in an inactivated state. The other ‘long shut intervals’ were Ca2+ independent and thus likely to be due to a distinct underlying mechanism. Most reports suggest that BK channels in hippocampal neurones exhibit sustained activation (Ikemoto, Ono, Yoshida & Akaike, 1989; Yoshida, Oda & Ikemoto, 1991; Wann & Richards, 1994), but inactivating BK channels have been observed in a small number of patches from acutely isolated hippocampal pyramidal neurones (Ikemoto et al. 1989) or from cultured cells (McLarnon, 1995). A fast inactivation of BK channels, similar to the inactivation of A-type K+ channels, has been well documented in a subpopulation of chromaffin cells (Solaro & Lingle, 1992).
A transient Ca2+-sensitive K+ current has been recorded from hippocampal slices which was blocked by removal of extracellular Ca2+ (Cao2+), extracellular divalent cations (such as Mn2+ or Cd2+) and by low concentrations (5–10 mM) of extracellular TEA (Brown & Griffith, 1983; Zbicz & Weight, 1985). This transient current was proposed to result from activation of IC (the current generated from activation of BK channels) (Brown & Griffith, 1983; Zbicz & Weight, 1985), with the time course possibly arising from the subsequent inactivation of BK channels. We have observed that in over 90 % of inside-out patches excised from acutely dissociated hippocampal CA1 neurones, BK channels displayed inactivation. BK channel inactivation resulted in extremely low Po, short open time behaviour. This behaviour was reversed by membrane hyperpolarization, or when [Ca2+]i was reduced to resting levels (100 nM). Inactivation was permanently removed by intracellular trypsin, and was perturbed by agents that interact with the channel's open pore. This suggests that hippocampal BK channels exhibit Ca2+-dependent inactivation via an endogenous protein that prevents current flow by physical occlusion of the inner mouth of the channel pore.
METHODS
Preparation of hippocampal neurones and single channel recording
Sprague-Dawley rats between 7 and 21 days old were killed by cervical dislocation. The whole hippocampus was dissected and coronal slices (450–550 μm thickness) were prepared with a hand-operated tissue chopper. The CA1 area was microdissected and hippocampal neurones were dissociated as described in McDonough, Swartz, Mintz, Boland & Bean (1996), and used the same day. Inside-out patch recordings (Hamill, Marty, Neher, Sakmann & Sigworth, 1981) were made using fire-polished borosilicate glass electrodes (3–8 MΩ; Corning 7052, 1.5 mm o.d., 1.0 mm i.d.) coated with Sticky Wax (Kerr, Romulus, MI, USA) and filled with a solution containing (mM): KCl, 150 (or potassium aspartate, 130 + KCl, 30); Hepes, 10; MgCl2, 2.5; EGTA, 1; adjusted to pH 7.4 with KOH. CaCl2 was added to give the required free Ca2+ concentration (0.1–10 μM) calculated using the binding constants of Fabiato & Fabiato (1979). Neurones were superfused (5 ml min−1) with a modified Krebs solution containing (mM): NaCl, 135; KCl, 5; CaCl2, 1; MgCl2, 1; Hepes, 10; glucose, 5; adjusted to pH 7.4 with NaOH. After the formation of a high resistance seal the solution bathing the cells was changed to the high potassium aspartate-chloride solution used inside the electrode. All patches were excised into this solution and all recordings were made under isotonic K+ conditions (except as described), at room temperature (20–22°C). Single channel currents from inside-out patches were recorded using a Axopatch-1C patch clamp amplifier with a CV4 headstage and digitized onto video (94 kHz sampling frequency, 37 kHz bandwidth, model VR10B; Instrutech Corp., NY, USA) for later analysis. When more than one channel type was observed in the same patch, BK channels were distinguished by their amplitude, reversal at 0 mV and obvious voltage dependence. The smaller amplitude current classes were not studied here.
Data acquisition and analysis
Data were filtered at 5 kHz with a eight-pole Bessel filter (Frequency Devices, MA, USA) and acquired at 100 μs intervals using Pulse (HEKA, distributed by Instrutech Corp.). Single channel analysis was performed using the TAC and TACfit programs (Skalar Instruments, distributed by Instrutech Corp.). The ‘50 % threshold’ technique was used to detect events and each event was visually inspected before acceptance. Missed events were not corrected for, but all events shorter that 100 μs were excluded from analysis by removal from the data set prior to construction and fitting of histograms. Open duration histograms were binned logarithmically and the distribution was fitted by a sum of exponential probability density functions using the maximum likelihood method. With this type of representation, peaks in the histogram correspond to the time constant of the exponential (Sigworth & Sine, 1987). Continuous estimation of patch Po over several minutes (acquisition rate 1 ms, filtering 500 Hz, to facilitate data handling) was performed using Readevents version 1.37 (Dr Scott Eliasof, Vollum Institute). A patch was considered to contain a single channel if openings to only a single conductance level were observed during several minutes of recording under conditions giving Po > 0.5. All data are expressed as means ±s.e.m.
The number of statistically significant exponential components required for fitting open duration histograms were determined using the method of maximum likelihood ratios (Horn & Lange, 1983). Using this method with seven patches, four displayed an open time distribution which was best fitted by the sum of two exponentials (see Fig. 1F), while three patches required three exponentials. However, the ‘extra’ exponential component had a mean duration of 24.9 ± 3 μs. This exponential component was extrapolated from the filtering bandwidth used (5 kHz). Therefore, it was necessary to disregard this ‘extra’ component, because it could not be adequately described at the bandwidth used.
Figure 1. Loss of BK channel activity.
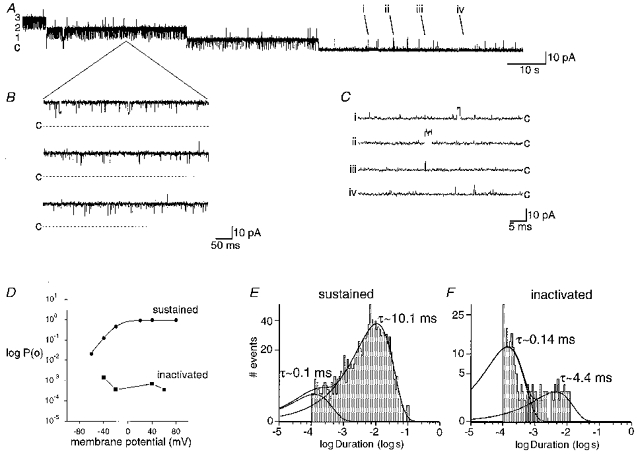
A, BK channel activity recorded from an inside-out patch bathed with 10 μM Ca2+. Initially three of four channels (labelled 1–3 to left of trace; c indicates closed level) in the patch were highly active at +40 mV but activity was lost in a stepwise manner until only very infrequent, short openings remained. The very low Po activity remained whilst the patch was held at depolarized potentials with no high Po activity being observed. In this and all subsequent figures, recordings were made in equimolar K+ (150 mM) solutions unless otherwise stated. B, expanded traces taken from the indicated portion of trace A, when two channels were still highly active. BK channels displayed long open time, high Po activity. C, examples of openings (taken from the corresponding points i-iv in A) after BK channels had inactivated (note expanded time scale). Traces i and ii show examples of ‘longer’ openings which are resolved and traces iii and iv show openings not resolved under the display conditions of A. BK channels at this point displayed very short open times and very low Po. D, comparison of BK channel Po voltage dependence between a patch that displayed sustained activity and another patch where the BK channel activity had declined (inactivated) (both in the presence of 10 μM Ca2+). The patch that exhibited sustained activity throughout the recording showed typical voltage dependence (•) Data were fitted with a Boltzmann function (membrane potential at half-maximal activation (V½), -20 mV; Boltzmann steepness coefficient (k), 13.5) The Po observed in the patch after activity had declined (▪) was approximately two orders of magnitude lower than sustained activity and did not increase with membrane depolarization. However, an increase in Po was observed upon membrane hyperpolarization (see Discussion). E and F, open duration histograms of BK channel activity from two patches, one that displayed sustained activity (E) and another after activity had declined (F). Distributions were best fitted by the sum of two exponential functions with the stated time constants (τ).
BK channel inactivation was modelled using CSIM 2.0 (Axon Instruments), with rate constants (expressed as s−1) derived from analysis of BK channel open and closed time distributions, before and after inactivation. The resulting data files were analysed in the same fashion as those obtained from patches. Modelling BK channel inactivation gave rise to biexponential open times (see Fig. 1F) and a Po of 0.002 (see text).
Drugs and reagents
Test agents were applied to the cytoplasmic face of the inside-out patch either by bath perfusion or via a small diameter tube into which the electrode tip (with membrane patch) was placed. The latter system was employed to reduce the quantity of agent required to obtain full and rapid solution exchange. Shaker (Sh)B peptide was a generous gift from Dr Chris Lingle. TEA-HCl and trypsin (type XI from bovine pancreas) were purchased from Sigma. CaCl2 was purchased as a 1 M stock solution from Fluka Biochemicals. All other reagents were from Sigma except Hepes free acid which was from Calbiochem.
RESULTS
Inactivation of BK channel activity in the presence of raised [Ca2+]i
BK channel activity was recorded from inside-out patches excised from acutely dissociated CA1 hippocampal neurones. In over 90 % of patches, BK channels displayed an extremely low level of activity under conditions that would be expected to produce sustained high Po behaviour. The loss of channel activity will be termed ‘inactivation’ since the process has some similarities to inactivation of other ion channels (see below). In a small proportion (10 %) of these patches, this low Po behaviour was observed before patch excision, but in the majority it occurred either immediately (within 100 s of milliseconds of excision, 46 %), or developed during the first 2 min (44 %), following excision into 1 or 10 μM Ca2+. In single channel patches, the change from high to low Po activity occurred suddenly with no gradual loss of activity being observed prior to the switch to low Po behaviour. In patches containing multiple channels, inactivation occurred in a stepwise fashion, as if the channels inactivated in an independent fashion (Fig. 1A, and see below). Therefore, a wide variation in the time taken for inactivation to be complete was observed. The time-dependent development of inactivation (measured as the time following patch excision at which all high Po activity ceased) was complete by 41 ± 9 s (n = 16) with 10 μM (Fig. 1A), or 48 ± 5 s (n = 58) with 1 μM Ca2+ bathing the patch (no significant difference, Student's t test, P > 0.2). When BK channel activity was recorded in the presence of 100 nM Ca2+, no inactivation was observed (n = 6, see below).
Figure 1A shows an example of a patch excised into a solution containing 10 μM Ca2+ and held at +40 mV. Immediately after excision, at least four channels were evident, but during the first minute following excision (beginning of trace) a stepwise reduction in the patch Po was observed. Prior to this decline in activity, the channels showed long open time, high Po bursting behaviour, as would be expected for BK channels (Fig. 1B) (Po 0.972 ± 0.006, n = 6). After channel activity had declined to its final level, only very short duration infrequent events remained (Fig. 1C, note the change in time scale) (Po 0.0011 ± 0.0003, n = 12). In multi-channel patches, short duration events were observed superimposed on the bursting activity (Fig. 1A). In addition, the number of short open time events increased during the progressive decrease of Po (not shown under the display conditions used in Fig. 1, see Fig. 6A for example). This ‘stepwise’ decline of channel activity (Fig. 1A) and the concomitant and proportional increase of short duration openings suggested that each channel independently underwent a transition from high to low Po activity.
Figure 6. Trypsin permanently removes BK channel inactivation.
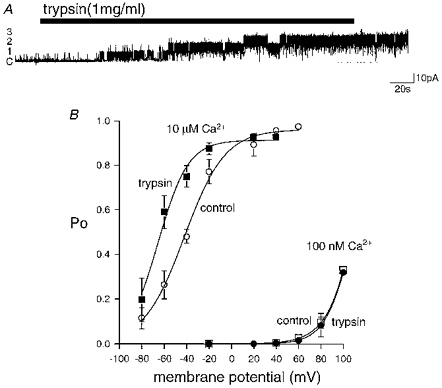
A, application of trypsin (1 mg ml−1) to the inner patch surface during inactivation resulted in an irreversible increase of sustained channel activity at +40 mV in the continued presence of 10 μM Ca2+. Trypsin application also revealed the presence of more channels (1–3 indicated to the left of the trace; ‘c’ indicates closed level) than were observed prior to inactivation (not shown). B, voltage-Po plots in the presence of 10 μM or 100 nM Ca2+ in patches displaying sustained channel activity (control, open symbols; means ±s.e.m., n = 3–6 for each datum point, data fitted with a Boltzmann function - ○: 10 μM Ca2+, V½ = -42 mV, k = 18; □: 100 nM Ca2+, V½ = 128 mV, k = 15) and following trypsinization of patches containing inactivated channels (trypsin, filled symbols; ▪: 10 μM Ca2+, V½ = -65 mV, k = 13; •, 100 nM Ca2+, V½ = 109 mV, k = 12). The leftward shift of the voltage-Po plot in 10 μM Ca2+ following patch trypsinization suggests that the endogenous particle can cause inhibition of channel activity during sustained activity.
Following channel inactivation, Po remained very low at positive membrane potentials and did not increase with depolarization up to +80 mV (Figs 1D and 8A, n = 6) or increased [Ca2+]i up to 1 mM (n = 6; data not shown). This is in contrast to those patches that displayed sustained channel activity (10 %), which showed voltage (Fig. 1D) and Ca2+ dependence (see Fig. 6) typical of BK channels reported by others in both hippocampal neurones (Ikemoto et al. 1989; Yoshida et al. 1991; Wann & Richards, 1994) and other tissues (Barrett et al. 1982; Latorre et al. 1982).
Figure 8. BK channel inactivation is Ca2+ dependent.
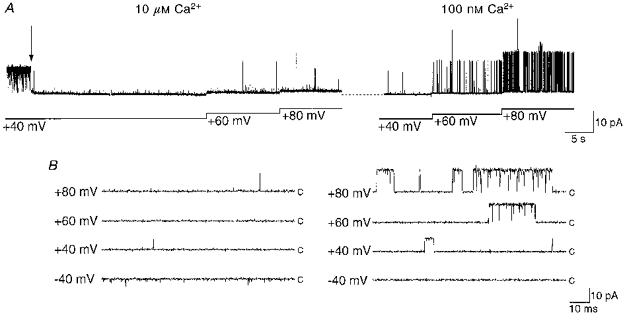
A, after two BK channels were inactivated at +40 mV (in the presence of 10 μM Ca2+), activity was not recovered by patch depolarization (left panel). After reducing [Ca2+]i to 100 nM (right panel), normal channel behaviour was seen. Patch depolarization revealed a voltage-dependent increase in channel activity, characterized by long duration bursts. B, on an expanded time scale, traces illustrate the short duration openings at each depolarized potential. Stepping the patch voltage to −40 mV in the presence of 10 μM Ca2+ (left panel) revealed the short ‘flickery’ openings characteristic of a destabilized block by the inactivation particle. Note the loss of ‘flickery’ openings at −40 mV after [Ca2+]i was reduced to 100 nM (right panel), indicating that inactivation was Ca2+ dependent.
Open duration histograms of sustained BK channel activity at +40 mV were best fitted by the sum of two exponentials (τ1, ∼0.34 ± 0.10 ms; τ2, ∼12.8 ± 2.2 ms; n = 6), with the longer time constant dominating the distribution (Fig. 1E). Following development of low Po, short duration activity, channel open times were still best fitted by the sum of two exponentials (τ1, ∼0.140 ± 0.007 ms; τ2, ∼3.0 ± 0.4 ms; n = 12; see Methods), but with short duration events dominating the distribution (Fig. 1F). These observations indicate that BK channels can be regulated by factors other than voltage and Ca2+.
Membrane hyperpolarization recovers BK channel activity
Following the development of channel inactivation, BK channels could be reactivated by membrane hyperpolarization (Fig. 2A). Hyperpolarizing voltage steps (1 min duration) resulted in a return of normal bursting channel activity after a delay dependent upon the degree of hyperpolarization (see below). Upon returning to the depolarized holding potential, high Po activity indistinguishable from that prior to inactivation was observed. Subsequently, inactivation again developed as described above, and in the majority of patches it was possible to produce cycles of inactivation and reactivation (not shown). However, it was often observed in extended recordings of up to 1 h that the ability to reactivate channels was lost. Figure 2A shows an example of a patch that contained a single channel that had been inactivated by voltage clamping the patch at +40 mV in the presence of 10 μM Ca2+. When the patch was stepped to −40 mV, high Po channel activity returned after approximately 30 s (marked by the arrow in Fig. 2A and in expanded trace iii in Fig. 2B) and no superimposed short openings were apparent (Fig. 2A). After long duration bursts of activity had returned, short duration events were not observed between bursts, or superimposed upon them (expanded traces iv and v in Fig. 2B). This observation indicates that short duration openings arose from the same channel that subsequently started bursting, showing that the gating of this channel had changed. The relationship between short duration openings and the return of long duration high Po activity is well illustrated in a patch containing two BK channels (Fig. 3A). After both channels were inactivated by holding at +40 mV, only short duration openings arising from two inactivated channels were initially evident at -80 mV (both blocked). After approximately 10 s, the frequency of short duration events decreased and one BK channel opened in long duration bursts as it left the inactivated state. The second channel still exhibited short duration openings, sometimes superimposed on the long duration bursts (‘1 unblocked’ in Fig. 3A). Subsequently, the second channel left the inactivated state after a further 8 s at -80 mV, resulting in a loss of all short duration openings, and a return of high Po activity. Occasional multiple level openings showed that both channels had recovered from inactivation (‘2 unblocked’ in Fig. 3A).
Figure 2. Membrane hyperpolarization recovers BK channel activity.
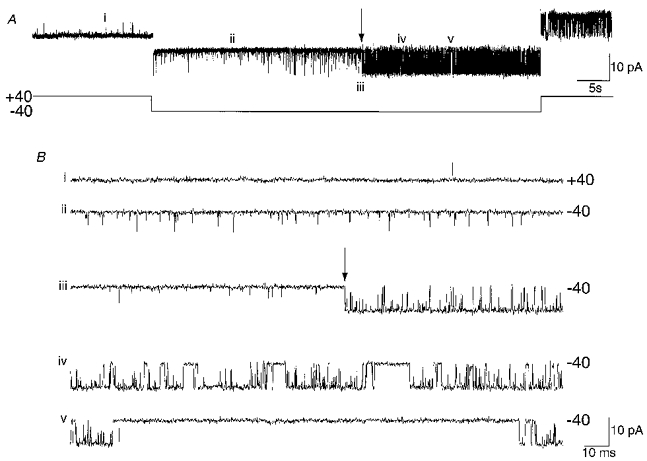
A, in the presence of 10 μM Ca2+ (+40 mV), a single BK channel showed low Po activity. A 1 min voltage step to −40 mV produced a return of high Po behaviour after ≈30 s (indicated by the arrow). A higher Po was observed at −40 mV than at +40 mV prior to the return of BK channel bursts, which appeared as increased ‘noise’ in the trace compared with that at +40 mV (see also Fig. 1D). High Po activity was observed upon returning to +40 mV. B, expanded traces taken from the corresponding points I–V indicated in A show the higher Po at −40 mV (ii) than at +40 mV (i) and the subsequent point of recovery of activity (arrow in iii) Note the lack of short openings during the closures following recovery from inactivation (iv and v).
Figure 3. A loss of short openings and return of bursts represent recovery from inactivation.
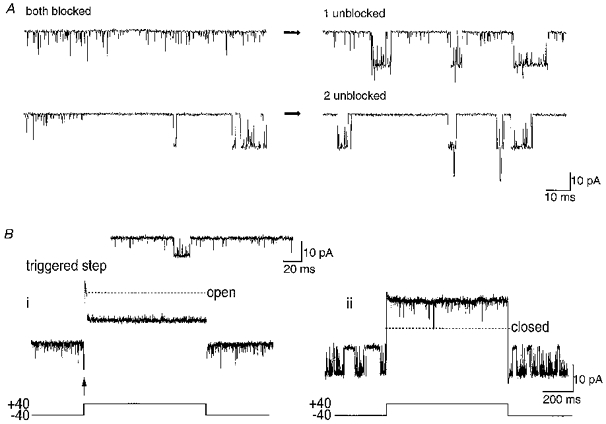
A, after two BK channels were inactivated at +40 mV, the patch was held at -80 mV. Initially, many short openings were observed (both blocked), indicating a presumed blocked state of the inactivated channels. Bursting behaviour returned to one open state level and this was accompanied by a reduction in the number of short openings (1 unblocked). Subsequently all short openings were lost and bursting of both channels returned, giving occasional multiple level openings (2 unblocked). B i, triggering of a voltage step from −40 to +40 mV from an isolated opening (> 2 ms duration, arrow; see inset), observed before the return of bursting behaviour, produced a single opening followed by a return to the inactivated state. In contrast, no channel openings were observed at +40 mV if steps began during a closure in the inactivated state (not shown). The inset shows an example of an isolated opening at −40 mV (10 μM Ca2+), surrounded by inactivated channel openings. B ii, after recovery from inactivation was observed as a return of BK channel bursts, sustained activity was observed for the duration of the step whether it began during an opening or a closure.
Before the return of long duration bursts of activity, rare isolated longer openings or short bursts of openings were observed. An example of such a long opening is shown in the inset in Fig. 3B, with short openings appearing both before and after. These openings had a mean duration of 2.8 ms (n = 3). It is pertinent to question whether this type of opening could represent recovery from inactivation or whether the return to bursting behaviour was essential for full recovery of high Po activity. This was investigated by stepping the patch to +40 mV upon the opening of an isolated long duration event, such as shown in the inset to Fig. 3B. After stepping the voltage during an opening, the channel remained open only for a very short time (Fig. 3B, trace i). However, when identical voltage steps were applied randomly while the channel was inactivated at −40 mV, channel openings were not observed (not shown). In contrast, stepping the patch voltage to +40 mV after the return of bursting behaviour always produced high Po activity for the whole duration of the step (Fig. 3B, trace ii), whether the channel was open or closed at the beginning of the voltage step. Therefore, it is clear that a return of bursting activity is required for complete recovery from inactivation.
Stepping the voltage during a rare long duration opening demonstrates that even at +40 mV the channel could not exhibit bursting activity. Figure 4A shows five examples of a voltage step to +40 mV imposed upon a long duration opening. In each example, a single opening was observed and was immediately followed by a return to the closed state for the remainder of the step. Generation of an ensemble current illustrates that this behaviour gives rise to a transient current during the prolonged depolarization (Fig. 4A). Analysis of open times of the channel at +40 mV from five patches was best fitted by a single exponential with a time constant of 2.86 ms (Fig. 4B). An ensemble average constructed from five patches produced a rapidly decaying current, which declined with an exponential time course (τ, ∼3.8 ms). The open time constant (τ, ∼2.86 ms) observed upon stepping the voltage during an opening was significantly shorter than that observed during sustained channel activity at this potential (12.8 ± 2.2 ms) (P < 0.05; Student's unpaired two-tailed t test). In addition, the similarity of the decay rate of the ensemble average and the open time constant of curtailed openings suggests that in most sweeps the channel did not re-open after inactivation. These data indicate that during the depolarizing steps as described the channel exhibited a shorter mean open time than observed during sustained activity, which may result from block of the open channel (see Discussion).
Figure 4. Stepping the voltage during a longer duration opening gives rise to a rapidly decaying current.
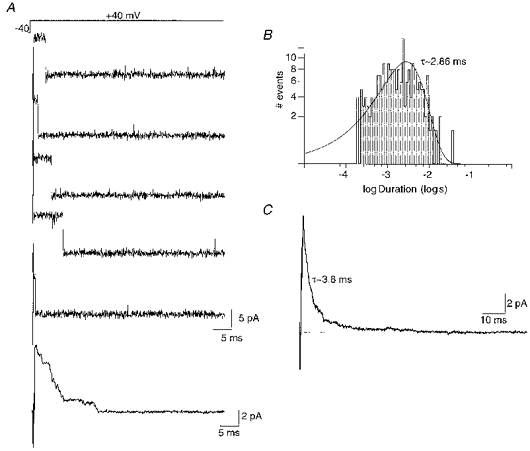
A, BK channel openings of greater than 2 ms duration were used to trigger a voltage step from −40 to +40 mV (see protocol, top). Leak and capacity currents were removed by subtraction of null sweeps. Instead of producing sustained activation, the voltage step promoted only short duration openings at +40 mV. Bottom trace, ensemble current constructed from twenty-three voltage steps showing the transient activation, with the current decaying during the depolarization. B, open duration histogram of events at +40 mV, produced by the triggered voltage step described in A. Data taken from five patches. Events are best fitted by a single exponential with a τ of 2.86 ms. C, ensemble current obtained by taking data from five patches following a triggered step as in A. This gave a transient current that decayed with an exponential time course (τ, ≈3.8 ms). The close similarity of this decay to the open time constant of channels observed upon stepping the voltage to +40 mV indicates that in most sweeps the channel did not reopen once it had entered the inactivated state.
Time-dependent recovery from inactivation is voltage dependent and dependent upon [K+]o
The time taken for channels to recover from inactivation was voltage dependent, decreasing exponentially with hyperpolarization (Fig. 5B). Recovery from inactivation was measured as the effect of membrane potential on the time taken to reach two points, the first fully resolved longer opening (see inset to Fig. 3B) (Fig. 5B, squares) and the point at which long duration bursts of activity returned (Fig. 5B, circles). Under isotonic potassium conditions, the time to observe both the first opening and the return of bursts was clearly voltage dependent. Examples of the first opening are shown in Fig. 5A with the times from the beginning of the hyperpolarizing steps indicated above the dotted lines. Note how the noise increases with hyperpolarization. This may result from the destabilization of inactivation by the inward flux of K+ ions. This hypothesis was confirmed by reducing the [K+]o to 30 mM, in order to reduce the driving force for inward K+ ion flux. Under these conditions the time taken for both the appearance of the first event and the return of long duration bursts was markedly increased (Fig. 5B). These data show that decreasing [K+]o increases the time required to recover from inactivation (see Discussion).
Figure 5. The rate of recovery from inactivation is voltage dependent and dependent on extracellular K+ concentration ([K+]o).
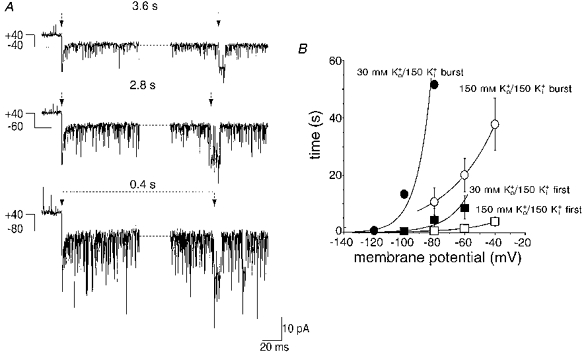
A, a patch containing inactivated channels at +40 mV (10 μM Ca2+) was stepped to the membrane potentials indicated (in mV) and the time until the first fully resolved opening (duration greater than 3 ms) was measured (indicated by the dotted lines). Note the increased noise with larger hyperpolarizing steps as the putative association of the inactivation particle is destabilized at these membrane potentials. B, voltage dependence of the time taken to the first fully resolved channel opening (first) and to the return of bursting behaviour (burst) during steps to negative potentials, with either 150 or 30 mM Ko+ in the presence of 150 mM Ki+. Both times were voltage dependent and the data were fitted with exponential functions. The voltage dependence of both times was greater with 30 mM Ko+. The time taken for the return of bursts decreased e-fold in 11 mV (30 mM Ko+) or 21 mV (150 mM Ko+) and the time taken for the first event decreased e-fold in 14 mV (30 mM Ko+) or 32 mV (150 mM Ko+). Lowering the [K+]o caused a slowing of both types of observed recovery. (Each data point is the mean of between two and six patches, with each patch providing a single determination. Error bars indicate s.e.m. and have been omitted from the 30 mM Ko+/150 mM Ki+ burst data where n = 2 due to the difficulty of obtaining stable recordings at the very hyperpolarized potentials.)
Intracellular trypsinization permanently reverses inactivation
Application of trypsin (1 mg ml−1, n = 14) to the cytoplasmic surface of excised patches containing inactivated BK channels caused an irreversible return to high Po behaviour (Fig. 6A). In addition to an increase in channel Po, trypsin treatment often increased the number of active channels in the patch beyond that estimated before inactivation had developed. The frequency of short duration openings of inactivated channels also decreased as inactivation was progressively removed by trypsin such that short duration openings were no longer seen once the effect of trypsin was maximal. The Po of channels treated with trypsin retained both Ca2+ and voltage sensitivity (Fig. 6B). Interestingly, channels treated with trypsin displayed a left-shifted activation curve in 10 μM Ca12+ when compared with non-inactivating channels (Fig. 6B). In contrast, no difference was observed in the voltage sensitivity of channel Po at 100 nM Ca12+ (Fig. 6B). These data indicate that the apparent calcium sensitivity of BK channels is sensitive to trypsin (see Discussion).
Intracellular TEA and ShB peptide disrupt inactivation
The association of the inactivation particle with the conduction pathway in ShB potassium channels can be disrupted by intracellular tetraethylammonium (TEA) ions (Choi, Aldrich & Yellen, 1991; Demo & Yellen, 1991). It has been suggested that the binding of TEA to the inner mouth of the channel pore occludes the binding site of the inactivation particle (Choi et al. 1991). TEA also blocks BK channels (with relatively low affinity) from the inside, by interacting with the mouth of the channel pore. This interaction produces ‘flickery’ gating and an apparent reduction of single channel conductance (Vergara & Latorre, 1983; Villarroel, Alvarez, Oberhausser & Latorre, 1988; Yoshida et al. 1991). When applied to the inner surface of hippocampal membrane patches containing inactivated BK channels at +40 mV, TEA (30 mM, n = 9) destabilized inactivation (Fig. 7). This was observed as either transient ‘reactivations’ (Fig. 7A, n = 6), of tens of seconds to minutes duration which were interspersed with periods of inactivation, or a reactivation sustained for the duration of the TEA application (n = 3, Fig. 7B). In contrast, transient reactivations were not observed in control conditions during steady-state recordings lasting up to 10 min. During the reactivations produced by TEA, the amplitude of the channel openings was reduced by ∼30 %. Removal of TEA reversed the change in amplitude, and allowed a return to the inactivated state (Fig. 7B). These observations suggest that the binding of TEA disrupts BK channel inactivation.
Figure 7. Intracellular application of TEA or ShB peptide disrupts endogenous BK channel inactivation.
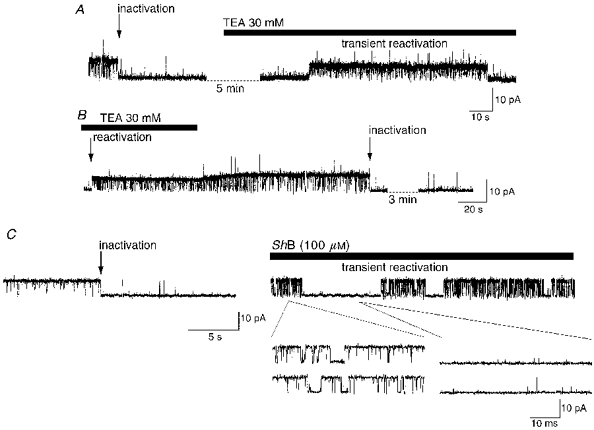
A, after BK channel inactivation at +40 mV (10 μM Ca2+), application of 30 mM TEA to the internal surface of the patch caused a transient reactivation of channel activity. Note the reduced amplitude of events in TEA, both before and after reactivation. B, in patches where a sustained reactivation was produced by intracellular TEA, inactivation (arrow) could be re-established by TEA removal, which can be observed as a progressive increase in single channel amplitude. C, after inactivation of a BK channel at +40 mV, low Po short open time behaviour was observed. Following addition of the ShB peptide (100 μM) to the internal surface of the patch the voltage was stepped to -60 mV for 1 min and then returned to +40 mV. In the presence of the ShB peptide, sustained inactivation was not re-established, instead characteristic short (left-hand expanded traces) and occasional long blocks were observed interspersed with periods of inactivation (right-hand expanded traces).
The ShB peptide has been proposed to produce short block periods by binding to the internal mouth of the BK channel (Foster, Chung, Zagotta, Aldrich & Levitan, 1992; Toro, Stefani & Latorre, 1992; Beirao, Davies & Stanfield, 1994). This is supported by the findings that both TEA and increased [K+]o compete with the peptide for the block (Foster et al. 1992; Toro et al. 1992). Application of the ShB peptide (100 μM) to the inner surface of inactivated hippocampal BK channels resulted in a disruption of inactivation (n = 5 of 6 applications). In three patches the peptide produced a reactivation of channels at +40 mV, producing sustained channel activity, similar to that observed with TEA. In two other patches, after channels were reactivated by hyperpolarization (to -60 mV) in the presence of ShB peptide, a competition between inactivation and peptide block was observed at +40 mV producing transient reactivation (Fig. 7C). This association of the ShB peptide with the channel pore produced characteristic short blocks. For example, three closed time constants (∼0.14, 0.8 and 96 ms, not shown) were apparent in the closed duration histogram of control patches following inactivation at +40 mV. However, in the presence of the peptide, brief openings of the inactivated channel (right-hand expanded traces) and transient reactivation displaying short blocked periods were observed (left-hand expanded traces). During transient reactivation, produced by the competition of the ShB peptide with the endogenous inactivation particle (Fig. 7C), a fourth component appeared due to the short blocks produced by the peptide (τ, ∼5.7 ms; not shown). BK channel open times during ShB block were similar to those observed during inactivation (τ, ∼0.15 and 4.5 ms; see above). These data suggest that the ShB peptide can compete with the endogenous inactivation particle for a site in the conduction pathway. In summary, the perturbation produced by TEA and ShB peptide, both of which are known to interact with the inner mouth of the channel pore, strongly suggests that the putative endogenous blocking particle interacts at a site also located in the channel pore to produce the observed inactivation.
BK channel inactivation is relieved by a reduction in [Ca2+]i
Following channel inactivation at +40 mV in the presence of 10 μM Ca2+, activity could be restored by reducing [Ca2+] to 100 nM (Fig. 8, n = 4), a level close to the resting [Ca2+]i in hippocampal neurones. This resulted in a return of normal voltage-dependent openings and the loss of short noisy openings at −40 mV (Fig. 8). Inactivation was thus removed by lowering [Ca2+]i, without patch hyperpolarization. Therefore, membrane hyperpolarization and the reduction of [Ca2+]i could work in concert to remove BK channel inactivation promoted by higher [Ca2+]i.
DISCUSSION
In most tissues BK channels exhibit sustained activity in the presence of a fixed [Ca2+]i. In contrast, BK channels recorded from membrane patches excised from dissociated hippocampal neurones displayed marked inactivation. This inactivation was characterized by a Ca2+-induced loss of channel activity at depolarized potentials. The resulting low Po channel activity was sustained in the continued presence of high [Ca2+]i, but could be reversed by membrane hyperpolarization or the lowering of [Ca2+]i to basal levels. Thus, an apparently paradoxical increase in the activity of these Ca2+- and voltage-activated BK channels was produced, during channel inactivation, by membrane hyperpolarization or reduction of [Ca2+]i (see Figs 1D and 8).
Examples of BK channel inactivation have been reported in a number of cell types, including skeletal muscle (Pallotta, 1985) and hippocampal pyramidal neurones (Ikemoto et al. 1989; McLarnon, 1995). The most thoroughly studied system is the inactivation of a distinct population of BK channels in rat adrenal chromaffin cells (Solaro & Lingle, 1992; Herrington, Solaro, Neely & Lingle, 1995; Solaro, Prakriya, Ding & Lingle, 1995). That process shows some similarities to fast inactivation of ShB potassium channels. For example, both are rapid and are abolished by cytosolic trypsin (Hoshi, Zagotta & Aldrich, 1990; Solaro & Lingle, 1992). Fast inactivation of ShB potassium channels is by interaction of a region of the NH2 terminus with the channel pore (Hoshi et al. 1990). The interaction of this cytoplasmic domain with the open channel was confirmed by the findings that it behaved much like an open channel blocker (Demo & Yellen, 1991). Our observations suggest that the inactivation of BK channels in hippocampal cells may also result from the interaction of an associated particle with the open channel pore. This is supported by a number of observations. Like inactivation of ShB K+ channels (Hoshi et al. 1990), hippocampal BK channel inactivation is relieved by membrane hyperpolarization (Fig. 2). The association of the inactivation particle with the ShB channel is proposed to be intracellular, because inactivation is removed by intracellular trypsin (Hoshi et al. 1990) and is perturbed by the extracellular K+ concentration (Demo & Yellen, 1991). Both intracellular trypsin (Fig. 6) and the extracellular K+ concentration (Fig. 5) had similar effects on BK channel inactivation. The observed effect of extracellular potassium also suggests that block by the putative inactivation particle may be of the open channel. This is supported by the observation of the rapid closure of the channel when the patch was depolarized upon a rare long duration opening (Figs 3B and 4). The channel displayed a statistically shorter open time at +40 mV following such a step, which suggests that the reclosure mechanism was different from the process that governs the normal channel open time. This is good evidence for an open channel blocking mechanism since if it were the closed channel that was blocked the open time under these conditions would be expected to be normal rather than curtailed. Finally, application of either TEA or purified ShB peptide to the cytoplasmic surface of patches containing an inactivated BK channel produced disruption of the inactivation, resulting in periods of high Po bursting activity (Fig. 7, cf. Choi, Aldrich & Yellen, 1991). This data further suggests an intracellular mechanism for inactivation. The open time distribution of inactivated channels possessed a minor long open time component of approximately 3 ms. This time constant was the same as that obtained when the voltage was stepped to +40 mV during a long duration opening at −40 mV (Fig. 4). This suggests that the longer time constant observed during prolonged inactivated activity may arise from brief sojourns out of the short duration open state scheme (see below).
The inactivation of BK channels in hippocampal neurones can be described by a model where channel block occurs from the open state (Fig. 9). Two discrete blocked states are proposed to account for the two open states observed during inactivation. The first blocked state (B1), possesses an open state that gives rise to the rare long duration opening (τ, ∼3 ms) (see Figs 1F, 3B and 4). This blocked state represents the first and last state the channel would reside in as it entered and finally exited inactivation. However, at [Ca2+] above 1 μM and at positive membrane potentials the channel will preferentially reside in blocked state B2. Once the channel has entered this state only low Po activity is observed and inactivation is complete (Fig. 9A). BK channel reactivation can be replicated by assuming that membrane hyperpolarization increases the rates for exiting each blocked state (Fig. 9B). The rate between block states B2 and B1 is increased to give the τ for observing the ‘first opening’ (see Fig. 5). The rate between B1 and the open state was set to give the τ for the appearance of bursts of activity (see Fig. 5). In summary, we suggest that inactivation of neuronal BK channels occurs as a block from the open state, allowing the channel to then enter two discrete blocked or inactivated states. Each inactivated state is proposed to give rise to an open state, producing the open state kinetics observed during inactivation. The channel is considered to exit the inactivation process once it traverses the B1 state back into the main open state.
Figure 9. Modelling of BK channel inactivation and reactivation.
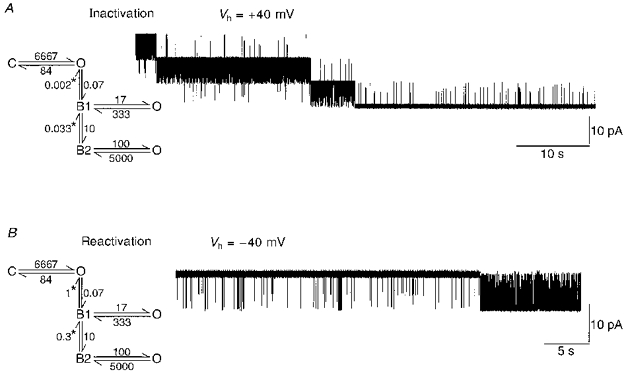
BK channels were modelled with the illustrated scheme. The channel gating in the absence of inactivation has been collapsed to a simple closed (C) - open (O) scheme. The chosen rates reflected the mean open time (12 ms) and fastest closed time (0.14 ms) obtained from dwell time analysis of sustained BK channel activity. A, BK channel inactivation was modelled at a holding potential (Vh) of +40 mV (assuming > 1 μM Ca2+). Inactivation occurred as a block of the open channel by an associated particle. Two blocked states were modelled, providing the two open times (0.2 and 3 ms) observed during inactivation (see Figs 1F and 4). The model was initiated with three channels in the primary open state. After approximately 3 s one channel inactivated by initially entering the first blocked state (B1). Brief channel openings (primarily from the B2 state) were observed superimposed on high Po activity from the other two channels. Governed by the rate entering the blocked state B1, the two remaining channels inactivated, leaving low Po short duration openings (see Fig. 1). B, BK channel reactivation was modelled at −40 mV, with membrane hyperpolarization increasing the rates for exiting the two blocked states (indicated by *). The transition rate between B2 and B1 was changed to reflect the time to the ‘first opening’ observed in Fig. 5. The rate between the blocked state B1 and the primary open state (O) was increased to reflect the observed time to bursts of activity at −40 mV (see Fig. 5). Both rates indicated by *, would change in exponential fashion with membrane hyperpolarization (see Fig. 5). With these rates, the model was initiated with a single channel residing in the blocked state, B2 (as if the channel was fully inactivated by preceding membrane depolarization). After approximately 30 s, the channel exited the final blocked state (B2) and high Po activity was observed.
Some of the long duration ‘shut’ periods exhibited by skeletal muscle BK channels in the presence of very high [Ca2+]i (Latorre et al. 1982; Barrett et al. 1982; Vergara & Latorre, 1983; Neyton & Miller, 1988; Neyton, 1996; Rothberg et al. 1996) may be a result of this type of inactivation. BK channel kinetics following inactivation are very similar to the Ca2+-dependent low activity mode described in skeletal muscle (Rothberg et al. 1996) which is not thought to be produced by Ba2+ block. In addition, the increase in apparent calcium sensitivity of BK channels following trypsin treatment (Fig. 6) supports the proposal that an inactivation process may occur which can regulate the apparent calcium sensitivity of this channel. Channels which displayed sustained activity at 10 μM Ca2+ commonly exhibited relatively long (hundreds of milliseconds to seconds) closures which were not observed in trypsinized patches or in the presence of 100 nM Ca2+ (not shown; cf. Rothberg et al. 1996). The effect of trypsin suggests that hippocampal BK channels exist associated with an endogenous inactivation particle which may produce either long shut periods within sustained activity or persistent inactivation.
Our observations suggest that hippocampal BK channels are capable of inactivating under conditions of raised intracellular Ca2+ and membrane depolarization, as produced during the firing of a burst of action potentials. In the present study, inactivation was observed in the presence of 1 or 10 μM Ca2+, which is within the physiological range of [Ca2+]i observed during neuronal activity (Guthrie, Segal & Kater, 1991). Recovery from inactivation would result from a subsequent fall in [Ca2+]i and membrane hyperpolarization following the cessation of firing. The rates at which inactivation and recovery occurred in the majority of patches in the present study were too slow to apply to a normal burst of action potentials. However, in nearly half of the patches inactivation occurred immediately (within hundreds of milliseconds) upon patch excision suggesting that a faster time course of inactivation is possible. Indeed, such rapid inactivation of hippocampal BK channels has been observed in cultured cells (G. A. Hicks & N. V. Marrion, unpublished observation; McLarnon, 1995). This rapid inactivation may underlie a transient Ca2+-sensitive K+ current that has been recorded from hippocampal slices. This current was blocked by extracellular divalent cations (such as Mn2+) and by low concentrations (5–10 mM) of extracellular TEA and was interpreted to be the result of activation of IC (now commonly referred to as BK channel current)(Brown & Griffith, 1983; Zbicz & Weight, 1985). Similar currents have been observed in vertebrate ganglia (MacDermott & Weight, 1982; Brown, Constanti & Adams, 1983) and PC12 cells (Pun & Behbehani, 1990). This transient current was reported to decay with a time constant of 3–4 ms (MacDermott & Weight, 1982), an identical value to the decay time constant of ensemble currents generated by a voltage step to +40 mV imposed during a longer duration opening (Fig. 4C).
Conversely, the accumulation of BK channel inactivation may underlie prolongation of epileptiform bursts. These bursts are terminated by the activation of BK channels (Alger & Nicoll, 1980; Alger & Williamson, 1988), which may represent the re-activation of BK channels. In support of this, charybdotoxin which potently blocks BK channels, has been shown to prolong epileptic bursts in CA1 hippocampal pyramidal neurones (Alger & Williamson, 1988). Inactivation of BK channels may also contribute to the slow depolarizing wave, which is associated with a loss of the fast after-hyperpolarization. This has been observed during both stimulated (Lancaster & Nicoll, 1987) and epileptic burst firing (Alger & Nicoll, 1980; Alger & Williamson, 1988), resulting in a cessation of firing due to the development of depolarization block. Recovery from inactivation produced by the fall in [Ca2+]i would then facilitate neuronal repolarization and the return of neuronal excitability.
Acknowledgments
We wish to thank Drs D. Shepherd, B. Hirschberg and S. J. Tavalin for critical reading of the manuscript. In addition, we thank Dr Chris Lingle for the generous gift of ShB peptide. This work was supported by The Wellcome Trust, UK (G. A. H.) and NS29806 (N. V. M.).
References
- Alger BE, Nicoll RA. Epileptiform burst after-hyperpolarization: calcium-dependent potassium potential in hippocampal CA1 pyramidal cells. Science. 1980;210:1122–1124. doi: 10.1126/science.7444438. [DOI] [PubMed] [Google Scholar]
- Alger BE, Williamson A. A transient calcium-dependent potassium component of the epileptiform burst after-hyperpolarization in rat hippocampus. The Journal of Physiology. 1988;399:191–205. doi: 10.1113/jphysiol.1988.sp017075. [DOI] [PMC free article] [PubMed] [Google Scholar]
- Barrett JN, Magleby K, Pallotta BS. Properties of single calcium-activated potassium channels in cultured rat muscle. The Journal of Physiology. 1982;331:211–230. doi: 10.1113/jphysiol.1982.sp014370. [DOI] [PMC free article] [PubMed] [Google Scholar]
- Beirao PSL, Davies NW, Stanfield PR. Inactivating ‘ball’ peptide from Shaker B blocks Ca2+-activated but not ATP-dependent K+ channels of rat skeletal muscle. The Journal of Physiology. 1994;474:269–274. doi: 10.1113/jphysiol.1994.sp020019. [DOI] [PMC free article] [PubMed] [Google Scholar]
- Brown DA, Constanti A, Adams PR. Ca-activated potassium current in vertebrate sympathetic neurons. Cell Calcium. 1983;4:407–420. doi: 10.1016/0143-4160(83)90017-9. [DOI] [PubMed] [Google Scholar]
- Brown DA, Griffith WH. Calcium-activated outward current in voltage-clamped hippocampal neurones of the guinea-pig. The Journal of Physiology. 1983;337:287–301. doi: 10.1113/jphysiol.1983.sp014624. [DOI] [PMC free article] [PubMed] [Google Scholar]
- Choi KL, Aldrich RW, Yellen G. Tetraethylammonium blockade distinguishes two inactivation mechanisms in voltage-activated K+ channels. Proceedings of the National Academy of Sciences of the USA. 1991;88:5092–5095. doi: 10.1073/pnas.88.12.5092. [DOI] [PMC free article] [PubMed] [Google Scholar]
- Demo SD, Yellen G. The inactivation gate of the Shaker K+ channel behaves like an open-channel blocker. Neuron. 1991;7:743–753. doi: 10.1016/0896-6273(91)90277-7. 10.1016/0896-6273(91)90277-7. [DOI] [PubMed] [Google Scholar]
- Diaz F, Wallner M, Stefani E, Toro L, Latorre R. Interaction of internal Ba2+ with a cloned Ca2+-dependent K+(hslo) channel from smooth muscle. Journal of General Physiology. 1996;107:399–407. doi: 10.1085/jgp.107.3.399. 10.1085/jgp.107.3.399. [DOI] [PMC free article] [PubMed] [Google Scholar]
- Fabiato A, Fabiato F. Calculator programs for computing the composition of the solutions containing multiple metals and ligands used for experiments in skinned muscle cells. Journal de Physiologie. 1979;75:463–505. [PubMed] [Google Scholar]
- Foster CD, Chung S, Zagotta WN, Aldrich RW, Levitan IB. A peptide derived from the Shaker B K+ channel produces short and long blocks of reconstituted Ca2+-dependent K+ channels. Neuron. 1992;9:229–236. doi: 10.1016/0896-6273(92)90162-7. 10.1016/0896-6273(92)90162-7. [DOI] [PubMed] [Google Scholar]
- Guthrie PB, Segal M, Kater SB. Independent regulation of calcium revealed by imaging dendritic spines. Nature. 1991;354:76–80. doi: 10.1038/354076a0. 10.1038/354076a0. [DOI] [PubMed] [Google Scholar]
- Hamill OP, Marty A, Neher E, Sakmann B, Sigworth FJ. Improved patch clamp techniques for high resolution current recording from cells and cell-free membrane patches. Pflügers Archiv. 1981;391:85–100. doi: 10.1007/BF00656997. [DOI] [PubMed] [Google Scholar]
- Herrington J, Solaro CR, Neely A, Lingle CJ. The suppression of Ca2+- and voltage-dependent K+ current during mAChR activation in rat adrenal chromaffin cells. The Journal of Physiology. 1995;485:297–318. doi: 10.1113/jphysiol.1995.sp020731. [DOI] [PMC free article] [PubMed] [Google Scholar]
- Horn R, Lange K. Estimating kinetic constants from single channel data. Biophysical Journal. 1983;43:207–223. doi: 10.1016/S0006-3495(83)84341-0. [DOI] [PMC free article] [PubMed] [Google Scholar]
- Hoshi T, Zagotta WN, Aldrich RW. Biophysical and molecular mechanisms of Shaker potassium channel inactivation. Science. 1990;250:533–538. doi: 10.1126/science.2122519. [DOI] [PubMed] [Google Scholar]
- Ikemoto Y, Ono K, Yoshida A, Akaike N. Delayed activation of large-conductance Ca2+-activated K channels in hippocampal neurons of the rat. Biophysical Journal. 1989;56:207–212. doi: 10.1016/S0006-3495(89)82665-7. [DOI] [PMC free article] [PubMed] [Google Scholar]
- Lancaster B, Nicoll RA. Properties of two calcium-activated hyperpolarizations in rat hippocampal neurons. The Journal of Physiology. 1987;389:187–203. doi: 10.1113/jphysiol.1987.sp016653. [DOI] [PMC free article] [PubMed] [Google Scholar]
- Latorre R, Oberhauser A, Labarca P, Alvarez O. Varieties of calcium-activated potassium channels. Annual Review of Physiology. 1989;51:385–399. doi: 10.1146/annurev.ph.51.030189.002125. [DOI] [PubMed] [Google Scholar]
- Latorre R, Vergara C, Hidalgo C. Reconstitution in lipid bilayers of a Ca2+-dependent K+ channel from transverse tubule membranes isolated from rabbit skeletal muscle. Proceedings of the National Academy of Sciences of the USA. 1982;79:805–809. doi: 10.1073/pnas.79.3.805. [DOI] [PMC free article] [PubMed] [Google Scholar]
- MacDermott AB, Weight FF. Action potential repolarization may involve a transient, Ca2+-sensitive K+ current in a vertebrate neurone. Nature. 1982;300:185–188. doi: 10.1038/300185a0. [DOI] [PubMed] [Google Scholar]
- McDonough SI, Swartz KJ, Mintz IM, Boland LM, Bean BP. Inhibition of calcium channels in rat central and peripheral neurones by ω-conotoxin MVIIC. Journal of Neuroscience. 1996;16:2612–2623. doi: 10.1523/JNEUROSCI.16-08-02612.1996. [DOI] [PMC free article] [PubMed] [Google Scholar]
- McLarnon JG. Inactivation of a high conductance calcium dependent potassium current in rat hippocampal neurons. Neuroscience Letters. 1995;193:5–8. doi: 10.1016/0304-3940(95)11651-c. [DOI] [PubMed] [Google Scholar]
- Neyton J. A Ba2+ chelator suppresses long shut events in fully activated high-conductance Ca2+-dependent K+ channels. Biophysical Journal. 1996;71:220–226. doi: 10.1016/S0006-3495(96)79218-4. [DOI] [PMC free article] [PubMed] [Google Scholar]
- Neyton J, Miller C. Potassium blocks barium permeation through a calcium-activated potassium channel. Journal of General Physiology. 1988;92:549–567. doi: 10.1085/jgp.92.5.549. [DOI] [PMC free article] [PubMed] [Google Scholar]
- Pallotta BS. Calcium-activated potassium channels in rat muscle inactivate from a short-duration open state. The Journal of Physiology. 1985;363:501–516. doi: 10.1113/jphysiol.1985.sp015724. [DOI] [PMC free article] [PubMed] [Google Scholar]
- Pun RYK, Behbehani MM. A rapidly inactivating Ca2+-dependent K+ current in pheochromocytoma cells (PC12) of the rat. Pflügers Archiv. 1990;415:425–432. doi: 10.1007/BF00373619. [DOI] [PubMed] [Google Scholar]
- Rothberg BS, Bello RA, Song L, Magleby KL. High Ca2+ concentrations induce a low activity mode and reveal Ca2+-independent long shut intervals in BK channels from rat muscle. The Journal of Physiology. 1996;493:673–689. doi: 10.1113/jphysiol.1996.sp021414. [DOI] [PMC free article] [PubMed] [Google Scholar]
- Sigworth FJ, Sine SM. Data transformations for improved display and fitting of single-channel dwell time histograms. Biophysical Journal. 1987;52:1047–1054. doi: 10.1016/S0006-3495(87)83298-8. [DOI] [PMC free article] [PubMed] [Google Scholar]
- Solaro CR, Lingle CJ. Trypsin-sensitive, rapid inactivation of a calcium-activated potassium channel. Science. 1992;257:1694–1698. doi: 10.1126/science.1529355. [DOI] [PubMed] [Google Scholar]
- Solaro CR, Prakriya M, Ding JP, Lingle CJ. Inactivating and non-inactivating Ca2+- and voltage-dependent K+ current in rat adrenal chromaffin cells. Journal of Neuroscience. 1995;15:6110–6123. doi: 10.1523/JNEUROSCI.15-09-06110.1995. [DOI] [PMC free article] [PubMed] [Google Scholar]
- Storm JF. Action potential repolarization and a fast afterhyperpolarization in rat hippocampal pyramidal cells. The Journal of Physiology. 1987;385:733–759. doi: 10.1113/jphysiol.1987.sp016517. [DOI] [PMC free article] [PubMed] [Google Scholar]
- Toro L, Stefani E, Latorre R. Internal blockade of a Ca2+-activated K+ channel by Shaker B inactivating ‘ball’ peptide. Neuron. 1992;9:237–245. doi: 10.1016/0896-6273(92)90163-8. [DOI] [PubMed] [Google Scholar]
- Vergara C, Latorre R. Kinetics of Ca2+-activated K+ channels from rabbit muscle incorporated into planar bilayers. Evidence for a Ca2+ and Ba2+ blockade. Journal of General Physiology. 1983;82:543–568. doi: 10.1085/jgp.82.4.543. [DOI] [PMC free article] [PubMed] [Google Scholar]
- Villarroel A, Alvarez O, Oberhausser A, Latorre R. Probing a Ca2+-activated channel with quaternary ammonium ions. Pflügers Archiv. 1988;413:118–126. doi: 10.1007/BF00582521. [DOI] [PubMed] [Google Scholar]
- Wann KT, Richards CD. Properties of single calcium-activated potassium channels of large conductance in rat hippocampal neurones in culture. European Journal of Neuroscience. 1994;6:607–617. doi: 10.1111/j.1460-9568.1994.tb00305.x. [DOI] [PubMed] [Google Scholar]
- Yoshida A, Oda M, Ikemoto Y. Kinetics of the Ca2+-activated K+ channel in rat hippocampal neurons. Japanese The Journal of Physiology. 1991;41:297–315. doi: 10.2170/jjphysiol.41.297. [DOI] [PubMed] [Google Scholar]
- Zbicz KL, Weight FF. Transient voltage and calcium-dependent outward currents in hippocampal CA3 pyramidal neurones. Journal of Neurophysiology. 1985;53:1038–1058. doi: 10.1152/jn.1985.53.4.1038. [DOI] [PubMed] [Google Scholar]


