

Abstract
Using tracer methodology, endogenous glucose production was measured in twenty-six chronically catheterized sheep fetuses during normal fed conditions and in response to a 48 h period of maternal fasting at different gestational ages during the last 10–15 days of gestation (term, 145 ± 2 days).
In normal fed conditions, the rate of fetal glucose production was negligible until 143–145 days when it rose significantly to account for 50 % of the glucose used by the fetus. The rise in fetal glucogenesis towards term closely parallelled the normal prepartum rise in fetal plasma cortisol and catecholamines.
Maternal fasting for 48 h induced endogenous glucose production in fetuses at 139–141 days but not at 133–135 days of gestation. Maternal fasting also induced increases in the plasma cortisol and noradrenaline levels in all the fetuses studied. Fetal plasma cortisol levels at the end of the fast and the increment in fetal plasma cortisol during maternal fasting were significantly greater in the older groups of fasted animals.
When the data from all the fetuses were combined, partial correlation analysis of fetal glucose production and the log plasma concentrations of cortisol and total catecholamines showed that plasma cortisol was the predominant regulator of fetal glucogenesis during late gestation. However, once plasma cortisol levels exceeded 17.5 ng ml−1, plasma catecholamines were a major influence on fetal glucogenesis.
The results show that glucogenesis occurs in fetal sheep during late gestation in conditions in which the fetal plasma concentrations of cortisol and catecholamines are elevated. They also suggest that cortisol enhances the capacity for glucogenesis in utero, while catecholamines actually activate glucose production in sheep fetuses close to term.
Glucogenesis is essential for neonatal survival and has been demonstrated in newborn lambs within minutes of birth at full term (Warnes, Seamark & Ballard, 1977; Mellor, 1988). However, before birth, there is little, if any, endogenous glucose production in normal conditions, although significant glucogenesis has been observed in fetal sheep in response to adverse intrauterine conditions such as hypoxia, cord compression and prolonged undernutrition during late gestation (Hay, Sparks, Wilkening, Battaglia & Meschia, 1984; Owens, Falconer & Robinson, 1987; Rudolph, Roman & Rudolph, 1989a;Dalinghaus, Rudolph & Rudolph, 1991). The mechanisms for glucogenesis therefore develop before birth and can be activated in utero in certain circumstances (see Fowden, 1995).
In normal fetuses during the last 5–10 days of gestation, there are increases in the circulating concentrations of cortisol and the catecholamines, adrenaline and noradrenaline (Silver & Fowden, 1991). These hormones are known to stimulate hepatic glucose output when given exogenously to fetal sheep near term and their concentrations in utero are elevated during adverse intrauterine conditions associated with fetal glucose production (Owens et al. 1987; Apatu & Barnes, 1991; Townsend, Rudolph & Rudolph, 1991; Silver & Fowden, 1991; Unno, Giussani, Man A Hing, Ding, Collins & Nathanielsz, 1997). The prepartum cortisol rise has also been shown to induce hepatic glycogen deposition and activity of the key rate limiting enzymes required for glucogenesis in the sheep fetus (Barnes, Comline & Silver, 1978; Fowden, Mijovic & Silver, 1993). However, relatively little is known about the actual rate of fetal glucose production during the immediate prepartum period when the glucogenic capacity is high and fetal cortisol and catecholamine levels are rising naturally. Hence, in the present study, the rates of glucose production have been measured in chronically catheterized sheep fetuses in fed and fasted states at intervals during the last 15 days of gestation.
METHODS
Animals
A total of twenty-six Welsh Mountain ewes carrying single fetuses of known gestational age were used in this study. All the fetuses were alive at delivery. The ewes were housed in individual pens and maintained on concentrates (200 g day−1; Beart Ltd, Stowbridge, Suffolk, UK), and hay and water ad libitum. Half the daily ration of concentrates was fed at 08.00 h while the remainder was given at 17.00 h. Food, but not water, was withheld for 18–24 h before surgery.
Surgical procedures
Between 115–130 days of gestation (term, 145 ± 2 days), catheters were inserted into the umbilical vein, fetal dorsal aorta and caudal vena cava and into the maternal femoral artery under halothane anaesthesia (1.5 % in a mixture of O2 and NO2) using surgical procedures described previously (Comline & Silver, 1972). Antibiotics were given intravenously to the fetus at the end of surgery (100 mg ampicillin; Penbritin Beecham Research, Welwyn Garden City, Herts, UK) and intramuscularly to the mother (900 mg procaine penicillin; Depocillin Mycofarm Ltd, Cambridge, UK) on the day of surgery and for 3 days thereafter. At the end of the experimental period, the fetuses were delivered by Caesarean section under general anaesthesia (20 mg kg−1i.v. sodium pentobarbitone).
Experimental procedures
Blood samples of 0.5–1.0 ml were taken daily between 09.00 and 10.00 h from the fetus and mother to monitor fetal well-being. At least 7 days after catheterization, measurements of fetal glucose and oxygen (O2) metabolism were made in the fed state at the following gestational ages: 130–132 days (n = 6), 133–135 days (n = 4), 136–138 days (n = 6), 139–141 days (n = 5) and 143–145 days (n = 5). Following the studies at 130–132 and 136–138 days, food but not water was withdrawn from the ewes and a second set of measurements were made in the fasted state either at 133–135 days (n = 5, Group I) or at 139–141 days of gestation (n = 5, Group II) when the animals had been without food for 48 h. In both fed and fasted animals, tritiated water (8 μCi ml−1; Amersham International, Bucks, UK) and universally labelled [14C]glucose (10 μCi ml−1 in 0.09 % NaCl (w/v); ICN Biochemicals, High Wycombe, Bucks, UK) were infused together into the fetal caudal vena cava for 2–4 h at known rates of between 0.08 and 0.09 ml min−1 after an initial priming dose (3–4 ml). Blood samples (3.5 ml) were taken simultaneously from the umbilical vein, fetal artery and maternal artery before (0 min) and, when steady state had been established, at known times approximately 120, 140, 160 and 180 min after beginning the infusion at 09.00–10.00 h.
The simultaneous blood samples were analysed immediately for blood pH, gas tension, packed cell volume (PCV) and O2 content (0.5 ml) and for [14C]carbon dioxide (14CO2) where appropriate (1.0 ml). The remainder of the sample (2 ml) was added to a chilled tube containing EDTA for subsequent analyses. An aliquot (0.5 ml) of the EDTA-treated blood was deproteinized with zinc sulphate (0.3 M) and barium hydroxide (0.3 M) and the supernatant used for determination of both 14C-labelled and total concentrations of blood glucose. The remaining EDTA sample was centrifuged at 4°C and the plasma stored at -20°C until required for 3H2O and hormone measurements. An additional aliquot of fetal arterial blood (1.0 ml) was taken at 0 min and placed in a chilled heparinized tube containing EGTA (5.0 μmol ml−1 blood) and glutathione (40 μmol ml−1 blood) for catecholamine assay. These samples were centrifuged immediately at 4°C and the plasma stored at -80°C until analysis.
At the end of the experimental period, the fetuses were delivered by Caesarean section and weighed. A sample of liver (5–10 g) was collected from all the fetuses after administration of a lethal dose of anaesthetic (200 mg kg−1 sodium pentobarbitone i.v.). The tissue was frozen immediately in liquid nitrogen and stored at -80°C until analysed for glycogen content and activity of glucose-6-phosphatase, the final rate-limiting enzyme of both the glycogenolytic and gluconeogenic pathways. Tissue was therefore collected in the fed state at 133–135 days (n = 4), 139–141 days (n = 5) and 143–145 days (n = 5), and in the fasted state at 133–135 days (n = 5) and 139–141 days (n = 5) of gestation. The position of all catheters was also verified at autopsy.
Biochemical analyses
The blood gas status, packed cell volume (PCV), O2 content and whole blood concentrations of glucose, [14C]glucose, 3H2O and 14CO2 were measured in all five sets of simultaneous samples in fed and fasted animals. Blood O2 content was calculated from the percentage O2 saturation and the haemoglobin concentration measured using a OSM2 Hemoximeter (Radiometer, Copenhagen, Denmark) that had been calibrated with ovine blood (Owens et al. 1987). Blood pH, and partial pressures of O2 and CO2 were measured using an ABL 330 Radiometer and corrected for a fetal body temperature of 39°C.
The concentration of whole blood glucose was determined enzymatically with glucose oxidase (Sigma) while 3H2O concentrations were measured in plasma using a scintillation counter. The latter values were corrected for quenching and converted to blood concentrations as described by Bell, Battaglia & Meschia (1987). Labelled glucose and CO2 were determined using chemical methods described previously (Hay, Sparks, Quissell, Battaglia & Meschia, 1981; Hay, Myers, Sparks, Wilkening, Meschia & Battaglia, 1983; Fowden & Hay, 1988). Labelled glucose was measured specifically by separating it from all other 14C labelled products by anion exchange chromatography following pre-incubation with and without glucose oxidase (Hay et al. 1981; Fowden & Hay, 1988). The mean recovery of [14C]glucose from the anion exchange columns was 99.4 ± 1.2 % (n = 36). No corrections for glucose recovery were therefore made. In contrast, the mean recovery of 14CO2 was 71.9 ± 0.6 % (n = 22), and hence all blood 14CO2 values have been corrected for recovery.
Plasma catecholamine concentrations were determined by high pressure liquid chromatography using electrochemical detection (Silver, Fowden, Knox, Ousey, Franco & Rossdale, 1987). The samples were prepared by absorption of 300–500 μl of plasma onto acid-washed alumina and 20 μl aliquots of the 100 μl perchloric acid elutes were injected onto the column. Isoprenaline (isoproterenol) was added as the internal standard to each plasma sample before absorption. Recovery ranged from 63 to 97 % and all catecholamine values have been corrected for their respective recoveries. The limits of sensitivity of the method were 70 pg ml−1 for adrenaline and 50 pg ml−1 for noradrenaline. The interassay coefficients of variation for adrenaline and noradrenaline were 7.3 and 6.2 %, respectively. Plasma insulin and cortisol concentrations were measured by radioimunoassay validated for ovine plasma as described previously (Fowden, 1980; Robinson, Comline, Fowden & Silver, 1983). The interassay coefficients of variation for the cortisol and insulin assays were 10.0 and 13.7 %, respectively, and the minimum detectable quality of hormone was 10–30 pg ml−1 for cortisol and 5.0 μU ml−1 for insulin.
Hepatic levels of glycogen and glucose-6-phosphatase (G6P, EC 3.1.3.9) were assayed using established methods described in detail elsewhere (Barnes et al. 1978; Fowden et al. 1993). Hormone concentrations were measured in duplicate while all other biochemical analyses were determined in triplicate.
Calculations
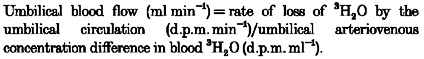
All calculations were made using equations derived for steady-state kinetics. Umbilical blood flow was measured using the 3H2O steady-state diffusion technique (Meschia, Cotter, Makowski & Barron, 1966) and calculated according to the following equation:
 |
(1) |
Net umbilical uptake rates of glucose, lactate and oxygen, and net umbilical excretion rates of [14C]glucose and 14CO2 were calculated by the Fick principle as the product of umbilical blood flow and the venous-arterial (uptake) or arterial-venous (excretion) concentration difference across the umbilical circulation.
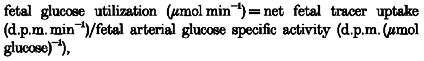
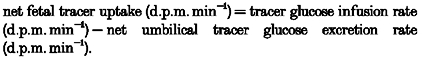
The fetal rates of utilization and production of glucose, CO2 production from glucose carbon, and the fraction of the net umbilical oxygen uptake used for oxidation of glucose carbon by the fetus were calculated according to the following equations (Hay et al. 1981, 1983; Fowden & Hay, 1988):
 |
(2) |
where
 |
(3) |
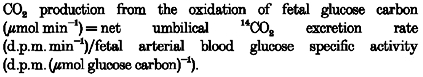
Oxidation of fetal glucose carbon was calculated as the rate of 14CO2 production:
 |
(4) |
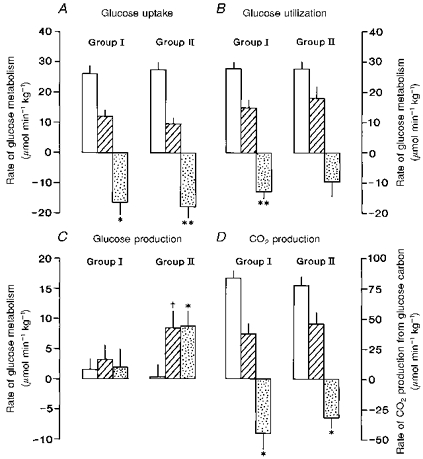
The glucose carbon oxidation fraction and the fraction of oxygen consumption used to oxidize glucose carbon in the fetus were then calculated as follows:
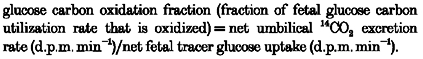 |
(5) |
 |
(6) |
where
| (7) |
Endogenous glucose production by the fetus was calculated as follows:
| (8) |
When two studies were carried out in a single animal, the values for [14C]glucose and 14CO2 in the 0 min arterial and umbilical venous samples of the second study were substrated from the values in the subsequent corresponding samples before calculation of the glucose metabolic rates. All metabolic rates have been expressed per kilogram fetal bodyweight. No increase in fetal bodyweight was assumed to occur during the 48 h period of maternal food withdrawal (Mellor, 1988).
Statistical analyses
Steady state was defined as < 10 % variation of values around the mean for each sampling period with no consistent trend for the absolute values or venous-arterial concentration differences to increase or decrease with time. Mean values ±s.e.m. have been used throughout. Statistical analyses were made according to the methods of Armitage (1971). Statistical significance between groups was assessed using one-way ANOVA with Fisher's projected least significant differences, Student's paired and unpaired t tests, where appropriate. Simple and partial correlation coefficients were calculated by regression analyses and assessed for significance using Fisher's t test. In evaluating the endocrine control of fetal glucogenesis, data from animals with plasma cortisol concentrations greater and less than 17.5 ng ml−1 were analysed separately. This value is the maximum level of fetal plasma cortisol measured during basal conditions before term in our laboratory (Barnes et al. 1978; Robinson et al. 1983). For all statistical analyses significance was accepted when P < 0.05.
RESULTS
The effects of gestational age
Table 1 shows the weight-specific rates of umbilical uptake, utilization and production of glucose, and of CO2 production from glucose carbon in sheep fetuses in the fed state at different gestational ages. The rates of fetal glucose utilization and CO2 production from glucose carbon did not change significantly with increasing gestational age (Table 1) and were similar to the values reported previously for well-fed animals in late gestation (Hay et al. 1983; Fowden & Hay, 1988). For most of the period of gestation examined in the present study umbilical glucose uptake was not significantly different from fetal glucose utilization and, hence, the rate of endogenous glucose production by the fetus was negligible (Table 1). However, at 143–145 days, umbilical glucose uptake fell to a mean value which was significantly less than that seen in any of the other groups of fetuses (Table 1). There was therefore a significant rate of endogenous glucose production in the fetuses closest to term (Table 1). At 143–145 days, fetal glucogenesis was accompanied by a rise in the fetal glucose level. The mean fetal concentration of blood glucose was significantly higher at 143–145 days than that measured earlier in gestation, despite no significant gestational trend in the maternal blood glucose level (Table 1).
Table 1.
Arterial glucose concentrations in fetal and maternal blood, and mean fetal rates of umbilical uptake, utilization and production of glucose, and of CO2 production from glucose carbon in sheep in the fed state with respect to gestational age
| Arterial glucose level (mmol l−1) | Fetal rates of glucose metabolism (μmol min−1 kg−1) | |||||
|---|---|---|---|---|---|---|
| Gestational age (days) | Fetus | Mother | Umbilical uptake | Utilization | Production | CO2 production |
| 130–132 (6) | 0.77 ± 0.03a,b | 2.25 ± 0.07 | 26.7 ± 2.2a | 28.0 ± 1.5 | 1.7 ± 1.5a | 85.9 ± 5.5 |
| 133–135 (4) | 0.70 ± 0.09a | 2.31 ± 0.18 | 28.6 ± 2.1a | 30.1 ± 3.3 | 1.5 ± 2.2a | 106.8 ± 10.5 |
| 136–138 (6) | 0.83 ± 0.07a,b | 2.33 ± 0.11 | 29.3 ± 3.0a | 28.8 ± 2.5 | -0.5 ± 1.8a | 87.9 ± 9.6 |
| 139–141 (5) | 0.94 ± 0.07b | 2.43 ± 0.18 | 30.0 ± 0.6a | 33.1 ± 2.7 | 3.4 ± 2.0a | 89.7 ± 11.6 |
| 143–145 (5) | 1.14 ± 0.08c | 2.77 ± 0.19 | 17.0 ± 2.2b | 33.9 ± 3.7 | 16.9 ± 1.9b† | 111.7 ± 3.3 |
Values are means ±s.e.m.; number of animals in parentheses.
P < 0.01 (paired t test): significant rate of glucose production. Values within columns with different superscripts are significantly different from each other: P < 0.05 (ANOVA). Values within columns with no superscript show no significant gestational trend: P > 0.05 (ANOVA).
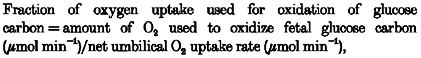
Towards term, fetal glucose production rose in parallel with the fetal plasma cortisol and catecholamine concentrations, and with the glycogen content and G6P activity of the fetal liver (Fig. 1). The mean levels of hepatic glycogen and G6P were significantly higher at 143–145 days than earlier in gestation (Fig. 1): findings in common with those published previously (Barnes et al. 1978; Fowden et al. 1993). Similarly, fetal plasma cortisol and total catecholamine concentrations were highest in the fetuses closest to term in the present study (Fig. 1). The prepartum rise in the total catecholamine concentration in utero was due primarily to an increase in plasma adrenaline, as plasma noradrenaline showed no significant gestational trend (Fig. 1). There was also no significant change in the fetal plasma insulin level with increasing gestational age towards term: mean fetal plasma insulin at 130–132 days (17.7 ± 2.5 μU ml−1, n = 6) was similar to that at 143–145 days (22.0 ± 2.5 μU ml−1, n = 5).
Figure 1. Gestational trend in fetal glucose production.
Mean (±s.e.m.) values of endogenous glucose production (▴), plasma cortisol (▾), plasma adrenaline (○), plasma noradrenaline ( ) and total plasma catecholamines (•) and of hepatic glycogen (▪) and glucose-6-phosphatase (G6P; □) in sheep fetuses with respect to gestational age. Data are plotted at the mean gestational age for each age group. n = 4–6 at each age. Values with different letters are significantly different from each other: P < 0.05 (ANOVA). † Data from Fowden et al. 1993. *P < 0.01 (paired t test): significant rate of glucose production.
Umbilical blood flow and O2 uptake also showed no significant changes in value with increasing gestational age when values were expressed on a weight specific basis (Table 2). Nor were there any significant gestational trends in the glucose oxidation fraction or the fraction of umbilical O2 uptake used for oxidation of glucose carbon in the fetus (Table 2). In addition, there were no significant differences in blood pH, gas tensions or PCV between any of the groups of fetuses (data not shown); all values were within the normal ranges published previously for Welsh Mountain sheep fetuses in late gestation (Comline & Silver, 1972).
Table 2.
Bodyweight at delivery, umbilical blood flow and O2 uptake and fractions of O2 uptake used to oxidize glucose carbon and of the rate of glucose carbon utilization that was oxidized in sheep fetuses in the fed state with respect to gestational age during late gestation
| Umbilical | |||||
|---|---|---|---|---|---|
| Gestational age range (days) | Blood flow (ml min−1 kg−1) | O2 uptake (μmol min−1 kg−1) | Fraction of O2 uptake used to oxidize glucose carbon | Glucose oxidation fraction | Body weight (kg) |
| 130–132 (6) | 182 ± 10 | 276 ± 13 | 0.316 ± 0.029 | 0.517 ± 0.042 | 3.070 ± 0.090 a,b† |
| 133–135 (4) | 189 ± 15 | 263 ± 7 | 0.407 ± 0.044 | 0.621 ± 0.106 | 2.679 ± 0.328 a |
| 136–138 (6) | 184 ± 15 | 298 ± 13 | 0.293 ± 0.020 | 0.523 ± 0.061 | 3.392 ± 0.243 b† |
| 139–141 (5) | 195 ± 9 | 291 ± 14 | 0.308 ± 0.034 | 0.463 ± 0.026 | 3.544 ± 0.226 b,c |
| 143–145 (5) | 194 ± 15 | 295 ± 11 | 0.370 ± 0.018 | 0.606 ± 0.097 | 4.113 ± 0.100 c |
Values are means ±s.e.m.; number of animals in parentheses.
Includes values obtained 2–3 days later in gestation after maternal fasting for 48 h. Values within columns with different superscripts are significantly different from each other: P < 0.05 (ANOVA). Values within columns with no superscripts show no significant gestational trend: P > 0.05 (ANOVA).
The effects of maternal fasting
Maternal fasting for 48 h reduced fetal and maternal concentrations of blood glucose by 30–40 % in both gestational age groups studied (Table 3). The degree of hypoglycaemia induced by fasting and the mean decrements in fetal and maternal blood glucose concentrations during the 48 h period of food withdrawal were similar in animals from Groups I and II (Table 3). Umbilical glucose uptake also fell significantly during the 48 h period of maternal fasting at both gestational ages (Fig. 2): mean decreases were similar in the two age groups (Fig. 2). In Group I, there was also a significant reduction in the rate of fetal glucose utilization during maternal fasting which was of similar magnitude to the fall in umbilical glucose uptake (Fig. 2). Fetal glucose production therefore remained negligible during maternal fasting for 48 h in Group I (Fig. 2). In Group II ewes fasted later in gestation, there was also a tendency for the rate of fetal glucose utilization to fall, but the mean decrement was not significant (Fig. 2). Significant glucose production (8.5 ± 2.9 μmol min−1 kg−1, n = 5, P < 0.05) therefore occurred in the fetus in response to a 48 h period of maternal fasting in Group II (Fig. 2). No fetal glucose production was found in the fed state at the same gestational age as the fasted Group II animals (139–141 days, 3.4 ± 2.0 μmol min−1 kg−1, n = 5; Table 1).
Table 3.
Fetal and maternal arterial concentrations of plasma glucose and of fetal arterial plasma insulin, cortisol, adrenaline, noradrenaline and total catecholamines in both the fed and fasted state and the mean change in value during the 48 h period of maternal fasting in Group I and Group II animals
| Group I | Group II | |||||
|---|---|---|---|---|---|---|
| Fed | Fasted | Mean change | Fed | Fasted | Mean change | |
| Glucose (mmol l−1) | ||||||
| Fetus | 0.78 ± 0.03 | 0.41 ± 0.05 | −0.37 ± 0.04 †† | 0.82 ± 0.09 | 0.53 ± 0.04 | −0.29 ± 0.06 †† |
| Mother | 2.23 ± 0.08 | 1.11 ± 0.12 | −1.12 ± 0.19 †† | 2.34 ± 0.14 | 1.18 ± 0.11 | −1.16 ± 0.19 †† |
| Insulin (μU ml−1 | 15.6 ± 0.4 | 12.4 ± 1.0 | −3.2 ± 1.0 † | 21.6 ± 2.1 | 14.0 ± 1.6 | −7.6 ± 1.4 †† |
| Cortisol (ng ml−1) | 10.0 ± 2.4 | 16.0 ± 1.4 | +6.0 ± 1.9 † | 12.4 ± 2.6 | 41.0 ± 10.0 * | +28.6 ± 9.9 ††* |
| Adrenaline (pg ml−1) | 66 ± 45 | 142 ± 45 | +74 ± 63 | 45 ± 30 | 65 ± 40 | +20 ± 11 |
| Noradrenaline (pg ml−1) | 338 ± 83 | 614 ± 74 | +272 ± 74 † | 353 ± 155 | 880 ± 268 | +528 ± 295 |
| Total catecholamines (pg ml−1) | 404 ± 94 | 736 ± 72 | +332 ± 126 | 398 ± 154 | 945 ± 233 | +548 ± 288 |
Values are means ±s.e.m. Group I animals were in the fed state at 130–132 days and in the fasted state at 133–135 days (n = 5 for all values); Group II animals were in the fed state at 136–138 days and in the fasted state at 139–141 days (n = 5 for glucose, insulin and cortisol data; n = 4 for catecholamine data).
P < 0.05
P < 0.01 (paired t test): significant change during fasting.
P < 0.05 (unpaired t test): significantly different from corresponding value in Group I.
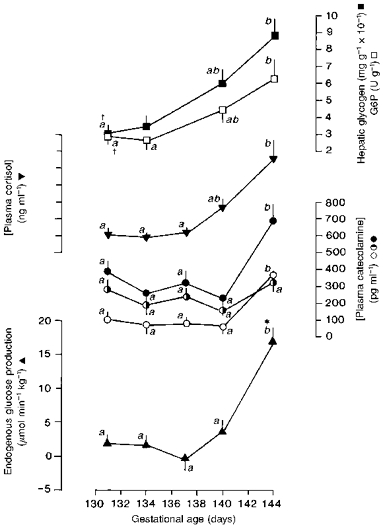
Figure 2. Fetal glucose metabolic rates in response to maternal fasting.
Mean (±s.e.m.) rates of umbilical glucose uptake (A), glucose utilization (B), glucose production (C{kern 0 0}) and CO2 production from glucose carbon (D) in sheep fetuses in both the fed (□) and fasted ( ) state and the mean change in value (
 ) during the 48 h period of maternal fasting in Group I (fed 130–132 days, fasted 133–135 days) and Group II (fed 136–138 days, fasted 139–141 days). *P < 0.05; **P < 0.01: significant change in value during fasting. †P < 0.05: significant rate of Sera glucose production.
No significant change in umbilical O2 uptake was observed during fasting in either age group: mean rates of fetal O2 uptake in the fasted state were not significantly different from the values observed in the fed state at the same gestational ages (133–135 and 139–141 days, Table 2). However, there were significant reductions in fetal CO2 production from glucose carbon during maternal fasting in both age groups (Fig. 2).
The alterations in fetal glucose metabolism induced by maternal fasting were also associated with changes in the fetal plasma concentrations of cortisol, insulin and the catecholamines (Table 3). There were significant decreases in fetal plasma insulin and significant increases in fetal plasma cortisol during the 48 h period of maternal fasting in both age groups (Table 3). The absolute concentration of plasma cortisol in the fasted state and the mean increment in value during fasting were significantly greater in the older Group II animals (Table 3). The increase in fetal plasma adrenaline in response to maternal fasting did not reach significance in either group (Table 3). By contrast, plasma noradrenaline levels increased significantly in all the fetuses during the 48 h period of maternal fasting but, because of wide individual variation, the mean increment was significant only in Group I (Table 3). The absolute concentrations of fetal plasma noradrenaline and total catecholamines in the fasted state in the two groups (Table 3) were significantly higher than the corresponding values observed in the fed state at the same gestational ages (133–135 days and 139–141 days, Fig. 1, P < 0.01, all cases).
In the fasted state, there was a tendency for the hepatic glycogen content to be lower and the hepatic G6P activity to be higher than the corresponding values observed in the fed state at the same gestational ages (Table 4). However, the differences in value between the fed and fasted states were not statistically significant at either gestational age (P < 0.1, Table 4). The glycogen content of the fetal liver was significantly higher at 139–141 days than at 133–135 days in the fed animals, but not in those fasted for 48 h before delivery (Table 4). In the fasted state, hepatic G6P activity was significantly higher at 139–141 days than in the younger animals (Table 4).
Table 4.
Levels of hepatic glycogen and glucose-6-phosphatase (G6P) in sheep fetuses at delivery in the fed state or at the end of a 48 h period of maternal fasting at 133–135 days and 139–141 days of gestation
| 133–135 days | 139–141 days | |||
|---|---|---|---|---|
| Fed | Fasted | Fed | Fasted | |
| Glycogen (mg g−1) | 33.0 ± 5.0 (4) | 20.6 ± 3.6 (5) | 66.3 ± 9.8 * (4) | 37.6 ± 10.2 (5) |
| G6P (U g−1) | 2.60 ± 0.82 (4) | 3.46 ± 0.70 (4) | 4.68 ± 0.98 (4) | 8.14 ± 1.40 * (5) |
Values are means ±s.e.m.; number of animals in parentheses.
P < 0.05: significantly different from value in the younger age group in the same nutritional state.
The relationship between glucose production and the fetal plasma cortisol and catecholamine concentrations
Since fetal glucose production was negligible when cortisol and catecholamine levels were low but occurred at a significant rate when cortisol and total catecholamine values were raised, either near term or by maternal fasting, the relationship between fetal glucose production and these hormone concentrations was examined in more detail. When the data from all the studies were combined irrespective of gestational age or nutritional state, there was a significant positive correlation between the rate of fetal glucose production and the log plasma cortisol concentration in utero (Fig. 3). However, part of this association may have been due to the concomitant changes in plasma catecholamine levels as there was also a significant positive correlation between the rate of fetal glucose production and log total catecholamines in the fetal plasma (r = 0.522, n = 32, P < 0.002). Using all the available data, partial correlation analysis of the three variables showed that both the total plasma catecholamine concentration and the plasma cortisol level were significant influences on the rate of fetal glucose production but that plasma cortisol had the more pronounced effect over the period of gestation examined in the present study (partial correlation coefficient for cortisol 0.639, P < 0.001; partial correlation coefficient for total catecholamine 0.335, P < 0.05). No significant correlations were observed between the rate of glucose production and the specific log concentrations of plasma adrenaline (r = 0.254, n = 32, P > 0.05) or noradrenaline (r = 313, n = 32, P > 0.05) in the fetus. The dominant effect of plasma cortisol on the rate of fetal glucose production was also observed when only the values obtained in the fed state were used for the analyses (data not shown).
Figure 3. Fetal glucose production and plasma cortisol.
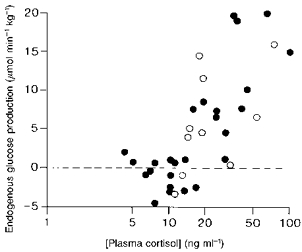
The relationship between the rate of endogenous glucose production and the plasma cortisol concentration in individual sheep fetuses in fed (•) and fasted states (○) during late gestation (y = 15.4log10x - 14.6, r = 0.712, n = 36, P < 0.001).
When the data for the fetuses with low basal plasma cortisol levels (< 17.5 ng ml−1) were analysed separately from those with higher prepartum cortisol values (Barnes et al. 1978), there was no significant correlation between the rate of fetal glucose production and the log total catecholamine concentration in the fetuses with low cortisol levels (Fig. 4A). Nor was there a significant correlation between glucose production and log plasma cortisol in these fetuses (r = 0.219, n = 17, P > 0.05). By contrast, in the fetuses with the higher plasma cortisol levels, there was a significant positive correlation between the rate of fetal glucose production and the log concentration of total catecholamines in the fetal plasma (Fig. 4B) but not between the former values and log plasma cortisol in utero (0.412, n = 15, P > 0.05).
Figure 4. Fetal glucose production and plasma catecholamines.
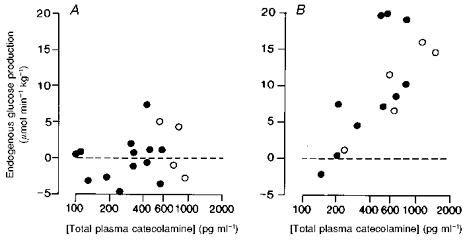
The relationship between the rate of endogenous glucose production and the total plasma catecholamine concentration in individual sheep fetuses in fed (•) and fasted states (○) with plasma cortisol levels less than 17.5 ng ml−1 (y = 2.0log10x - 4.8, r = 0.176, n = 17, P > 0.05) (A) and greater than 17.5 ng ml−1 (y = 18.0 log10x - 38.8, r = 0.737, n = 15, P < 0.001) (B).
No significant correlations were observed between the rate of fetal glucose production and the fetal plasma insulin level either in the fed state (r = 0.241, n = 26, P > 0.05) or when the data from the fed and fasted states were combined (r = 0.123, n = 36, P > 0.05).
DISCUSSION
The results of the present study demonstrate that, in normal conditions, glucogenesis is initiated in the sheep fetus during the last few days of gestation. The rate of fetal glucose production at 143–145 days accounted for 50 % of the rate of fetal glucose utilization and was similar to the values reported previously for sheep fetuses studied earlier in gestation during adverse intrauterine conditions (Hay et al. 1984; Owens et al. 1987; Rudolph et al. 1989a). The onset of glucogenesis close to term was not accompanied by changes in the fetal rates of glucose utilization, O2 consumption or CO2 production from glucose carbon when values were expressed on a weight specific basis. Neither was there any gestational trend in the fetal glucose oxidation fraction. Developmental changes in glucose metabolism must therefore occur in individual fetal tissues towards term without any apparent effect on the intracellular handling of glucose by the sheep fetus as a whole.
Significant fetal glucogenesis was also observed in the present study in response to maternal fasting for 48 h within, but not before, the last 7 days of gestation. The rate of fetal glucose production observed in response to short-term maternal fasting close to term was similar to that seen previously in younger sheep fetuses after more prolonged undernutrition (Hay et al. 1984; Dalinghaus et al. 1991). In the ewes fasted close to term, there was no significant fall in fetal glucose utilization whereas in the younger group of fasted animals, fetal glucose utilization fell significantly. Fetal glucose production therefore helped maintain the rate of fetal glucose utilization and ameliorated, in part, the fall in umbilical glucose supply in animals fasted close to term. The development of fasting-induced glucogenesis towards term coincided with the normal prepartum rise in gluconeogenic enzyme levels in the fetal liver and kidneys (Fowden et al. 1993). Since these enzymes are also elevated in activity by prolonged undernutrition earlier in gestation (Lemons, Moorehead & Hage, 1986), they may have an important role in determining fetal glucogenesis. Certainly, in the present study, endogenous glucose production was only observed in fetuses in which hepatic glucose-6-phosphatase activity exceeded 4 U (g wet weight)−1.
The fetuses producing glucose endogenously in the present study had a low rate of umbilical glucose uptake. In the fasted animals, this would have been due primarily to a reduced rate of glucose delivery to the gravid uterus (Hay et al. 1984). However, this explanation is unlikely to account for the low umbilical glucose uptake observed in the well-fed ewes at 143–145 days as maternal glucose levels were normal in these animals and there is little evidence for a fall in uterine blood flow close to term (Silver, Barnes, Comline & Burton, 1982). It is possible that, close to term, there are maturational changes in transplacental glucose transport or in the partitioning of uterine glucose uptake between the uteroplacental and fetal tissues. Alternatively, the prepartum reduction in umbilical glucose may be due to the observed increase in glucose delivery to the placenta by the fetus itself. Similar increases in fetal glucose delivery to the placenta and, hence, reductions in umbilical glucose uptake have been observed in sheep fetuses treated with synthetic glucocorticoids during late gestation (Barbera, Wilkening, Teng, Battaglia & Meschia, 1997).
In the present study, fetal glucogenesis only occurred in conjunction with elevated concentrations of plasma cortisol and catecholamines. Infusion of cortisol into fetal sheep for 48 h has been shown to stimulate hepatic glucogenesis after 137 days of gestation, although not in younger animals (Rudolph, Roman & Rudolph, 1989b;Townsend et al. 1991). Similarly, fetal administration of catecholamines or β-agonists is known to raise glucose levels and induce glucogenesis in sheep fetuses during late gestation (Sperling, Christensen, Ganguli & Anand, 1980; Padbury, Ludlow, Ervin, Jacobs & Humme, 1987; Warburton, Parton, Buckley, Cosico & Saluna, 1988; Apatu & Barnes, 1991). Adrenaline and noradrenaline were equipotent at stimulating hepatic glucose output, although adrenaline was more effective at raising glucose levels in the sheep fetus (Sperling et al. 1980; Padbury et al. 1987; Apatu & Barnes, 1991). The catecholamine concentrations shown to cause fetal hyperglycaemia in these earlier studies were similar to those observed in the fetuses producing glucose in the current investigation (Padbury et al. 1987; Apatu & Barnes, 1991). When all the data from the present study were combined irrespective of gestational age or nutritional state, plasma cortisol appeared to be the predominant factor regulating glucose production by the sheep fetus as a whole. Fetuses with low cortisol levels were unable to produce glucose endogenously in response to short-term undernutrition or when fetal catecholamine levels were high. However, once fetal cortisol levels were elevated above 17.5 mg ml−1 in either fed or fasted animals, fetal glucogenesis occurred at rates determined by the total catecholamine concentration in the fetal circulation. Thus, fetal plasma cortisol appears to have to reach a critical level before glucogenesis can occur in the sheep fetus. These observations are in keeping with the other known maturational effects of cortisol on the glucogenic pathways in utero (Liggins, 1994; Fowden, 1995). Cortisol enhances fetal hepatic glycogen and gluconeogenic enzyme levels and is known to be responsible for the normal prepartum increases in these variables (Barnes et al. 1978; Fowden et al. 1993; Fowden, Apatu & Silver, 1995). It also increases the density of hepatic β-adrenergic receptors responsible for sympathoadrenal stimulation of hepatic glucose output in the fetus (Apatu & Barnes, 1991; Fowden et al. 1995). Cortisol therefore appears to control the capacity for glucogenesis while the catecholamines actually activate the glucogenic pathways in sheep fetuses close to term.
In adult animals, the pancreatic hormones insulin and glucagon have an important role in regulating hepatic glucose output. However, in the fetus, they appear to be less influential (Fowden, 1995). Previous studies on insulin-deficient fetuses have shown that, while hypoinsulinaemia favours glucogenesis in utero, it does not directly induce glucose production in the sheep fetus (Fowden & Hay, 1988; Hay, Meznarich & Fowden, 1989). The present study also indicates that hypoinsulinaemia is not a prerequisite for fetal glucogenesis, since insulin levels were normal in the fetuses producing glucose at 143–145 days of gestation. Glucagon has also been shown to be comparatively ineffective at stimulating glucose production in fetal sheep, at least over the physiological range of concentrations observed in utero (Devaskar, Ganguli, Styer, Devaskar & Sperling, 1984; Apatu & Barnes, 1991). In addition, fetal plasma glucagon shows little, if any, change in concentration with increasing gestational age or in response to undernutrition during late gestation (Sperling, 1977; Shreine et al. 1980). Pancreatic hormones may therefore have had a permissive action on fetal glucogenesis in the present study, but their effects appear to be less important than those of the glucocorticoids and catecholamines.
The most likely source of glucose produced endogenously by the fetus is the liver. Near term, it can produce glucose from glycogen and lactate and has been shown to release glucose into the fetal circulation at a rate sufficient to account for most of the whole body rate of glucose production observed in the present study (Warburton et al. 1988; Rudolph et al. 1989a;Apatu & Barnes, 1991; Townsend et al. 1991). However, the relative importance of glycogenolysis and gluconeogenesis to fetal glucose production in this and previous studies remains unclear. The glycogen content of the fetal ovine liver is known to be lowered by catecholamine administration and by adverse intrauterine conditions which elicit glucose production in utero (Warburton et al. 1989; Stratford & Hooper, 1997). The normal prepartum increment in fetal hepatic glycogen was also prevented by fasting the ewes for 48 h before delivery in the present study. However, the current finding that glucogenesis occurs at a time in late gestation when the fetal liver and other tissues are accumulating glycogen rapidly indicates that glycogenolysis is unlikely to be the sole pathway for fetal glucose production just before term. Thus, gluconeogenesis probably also contributes to fetal glucose production close to term. These observations are consistent with the prepartum upregulation of gluconeogenic enzyme activities and with previous findings that hepatic glycogen deposition proceeds largely via gluconeogenic pathways in fetal sheep during late gestation (Levitsky, Paton & Fisher, 1988; Fowden et al. 1993; Barbera et al. 1997).
There was no evidence that the fetuses producing glucose endogenously at 143–145 days had experienced adverse conditions in utero. They had normal blood gas values and metabolite concentrations during the days before the study and were not hypoxic or hypoglycaemic at the time that the measurements of glucose metabolism were made. They were also of normal bodyweight and size when they were delivered at the end of the study. The concentrations of plasma cortisol and catecholamines found in these fetuses indicated that they were within 24–36 h of spontaneous delivery at full term (Barnes et al. 1978, Elliot, Klein, Glatz, Nathanielsz & Fisher, 1981). Activation of gluconeogenesis at 143–145 days of gestation therefore appears to be part of the normal sequence of prepartum events that prepare the fetus for extrauterine life. Like many of the other maturational processes essential for neonatal survival (Liggins, 1994), the ability to produce glucose endogenously appears to be dependent on the prepartum rise in fetal plasma cortisol. However, while the cortisol surge induces competent pathways for glucogenesis, it appears to be the concomitant increase in sympathoadrenal activity that acts as the direct stimulus for glucose production in utero. But whatever the mechanisms involved, initiation of glucogenesis before birth ensures that a glucose supply is maintained to vital organs both during and immediately after delivery and, thereby, maximizes the chances of surviving the transition from parenteral to enteral nutrition that occurs at birth.
Acknowledgments
We would like to thank Mr P. Hughes for his help during surgery, Mr A. Graham, Mr I. Cooper and Mrs S. Nicholls for their care of the animals, Mrs V. Whittaker for her assistance with the biochemical analyses and Miss M. Carter for typing the manuscript. We are also grateful to The Wellcome Trust for their financial support of this work.
References
- Apatu RSK, Barnes RJ. Release of glucose from the liver of fetal and postnatal sheep by portal vein infusion of catecholamine or glucagon. The Journal of Physiology. 1991;436:449–468. doi: 10.1113/jphysiol.1991.sp018560. [DOI] [PMC free article] [PubMed] [Google Scholar]
- Armitage P. Statistical Methods in Medical Research. Oxford, UK: Blackwell; 1971. [Google Scholar]
- Barbera A, Wilkening RB, Teng C, Battaglia FC, Meschia G. Metabolic alterations in the fetal hepatic and umbilical circulations during glucocorticoid induced parturition in sheep. Pediatric Research. 1997;41:242–248. doi: 10.1203/00006450-199702000-00015. [DOI] [PubMed] [Google Scholar]
- Barnes RJ, Comline RS, Silver M. Effects of cortisol on liver glycogen concentrations in hypophysectomized adrenalectomized and normal foetal lambs during late or prolonged gestation. The Journal of Physiology. 1978;275:567–579. doi: 10.1113/jphysiol.1978.sp012209. [DOI] [PMC free article] [PubMed] [Google Scholar]
- Bell AW, Battaglia FC, Meschia G. Methods for chronic studies of circulation and metabolism in the sheep conceptus at 70–80 days of gestation. In: Nathanielsz PW, editor. Animal Models in Fetal Medicine. VI. Ithaca, NY, USA: Perinatology Press; 1987. pp. 38–54. [Google Scholar]
- Comline RS, Silver M. The composition of foetal and maternal blood during parturition in the ewe. The Journal of Physiology. 1972;222:233–256. doi: 10.1113/jphysiol.1972.sp009795. [DOI] [PMC free article] [PubMed] [Google Scholar]
- Dalinghaus M, Rudolph CD, Rudolph AM. Effects of maternal fasting on hepatic gluconeogenesis and glucose metabolism in fetal lambs. Journal of Developmental Physiology. 1991;16:267–275. [PubMed] [Google Scholar]
- Devaskar SU, Ganguli S, Styer D, Devaskar UP, Sperling MA. Glucagon and glucose dynamics in sheep: evidence for glucagon resistance in the fetus. American Journal of Physiology. 1984;246:256–265. doi: 10.1152/ajpendo.1984.246.3.E256. [DOI] [PubMed] [Google Scholar]
- Elliot RJ, Klein AH, Glatz TH, Nathanielsz PW, Fisher DA. Plasma noradrenaline, epinephrine and dopamine concentrations in maternal and fetal sheep during spontaneous parturition and in premature sheep during cortisol-induced parturition. Endocrinology. 1981;108:1678–1682. doi: 10.1210/endo-108-5-1678. [DOI] [PubMed] [Google Scholar]
- Fowden AL. Effects of arginine and glucose on the release of insulin in the sheep fetus. Journal of Endocrinology. 1980;85:121–129. doi: 10.1677/joe.0.0850121. [DOI] [PubMed] [Google Scholar]
- Fowden AL. Endocrine regulation of fetal growth. Reproduction, Fertility and Development. 1995;7:351–363. doi: 10.1071/rd9950351. [DOI] [PubMed] [Google Scholar]
- Fowden AL, Apatu RSK, Silver M. The glucogenic capacity of the fetal pig: developmental regulation by cortisol. Experimental Physiology. 1995;80:457–467. doi: 10.1113/expphysiol.1995.sp003860. [DOI] [PubMed] [Google Scholar]
- Fowden AL, Hay WW. The effects of pancreatectomy on the rates of glucose utilization, oxidation and production in the sheep fetus. Quarterly Journal of Experimental Physiology. 1988;73:973–984. doi: 10.1113/expphysiol.1988.sp003231. [DOI] [PubMed] [Google Scholar]
- Fowden AL, Mijovic J, Silver M. The effects of cortisol on hepatic and renal gluconeogenic enzyme activities in the sheep fetus during late gestation. Journal of Endocrinology. 1993;137:213–222. doi: 10.1677/joe.0.1370213. [DOI] [PubMed] [Google Scholar]
- Hay WW, Meznarich HK, Fowden AL. The effects of streptozotocin on rates of glucose utilization, oxidation and production in the sheep fetus. Metabolism. 1989;38:30–37. doi: 10.1016/0026-0495(89)90176-5. 10.1016/0026-0495(89)90176-5. [DOI] [PubMed] [Google Scholar]
- Hay WW, Myers SA, Sparks JW, Wilkening RB, Meschia G, Battaglia FC. Glucose and lactate oxidation rate in the fetal lamb. Proceedings of the Society of Experimental Biology and Medicine. 1983;173:553–563. doi: 10.3181/00379727-173-41686. [DOI] [PubMed] [Google Scholar]
- Hay WW, Sparks JW, Quissell D, Battaglia FC, Meschia G. Simultaneous measurements of umbilical uptake, fetal utilization rate and fetal turnover rate of glucose. American Journal of Physiology. 1981;240:E662–668. doi: 10.1152/ajpendo.1981.240.6.E662. [DOI] [PubMed] [Google Scholar]
- Hay WW, Sparks JW, Wilkening RB, Battaglia FC, Meschia G. Fetal glucose uptake and utilization as functions of maternal glucose concentration. American Journal of Physiology. 1984;246:E237–242. doi: 10.1152/ajpendo.1984.246.3.E237. [DOI] [PubMed] [Google Scholar]
- Lemons JA, Moorehead HC, Hage GP. Effects of fasting on gluconeogenic enzymes in the ovine fetus. Pediatric Research. 1986;20:676–682. doi: 10.1203/00006450-198607000-00020. [DOI] [PubMed] [Google Scholar]
- Levitsky L, Paton JB, Fisher DE. Precursors to glycogen in ovine fetuses. American Journal of Physiology. 1988;255:E743–747. doi: 10.1152/ajpendo.1988.255.5.E743. [DOI] [PubMed] [Google Scholar]
- Liggins GC. The role of cortisol in preparing the fetus for birth. Reproduction, Fertility and Development. 1994;6:141–150. doi: 10.1071/rd9940141. [DOI] [PubMed] [Google Scholar]
- Mellor DJ. Integration of perinatal events, pathophysiological changes and consequences for the newborn lamb. British Veterinary Journal. 1988;144:552–569. doi: 10.1016/0007-1935(88)90025-5. [DOI] [PubMed] [Google Scholar]
- Meschia G, Cotter JR, Makowski EL, Barron DH. Simultaneous measurement of uterine and umbilical blood flows and oxygen uptakes. Quarterly Journal of Experimental Physiology. 1966;52:1–18. [Google Scholar]
- Owens JA, Falconer J, Robinson JS. Effect of restriction of placental growth on oxygen delivery to and consumption by the pregnant uterus and fetus. Journal of Developmental Physiology. 1987;9:137–150. [PubMed] [Google Scholar]
- Padbury JF, Ludlow JK, Ervin MG, Jacobs HC, Humme JA. Thresholds for physiological effects of plasma catecholamines in fetal sheep. American Journal of Physiology. 1987;252:E530–537. doi: 10.1152/ajpendo.1987.252.4.E530. [DOI] [PubMed] [Google Scholar]
- Robinson PM, Comline RS, Fowden AL, Silver M. Adrenal cortex of the fetal lamb: Changes after hypophysectomy and effects of synacthen on cytoarchitecture and secretory activity. Quarterly Journal of Experimental Physiology. 1983;68:15–27. doi: 10.1113/expphysiol.1983.sp002697. [DOI] [PubMed] [Google Scholar]
- Rudolph CD, Roman C, Rudolph AM. Effect of acute umbilical cord compression on hepatic carbohydrate metabolism in the fetal lamb. Pediatric Research. 1989a;25:228–233. doi: 10.1203/00006450-198903000-00002. [DOI] [PubMed] [Google Scholar]
- Rudolph CD, Roman C, Rudolph AM. Effect of cortisol on hepatic gluconeogenesis in the fetal sheep. Journal of Developmental Physiology. 1989b;11:219–223. [PubMed] [Google Scholar]
- Shreiner RL, Nolan PA, Bonderman PW, Moorehead HC, Gresham EL, Lemons JA, Escobedo MB. Fetal and maternal hormonal response to starvation in the ewe. Pediatric Research. 1980;14:103–108. doi: 10.1203/00006450-198002000-00007. [DOI] [PubMed] [Google Scholar]
- Silver M, Barnes RJ, Comline RS, Burton GJ. Placental blood flow: some fetal and maternal cardiovascular adjustments during gestation. Journal of Reproduction and Fertility. 1982;(31):139–160. suppl. [PubMed] [Google Scholar]
- Silver M, Fowden AL. Induction of labour in domestic species: endocrine changes and neonatal viability. In: Künzer W, Jensen A, editors. The Endocrine Control of the Fetus. Berlin: Springer Verlag; 1991. pp. 401–411. [Google Scholar]
- Silver M, Fowden AL, Knox J, Ousey JC, Franco R, Rossdale PD. Sympathoadrenal and other responses to hypoglycaemia in the young foal. Journal of Reproduction and Fertility. 1987;(35):607–614. suppl. [PubMed] [Google Scholar]
- Sperling MA. Relation of glucagon secretion to glucose homeostasis in the perinatal period. Recent Progress in Pediatric Endocrinology. 1977;12:21–32. [Google Scholar]
- Sperling MA, Christensen RA, Ganguli S, Anand R. Adrenergic modulation of pancreatic hormone secretion in utero: studies in fetal sheep. Pediatric Research. 1980;14:203–208. doi: 10.1203/00006450-198003000-00005. [DOI] [PubMed] [Google Scholar]
- Stratford LL, Hooper SB. Effect of hypoxemia on tissue glycogen content and glycolytic enzyme activities in fetal sheep. American Journal of Physiology. 1997;272:R103–110. doi: 10.1152/ajpregu.1997.272.1.R103. [DOI] [PubMed] [Google Scholar]
- Townsend SF, Rudolph CD, Rudolph AM. Cortisol induces perinatal hepatic gluconeogenesis in the lamb. Journal of Developmental Physiology. 1991;16:71–79. [PubMed] [Google Scholar]
- Unno N, Giussani DA, Man A Hing WKH, Ding XY, Collins JA, Nathanielsz PW. Changes in adrenocorticotropin and cortisol responsiveness after repeated partial umbilical cord occlusions in the late gestation ovine fetus. Endocrinology. 1997;138:259–263. doi: 10.1210/endo.138.1.4880. 10.1210/en.138.1.259. [DOI] [PubMed] [Google Scholar]
- Warburton D, Parton L, Buckley S, Cosico L, Saluna T. Effects of β-2 agonist on hepatic glycogen metabolism in the fetal lamb. Pediatric Research. 1988;24:330–332. doi: 10.1203/00006450-198809000-00011. [DOI] [PubMed] [Google Scholar]
- Warnes DM, Seamark RF, Ballard FJ. The appearance of gluconeogenesis at birth in sheep: activation of the pathway associated with blood oxygenation. Biochemical Journal. 1977;162:627–634. doi: 10.1042/bj1620627. [DOI] [PMC free article] [PubMed] [Google Scholar]