Abstract
The relationship between renal perfusion pressure (RPP) and ion concentration in renal medulla was studied in anaesthetized rats. RPP was changed in steps within the pressure range 130–80 mmHg, while tissue electrical admittance (Y, index of interstitial ion concentration) and medullary and cortical blood flow (MBF and CBF; laser Doppler flowmetry) were measured, along with glomerular filtration rate (Cin) and renal excretion.
With a RPP reduction from 130 to 120 mmHg, tissue Y remained stable; at 100 and 80 mmHg, Y was 5 and 17 % lower, respectively, than at 120 mmHg.
CBF fell less than RPP (partial autoregulation) in the range 130–100 mmHg only. MBF was autoregulated within 120–100 mmHg, but not above or below this range.
Each step of RPP reduction was followed by a decrease in sodium and water excretion (UNaV and V). The osmolality of excised inner medulla fragments was similar at 120 and 105 mmHg (586 ± 45 and 618 ± 35 mosmol (kg H2O)−1, respectively) but lower at 80 mmHg (434 ± 31 mosmol (kg H2O)−1, P < 0.01); the ion concentration changed in parallel.
The data show that medullary hypertonicity was well preserved during RPP fluctuations within 130–100 mmHg, but not below this range. RPP-dependent changes of UNaV and V were not clearly associated with changes in solute concentration in medullary tissue.
The hypertonicity of the renal medulla is of fundamental importance for normal renal function, especially for processes involved in urine concentration. In the absence of major changes of water reabsorption in the collecting duct system, the total electrolyte (mostly NaCl) concentration in the medullary tissue represents largely the balance of two opposed processes: the delivery to the interstitium by reabsorption from the ascending limb of the loop of Henle, and evacuation by the vasa recta countercurrent exchanger. Both processes are likely to be altered during changes in renal perfusion pressure (RPP). However, one could teleologically expect that the medullary hypertonicity can be protected against changes in arterial blood pressure, as is the case with the renal blood flow.
The effect of increased RPP on medullary ion content was first studied by Selkurt, Womack & Dailey (1965) who reported a ‘wash-out’ of medullary Na+ in the dog after a RPP increase of 50 mmHg; the medullary blood flow was not measured. Over the years, no other systematic studies followed.
Our method of continuous recording of tissue electrical admittance (Sadowski & Portalska, 1983) allows the convenient measurement of tissue ion concentration in the renal medulla under various experimental conditions. In the present work we studied the effect of RPP changes on both tissue admittance (Y) and blood flow in the medulla, using an integrated probe recently developed in our laboratory (Sadowski, Kompanowska-Jezierska, Dobrowolski, Walkowska & Badzynska, 1997). This approach offers a unique possibility for examining the dynamics of tissue ionic tonicity changes, and for gaining an insight into their mechanism.
METHODS
Experiments were designed to investigate the relationship between RPP and ion concentration in rat renal medulla, and simultaneously measure medullary and cortical blood flow (MBF and CBF, respectively), glomerular filtration rate (GFR) and renal excretion. Male Wistar rats weighing 280–330 g, maintained on a dry pellet diet and given free access to water, were anaesthetized with intraperitoneal thiobutabarbitone (Inactin, Byk Gulden, Konstanz, Germany), at 100 mg (kg body wt)−1. Throughout the surgical preparation and experimental procedures, body temperature was maintained at about 37°C by means of a heated pad. In order to compensate for fluid losses, during surgical preparation 3 % (w/v) bovine albumin in Ringer solution was infused at 2 ml h−1.
A cannula was placed in the trachea to ensure free airways; the femoral vein and carotid artery were cannulated for infusion of fluids and blood sampling, respectively. For measurement of RPP a Teflon catheter, 0.4 mm in diameter, was introduced through the right femoral artery into the aorta; its tip was later positioned just below the left renal artery. The left kidney was exposed from a subcostal flank incision and placed in a plastic holder similar to that used for micropuncture experiments; the inside of the holder was padded in a way that the kidney's dorsal curvature (and not the side surface) was facing upwards. For manipulation of RPP two screw-controlled snares were placed on the aorta: one above and another below the left renal artery. Subsequently, a PE 20 catheter was placed in the ureter, and an integrated probe (laser Doppler probe plus admittance electrode, see below) for simultaneous measurement of MBF and Y was inserted into the kidney from its dorsal surface along the cortico-papillary axis. Another laser Doppler (LD) probe (type PF 407/415, Perimed, Jarfalla, Sweden) was placed on the kidney surface for measurement of CBF.
Simultaneous recording of blood flow and tissue admittance
An integrated probe for simultaneous recording of MBF (using a LD flowmeter) and Y was described recently (Sadowski et al. 1997). Briefly, it consists of a needle LD probe (PF 402) and a single Y electrode arranged in parallel 1 mm apart, both fixed at the base in a common bedplate. The LD probe is a stainless-steel cannula housing two optical fibres, for transmission of a laser light beam to and back from the tissue. The tip-to-base length and the diameter of the probe are 5.4 and 0.45 mm, respectively. The Y electrode is a piece of 75 % platinum-25 % iridium wire, 6.8 mm in length and 0.3 mm in diameter, sharpened at the tip. The two elements are insulated, except for the 1.1–1.3 mm tip segments. Inner medullary tissue Y is measured between these two deinsulated surfaces forming an ‘admittance cell’. The LD probe is connected to a LD flowmeter (Periflux 4001, Perimed, Jarfalla, Sweden) and the admittance cell to a laboratory conductance meter (Mera Elwro, Wroclaw, Poland).
After the experiments the rats were killed with an overdose of the anaesthetic. The position of the Y electrode tip (deep in the inner medulla) and of the LD probe (close to the border with the outer medulla) was verified at the kidney's cross-section.
Experimental procedures
At the end of surgical preparation albumin infusion was replaced by a slightly hypertonic fluid (450 mosmol (kg H2O)−1), in which 300 mosmol kg−1 were provided by NaCl and 150 mosmol kg−1 by mannitol. This solution was used to enhance diuresis and thus avoid analytical difficulties due to a very small rate of urine flow at low blood pressure levels. After insertion of the Y/MBF probe, a priming dose of 6 μCi of [methoxy-3H] inulin was injected i.v., followed by an infusion that delivered 6 μCi inulin in 1.2 ml of mannitol plus saline solution per hour. Subsequently, the aorta was totally occluded below the left renal artery to elevate RPP to about 130 mmHg.
Control group
In experiments designed to check the stability of our experimental preparation over time, after placement of the probes we maintained RPP at 105 mmHg using the aortic snares and measured MBF, CBF, Y and clearances for at least 120 min.
Experimental groups
Before starting CBF, MBF and Y measurements, RPP was adjusted to 120 mmHg. Thereafter it was lowered in steps by suprarenal aortic constriction, and urine collections were made at pressure levels of 120, 100 and 80 mmHg. After each pressure change, 7–10 min were allowed for stabilization before starting urine collection.
In rats in which RPP could be elevated above 130 mmHg, experiments were started at 130 mmHg and then the pressure was lowered in steps to 120 and 100 mmHg.
In an additional group of rats, the pressure was adjusted to 120 mmHg as described above, and then maintained at this level throughout experiment.
Thus experiments were terminated at pressure levels of 105 (control studies), 80 (main group), and 120 mmHg (additional group). Then the experimental kidney was rapidly removed and the inner medulla was excised for examination of standard conductance (Gstd, a measure of total interstitial ion concentration) as described in detail by Dobrowolski, Sadowski & Kompanowska-Jezierska (1992), and for examination of tissue osmolality.
Analytical procedures
Urine volumes were determined gravimetrically. Plasma and urine tritiated inulin activities were measured in an LKB 1211 liquid scintillation counter (Sweden) and GFR was determined as the clearance of [methoxy-3H] inulin (Cin). Urine osmolality was measured using a vapour pressure osmometer (Wescor 5500, USA) and medullary tissue osmolality (Tosm) was determined after extraction with boiling distilled water (Appelboom, Brodsky, Tuttle & Diamond, 1958); sodium concentration was determined by an ion-selective electrode analyser (Analyser Industries, Dreischor, The Netherlands).
Statistics
The significance of changes within one group over time was first evaluated by repeat measurement analysis of variance (ANOVA), followed by Student's t test for dependent variables. Differences in mean values between groups were first analysed by one-way ANOVA followed by a modified Student's t test for independent variables, using Bonferroni's correction for multiple comparisons.
RESULTS
In time control experiments (2 h observation at RPP of 105 mmHg) renal excretion, tissue admittance and renal haemodynamics showed minor variations that were not significant (repeat measurement ANOVA) (Table 1).
Table 1.
Renal excretion, medullary tissue admittance (Y) and renal haemodynamics at a constant renal perfusion pressure of 105 mmHg
| Time (min) | UNaV (μmol min−1) n = 9 | V (μl min−1) n = 10 | Uosm (mosmol kg H2O−1) n = 10 | Y (mS) n = 12 | MBF (PU) n = 8 | CBF (PU) n = 9 | GFR (μl min−1) n = 9 |
|---|---|---|---|---|---|---|---|
| 0–30 | 0.7 ± 0.2 | 13.8 ± 2.4 | 825 ± 84 | 0.90 ± 0.03 | 169 ± 17 | 503 ± 44 | 994 ± 109 |
| 30–60 | 0.9 ± 0.4 | 14.1 ± 3.0 | 875 ± 86 | 0.93 ± 0.03 | 166 ± 15 | 499 ± 43 | 890 ± 87 |
| 60–90 | 0.6 ± 0.1 | 13.3 ± 2.3 | 891 ± 86 | 0.92 ± 0.03 | 159 ± 16 | 483 ± 41 | 997 ± 123 |
| 90–120 | 0.5 ± 0.1 | 13.6 ± 2.7 | 851 ± 83 | 0.91 ± 0.04 | 161 ± 12 | 467 ± 39 | 843 ± 89 |
Values are given as means ±s.e.m.; n, number of rats. UNaV, urinary sodium excretion; V, urine flow; Uosm, urine osmolality; MBF, medullary blood flow; CBF, cortical blood flow; GFR, glomerular filtration rate; PU, perfusion unit; mS, millisiemens.
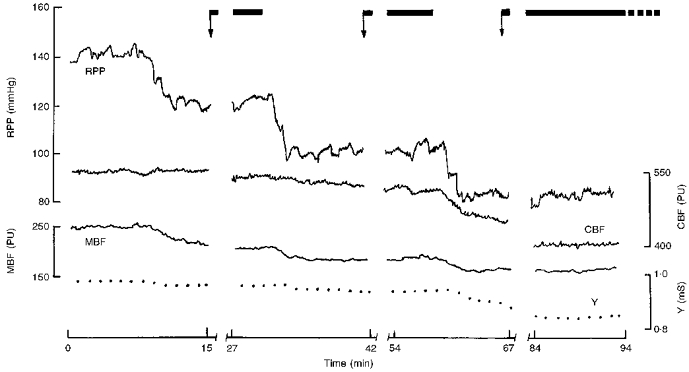
A sample record showing Y, MBF and CBF responses to step-wise reduction of RPP is shown in Fig. 1. Down to RPP of 80 mmHg, the Y was almost constant. In contrast to CBF showing distinct autoregulation, MBF decreased with RPP.
Figure 1. The changes in cortical and medullary blood flow (CBF and MBF, respectively) and medullary tissue admittance (Y) during step-wise reduction of renal perfusion pressure (RPP).

The arrows indicate the start of urine collection; note the time allowed for stabilization after RPP reduction. PU, laser Doppler perfusion units; mS, millisiemens.
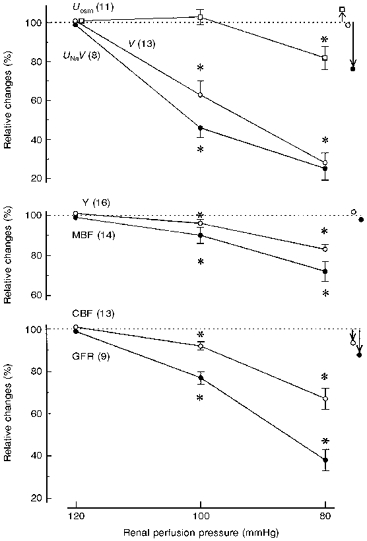
The main data set, for pressure levels 120, 100 and 80 mmHg, is shown in Fig. 2. Urinary sodium excretion (UNaV) and urine flow (V) decreased with RPP, whereas urine osmolality (Uosm) decreased moderately only below 100 mmHg. Tissue Y decreased only slightly (4 %) at 120→100 mmHg; at 80 mmHg it was 17 % lower than at 120 mmHg. MBF showed partial autoregulation at the first pressure step and virtually no autoregulation at the second step. The pressure-dependent flow changes pattern of CBF was similar. GFR decreased directly with RPP (no autoregulation). However, GFR tended to be highly variable and to decrease also in our time control studies (Table 1). In order to find out if the decrease in UNaV seen with falling RPP was dependent on a simultaneous decrease in GFR, the correlation of changes in the two parameters was examined. For both pressure steps the correlation proved virtually non-existent (r = -0.32 and 0.30, respectively).
Figure 2. Renal excretion, medullary tissue admittance and renal haemodynamics at three renal perfusion pressure levels.

Values are given as means ±s.e.m. and represent per cent of the 120 mmHg value; n values for each parameter are given in parentheses. Symbols with arrows to the right of the graphs show variations observed over 2 h at a constant pressure of 105 mmHg (control group). * Significantly different from the value for the closest higher pressure level at P < 0.001. Uosm, urine osmolality; V, urine flow; UNaV, sodium excretion; GFR, glomerular filtration rate; Y, MBF and CBF are as in Fig. 1.
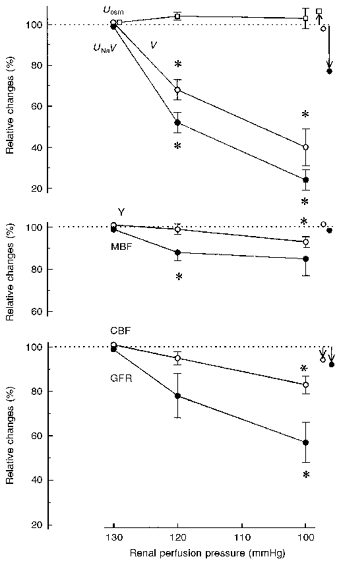
The data for experiments with pressure steps 130, 120 and 100 mmHg are given in Fig. 3. The fall in RPP from 130 to 120 mmHg was associated with decreases in UNaV and V of 48 and 31 %, respectively, much sharper than for the step 120 to 100 mmHg (Figs 2 and 3). Collectively, the data from Figs 2 and 3 indicate a constancy of Uosm over the pressure range 130–100 mmHg. Tissue Y remained constant at 130→120 mmHg and, similarly as in the series shown in Fig. 2, fell slightly (7 %) at 120→100 mmHg. MBF decreased distinctly at 130→120 mmHg and at the next step showed almost perfect autoregulation, better than for the same pressure range in Fig. 2. CBF fell less than RPP did over the entire pressure range (partial autoregulation). As in the first series, the changes in UNaV and GFR showed no apparent correlation.
Figure 3. Renal excretion, haemodynamics and medullary tissue admittance in a group of rats with an initial RPP of 130 mmHg.

Values are given as means ±s.e.m. and represent per cent of the 130 mmHg value. Symbols with arrows to the right of the graphs show variations observed over 2 h at a constant pressure of 105 mmHg (control group). * Significantly different from the value for the closest higher pressure level at P < 0.001. For Uosm, V, UNaV and Y, n = 6; for MBF, CBF and GFR, n = 5. Abbreviations are as in Fig. 2.
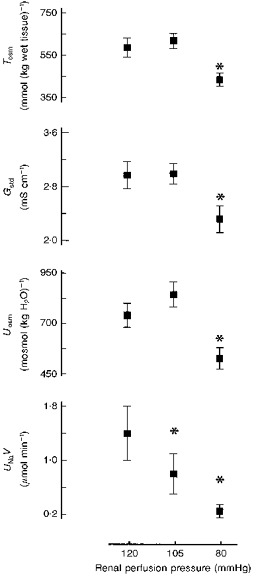
Medullary tissue osmolality (Tosm) (equal also to extracellular osmolality) and extracellular total ion activity (Gstd) were similarly related to RPP: both were almost the same at 120 and 105 mmHg, but significantly lower at 80 mmHg (Fig. 4). Uosm displayed roughly the same pattern, whereas for UNaV the usual dependence on RPP was seen.
Figure 4. Tissue osmolality (Tosm) and standard electrical conductance (Gstd) of medullary slices at three renal perfusion pressure levels.

Uosm and UNaV values in the same experiments are added for comparison. *P < 0.01 or less versus 120 mmHg. Uosm, UNaV are as in Fig. 2; n = 8 at 120 mmHg, n = 11 at 105 and 80 mmHg.
DISCUSSION
RPP changes could alter solute concentration in the medullary interstitium by a number of mechanisms. First, even within the renal blood flow autoregulation range, the flow and, especially, GFR are not maintained at a constant level. The changing filtered sodium load may result in some alteration of the amount of NaCl delivered to the medullary ascending limb of the loop of Henle (mALH). Since salt reabsorption in this segment largely depends on the delivery, NaCl reabsorption would also be changed, leading to alterations in salt concentration in the medullary interstitium.
Second, the changes in NaCl reabsorption, especially in the proximal tubule, could occur even without GFR changes, due to RPP-dependent variations of interstitial hydrostatic pressure, a commonly accepted mechanism explaining the phenomenon of pressure natriuresis (reviewed recently by Cowley, 1997). Again, the consequence would be altered delivery of NaCl to, and increased reabsorption in, the mALH.
Third, variations in RPP can lead to changes in the medullary blood flow, affect the function of the countercurrent exchanger and thereby modify medullary hypertonicity.
If RPP change were accompanied by a large change in the reabsorption of fluid in the collecting ducts and in the rate of inflow of the reabsorbate into the interstitium and ascending vasa recta, a modification of solute concentration in the medulla could also be expected.
Our results show that within the pressure range 130- 100 mmHg, the medullary tissue admittance (extracellular ion concentration) remained remarkably constant (Figs 2 and 3). For the range 120–105 mmHg, the constancy was confirmed by examination of extracellular ion concentration of the excised inner medullary tissue (Gstd) (Fig. 4). Medullary tissue osmolality (Tosm) changed in parallel with Gstd, which indicated that non-ionic solutes (mostly urea) also did not change. The stability of Uosm was in accordance with the stability of parameters describing tissue solute concentration in the medulla (Y, Gstd and Tosm). On the other hand, RPP reduction to 80 mmHg induced a significant though moderate decrease in Y, in accordance with lower values of Gstd, Tosm and Uosm.
What was the basis for the relative stability of tissue solute concentration above 100 mmHg? As expected, each arterial pressure reduction step was associated with antinatriuresis and antidiuresis. GFR decreased simultaneously, but there was no correlation with UNaV change, hence antinatriuresis was primarily due to increased tubular reabsorption (pressure-dependent antinatriuresis). A pressure-dependent increase of proximal NaCl reabsorption together with decreased filtered load would tend to limit salt delivery to the mALH and salt transport to the interstitium. However, the initial extracellular solute concentration could be maintained due to a reduced uptake of solutes by vasa recta as, indeed, MBF did decrease in our experiments. Since the RPP decrease could also directly enhance NaCl reabsorption in the loop (Roman, 1988), both actions in concert could help preserve hypertonicity of the medullary interstitium.
Our experimental preparation and protocols were not designed to reproduce good autoregulation of renal haemodynamics during RPP changes, unlike the approach developed by Cowley and his coworkers (Cowley, 1997). The kidney was innervated, no attempt was made to stabilize the levels of vasoactive hormones, and the animals were hydrated (though not volume expanded) by an infusion of a solution containing mannitol. Such experimental conditions in animals that had been anaesthetized and subjected to extensive surgery were probably responsible for poor autoregulation of blood flow, both in the cortex and in the medulla, and virtually no autoregulation of GFR. The latter could be due, in part, to an artifact: since V fell sharply after each RPP reduction and no more than 10 min was allowed before subsequent Cin measurement, the values measured may have underestimated the true GFR, due to the renal pelvic dead space effect. Moreover, in our preparation GFR tended to decrease with time (Table 1).
Since the laser Doppler measurements reflect the product of mean blood cell velocity and their concentration rather than volume flow, a question arises whether our MBF data represent a valid approximation of medullary perfusion with blood. In theory the technique could be relatively insensitive to blood flow changes dependent on shifts of fluid between the interstitium and descending and/or ascending vasa recta. For instance, a major influx of fluid into the vessel lumen would tend to increase velocity and decrease cell concentration to a similar extent, the product of the two, i.e. the Doppler flux, remaining constant. Therefore we suggest that the fall in MBF observed with decreasing RPP reflected decreasing blood inflow into the descending vasa recta. The validity of laser Doppler flux as a qualitative index of MBF was indirectly confirmed by our recent studies showing an expected inverse correlation of MBF and tissue Y during spontaneous changes of the former (Sadowski et al. 1997), and also by our present data showing constancy of medullary hypertonicity after RPP reductions, which were likely to diminish the tonicity. A simultaneous decrease in MBF possibly offset the effect of a decrease in RPP.
Roman & Zou (1993) proposed that the fall in MBF after RPP reduction should limit evacuation of solutes from the medullary interstitium to an extent that the hypertonicity should actually be enhanced (no tissue studies were made). This would enhance water reabsorption in the descending limb of the loop of Henle of the deep nephrons, decrease fluid delivery to more distal sites, and lead to antinatriuresis and antidiuresis (an opposite change in MBF would result in pressure natriuresis). Our results do not support this hypothesis. At least for the pressure range 130–100 mmHg, V and UNaV fell distinctly without any significant increase in tissue solute concentration (Fig. 3). Thus we propose that RPP-dependent changes in tubular reabsorption represent a more likely factor determining pressure natriuresis or antinatriuresis.
Within the pressure range 100–80 mmHg, sodium and water excretion fell with decreasing RPP (Fig. 2). This was probably a combined effect of a decrease in GFR (and filtered NaCl load), and an increased proximal reabsorption of NaCl secondary to decreased interstitial hydrostatic pressure. A reduction of RPP from 100 to 80 mmHg in the rat was recently shown to increase the luminal angiotensin II, a stimulator of proximal transport (Boer, Braam, Fransen, Boer & Koomans, 1997), which offers another explanation of increased proximal salt transport. Most probably, the resultant drastic reduction of NaCl supply to the loop caused a major reduction of salt delivery to the medullary interstitium, which could not be offset by diminished flow along the vasa recta, and the net result was a decrease in tissue tonicity.
In summary, our results showed that RPP reduction within the range 130–100 mmHg did not significantly affect the medullary hypertonicity. We suggest that the effect of reduced delivery of NaCl to, and reabsorption in, the mALH, secondary to a decrease in RPP and potentially leading to a decrease in tissue solute concentration, was balanced by diminished elimination of solutes dependent on decreasing MBF. At lower RPP levels (100–80 mmHg), the stability of medullary tissue tonicity was lost, apparently due to a dominating role of a decrease of solute delivery to the interstitium. It was also evident that the pressure-dependent natriuresis or antinatriuresis could occur without changes in solute concentration in the medulla.
References
- Appelboom JW, Brodsky WA, Tuttle WS, Diamond I. The freezing point depression of mammalian tissues after sudden heating in boiled distilled water. Journal of General Physiology. 1958;41:1153–1169. doi: 10.1085/jgp.41.6.1153. 10.1085/jgp.41.6.1153. [DOI] [PMC free article] [PubMed] [Google Scholar]
- Boer WH, Braam B, Fransen R, Boer P, Koomans HA. Effects of reduced renal perfusion pressure and acute volume expansion on proximal tubule and whole kidney angiotensin II content in the rat. Kidney International. 1997;51:44–49. doi: 10.1038/ki.1997.6. [DOI] [PubMed] [Google Scholar]
- Cowley AW. Role of the renal medulla in volume and arterial pressure regulation. American Journal of Physiology. 1997;273:R1–15. doi: 10.1152/ajpregu.1997.273.1.R1. [DOI] [PubMed] [Google Scholar]
- Dobrowolski L, Sadowski J, Kompanowska-Jezierska E. Conductance studies of rat renal medulla for rapid estimation of extracellular electrolyte concentration. Clinical Physics and Physiological Measurement. 1992;13:257–262. doi: 10.1088/0143-0815/13/3/005. 10.1088/0143-0815/13/3/005. [DOI] [PubMed] [Google Scholar]
- Roman RJ. Pressure-diuresis in volume-expanded rats. Tubular reabsorption in superficial and deep nephrons. Hypertension. 1988;12:177–183. doi: 10.1161/01.hyp.12.2.177. [DOI] [PubMed] [Google Scholar]
- Roman RJ, Zou AP. Influence of the renal medullary circulation on the control of sodium excretion. American Journal of Physiology. 1993;265:R963–973. doi: 10.1152/ajpregu.1993.265.5.R963. [DOI] [PubMed] [Google Scholar]
- Sadowski J, Kompanowska-Jezierska E, Dobrowolski L, Walkowska A, Badzynska B. Simultaneous recording of tissue ion content and blood flow in rat renal medulla: evidence on interdependence. American Journal of Physiology. 1997;273:F658–662. doi: 10.1152/ajprenal.1997.273.4.F658. [DOI] [PubMed] [Google Scholar]
- Sadowski J, Portalska E. Dynamic evaluation of renal electrolyte gradient by in situ tissue impedance studies. Kidney International. 1983;24:800–803. doi: 10.1038/ki.1983.231. [DOI] [PubMed] [Google Scholar]
- Selkurt EE, Womack J, Dailey WN. Mechanism of natriuresis and diuresis during elevated renal arterial pressure. American Journal of Physiology. 1965;209:95–99. doi: 10.1152/ajplegacy.1965.209.1.95. [DOI] [PubMed] [Google Scholar]


