

Abstract
Synaptic inputs to nucleus laminaris (NL) neurones were studied in a brainstem slice preparation of chick embryos (E15–20) using the whole-cell patch clamp technique. NL neurones are third order auditory neurones and are proposed to behave as coincidence detectors concerned with interaural timing discrimination.
Under voltage clamp conditions, electrical stimuli applied to either ventral or dorsal dendritic layers evoked EPSCs. These fast currents decayed with a time constant of 1.1 ms near the resting potential, reversed close to 0 mV, and were blocked by 6-cyano-7-nitroquinoxaline-2,3-dione (CNQX, 20 μM) or 6,7-dinitro-quinoxaline-2,3-dione (DNQX, 20 μM). Coincident or near coincident stimulation of the ventral and the dorsal dendritic layers increased the probability of action potential generation (response probability).
In the presence of CNQX (40 μM) other postsynaptic currents (PSCs) were observed, which reversed close to the equilibrium potential for chloride (ECl), and were reversibly blocked by bicuculline (20 μM) and, therefore, were mediated by GABAA receptors. Spontaneous GABAergic PSCs were inward going near the resting membrane potential immediately after starting whole-cell recording with a low Cl− (5 mM, ECl = −90 mV) pipette medium, but became outward-going with time. This indicates that GABAergic inputs may generate depolarizing potentials in intact NL neurones.
Local GABA (10 μM) application reduced both the EPSP and EPSC amplitude and shortened the EPSP decay time constant (from 5.3 to 2.1 ms), while the EPSC decay time constant was not affected (from 1.3 to 1.2 ms). These GABA effects were mostly due to the shunting conductance of the postsynaptic GABAA receptors.
Depolarizing current injections combined with electrical stimuli to a unilateral axon bundle simulated bilateral synaptic inputs. Response probability increased with decreased interstimulus intervals, while local GABA (10 μM) application to the soma narrowed the time dependence of the response probability.
These results suggest that GABAergic inputs to NL neurones may serve to improve coincidence detection of the bilateral excitatory inputs through an increase in membrane conductance.
The origin of a sound source is localized by comparing differences in the sound intensity and phase between the two ears. The use of these two cues is particularly well developed in the barn owl; which additionally has its pinnae displaced in the vertical axis. The direction of sound origin in the horizontal plane is detected using the interaural time difference (ITD), and the height of sound origin in the vertical plane from the interaural intensity difference (IID) (Konishi, 1993). The auditory signals are transmitted centrally by spiral ganglion cell axons to nucleus magnocellularis (NM) forming calyx type synapses in birds (Boord, 1968; Whitehead & Morest, 1981). This synaptic pathway preserves the phase (temporal) information of the sound (Warchol & Dallos, 1990). Neurones in NM make bilateral projections to NL which constitute delay lines (Overholt, Rubel & Hyson, 1992; Young & Rubel, 1983). ITD is likely to be encoded as the position of a neurone located in NL (Jeffress, 1948; Rubel & Parks, 1975).
Sensing the time difference between the two ears requires a system which can discriminate extremely small time differences between signals from the ears. From the head size of a chicken, the maximum time difference generated by a sound wave passing along the axis of the two ears has been estimated as 180 μs (Hyson, Overholt & Lippe, 1994). Therefore, the origin of a sound could be detected from the ITD only if the NL neurone can discriminate between arrival times smaller than 180 μs of excitatory postsynaptic potential (EPSP) inputs from ipsilateral and contralateral NM.
It is expected that the NL neurone receives fast excitatory glutamatergic inputs from NM and also GABAergic inputs. These inhibitory innervations are either from neurones in the superior olivary complex or from interneurones located between the NM and NL (von Bartheld, Code & Rubel, 1989; Code, Burd & Rubel, 1989; Lachica, Rubsamen & Rubel, 1994). It is reported that electrical stimulation of the projection fibres from NM suppressed spike generation in extracellularly recorded NL neurones (Joseph & Hyson, 1993). In mammals, ITDs are detected in the medial superior olive (MSO). Anatomically it is established that MSO receives glycinergic inhibitory innervation from the medial and the lateral nuclei of the trapezoid body (Kuwabara & Zook, 1992). Grothe & Sanes (1994) demonstrated an inhibition of evoked action potentials with bilateral coincidence in MSO neurones, particularly when high intensity electrical stimuli were applied to the bilateral projection fibres in a slice preparation, and recovery from the inhibition with local application of strychnine. The effect of GABAergic synapses on the discrimination of ITD has also been demonstrated in higher auditory nuclei such as in the inferior colliculus of the barn owl (Fujita & Konishi, 1991). We are interested in the presence and the role of such inhibitory innervations in ITD detection in the auditory pathway. We have analysed the probability of action potential generation with coincidence of bilateral EPSPs or of a unilateral EPSP paired with current injection into the NL neurone using a slice preparation from the chick embryo. Our main objective was to analyse the nature of coincidence detection in the single NL neurone, and to consider whether any inhibitory system could significantly contribute to ITD sensitivity in the chick NL neurone.
METHODS
Slice preparations
Thin slices were made from chick brainstem (Gallus domesticus) aged 15–20 embryonic days (E15–20, stage 41–45; Hamburger & Hamilton, 1951). The chick was anaesthetized by cooling the egg with ice-cold water, then decapitated and the brainstem was isolated. The brainstem was mounted in 2.5–3 % agarose (Type VII, low gelling temperature, Sigma) dissolved in a high-glucose saline (HGS; composition in Table 1), and transverse sections (120–150 μm) were made with a tissue slicer (DTK-2000, Dosaka, Kyoto, Japan) in ice-cold oxygenated HGS. Slices were then incubated in HGS for at least 1 h at 33–40°C under oxygenation before electrophysiological experiments. One slice was transferred to a recording chamber on the stage of an upright microscope (BHW-1, Olympus, Tokyo, Japan) and was perfused (2.5–3.0 ml min−1) with the 5K standard saline (compositions in Table 1) with a peristaltic pump (P-3, Pharmacia). Figure 1A shows the location of NL in the slice preparation, and the arrangement of the recording (1), electrical stimulating (2), and puffer pipettes (3) are shown in Fig. 1C. NL and NM were clearly recognized when viewed at × 100 magnification with Nomarski optics, and individual neurones at × 400 magnification.
Table 1.
Composition of solutions (mM)
| External solutions | NaCl | KCl | CaCl2 | MgCl2 | Hepes | Pipes | Glucose |
|---|---|---|---|---|---|---|---|
| 5K standard | 160 | 5 | 2.5 | 1 | 5 | — | 10 |
| 5K Mg-free | 160 | 5 | 2.5 | — | 5 | — | 10 |
| HGS | 130 | 4.5 | 2 | — | — | 5 | 30 |
| Internal solutions | KCl | KGlu | CsCl | NaCl | MgCl2 | KOH | CsOH | EGTA | Hepes |
|---|---|---|---|---|---|---|---|---|---|
| 160 KCl | 160 | — | — | — | — | 15 | — | 5 | 10 |
| 160 CsCl | — | — | 160 | — | — | — | 15 | 5 | 10 |
| 132 KGlu | 20 | 132 | — | 6 | 1 | 15 | — | 1 | 10 |
| 155 KGlu | — | 155 | 5 | — | — | — | 15 | 5 | 10 |
| 140 KGlu | — | 140 | 20 | — | — | — | 15 | 5 | 10 |
pH was adjusted to 7.4 by NaOH and Hepes for 5K standard and 5K Mg-free; by NaOH and Pipes for HGS (high-glucose saline); by KOH and Hepes for 160 KCl and 132 KGlu; and by CsOH and Hepes for 160 CsCl, 155 KGlu and 140 KGlu. KGlu, potassium gluconate.
Figure 1. Experimental design and localization of NL and NM neurones.

A, a brainstem slice preparation after fixing (Nissl staining). NA is the location of nucleus angularis; NM, nucleus magnocellularis; and NL, nucleus laminalis. The square indicates the approximate location of photomicrograph C taken from a live slice preparation, and the arrow the approximate location of the NL neurone of B in the medial high frequency region. The arrows labelled D and L indicate the dorsal and lateral directions of the preparation. Scale bar 500 μm. B, photomicrograph of a NL neurone labelled with Lucifer Yellow CH through the recording patch pipette. The axon originated at the centre of the soma in the NL neurone. Calibration bar 10 μm. C, photomicrograph of the 16th embryonic day chick brainstem in the same orientation as A. Calibration bar 50 μm. Three electrodes were placed around the NL neurone: 1, the patch electrode for recording from the NL neurone; 2, for electrical stimulation to the dorsal dendritic layer; and 3, for local puff application of GABA towards soma. This arrangement of electrodes was adopted in the experiments of Figs 9-11.
Electrophysiological recordings
The whole-cell patch recording technique was used (Edwards, Sakmann, Konnerth & Takahashi, 1989). Pipettes were made from borosilicate glass capillaries (GC150TF-10, Clark), and had resistances of 5–7 MΩ when filled with the 160 KCl internal solution (composition in Table 1). The pipettes were coated with a silicon resin (Sylgard 184, Dow Corning Asia, Japan) close to the tip and the tip was fire polished before use. Whole-cell currents under voltage clamp and potentials under current clamp were recorded using a patch clamp amplifier (EPC-7, List). The electrode capacitance was compensated electronically during the cell-attached condition. The membrane capacitance (Cm) and resistance (Rm) were measured; Cm from the capacitive transient recorded in response to a small amplitude voltage step in voltage clamp (-5 mV, 20 ms), and Rm from the steady-state current in voltage clamp or voltage responses in current-clamp experiments (to injected current of -60 pA, 100 ms). The series resistance (10–15 MΩ) was then estimated from the capacitive transients in voltage clamp and was about 60 % compensated. The compositions of the external and internal solutions are listed in Table 1. The liquid junction potentials were measured and corrected (from -4 to -14 mV, see Hagiwara & Ohmori, 1982). Experiments were performed at room temperature (20–25°C) unless otherwise stated.
When the temperature was raised, the external medium was pre-warmed and circulated at a rate of 2.5–3 ml min−1. The temperature of the recording chamber was monitored with a thermistor probe and controlled by a Peltier device encircling the recording chamber (DTC-200T, DiaMedical, Yamanashi, Japan) within 0.5°C of the set value.
Data acquisition and analysis
Current and voltage output signals from the patch-clamp amplifier were usually filtered at 10 kHz through a four-pole low-pass Bessel filter (UF-BL2, NF, Japan), and sampled with a 12-bit A/D converter (ANALOG PRO2, Canopus, Kobe, Japan) connected to a 32-bit personal computer (PC-9801FA, NEC, Tokyo, Japan), and were stored on a hard disk drive. Off line analyses were performed on a work station (Micro-VAX station 2000, DEC).
All the statistics in this paper are presented in the form of means ±s.d.
Induction of postsynaptic responses by electrical stimulation
EPSCs were elicited in NL neurones by electrical stimulation to either ventral or dorsal dendritic layers, or to both regions, and GABAergic slow postsynaptic currents (PSCs) were evoked by electrical stimulation near to (within 50 μm) the recorded NL neurone. Electrical stimuli were applied by a glass pipette (1.8–2.2 μm tip diameter, Fig. 1C, 2) filled with either NaCl (1 M) or with extracellular medium, and biphasic square-wave voltage pulses of 15–90 V amplitude and 0.2 ms duration were applied every 2–3 s. This stimulus protocol enabled us to minimize the stimulus artifacts and amplitude fluctuations of the EPSPs and EPSCs. The intensity of electrical stimuli was adjusted to just below threshold so as not to evoke action potentials directly. Under voltage clamp, direct action potentials were identified as a surge of inward current immediately following the stimulus artifact.
Figure 2. Action potentials and synaptic currents recorded in a NL neurone.

A, inset illustrates the electrode arrangements for this experiment. a, 100 ms duration injected currents and b, action potentials. Resting membrane potential is indicated by the horizontal arrow. B, EPSCs were generated in the NL neurone in a 5K Mg-free extracellular medium with 20 μM bicuculline. a, EPSCs were induced by stimulating the ipsilateral NM axons in the dorsal dendritic layers of the NL neurone. Numbers on each record indicate the holding potentials in millivolts. b, peak EPSC currents at various holding potentials. c, EPSCs were blocked by CNQX (20 μM), reversibly.
Because of the multiple NM projection fibres innervating a single NL neurone, an action potential was generated from a single EPSP when the stimulus intensity was increased. Therefore, when the response probability (the probability of action potential generation) was measured, stimulus intensities were carefully adjusted. The intensity was usually set so as to generate action potentials for at least three consecutive trials with simultaneous bilateral electrical stimuli (for Figs 4 and 5) or when current injection was made on the rising phase of EPSPs (for Figs 10 and 11E). The intensity was further tuned to minimize generation of action potentials when two stimuli were separated by more than 4 ms and then remained fixed during experiments. This 4 ms interstimulus interval showed significantly reduced response probability but was not sufficient to completely block action potential generation in most cases (see Figs 10 and 11). The response probability was evaluated at one interstimulus interval from a series of 6–20 trials. When the recorded neurone showed any sign of deterioration such as membrane depolarization to more positive than -55 mV, reduction of input impedance or repeated failure of action potential generation, then experiments were suspended.
Figure 4. Coincidence detection at a NL neurone.

The projection bundles from ipsilateral and contralateral NM were electrically stimulated with glass electrodes placed on each side of the dendritic layers (see the inset in Fig 3A). EPSPs were recorded in bathing medium containing 20 μM bicuculline. ▴, times of stimuli to the ipsilateral projection bundle and ▿, to the contralateral projection bundle. EPSPs were recorded at -61 mV while systematically changing the interstimulus interval. 50 pA of 2 ms duration was injected at the end of each trace to monitor the condition of the neurone recorded. Stimulus artifacts were retouched in A. B, a series of traces were superimposed to show the small window region generating action potentials. C, the response probability to generate action potentials was calculated from 6–20 trials for each interstimulus interval, and was plotted against the interval. The maximum response probability was 0.13 and the interval corresponding to this probability was taken to be 0 in this experiment. The maximum response probability was occasionally deviated to a small extent (< 1 ms) from the actual null interstimulus interval. The horizontal arrow indicates the response window.
Figure 5. The response probability and the response window.

A, eight superimposed curves of response probabilities and their mean response probability as a function of the interstimulus interval. Two response probabilities which gave sharp interval sensitivities are indicated by thick lines, and thinner lines indicate four other probabilities. Two interrupted lines indicate response probabilities determined only for the contralateral leading (the dotted line) or the ipsilateral leading (the dashed line) intervals. The mean response probability was calculated by interpolations at each interval of the individual data and is shown as open circles connected by continuous lines. B, decay time constants of EPSPs (•), summed amplitudes of ipsilateral and contralateral EPSPs (□) and the membrane potentials (▵) were plotted against the response window in individual experiments. Note a clear correlation between the decay time constant of EPSPs and the response window. Neither the EPSP amplitude nor the resting membrane potential showed significant correlation with the response window.
Figure 10. Effects of GABA on coincidence detection.

A, a schematic drawing of the arrangement of pipettes for electrical stimulation, puff application of GABA and patch recording. GABA (10 μM) was applied towards soma. Electrodes were placed on the dorsal dendritic layer to stimulate the ipsilateral branch from NM. The interval between the current injection into the recorded NL neurone and the stimulation to nerve fibres was changed systematically by 0.5–1 ms steps. The interstimulus intervals were measured from the onset of EPSC as illustrated in A and indicated in each set of superimposed traces (9 traces were superimposed in each panel). The intensity of injected current and the stimulus intensity of nerve fibres were each adjusted below threshold for action potential generation, but strong enough to generate action potentials when the two inputs were coincident. B, action potentials generated by coincidence of inputs; a, control and b, during GABA application. Note the depolarization by GABA. The patch electrode was filled with the 132 KGlu (28 mM Cl−) internal medium. Intensity of injected current was 550 pA in this experiment. The mean EPSP amplitude was 6.9 ± 0.7 mV in the control (12 records at -67 ± 1.5 mV) and 4.8 ± 1.2 mV with GABA (12 records at -61 ± 1.5 mV). Note an acceleration of decay of EPSPs during GABA application (see 4 ms traces). C, the response probability plotted as a function of the interstimulus interval. Two injected current intensities were adopted in this experiment; 550 pA, control 1 and 500 pA, control 2. Response probability was calculated from 9 to 20 trials at each interval. Note the sharpening of the coincidence detection with GABA application. D, all 7 experiments were summarized (mean +s.d. for control (dashed line), and mean - s.d. in the presence of GABA (continuous line)). With application of GABA, the maximum response probability was reduced from 0.84 to 0.74, and the response window was reduced from 5.4 to 1.6 ms. In these experiments, measurements were made only for the ipsilateral leading set of stimulations, and the response window was calculated as twice the interval corresponding to the half-maximum response probability. During GABA application, the membrane potential was depolarized to -59 ± 2 mV from the resting potential of -65 ± 2 mV (7 cells).
Figure 11. Effects of raised temperature on excitabilities and response probabilities of NL neurones.

A, mean decay time constants were plotted against temperature for EPSCs (RT indicates room temperature, 20–25 °C). Inset shows typical EPSCs recorded at RT and at 40 °C, amplitude normalized to show the difference in the time course. B, voltage dependence of the mean EPSP decay time constant at different temperatures; RT, 7 cells; 35 °C, 7 cells; 40 °C, 4 cells. Application of GABA (10 μM) towards soma depolarized the membrane and shortened the decay phase of EPSPs. Two filled symbols connected by an arrow in each panel show the membrane depolarization during GABA application and decay time constant of EPSP at the control (tail of arrow) and during GABA application (head of arrow), at corresponding membrane potentials. Typical EPSPs in the control (C) and during GABA (G) are shown in each panel after scaling the amplitude. C, action potentials generated by injection of depolarizing current (3 ms) at 25 °C (left) and 35 °C (right), recorded from two different cells in the same slice preparation. The membrane potential at 25 °C was -61 mV and -59 mV at 35 °C. The action potential threshold at 25 °C was -38 mV and −40 mV at 35 °C, and the durations were 0.82 ms at 25 °C and 0.56 ms at 35 °C. D, passive membrane properties measured at different temperatures. a shows the mean membrane resistance and b illustrates the mean membrane capacitance measured at the temperatures indicated. E, the mean response probabilities were evaluated at 33 °C for 3 neurones with the same experimental protocol as in Fig. 10 and plotted against interstimulus interval. The response window was 6.1 ms in the control (•) and 1.8 ms during GABA (10 μM, ▪) application towards soma.
Extraction and ensemble averaging of spontaneous PSCs
Spontaneously generated PSC events were extracted from records, ensemble averaged and the decay time constant was calculated by curve fitting (Fig. 7C). Spontaneous PSC events were identified in the play back data on the computer screen and a block of data points which included the PSC was selected, extracted and transferred to the analysis program. These extracted PSCs were ensemble averaged by alignment to the time at which they reached to 30 % of the peak amplitude.
Figure 7. Spontaneous PSCs recorded immediately after establishing whole-cell recording.

PSCs were recorded in medium containing CNQX (20 μM) to suppress excitatory synaptic inputs and Ba2+ (1 mM) to facilitate release of neurotransmitters. ECl was set at −90 mV by an internal solution of 155 KGlu (5 mM Cl−, see Table 1 for composition). A, after establishing the gigaohm seal condition, the patched membrane was voltage clamped at around the resting membrane potential of the cell (-62 mV). The vertical arrow on the top trace indicates the time of patch membrane rupture. Upward arrowheads indicate spontaneous PSCs, inward currents. A 20 ms 10 mV voltage step was applied at the beginning of each trace to monitor the membrane input impedance. B, 20 min after the start of whole-cell recording. All spontaneous PSCs were outward going (indicated by downward arrowheads). Ca, the ensemble averaged inward current of 21 spontaneous PSCs recorded immediately after rupture of the patch membrane. b, ensembled average outward current of 60 spontaneous PSCs 20 min after the start of whole-cell recording. In a and b, spontaneous PSCs were extracted and ensemble averaged, aligning on the times at 30 % of the peak (see Methods). D and E, other examples to show the reversal of spontaneous PSCs with time (E, 15 min) after the start of whole-cell recording (indicated by an arrow in D). The membrane potential was voltage clamped at -59 mV. F, bath application of bicuculline (Bic, 20 μM) blocked these spontaneous PSCs.
Low pressure local puff applications of GABA and baclofen
Local applications of GABA were made by applying low pressure (60–400 cmH2O), 5–20 s duration pulses of air to a pipette containing GABA (Fig. 1C, 3). Baclofen was applied similarly in some experiments. The tip diameters of the puffer pipettes were 1.5–2 μm.
Figure 3. Independence of responses to bilateral stimulation and comparison of bilaterally elicited EPSC time courses.

A, EPSCs were recorded in a NL neurone using 3 stimulating protocols at every 2–3 s in medium containing bicuculline (20 μM). The inset shows the arrangement of electrodes. a, ipsilateral and contralateral projection bundles from NM were stimulated at 5 ms intervals (bilateral). b, the ipsilateral projection bundle was stimulated (mono). c, two stimuli were applied successively to the ipsilateral projection bundle at 5 ms interval (double). The size of ipsilateral EPSCs (marked with * in each trace) was measured and the mean was plotted in B. Stimulus artifacts were retouched in A. B, mean amplitudes of ipsilateral EPSCs recorded by the protocols in A (n = 7 cells). ** Indicates a statistically significant reduction of EPSC amplitudes (paired t test, P < 0.002, 7 cells). C, 3 examples of bilateral EPSCs induced by bilateral stimuli. D, comparison of decay time constants of bilateral EPSCs. Decay time constants were measured by fitting a single exponential function to the falling phase in each pair of EPSCs, and were plotted against the time constant measured in the other EPSC of the pair.
Morphological study
After electrophysiological recordings with Lucifer Yellow CH (0.1 %)-filled patch electrodes, the slices containing the recorded cells were fixed with 10 % formaldehyde in sodium phosphate buffer (pH 7.2) for 12 h at room temperature. These slices were then dehydrated with ethanol, cleared with xylene, mounted on a glass slide and embedded in Eukitte (O. Kindler, Germany). These preparations were then viewed with a fluorescence microscope (Fig. 1B).
Chemicals
Sources of chemicals were as follows: 6-cyano-7-nitroquinoxaline-2,3-dione (CNQX), and 6,7-dinitroquinoxaline-2,3-dione (DNQX), Tocris Neuramin; 4-amino-n-butyric acid (GABA), Nacalai; bicuculline, Sigma; (±) -baclofen HCl, Research Biochemicals International.
RESULTS
The structure and passive membrane properties of NL neurones
In transverse slice preparations, NL neurones are arranged tonotopically along the longitudinal axis of the nucleus from the high frequency rostromedial region to the low frequency caudolateral region (Fig. 1A; see also Rubel & Parks, 1975). The dendrites of NL neurones are directed towards the dorsal and ventral poles (Fig. 1B) and receive excitatory inputs from either ipsilateral or contralateral NM, respectively. Figure 1B shows a neurone located in the medial NL region labelled with LuciferYellow CH from the recording patch electrode. The neurone had dendritic arbors on the ventral (towards lower left) and on the dorsal (towards upper right) poles; an axon originates from the soma. The lengths of the dendrites change systematically along the tonotopic axis, with neurones in the low frequency region having extended dendrites while those in the high frequency region are short. This dendritic arbor gradient is known to develop from around the 14th embryonic day (Smith, 1981). In the E15–20 embryos we have used, dendritic length gradients were present and the neurones’ input capacitances were larger in the lateral regions (64 ± 10 pF, 4 cells) than in the medial (32 ± 6 pF, 4 cells). We have, however, recorded from neurones without particular consideration of their location in most of the following experiments.
Using the 160 KCl or 132 KGlu intracellular medium (Table 1), a mean resting potential of -60 ± 2 mV was attained immediately after starting whole-cell recording (28 cells). The input resistance and capacitance were measured from holding potentials of about -70 to -75 mV and were 334 ± 227 MΩ and 56 ± 16 pF (41 cells), respectively. The membrane time constant was therefore 18–20 ms at around -75 mV.
The action potential
When a suprathreshold depolarizing current was injected in the NL neurone, the cell generated a single action potential at the onset of membrane depolarization, irrespective of the duration or magnitude of injected current. Figure 2A illustrates a series of voltage responses generated by current injections of 100 ms duration, using the 160 KCl intracellular medium (see Table 1). A damped oscillation of the membrane potential was observed following the action potential (24 out of 26 neurones investigated) and in two other neurones a second action potential was generated from the depolarizing peak of the oscillation. The amplitude of steady-state voltage responses showed a marked outward-going rectification, indicating an increased input resistance at hyperpolarized membrane potentials. At membrane potentials of about -110 mV there was a sag suggesting a slow activation of inward currents at these negative membrane potentials. These features, namely generating a single action potential and the presence of an outward rectification are similar to those observed in the NM neurone. Both NM and NL neurones can produce phasic responses appropriate for transmitting timing information of auditory signals (Zhang & Trussell, 1994; Reyes, Rubel & Spain, 1994, 1996; Koyano, Funabiki & Ohmori, 1996).
EPSCs recorded in NL neurones
NL neurones receive excitatory inputs from the NM through the activation of non-NMDA type glutamate receptors (Zhou & Parks, 1991; Raman, Zhang & Trussell, 1994). Postsynaptic currents were recorded from NL neurones in a 5K Mg-free extracellular medium with the 160 CsCl intracellular medium in the patch pipette (Table 1). In the presence of 20 μM bicuculline, electrical stimulation applied to the dorsal dendritic layers (Fig. 2A inset) generated rapid inward currents at -65 mV (Fig. 2B). The current-voltage relationships were linear and had a mean reversal potential of approximately 0 mV (1.4 ± 6.6 mV, 8 cells, Fig. 2Bb). The inward currents recorded at negative membrane potentials and the outward currents recorded at positive membrane potentials were basically symmetrical in shape. However, a slight prolongation was observed in the time course of outward current recorded at +45 mV (Fig. 2Ba). These prolongations of the decay kinetics were not due to a contribution from NMDA receptors since both DNQX (20 μM, n = 4 cells) and CNQX (20 μM, n = 3 cells) completely and reversibly suppressed evoked responses in the 5K Mg-free extracellular medium (Fig. 2Bc). When ventral dendritic layers were stimulated, similar synaptic currents were observed. These non-NMDA receptor-mediated synaptic inputs are likely to be projections from the ipsilateral (dorsal) and contralateral (ventral) NM neurones (Young & Rubel, 1983).
Dual excitatory synaptic inputs to the NL neurone
The NL of barn owl and budgerigar and the medial superior olivary (MSO) nucleus of dog and cat are known to be the sites of coincidence detection utilized for interaural timing discrimination (barn owl, Sullivan & Konishi, 1986; budgerigar, Amagai, Carr & Dooling, 1996; dog, Goldberg & Brown, 1969; cat, Yin & Chan, 1990). We have simulated the situation of coincidence detection at the NL in slice preparations by electrically stimulating both ipsilateral and contralateral projection bundles from the NM (Fig. 3A inset).
EPSCs were recorded in a NL neurone under three stimulating protocols: (1) a contralateral stimulation followed by an ipsilateral stimulation with a 5 ms delay (Fig. 3Aa, bilateral); (2) a single ipsilateral stimulation (Fig. 3Ab, mono); and (3) two ipsilateral stimuli with a 5 ms interval (Fig. 3Ac, double). The size of ipsilateral EPSCs (* in each panel) was measured. A marked reduction of EPSC amplitude was found only in case (3) when two stimuli were applied to the ipsilateral projection bundle at a short interval (double 2, Fig. 3B). This observation indicated that the two-sided stimulation (Fig. 3Aa, bilateral) had activated the ipsilateral and contralateral projection bundles independently without electrical interaction.
The EPSC amplitude depended on the stimulus intensities due to the multiple NM neurones innervating a single NL neurone (from -0.03 to -1.7 nA at -65 mV); twenty to fifty neurones are estimated to innervate a single NL neurone (see Reyes et al. 1996). Therefore, the amplitudes of ipsilateral and contralateral EPSCs were not necessarily the same when bilateral stimuli were applied (Fig. 3C). However, there was a clear correlation between the EPSC decay time constants evoked in a single neurone by the ipsilateral and the contralateral stimuli (Fig. 3D, correlation coefficient r = 0.98, 34 cells, P < 0.001). This indicates that a NL neurone generates kinetically equivalent synaptic currents in response to inputs from either side. These decay time constants were measured by fitting a single exponential function to each EPSC. We have not systematically investigated the relationship between the decay time constant and the age of the embryos.
Generation of action potentials in the NL neurone
Action potentials were generated from EPSPs in the 5K standard extracellular medium with 20 μM bicuculline added and were recorded with a 160 KCl or a 132 KGlu intracellular medium. The probability of spike generation (the response probability) was calculated as the ratio of trials which generated action potentials at particular interstimulus intervals by applying electrical stimuli bilaterally to the ipsilateral and to the contralateral projection fibres from NM. Interstimulus intervals (▴, ipsilateral and ▿, contralateral stimuli, Fig. 4A) were indicated as negative when the contralateral stimulus was leading. Action potentials were generated by paired EPSPs at intervals less than about 3 ms as shown for 1 ms in Fig. 4A, and by eight superimposed traces for a larger range of intervals in Fig. 4B. The maximum response probability calculated from this experiment was 0.13. The response window was then defined for a cell as the difference between the intervals at which the response probability fell to one-half of its maximum value. For the above neurone, the response window was 4.7 ms as was shown by the double-headed arrow in Fig. 4C.
Some cells showed high response probabilities when two EPSPs were generated in close coincidence, while other cells showed only a moderate increase of the response probability (see Fig. 5A); the mean maximum response probability for eight cells was 0.58. Two cells showed a narrow interstimulus interval dependence and the response window was 0.7–1.7 ms (two traces drawn by thick lines in Fig. 5A), while another four cells had response windows larger than 3 ms (four thin line traces in Fig. 5A). These results showed a tendency for more narrow response windows when the maximum response probability was small; 0.37 ± 0.33 (n = 2 cells) indicated by thick lines for narrow response windows and 0.72 ± 0.42 (n = 4 cells) indicated by thin lines for wide response windows. In two other cells the response probability was measured only for the stimulus intervals of either the ipsilateral leading (indicated by a dashed line) or the contralateral leading (indicated by a dotted line). The response windows were estimated for these two cells by assuming a symmetrical response probability (6.2 ms for the dashed line and 7 ms for the dotted line in Fig. 5A). This assumption was consistent with the symmetry found in the six other experiments, and the fact that we found no statistically significant differences in response probabilities between the ipsilateral leading and contralateral leading time intervals evaluated at 0.5 ms intervals (paired t test, P > 0.7). The mean response probability was plotted in Fig. 5A (○) and the response window was 4.2 ms.
Figure 5B shows the response window correlation with the decay time constant of EPSPs (•), with the amplitude of EPSPs (□, summed amplitudes of both the ipsilateral and the contralateral EPSPs) and with the resting membrane potential (▵). The decay time constant of EPSPs was measured after ensemble averaging of EPSPs. A clear correlation was found between the decay time constant of EPSPs and the response windows (r = 0.88, P < 0.01). The response window was 0.7 ms when EPSPs decayed with a time constant of 2.0 ms and 7 ms for those which decayed with a 12.5 ms time constant. Neither the EPSP amplitude nor the resting membrane potential showed a significant correlation with the response window; r = -0.09 with EPSP amplitudes (P > 0.1) and r = -0.56 with the resting membrane potential (P > 0.1). However, the maximum response probability had a significant positive correlation with EPSP amplitude (r = 0.80, P < 0.05).
GABAergic PSCs recorded in the NL neurone
Histochemical observations suggest the presence of GABAergic inputs to NL neurones (von Bartheld et al. 1989; Code et al. 1989; Lachica et al. 1994). However, GABAergic synaptic responses have not yet been reported in NL neurones. When electrical stimulation was applied near the voltage clamped NL neurone (see the inset of Fig. 6), we occasionally observed relatively slow currents in the presence of CNQX (40 μM) in the 5K standard extracellular medium (Table 1). The time courses of these currents were distinctly different from the EPSCs (Fig. 6A). These slow postsynaptic currents (PSCs) had complex decay components which could be fitted with a fast time constant of 15 ± 7 ms and a slow time constant of 106 ± 44 ms (21 cells, at -65 ± 11 mV). The measurements were made on both evoked (15 cells) and spontaneous PSCs (6 cells), but significant differences in their kinetics were not found (unpaired t test, P > 0.7). The decay time constant of the slow synaptic potential was 101 ± 40 ms under current clamp (6 cells, at -64 2 mV).
Figure 6. GABAergic PSCs in NL neurones.

GABAergic postsynaptic currents (PSCs) recorded in a NL neurone with CNQX (40 μM) in the bathing medium and with a reduced intracellular Cl− concentration (20 mM Cl−, 140 KGlu intracellular medium; composition in Table 1). Electrical stimuli were applied in the vicinity of recorded NL neurone (inset). A, postsynaptic currents recorded in a NL neurone at various holding potentials. Numbers on each current trace indicate the holding potential in millivolts. Note the longer time course of PSCs than that of the EPSCs shown in Figs 2 and 3. B, the peak PSCs amplitudes obtained with different pipette solutions plotted against holding potentials. See Table 1 for composition. The direction of the current was reversed at -52 mV when recorded with the 140 KGlu internal medium containing 20 mM CsCl (•), and at about zero mV with the 160 CsCl internal medium (○). Lines were drawn through the points by eye. C, PSC was suppressed reversibly by bicuculline (Bic, 20 μM).
The Cl− dependence of the PSC reversal potential was investigated with a reduced Cl− intracellular medium (140 KGlu, Table 1) and with 40 μM CNQX in the extracellular medium. Figure 6A shows PSCs recorded at several holding potentials from -87 to -12 mV. The current reversed polarity at -52 ± 2 mV (n = 3 cells, Fig. 6B, •, the calculated ECl was -54 mV). When the 160 CsCl solution was used as the internal medium, the reversal potential was 1.3 ± 4 mV (n = 3 cells, Fig. 6B, ○, calculated ECl was -2 mV). These slow PSCs were reversibly blocked by 20 μM bicuculline (Fig. 6C, see also Fig. 7F), and were concluded to be generated by the activation of GABAA receptors.
Conductance changes generated by evoked GABAergic PSCs had showed large variation from cell to cell and the mean was 4.3 ± 3.0 nS (range from 1.8 to 11 nS, 15 cells, recorded at -65 ± 11 mV), and the mean conductance change due to spontaneous GABAergic PSCs was 1.7 ± 0.7 nS (6 cells, mean for 96 to 285 records in each NL neurone). Since the input impedance of the NL neurone was 3 nS (334 ± 227 MΩ), the activation of these GABA synapses would considerably increase the cell's input conductance.
Spontaneous GABAergic PSCs recorded immediately after the start of whole-cell recording
When recorded at resting membrane potential, IPSPs could be depolarizing when intracellular Cl− concentration ([Cl−]i) was high or hyperpolarizing when [Cl−]i was low (Hyson, Reyes & Rubel, 1995; Golding & Oertel, 1996). We have estimated the polarities of spontaneous GABAergic PSCs at resting membrane potential immediately after attaining whole-cell recording, presumably before dialysis of the cell interior by the medium in the patch pipette.
Under the gigaohm seal, cell-attached patch recording condition, the patch pipette potential was set at -62 mV which was close to the mean resting membrane potential (-60 ± 2 mV). CNQX (20 μM) and Ba2+ (1 mM) were added to block excitatory synaptic inputs and to facilitate the spontaneous release of neurotransmitters (McLachlan, 1977), respectively. The patch pipette was filled with a low Cl− intracellular medium (155 KGlu, Table 1) and the calculated ECl was −90 mV with the extracellular 5K standard medium. When the whole-cell recording condition was achieved (arrow in Figs 7A and D), a burst of inward-going membrane currents was observed. These inward-going spontaneous current transients showed a fast rise and a relatively slow decay (Fig. 7Ca). Figure 7Ca illustrates the ensemble averaged spontaneous inward current from records immediately after achieving whole-cell recording shown in Fig. 7A. With the membrane potential maintained at -62 mV, these spontaneous current transients all became outward going; 15–20 min after the start of whole-cell recording (Figs 7B and E). Figure 7Cb shows the ensemble averaged spontaneous outward current transient by extraction (see Methods). The averaged current traces shown in Fig. 7C had similar time courses with a decay time constant of 74 ms (Fig. 7Ca) and 51 ms (Fig. 7Cb). These currents were blocked by 20 μM bicuculline (Fig. 7F), therefore were most likely generated through the activation of GABAA receptors. Similar observations were made in a total of ten NL neurones. We have not made further experiments to determine the exact level of [Cl−]i, but these experiments indicate that the ECl of an intact NL neurone could be more positive than the resting membrane potential, and if so, GABAergic inputs in vivo are likely to depolarize the postsynaptic membrane.
The effect of GABA on the voltage changes generated by pairs of injected depolarizing current pulses
The activation of GABAA receptors of the NL neurone increased the membrane conductance and depolarized the membrane. We have investigated the effects of GABA on the excitability of the neurone in which action potentials were generated by applying pairs of current pulses at various time intervals. When paired depolarizing current pulses were injected, the response probability increased with shorter interpulse intervals (Fig. 8). The duration of each current pulse was set to be the same as that of the mean EPSC (3 ms) and the intensity was adjusted to a level at which a single current pulse alone did not generate action potentials in five consecutive trials. When a pulse pair was injected with a 7 ms interval, the second current pulse was on the falling phase of the first depolarization and produced an action potential in approximately half the trials (in 13 trials, Fig. 8A). When 10 μM GABA was applied locally (application period indicated by bars in Fig. 8), the depolarizing current pulses generated almost square-shaped membrane potential changes which were completely separated. Thus GABA application shortened the membrane time constant and reduced the amplitude of membrane depolarization induced by current injection. The application of GABA produced a maximum 20 mV depolarization because the ECl level was set at -45 mV in this experiment by the 132 KGlu internal medium (composition in Table 1).
Figure 8. Effects of GABA on NL neurone responses induced by paired depolarizing current injections.

Paired depolarizing current pulses (120 pA, 3 ms) were injected into a NL neurone in order to mimic the excitatory inputs from bilateral NM. The 132 KGlu internal solution (28 mM Cl−, see Table 1 for composition) was used to set ECl at -45 mV. Resting membrane potential of the cell was -67 mV. GABA (10 μM) was puff applied during the periods indicated by bars while injecting current pulse pairs at 1 s−1, and were presented sequentially. The current pulses of a pair were separated by intervals indicated on the left of each set of traces. The 0 ms intervals was a double intensity current.
When the interpulse interval was shortened to 2 ms, the second current pulse always generated action potentials before application of GABA. However, the response probability was decreased during GABA application (Fig. 8B). The failure of spike generation continued for a short time after suspension of GABA application while the membrane time constant recovered quickly to the control level. When a pair of current pulses was injected as a single current pulse of double intensity, GABA application did not affect the generation of action potentials (Fig. 8C). The injected current was apparently sufficient to overcome the inhibitory effects of GABA. Similar observations were made in a total of three NL neurones.
GABA (10 μM) applied under current clamp decreased the membrane resistance to 40 ± 26 MΩ from its control value of 274 ± 145 MΩ (4 cells) when measured at -63 ± 3 mV, near the resting membrane potential (-61 ± 8 mV) maintained by current injection during GABA application. The membrane capacitance was not changed (66 ± 17 pF for the control and 61 ± 27 pF during GABA application, P > 0.7). Therefore, the time constant of the neurone was reduced from 19.1 ± 12.6 to 2.3 ± 1.9 ms.
These experiments mimicked the bilateral excitatory synaptic inputs from NM to a NL neurone, and demonstrated a possible mechanism by which GABA might modulate coincidence detection. We performed further experiments directly to examine the GABA effects on synaptic potentials produced by the excitatory inputs.
The effect of GABA on EPSCs and EPSPs in NL neurones
Most experiments in this section were performed in NL neurones located laterally in the low frequency region, because these neurones have longer dendrites and GABA- positive terminal populations are more dense than neurones located in the high frequency region (Code et al. 1989). In the experiment shown in Fig. 9, whole-cell recording was made using a reduced Cl− intracellular medium (132 KGlu, calculated ECl was -45 mV).
Figure 9. Effects of GABA application and membrane depolarization on excitatory postsynaptic responses to NM stimulation.
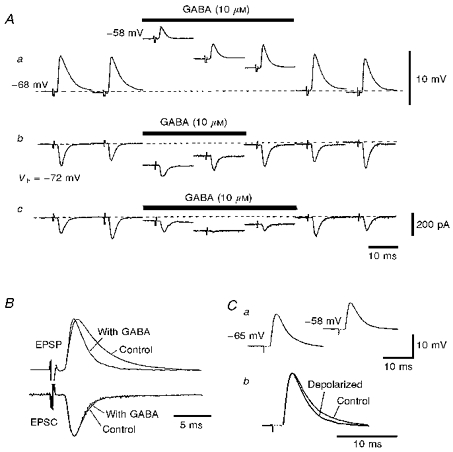
Aa, EPSPs were recorded every 2.5 s and alternate records were presented sequentially to demonstrate the shortening time course of EPSPs during GABA application. The resting membrane potential, −68 mV, was indicated by the dashed line. b and c, EPSCs were recorded at 2.5 s intervals and successive traces were presented. The level of holding current to -72 mV was indicated by the dashed line. The bars indicate the duration of GABA application towards soma (b) and towards dorsal dendrites (c). The maximum conductance increase was 6.5 ± 4.3 nS when GABA was applied toward the soma, and 6.3 ± 4.7 nS toward dendrites (5 cells). B, the time courses of EPSPs and EPSCs were compared by superimposing traces for the conditions indicated. The traces were scaled in order to facilitate comparison of the time courses. GABA was applied towards soma. C, effects of membrane depolarization on the EPSPs. a, the membrane potential was depolarized to the level depolarized by GABA (10 μM) as indicated by manipulating the holding current. The resting potential of the neurone was -65 mV. b, two EPSP traces in a (control at -65 mV, depolarized at - 58 mV) were superimposed after amplitude scaling. The 132 KGlu (28 mM Cl−) internal medium was used for all experiments.
GABA (10 μM) applied locally to the cell soma (see Fig. 9Aa), depolarized the membrane, reduced the size of EPSPs and accelerated their time courses. On average for five cells, the membrane depolarized in about 1 s (1.1 ± 0.3 s) to -58 ± 2 mV from a resting potential of -67 ± 3 mV. This depolarization subsided gradually during continued GABA application to -64 ± 2 mV in about 20 s, perhaps due to desensitization of the GABA receptors. EPSPs evoked in these cells were reduced to 32 % of the control (mean, 43 ± 12 %) at about the peak depolarization and to 65 % (60 ± 10 %) at -64 mV after desensitization (Fig. 9Aa). The EPSCs were similarly reduced (Fig. 9Ab and c).
The effects of GABA on the amplitude of EPSCs showed marked dependence on the site of application. When GABA was applied to the cell soma (Fig. 9Ab), the EPSCs were reduced to 92 ± 30 % of the control (n = 5 cells): The reduction by applied GABA was much greater when applied to the dendritic region (Fig. 9Ac, 46 ± 26 % of the control, n = 5 cells). Depression of EPSCs by local GABA application was prevented by simultaneous application of bicuculline (20 μM, 3 cells). The local application of baclofen (10 μM) did not affect the size of EPSCs irrespective of the site of application to soma (98 ± 7 % of the control, 4 cells) or to dendrites (96 ± 6 % of the control, 8 cells). Therefore, this reduction of EPSCs amplitude was mostly due to the shunting conductance of the postsynaptic GABAA receptors.
Both EPSPs and EPSCs were scaled and ensemble averaged to compare their time courses before and during GABA application (Fig. 9B). The EPSP decay time constant was 3.6 ms (5.3 ± 1.1 ms) before, and 1.6 ms (2.1 ± 0.6 ms, 7 cells) during, GABA application. However, the time course of EPSCs was not affected; the EPSC decay time constant was 1.7 ms (1.3 ± 0.4 ms) in the control and 1.5 ms (1.2 ± 0.4 ms, 12 cells) during GABA application. In these experiments when GABA (10 μM) application was directed toward the soma, the increase in membrane conductance was 6.5 ± 4.3 nS (n = 5 cells). This was smaller than the previous case when GABA was applied diffusely towards recorded neurones (21 nS from experiments of Fig. 8).
Membrane depolarization and its effect on the EPSPs
GABA application towards the soma reduced the mean size of EPSPs from 8.5 ± 6.0 to 4.4 ± 3.0 mV (57 ± 19 %), accelerated the time course of EPSPs, and simultaneously depolarized the membrane from the resting potential of -67 ± 5 to -60 ± 6 mV or a mean of about 7 mV during the 5–20 s applications of GABA (7 cells). However, membrane depolarization to the level produced by GABA (-58 mV), by adjusting the holding current, reduced the EPSP size to 77 % (80 ± 16 %, n = 6 cells) of that recorded at the resting potential (-65 mV, Fig. 9Ca). This reduction of EPSP amplitudes was significantly smaller than that produced by GABA application (P < 0.01).
Figure 9Cb shows two EPSPs recorded at resting membrane potential (the decay time constant was 4.3 ms) and at the depolarized membrane (3.1 ms) superimposed after scaling. EPSP decay phase acceleration was small when produced by membrane depolarization alone (see also Fig. 11B).
The effect of GABA on the response probability with coincidence of synaptic inputs and current injections
In view of the accelerating effects of GABA as shown in Figs 8 and 9, it seemed likely that GABA would contribute to improving the sensitivity for coincidence detection by the NL neurone. The effect of GABA on the coincidence detection of two inputs to the NL neurone was investigated by evoking EPSPs with NM ipsilateral projection bundle stimulation while injecting a depolarizing current pulse (from 100 to 550 pA) with the patch electrode to simulate the contralateral input. The duration of injected current pulses (3 ms) was set about equal to the mean duration of the recorded EPSCs. Local GABA application narrowed the coincidence detection in all seven cells tested with this protocol.
As illustrated in Fig. 10A, the interstimulus interval was increased systematically from 0 to 4 ms, as measured from the onset of the EPSCs. When GABA was applied locally to the soma the membrane potential was depolarized from -67 to -61 mV (Fig. 10B). The amplitude of EPSCs was not affected; 199 ± 38 pA in the control, and 195 ± 48 pA with GABA, means of 23 and 9 records, respectively. EPSP amplitudes were also not affected by the GABA application but their decay time courses were accelerated.
When the time of current injection was delayed systematically, the response probability decreased as the interval increased from 0 to 4 ms in the control experiment (Fig. 10Ba). At 4 ms, 39 % of the trials generated action potentials while 96 % of the trials generated action potentials at 2 ms and 100 % at 0 ms intervals with injected current pulses of 550 pA (control 1, Fig. 10C). When the injected current was reduced to 500 pA, the response probability decreased systematically, and the probability was 0.22 at 2 ms intervals (control 2, Fig. 10C). When GABA (10 μM) was applied, action potentials were observed only when current injections were made simultaneously with the EPSPs (Fig. 10Bb), irrespective of the intensities of injected current (Fig. 10C). Clearly GABA sharpened the coincidence detection of these neurones. In these experiments, we have evaluated the response probabilities by counting regenerative membrane depolarizations as action potentials, namely when clear inflections in the positive direction were recognized in the rising phase of each record.
All seven experiments were summarized in Fig. 10D. The maximum response probability was 0.84 in the control experiments and was reduced to 0.74 during GABA application. Response probability decreased steeply during GABA application and the mean response window was 5.4 ms in the control and 1.6 ms during GABA application. Figure 10C and D shows only the ipsilateral leading side of the response probabilities, and response windows were calculated for each figure as twice the interval where the response probability was larger than half the maximum value.
Effects of membrane depolarization on the response probabilities
The application of GABA always depolarized the membrane by about 7 mV from the resting potential of the neurone. This small membrane depolarization alone did not greatly affect the time course or the amplitude of EPSPs (Figs 9C and 11Ba). We have measured the response probability both at the resting membrane potentials and at the membrane potentials corresponding to the GABA-induced depolarization levels. When the response probability was evaluated with bilateral EPSPs (3 cells), the mean response window was 3.4 ms at resting potential (-65 ± 2 mV) and 5.2 ms when depolarized to -58 ± 3 mV. When evaluated by ipsilateral EPSPs and current injections through the recording electrode, the response window was 3.2 ms at resting membrane potential and 3.5 ms when depolarized (n = 8 cells). These two experiments demonstrated that membrane depolarization alone, to levels attained by local GABA application, did not narrow the response window.
Effects of temperature on the response probability
The 1.6 ms response window during GABA application was still far from the acuity expected in the animal (less than 180 μs, Hyson et al. 1994). To test the possibility that the broad response window was due to the low temperature of the slices, experiments were performed at higher temperatures up to the chicken's body temperature (41°C). The EPSC falling phases were accelerated as illustrated in the inset of Fig. 11A, giving decay time constants of 1.1 ± 0.4 ms at 20–25°C (n = 38 cells); 0.52 ± 0.1 ms at 35°C (n = 17); and 0.36 ± 0.1 ms at 40°C (n = 10) when measured at -67 ± 5 mV (Fig. 11A). The apparent Q10 (22–40°C) of the decay time constant was 1.9. Decay time constants of EPSPs were voltage dependent and were shortened by membrane depolarization and by the rise of temperature (Fig. 11B). However, the decay times of the EPSPs were less affected than for the EPSCs; the decay time constant of EPSPs measured at -65 mV at 40°C was 4.3 ms, shortened by 1.4 times from that recorded at room temperature (5.9 ms at -65 mV). Application of GABA (10 μM) accelerated the decay time course of EPSPs and this acceleration was marked at higher experimental temperature (see insets of Fig. 11B).
The threshold for the generation of action potential was not changed (-45 ± 3 mV at 20–25°C and -47 ± 5 mV at 35°C, P > 0.5), but the half-amplitude width was shortened from 0.85 ± 0.19 ms (19 cells) to 0.59 ± 0.17 ms (7 cells) by the increase from 25 to 35°C (Fig. 11C). The membrane resistance showed a tendency to decrease at higher temperature, and was 334 ± 227 MΩ (n = 41 cells) at 20–25°C; 284 ± 102 MΩ (n = 13 cells) at 35°C; and 244 ± 287 MΩ (n = 7 cells) at 40°C; but these differences were not statistically significant (P > 0.1). The membrane capacitance was not affected, and was 56 ± 16 pF (41 cells) at 20–25°C; 63 ± 14 pF (13 cells) at 35°C; and 54 ± 14 pF (7 cells) at 40°C (Fig. 11D). The membrane time constants of these cells were 16.0 ± 10.2 ms at room temperature, 14.2 ± 10.2 ms at 35°C, and 6.3 ± 3.1 ms at 40°C.
The profile of coincidence detection at 33°C (Fig. 11E, 3 cells) was not different from that obtained at room temperature (Fig. 10D). The response probability was evaluated as that shown in the experiment of Fig. 10. The response window was 6.1 ms for the control (•), and the application of GABA narrowed the response window to 1.8 ms (▪). We have tried to evaluate response probabilities at 40°C, but failed to maintain generation of action potentials for a sufficient period of time.
DISCUSSION
Nucleus laminaris neurones are proposed to detect the coincidence of bilateral auditory signals, and the probability of action potential generation (response probability) should be a function of the time difference between bilaterally evoked EPSPs. From the head size of a chicken, the maximum difference for sound arrival time between the two ears was estimated as 180 μs (Hyson et al. 1994). Although we do not yet know the ITD dependent firing behaviour of chicken NL neurones in vivo, we expected that the maximum response window for a single NL neurone would be near to 180 μs. In our present experiments, however, the NL neurone were able to respond to bilateral EPSPs separated by as much as 4 ms (Fig. 5A). The width of the response window was found to be due primarily to the decay rate of the evoked EPSPs (Fig. 5B). We have further found that the response probability relationship to interstimulus interval was sharpened by local pressure application of GABA (Fig. 10). In these experiments we applied GABA as a substitute for GABAergic PSPs, because of the technical difficulty in evoking GABAergic PSPs separately from EPSPs. Application of GABA towards the soma was slightly more effective in generating a conductance increase (6.5 nS) than that produced by GABAergic PSCs (4.3 nS, ranging from 1.8 to 11 nS). GABA reduced the response probability window but only to 1.6–1.8 ms (see Figs 10 and 11). The performance of the NL neurone as a coincidence detector might be influenced by many factors, including slicing the brainstem itself, by our protocol of electrical stimulation and current injection, and by the stage of maturation of the chick embryo.
Slicing the brainstem would have disrupted intrinsic networks including the projections from NM to NL. However, the slice experiments still seem to be the most direct analytical approach for understanding the function of NL neurones in coincidence detection. The response window was probably affected by the intensity of electrical stimulus used in our experiments (see also Reyes et al. 1996). While we had adjusted the stimulus intensity to generate action potentials reliably by coincident or near coincident stimuli, action potentials were generated even by a single unilateral stimulus when the intensity was high. Since there was a tendency for the response window to be wide where maximum response probability was high (Fig. 5A), the relatively wide response windows that we have obtained might indicate that the stimulus was too strong. The effects of stimulus intensity on the response window are illustrated in Fig. 10 where current injections of different intensities were made. The response window was about 6 ms when using higher current injection (Fig. 10C, control 1, 550 pA) and was 3.2 ms with a slightly weaker current (Fig. 10C, control 2, 500 pA). The dependence of response probability on stimulus intensity has also been observed in other in vitro preparations when measuring extracellular single unit responses from chick NL (Joseph & Hyson, 1993). In vivo, in the barn owl NL the response window was not changed but the firing rate increased with sound intensity, and some contribution of inhibitory pathways was proposed (Pena, Viete, Albeck & Konishi, 1996).
We have used E15–20 chicks and observed a relatively positive ECl in NL neurones; more positive than the mean resting membrane potential of the neurone, -60 ± 2 mV (Fig. 7). [Cl−]i is reported to decrease during development (Cherubini, Gaiarse & Ben-Ari, 1991; Kandler & Friauf, 1995), but a depolarizing response was still induced by GABA in chick NL neurones of 5–14 days after hatching (Hyson et al. 1995). Therefore, although the animals we have used in this experiment were in the course of maturation, we believe that functionally they were of sufficient maturity to allow investigation of GABA effects on coincidence detection. Reyes et al. (1996) argued that the nature of the phase-locked firing properties of NL neurones were not substantially different between E19–21 embryonic neurones and older animals.
We have investigated the effect of temperature on the decay time course of EPSCs and EPSPs (Fig. 11), and evaluated its effect on coincidence detection both at room temperature and at raised temperature (33°C). The body temperature of birds (41°C) is almost 20°C higher than the room temperature of most of our experiments and this temperature difference exerted significant effects on the time course of synaptic inputs: The Q10 of EPSC decay was 1.9, close to that of 2.2 reported by Zhang & Trussel (1994). However, we were surprised to find that the profile of coincidence detection did not change with an increase of temperature by 10°C (Fig. 11E). This was because the membrane time constant was relatively insensitive to the changing temperature over this range (Fig. 11D): time constants were 16.0 ± 10.2 ms at room temperature and 14.2 ± 10.2 ms at 35°C. The decay time constant of the EPSP was accelerated by GABA application but again the extent of the change was not significantly influenced by the temperature (Fig. 11B); room temperature (2.1 ± 0.6 ms at -60 mV, 6 cells) and 35°C (2.1 ± 1.1 ms at -57 mV, 7 cells).
Local application of GABA (10 μM) reduced the size of EPSPs to about 60 % of control (Fig. 9A), accelerated the time course of EPSPs (Fig. 9B), and dramatically improved the time discrimination of coincidence detection to 1.6 ms from the control 5.4 ms (Fig. 10). We have not examined the GABA effects on the size and the time course of EPSPs independently. However, EPSP size did not show any apparent correlation with the width of response window (Fig. 5B). Therefore, we tentatively propose that GABA improved the time discrimination of binaural inputs by accelerating individual EPSPs in NL neurones, mostly through membrane conductance shunting.
Conductance increase due to the activation of non-NMDA receptors
The synaptic inputs from NM activate non-NMDA type glutamate receptors, and the increase of membrane conductance by EPSCs (4.3 ± 6.0 nS, n = 16 cells) was almost equivalent to the cell's resting membrane conductance (3 nS). Local GABA application accelerated the time course of EPSPs almost to that of EPSCs (Fig. 9). This indicates that when GABAergic inputs are active, the time course of the EPSP at the soma would become faster and nearly parallel the conductance change induced by the excitatory synaptic input. In the experiment shown in Figs 10 and 11, we injected depolarizing current in place of contralateral synaptic stimulation, and action potentials were generated on coincidence of the injected current and the ipsilateral synaptic inputs. Although it would have been preferable to use two synaptic inputs, the contralateral EPSP was substituted with current injection because of the difficulty of these experiments. This experiment simulated bilateral inputs to the NL neurone, but the conductance increase associated with the unilateral EPSP should be half of the conductance increment expected for coincident bilateral EPSPs. In the case of bilateral synaptic inputs coincidence could have accelerated the time course of EPSPs, particularly in the presence of GABA, and so might have further narrowed the coincidence detection beyond those we have observed in these experiments.
The outward-going conductances induced by membrane depolarization
Auditory neurones transmit temporal information and each synapse must have the ability to transmit phasic information reliably. Reyes et al. (1996) concluded that the activation of an outward rectification was crucial for the phasic nature of the response in NL neurones. Well developed K+ conductances have been reported in auditory neurones; for example neurones in NM (Koyano et al. 1996), NL (Reyes et al. 1996), mammalian anteroventral cochlear nucleus (AVCN) busy cells (Manis & Marx, 1991), and medial superior olive (MSO) primary cells (Smith, 1995) have 4-aminopyridine-sensitive K+ channels. NL neurones also show a strong outward-going rectification in this study at membrane potentials positive to -65 mV (Fig. 2A). The membrane depolarization caused by EPSPs could also activate these intrinsic membrane conductances. However, membrane depolarizations generated by GABA application (-56 to -58 mV) did not significantly change the decay time course of EPSPs (Fig. 11B), nor affect the sharpness of the coincidence detection (figures not shown). This might be due to an underestimation of the level of GABA-induced membrane depolarization, or indicate that the outward conductances contribute less to coincidence detection than they do in shaping the phasic nature of firing responses in the NL neurone.
The origin and function of GABAergic inputs in NL neurones
Immunohistochemical studies demonstrate that GABAergic terminals are present in both somatic and dendritic layers of NL (Code et al. 1989) and originate from two locations: von Bartheld et al. (1989) showed GABAergic interneurones in or around NL and NM and other GABA positive terminals in the dendritic layer originating in the superior olivary nucleus (SO, Lachica et al. 1994). GABA-positive SO neurones receive inputs from nucleus angularis (NA) and so could be activated in synchrony with sound inputs. Lachica et al. (1994) have demonstrated anterogradely labelled terminals from SO in the dendritic layers of NL.
Although the function of these two GABAergic systems still remains to be elucidated, a model for coincidence detection endowing the two GABAergic innervations with different roles has been proposed: the GABAergic interneurones around NL serve to sharpen the coincidence detection, and the GABAergic innervation from the SO to the NL dendrites have a role in gain control (Albeck, 1994; see also Pena et al. 1996). In our experiments, GABA application to the dendritic layers significantly decreased the amplitude of EPSCs (Fig. 9A). The EPSC depression with local GABA application was not due to the activation of GABAB receptors in the presynaptic terminals, indicating that the reduction is most likely due to shunting of the postsynaptic membrane. The observations in this paper are consistent with the above model, and further support the idea that GABA receptors are concentrated in the dendritic region.
Regional ionophoretic application of bicuculline methiodide, a GABAA antagonist, broadened and GABA sharpened the ITD selectivity of extracellular unit activities in the owl's midbrain (Fujita & Konishi, 1991), leading these authors to suggest that a similar mechanism may underlie ITD sharpening in NL. Our observations and demonstration of GABA-dependent sharpening of coincidence detection at NL neurones would support these suggestions. Moreover, we have revealed that GABA-induced increase of membrane conductance reduced the membrane time constant and amplitudes of EPSPs, accelerated the decay time course of EPSPs and sharpened the coincidence detection of two inputs in the NL neurone. Since GABAergic activities improve the discrimination of interaural time difference in the owl's midbrain (Fujita & Konishi, 1991) and in the chick NL neurone (this paper), the GABAergic system might be considered to have a general role in improving time discrimination in the auditory system.
Acknowledgments
We thank Dr Raymond T. Kado for careful reading and for various suggestions made to the manuscript, Mr Fukao for technical assistance in preparing the equipment, and Dr Y. Kang and Professors T. Hirano, H. Yawo and I. Honjo for valuable suggestions and encouragement throughout this study. We wish to thank the anonymous reviewer whose suggestions have greatly helped to improve the manuscript. This study was supported by grants-in-aid from the Japanese Ministry of Education to K. K. and H. O.
References
- Albeck Y. A model for the role of inhibition in the processing of interaural time difference in barn owl. Society for Neuroscience Abstracts. 1994;20:62.2. [Google Scholar]
- Amagai S, Carr CE, Dooling RJ. Association for Research in Otolaryngology. 1996. Brainstem auditory time-coding nuclei in budgerigars: physiology; p. A762. [Google Scholar]
- Boord RL. Ascending projection of the primary cochlear nuclei and nucleus laminaris in the pigeon. Journal of Comparative Neurology. 1968;133:523–542. doi: 10.1002/cne.901330410. [DOI] [PubMed] [Google Scholar]
- Cherubini E, Gaiarsa JL, Ben-Ari G. GABA: an excitatory transmitter in early postnatal life. Trends in Neurosciences. 1991;14:515–519. doi: 10.1016/0166-2236(91)90003-d. [DOI] [PubMed] [Google Scholar]
- Code RA, Burd GD, Rubel EW. Development of GABA immunoreactivity in brainstem auditory nuclei of the chick: ontogeny of gradients in terminal staining. Journal of Comparative Neurology. 1989;284:504–518. doi: 10.1002/cne.902840403. [DOI] [PubMed] [Google Scholar]
- Edwards F, Sakmann B, Konnerth A, Takahashi T. A thin slice preparation for patch clamp recording from synaptically connected neurons of the mammalian central nervous system. Pflügers Archiv. 1989;74:1107–1118. doi: 10.1007/BF00580998. [DOI] [PubMed] [Google Scholar]
- Fujita I, Konishi M. The role of GABAergic inhibition in processing of interaural time difference in the owl's auditory system. Journal of Neuroscience. 1991;11:722–739. doi: 10.1523/JNEUROSCI.11-03-00722.1991. [DOI] [PMC free article] [PubMed] [Google Scholar]
- Goldberg JM, Brown PB. Response of binaural neurons of dog superior olivary complex to dichotic tonal stimuli: some physiological mechanisms of sound localization. Journal of Neurophysiology. 1969;32:613–636. doi: 10.1152/jn.1969.32.4.613. [DOI] [PubMed] [Google Scholar]
- Golding NL, Oertel D. Context-dependent synaptic action of glycinergic and GABAergic inputs in the dorsal cochlear nucleus. Journal of Neuroscience. 1996;16:2208–2219. doi: 10.1523/JNEUROSCI.16-07-02208.1996. [DOI] [PMC free article] [PubMed] [Google Scholar]
- Grothe B, Sanes DH. Synaptic inhibition influences the temporal coding properties of medial superior olivary neurons: An in vitro study. Journal of Neuroscience. 1994;14:1701–1709. doi: 10.1523/JNEUROSCI.14-03-01701.1994. [DOI] [PMC free article] [PubMed] [Google Scholar]
- Hagiwara S, Ohmori H. Studies of calcium channels in rat clonal pituitary cells with patch electrode voltage clamp. The Journal of Physiology. 1982;331:231–252. doi: 10.1113/jphysiol.1982.sp014371. [DOI] [PMC free article] [PubMed] [Google Scholar]
- Hamburger V, Hamilton H. A series of normal stages in the development of the chick embryo. Journal of Morphology. 1951;88:49–92. [PubMed] [Google Scholar]
- Hyson RL, Overholt EW, Lippe WR. Cochlear microphonic measurements of interaural time differences in the chick. Hearing Research. 1994;81:109–118. doi: 10.1016/0378-5955(94)90158-9. [DOI] [PubMed] [Google Scholar]
- Hyson RL, Reyes AD, Rubel EW. A depolarizing inhibitory response to GABA in brainstem auditory neurons of the chick. Brain Research. 1995;677:117–126. doi: 10.1016/0006-8993(95)00130-i. [DOI] [PubMed] [Google Scholar]
- Jeffress LA. A place theory of sound localization. Journal of Comparative Physiology and Psychology. 1948;41:35–39. doi: 10.1037/h0061495. [DOI] [PubMed] [Google Scholar]
- Joseph AW, Hyson RL. Coincidence detection by binaural neurons in the chick brain stem. Journal of Neurophysiology. 1993;69:1197–1211. doi: 10.1152/jn.1993.69.4.1197. [DOI] [PubMed] [Google Scholar]
- Kandler K, Friauf E. Development of glycinergic and glutamatergic synapstic transmission in the auditory brainstem of perinatal rats. Journal of Neuroscience. 1995;15:6890–6904. doi: 10.1523/JNEUROSCI.15-10-06890.1995. [DOI] [PMC free article] [PubMed] [Google Scholar]
- Konishi M. Listening with two ears. Scientific American. 1993;268:34–41. doi: 10.1038/scientificamerican0493-66. [DOI] [PubMed] [Google Scholar]
- Koyano K, Funabiki K, Ohmori H. Voltage-gated ionic currents and their roles in timing coding in auditory neurons of the nucleus magnocellularis of the chick. Neuroscience Research. 1996;26:29–45. doi: 10.1016/0168-0102(96)01071-1. [DOI] [PubMed] [Google Scholar]
- Kuwabara N, Zook JM. Projection to the medial superior olive from the medial and lateral nuclei of the trapezoid body on rodents and bats. Journal of Comparative Neurology. 1992;324:522–538. doi: 10.1002/cne.903240406. [DOI] [PubMed] [Google Scholar]
- Lachica EA, Rubsamen R, Rubel EW. GABAergic terminals in nucleus magnocellularis and laminaris originate from the superior olivary nucleus. Journal of Comparative Neurology. 1994;348:403–418. doi: 10.1002/cne.903480307. [DOI] [PubMed] [Google Scholar]
- McLachlan EM. The effect of strontium and barium ions at synapses in sympathetic ganglia. The Journal of Physiology. 1977;267:497–518. doi: 10.1113/jphysiol.1977.sp011823. [DOI] [PMC free article] [PubMed] [Google Scholar]
- Manis PB, Marx SO. Outward currents in isolated ventral cochlear nucleus neurons. Journal of Neuroscience. 1991;11:2865–2880. doi: 10.1523/JNEUROSCI.11-09-02865.1991. [DOI] [PMC free article] [PubMed] [Google Scholar]
- Overholt EW, Rubel EW, Hyson RL. A circuit for coding interaural time difference in the chick brainstem. Journal of Neuroscience. 1992;12:1698–1708. doi: 10.1523/JNEUROSCI.12-05-01698.1992. [DOI] [PMC free article] [PubMed] [Google Scholar]
- Pena JL, Viete S, Albeck Y, Konishi M. Tolerance to sound intensity of binaural coincidence detection in the nucleus laminaris of the owl. Journal of Neuroscience. 1996;16:7046–7054. doi: 10.1523/JNEUROSCI.16-21-07046.1996. [DOI] [PMC free article] [PubMed] [Google Scholar]
- Raman IM, Zhang S, Trussell LO. Pathway-specific variants of AMPA receptors and their contribution to neuronal signaling. Journal of Neuroscience. 1994;14:4998–5010. doi: 10.1523/JNEUROSCI.14-08-04998.1994. [DOI] [PMC free article] [PubMed] [Google Scholar]
- Reyes AD, Rubel EW, Spain WJ. Membrane properties underlying the firing of neurons in the avian cochlear nucleus. Journal of Neuroscience. 1994;14:5352–5364. doi: 10.1523/JNEUROSCI.14-09-05352.1994. [DOI] [PMC free article] [PubMed] [Google Scholar]
- Reyes AD, Rubel EW, Spain WJ. In vitro analysis of optimal stimuli for phase-locking and time-delayed modulation of firing in avian nucleus laminaris neurons. Journal of Neuroscience. 1996;16:993–1007. doi: 10.1523/JNEUROSCI.16-03-00993.1996. [DOI] [PMC free article] [PubMed] [Google Scholar]
- Rubel EW, Parks TN. Organization and development of brain stem auditory nuclei of the chicken: tonotopic organization of n. magnocellularis and n. laminaris. Journal of Comparative Neurology. 1975;164:411–434. doi: 10.1002/cne.901640403. [DOI] [PubMed] [Google Scholar]
- Smith DJ. Organization and development of brain stem auditory nuclei of the chicken: dendritic development in n. laminaris. Journal of Comparative Neurology. 1981;203:309–333. doi: 10.1002/cne.902030302. [DOI] [PubMed] [Google Scholar]
- Smith PH. Structural and functional differences distinguish principal from nonprincipal cells in the guinea pig MSO slice. Journal of Neurophysiology. 1995;73:1653–1667. doi: 10.1152/jn.1995.73.4.1653. [DOI] [PubMed] [Google Scholar]
- Sullivan WE, Konishi M. Neural map of interaural phase difference in the owl's brainstem. Proceedings of the National Academy of Sciences of the USA. 1986;83:8400–8404. doi: 10.1073/pnas.83.21.8400. [DOI] [PMC free article] [PubMed] [Google Scholar]
- von Bartheld CS, Code RA, Rubel EW. GABAergic neurons in brainstem auditory nuclei of the chick: distribution, morphology, and connectivity. Journal of Comparative Neurology. 1989;287:470–483. doi: 10.1002/cne.902870406. [DOI] [PubMed] [Google Scholar]
- Warchol ME, Dallos P. Neural coding in the chick cochlear nucleus. Journal of Comparative Physiology A. 1990;166:721–734. doi: 10.1007/BF00240021. [DOI] [PubMed] [Google Scholar]
- Whitehead MC, Morest DK. Dual population of efferent and afferent cochlear axons in the chicken. Neuroscience. 1981;6:2351–2365. doi: 10.1016/0306-4522(81)90022-1. [DOI] [PubMed] [Google Scholar]
- Yin TCT, Chen JCK. Interaural time sensitivity in medial superior olive of cat. Journal of Neurophysiology. 1990;64:465–488. doi: 10.1152/jn.1990.64.2.465. [DOI] [PubMed] [Google Scholar]
- Young SR, Rubel EW. Frequency-specific projections of individual neurons in chick brainstem auditory nuclei. Journal of Neuroscience. 1983;3:1373–1378. doi: 10.1523/JNEUROSCI.03-07-01373.1983. [DOI] [PMC free article] [PubMed] [Google Scholar]
- Zhang S, Trussell LO. A characterization of excitatory postsynaptic potentials in the avian nucleus magnocellularis. Journal of Neurophysiology. 1994;72:705–718. doi: 10.1152/jn.1994.72.2.705. [DOI] [PubMed] [Google Scholar]
- Zhou N, Parks TN. Pharmacology of excitatory amino acid neurotransmission in nucleus laminaris of the chick. Hearing Research. 1991;52:195–200. doi: 10.1016/0378-5955(91)90199-j. [DOI] [PubMed] [Google Scholar]