

Abstract
In cardiac muscle, ‘Ca2+ sparks’ have been proposed to underlie Ca2+-induced Ca2+ release (CICR), and to result from openings of clusters of Ca2+ channels (ryanodine receptors; RyRs) located in the sarcoplasmic reticulum membrane.
To investigate the elementary nature of these Ca2+ signals directly, a diffraction-limited point source of Ca2+ was created in single cardiac myocytes by two-photon excitation photolysis of caged Ca2+. Simultaneously, concentration profiles of released Ca2+ were imaged at high temporal and spatial resolution with a laser-scanning confocal microscope.
This approach enabled us to generate and detect photolytic Ca2+ signals that closely resembled the Ca2+ sparks occurring naturally, not only in amplitude and size, but also in their ability to trigger additional Ca2+ sparks or Ca2+ waves.
Surprisingly, at low photolytic power minuscule events with estimated Ca2+ release fluxes 20–40 times smaller than those calculated for a typical Ca2+ spark were directly resolved. These events appeared to arise from the opening of a more limited number of RyRs (possibly one) or from RyRs exhibiting a different gating mode and may correspond to the elusive ‘Ca2+ quark’.
The Ca2+ quark represents the fundamental Ca2+ release event of excitable cells implementing hierarchical Ca2+ signalling systems with Ca2+ release events of various but distinct amplitude levels (i.e. Ca2+ quarks, Ca2+ sparks and full cellular Ca2+ transients).
A graded recruitment of nanoscopic Ca2+ release domains (i.e. Ca2+ quarks) exhibiting variable degrees of spatial coherence and coupling may then build up intermediate Ca2+ signalling events (i.e. Ca2+ sparks). This mechanism suggests the existence of Ca2+ sparks caused by gating of a variable fraction of RyRs from within an individual cluster. Additional mobilization of a variable number of these Ca2+ sparks enables cardiac cells to show graded cellular Ca2+ transients. Similar recruitment processes may underlie regulation of Ca2+ signalling on the cellular level in general.
In cardiac muscle, the Ca2+ signal activating contraction is initiated by Ca2+ influx via L-type Ca2+ channels. In most species, this trigger signal is amplified severalfold by CICR from the sarcoplasmic reticulum (SR; Fabiato, 1985). With the recent discovery of subcellularly localized SR Ca2+ release events (Ca2+ sparks; Cheng, Lederer & Cannell, 1993; Lipp & Niggli, 1994) a model for CICR was proposed in which a variable number of functionally independent SR Ca2+ release units could be recruited by L-type Ca2+ channels via a local control mechanism. This mechanism relies on nanodomains around the cytostolic opening of single voltage-operated Ca2+ channels (Stern 1992; Cannell, Cheng & Lederer, 1994, 1995; López-López, Shacklock, Balke & Wier, 1994; Niggli & Lipp, 1995; Lipp & Niggli, 1996a).
Although this model could account for a large number of experimental findings, some features are not yet defined due to a lack of experimental data. For example, information about the microarchitecture of the functionally important proteins in the cardiac diadic junction is scarce (Protasi, Sun & Franzini-Armstrong, 1996), particularly for mammalian species. This information would be pertinent to answer the question of how many SR Ca2+ release channels may contribute to a Ca2+ spark and whether this number is invariant under all conditions. Variability in the number (or gating) of Ca2+ release channels could provide an explanation for the observation of SR Ca2+ release with distinct spatial features. For example, UV flash photolysis of caged Ca2+ was found to generate homogeneous Ca2+ release from the SR without detectable Ca2+ sparks and we proposed that a Ca2+ release event smaller than a spark may exist - the Ca2+ quark (Lipp & Niggli, 1996b). A similar homogeneous type of Ca2+ release has also been reported when SR Ca2+ release was triggered by Na+ current (Niggli & Lipp, 1996) and in skeletal muscle under conditions where CICR was inhibited (Shirakova & Rios, 1997; see also Lipp & Bootman, 1997). Theoretically, the minimal local control unit would correspond to an individual L-type Ca2+ channel associated with a single Ca2+ release channel (RyR) of the SR, both coupled by a nanodomain of Ca2+ signalling (i.e. the ‘Ca2+ synapse’ model (Stern, 1992)) but other arrangements may also be possible. For example, an L-type Ca2+ channel could control a cluster of SR Ca2+ release channels (‘cluster bomb’ model; Stern, 1992), either because of an ultrastructural clustering of RyRs or because of the spatially limited Ca2+ concentration domain around the cytosolic mouth of the L-type Ca2+ channel.
In the present study we tried to more directly probe the elementary nature of cardiac Ca2+ release events by combining laser-scanning confocal detection of Ca2+ release events and diffraction limited two-photon excitation photolysis of DM-nitrophen.
METHODS
Two-photon photolysis
A mode-locked Ti:sapphire laser (Mira 9000F, Coherent, Santa Clara, CA, USA) pumped by an argon laser at 8 W (Innova 310; Coherent, Santa Clara, CA, USA) was used to yield two-photon photolysis (TPP) of caged Ca2+ in a volume smaller than a femtolitre (Denk, 1994). The power of the Ti:sapphire laser (wavelength 705 nm, pulse duration 75 fs, repetition rate 80 MHz) was adjusted by a polarizing filter to the desired input energy measured at the microscope. The pulse duration was optimized by compensating for group-velocity dispersion with a pair of prisms (Soeller & Cannell, 1996). Attenuation within the microscope optics was measured to be 50 % at the back focal plane of the objective. We estimate the power on the preparation to be around 10–25 % of the power measured on the optical table and given in the figures. Please note that most of the excitation power is not absorbed by the cell, because it represents red light. Only at the focal point does significant two-photon absorption by DM-nitrophen occur. In experiments where DM-nitrophen was loaded with Mg2+ instead of Ca2+, no signals could be observed during TPP, indicating that the absorption of energy does not lead to artifacts, and that the responses are specific for Ca2+ (Ellis-Davies, DelPrincipe, Egger & Niggli, 1998). On the vibration-isolated optical table (Newport; Irvine, CA, USA) the stationary red laser beam was combined parfocally and coaxially with the visible pathway of the scanning system using a customized dichroic mirror reflecting > 620 nm while still exhibiting low harmonic reflectance from 400 to 600 nm (Chroma Technologies, Brattleboro, VT, USA). Both laser beams were then guided to the preparation in a standard epi-illumination arrangement using the camera port of the inverted microscope (Nikon Diaphot; Nikon, Küsnacht, Switzerland). The confocal microscope (MRC-1000, Bio-Rad, Glattbrugg, Switzerland) was used simultaneously in the line-scan mode to follow the subcellular distribution of Ca2+ concentration with high temporal and spatial resolution. Fluo-3 was excited with the 488 nm line of an air-cooled argon laser (Bio-Rad) attenuated to 50 μW. Two-photon excitation of fluo-3 was determined to be negligible at 705 nm and the power levels used for TPP. For further analysis the confocal images were transferred onto computers (Apple Macintosh PowerPC 8100/100) running a customized version of NIH-Image (NIH, Bethesda, MA, USA). Raw fluorescence values were converted into Ca2+ concentrations by applying the self-ratio method, assuming a Kd of fluo-3 for Ca2+ of 400 nM. The volume of the photolytic excitation point-spread function (PSF) was estimated by determining the fluorescence PSF in indo-1 (FWHM for x, y, z: 710 × 710 × 1200 nm). Please note that the size of the TPP trigger signals is always considerably larger than the excitation PSF because photoreleased Ca2+ can diffuse several micrometres away from the point source.
Preparation and solutions
Guinea-pigs were killed by cervical dislocation after stunning. Single, isolated ventricular myocytes were prepared using a standard enzymatic procedure. Composition of the experimental superfusion solution was (mM): 135 NaCl, 4 KCl, 2 CsCl, 2 CaCl2, 10 glucose, 10 Hepes; pH 7.4. Composition of the pipette filling solution was (mM): 115 potassium aspartate, 10 TEA-Cl, 5 KCl, 4 NaCl, 15 Hepes, 4 K2-ATP, 0.1 fluo-3, 0.25 CaCl2, 1 reduced gluthathione (GSH), 1 Na4-DM-nitrophen; pH 7.2. All experiments were carried out at 20–23°C. In the presence of DM-nitrophen, the decay of all Ca2+ sparks is slowed ∼ 6-fold. The Ca2+ dissociation from DM-nitrophen is very slow (0.4 s−1; Ellis-Davies, Kaplan & Barsotti, 1996). The slow decay may result from transient binding of the released Ca2+ to unphotolysed and Ca2+-free DM-nitrophen that is itself immobilized. Please note that 1 mM DM-nitrophen does not interrupt E-C coupling or CICR (Lipp & Niggli, 1996a). In addition, the Ca2+ buffering effect of 1 mM DM-nitrophen is expected to be quite small since at 100 nM resting [Ca2+]i this high affinity caged compound (Kd≈ 5 nM) is almost saturated with Ca2+.
Voltage-clamp protocol
Between experiments, the cells were held at a resting potential of -75 mV. Unless noted otherwise, a train of ten pre-pulses to +5 mV was applied to load the SR with Ca2+. This protocol was immediately followed by an experimental potential of -50 mV, during which the photolytic pulses were applied (∼ 2 s after the last conditioning pulse).
RESULTS
In the present study we used two-photon excitation photolysis (TPP) of caged compounds to generate spatially confined photolytic trigger signals for CICR without involving the L-type Ca2+ channels. Figure 1Aa shows a localized Ca2+ signal that was generated by creating a diffraction-limited point source of Ca2+ lasting 50 ms inside a guinea-pig ventricular myocyte (diameter of Ca2+ source ≈ 0.7 μm full width at half-maximal amplitude (FWHM)). DM-nitrophen was used as a caged Ca2+ compound while the resulting Ca2+ signal was recorded with fluo-3 and a laser-scanning confocal microscope in the line-scan mode. The Ca2+ signals elicited by TPP had many of the spatial and temporal characteristics that are the hallmark of spontaneous Ca2+ sparks (Cheng et al. 1993; Lipp & Niggli, 1994) or Ca2+ sparks triggered by single L-type Ca2+ channels (Cannell et al. 1995; López-López, Shacklock, Balke & Wier, 1995). The initial question therefore was: are we actually able to trigger CICR, or does the observed signal simply reflect the photorelease of Ca2+ from the caged compound? Increasing the photolytic laser power from 40 to 80 mW initiated a larger local signal that was immediately followed by a Ca2+ wave propagating in both directions of the cell (Fig. 1Ab). This observation confirmed that we were indeed able to initiate CICR by TPP in cells exhibiting a marked regenerativity of the CICR (Takamatsu & Wier, 1990; Trafford, O'Neill & Eisner, 1993; Lipp & Niggli, 1994). In the subsequent experiments the cells were maintained at a defined SR Ca2+ load by applying a pre-pulse protocol consisting of ten voltage-clamp steps at 1 Hz to elicit a train of L-type Ca2+ currents. In cells conditioned with this protocol we could initially observe two different types of Ca2+ release signals during and after TPP of DM-nitrophen. (i) In a large number of successive line scans obtained from a given cell, the photolytic Ca2+ signal was sometimes followed by a Ca2+ spark that could be separated from the photolytic trigger by spatial and temporal criteria (see Fig. 1B). The lateral distance between the photolytic signal and the triggered Ca2+ spark was usually less than 1 μm and the delays ranged from 10 to 100 ms. In examples where the Ca2+ transients occurred clearly spatially separated from the photoloytic locations (see Fig. 1Bd), small Ca2+ release signals (such as e.g. the subsparks described by Parker, Zang & Wier, 1996) may be the underlying events. (ii) More frequently, the TPP signal did not trigger any obvious Ca2+ release that could be separated based on spatial or temporal features. However, it was conceivable that even in these highly localized signals the CICR process contributed a sizable amount of Ca2+. Indeed, when such cells were pre-exposed to 20 mM caffeine to deplete the SR of Ca2+, a significant and reversible reduction of the Ca2+ signal was observed, suggesting substantial local amplification of the TPP signal by CICR (Fig. 2). The amplitude of the CICR component shown in Fig. 2Ac and the trace labelled a - b in B was < 75 nM. This release component (i.e. the caffeine-sensitive signal) was quite variable (ranging from 20 and 60 % of the total amplitude in different experiments). Interestingly, the event attributable to CICR was considerably smaller in amplitude than a typical Ca2+ spark. Control experiments were performed to show that a caffeine-sensitive signal component was not present in cells pretreated with 10 μM ryanodine, excluding the possibility of an interaction between caffeine and the fluorescent indicator fluo-3. In addition, these control experiments revealed that the signal without CICR (i.e. the photolytic trigger signal) was very reproducible without noticeable variation in amplitude and duration (data not shown). In addition to the smaller amplitude the caffeine-sensitive difference signal also exhibited less spatial spreading (FWHM ≈ 1.5 μm) than a typical Ca2+ spark and than the TPP signal itself (FWHM ≈ 4.9 μm). Two mechanisms may contribute to this observation: (i) the TPP-induced point source of Ca2+ is spatially less confined than the locally triggered CICR process; and (ii) Ca2+ re-uptake into the SR at the border zone of the Ca2+ spark can restrict the signal under control conditions (Gomez, Cheng, Lederer & Bers, 1996) a mechanism that is short-circuited by the open RyRs in the presence of caffeine. Please also note that the spatial spreading of the trigger signal covers a larger range than the photolytic point source itself because Ca2+ ions rapidly diffuse away from the source. In any case, the detection of a small caffeine-sensitive component indicates that TPP can trigger local CICR, possibly involving release events that are smaller than a Ca2+ spark, both in terms of amplitude and spatial spread.
Figure 1. Two-photon photolysis (TPP) can trigger Ca2+ sparks and propagating Ca2+ waves.
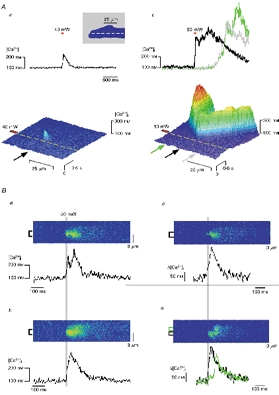
A, TPP at 40 mW (50 ms, red bar) excitation resulted in a photolytic signal similar to a Ca2+ spark (a). Increasing the photolytic laser power to 80 mW (duration, 50 ms) triggered regenerative CICR from the SR as a Ca2+ wave (b) propagating in both directions of the cell (enlarged part of the myocyte is shown in the inset with position of scanned line). Ba and b show representative line scans and traces of Ca2+ transients elicited by TPP (2 out of 25 consecutive traces). Traces were averaged from a subcellular region indicated by the brackets. The SR Ca2+ release component corresponding to Ca2+ sparks triggered by the photolytic signal was visualized by subtracting an image recorded in 20 mM caffeine (not shown) from a and b, yielding the difference images c and d, respectively. Note that for d two locations along the scanned line were averaged, the black at the point of the photolysis and the green slightly beside the point of photolysis to indicate the spatially separated Ca2+ release signal at this subcellular location.
Figure 2. A photolytic Ca2+ signal can trigger Ca2+ release components smaller than Ca2+ sparks.
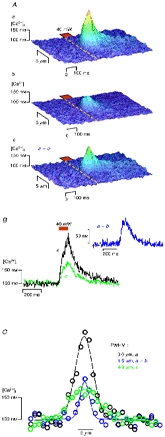
Aa shows a Ca2+ signal generated by TPP at 40 mW (duration, 80 ms). Application of 20 mM caffeine reduced the Ca2+ transient significantly (Ab). Line tracings derived from the individual Ca2+ transients are illustrated in B. The small caffeine-sensitive component arising from CICR is shown in Ac and in the inset of B, labelled a - b. The spatial spreading of the three events is compared in C.
This interpretation was confirmed with experiments designed to investigate the dependence of TPP-induced Ca2+ release on SR Ca2+ load (see Fig. 3). The SR Ca2+ load was varied by incrementing the frequency of depolarizations during the loading protocol. TPP was activated with a low-power laser pulse of longer duration to avoid triggering of Ca2+ sparks. Under control conditions (no voltage-clamp depolarizations) a Ca2+ signal rising to about 140 nM was observed. Even this small signal comprised a caffeine-sensitive component (shown in Fig. 3Cb and plotted in 3A). Increasing the frequency of the pre-pulses led to a gradual increase of the caffeine-sensitive component up to a Δ[Ca2+] of ∼ 100 nM (at 1 Hz). This 6-fold increase of the CICR component may result from two mechanisms: (i) a larger Ca2+ release flux via RyRs as a consequence of the elevated Ca2+ load in the stores (Isenberg & Han, 1994; Spencer & Berlin, 1995), and (ii) a recruitment of further Ca2+ release channels from within a cluster of RyRs, notably without triggering Ca2+ sparks. Caffeine application after these experiments revealed an increase in the SR Ca2+ load from rest to 1 Hz loading by a factor of only ∼ 2.2 (not shown). Therefore, the 6-fold enhancement of the SR Ca2+ release is not only due to an increase of the single channel current, but rather due to a gradual recruitment of additional Ca2+ quarks.
Figure 3. SR Ca2+ release depends on SR Ca2+ load.
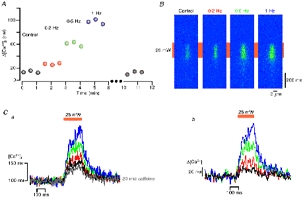
A summarizes the time course of the caffeine-sensitive component during the entire experiment. B shows representative original line scans. Trains (duration, 10 s) of L-type Ca2+ currents were elicited at the frequency indicated in A and B to load the SR with Ca2+. Even without a pre-pulsing, the Ca2+ signal generated by TPP (25 mW, 200 ms) (Ca) contained a caffeine-sensitive component (Cb) with an amplitude of ≈ 20 nM. Successive elevation of the SR Ca2+ load resulted in larger Ca2+ release signals up to ≈ 120 nM.
A possible and intriguing explanation for the surprisingly small size of the caffeine-sensitive TPP component would be the existence of an elementary Ca2+ signalling event smaller than a Ca2+ spark. These events could correspond to the proposed but as of yet unresolved Ca2+ quarks, defined as openings of single SR Ca2+ release channels (Lipp & Niggli, 1996b). With an estimated amplitude of 20–50 nM for Δ[Ca2+] it appeared within the realm of possibilities to resolve these minuscule events in the noise of confocal line-scan images. With the assumption that the size of the CICR signal may depend not only on the SR Ca2+ load but also on the amplitude and spatiotemporal characteristics of the trigger signal, we attempted to directly trigger such small events by reducing the laser power to the threshold of CICR. Starting at 60 mW (duration, 25 ms) of TPP power, a local Ca2+ signal was triggered that closely resembled a Ca2+ spark (Fig. 4Aa and Ba), indicating that the chosen subcellular location was indeed able to generate CICR as Ca2+ sparks. Lowering the power to 30 mW resulted in an initial signal that was below threshold for CICR, as confirmed by the absence of caffeine sensitivity (not shown). However, this sub-threshold trigger for spark generation was followed by a flurry of minuscule Ca2+ release events with amplitudes of ∼ 40 nM for Δ[Ca2+] in this cell. Of these small Ca2+ signals, twenty-five were resolved in only nine out of twenty line scans performed under similar conditions in four different cells. Please note that these events could only be elicited by TPP in a narrow power range below threshold for Ca2+ sparks. Since the TPP-induced Ca2+ responses were variable from trace to trace (see also Fig. 1B), the small events could not be triggered in a predictable fashion. On average, the amplitude of these small events was 37 ± 6 nM (mean ±s.e.m., n = 25 events recorded from 4 different cells). In addition to the smaller amplitude, the spatial spreading of these events was ∼ 2 times less than what is typically observed for a Ca2+ spark, indicating that the cytosolic volume occupied by the event is ∼ 8-fold smaller (Fig. 4C; mean FWHM 0.85 ± 0.2 μm, n = 25 events). It is important to note that the same Ca2+ release site within the cell can either give rise to a spark when stimulated with a large TPP trigger, or produce minuscule events when triggered with low photolytic powers. Although the small events were separated by ∼ 0.4 μm (Fig. 4Ab and Ac), they clearly originated from distinct release sites within the diameter of the Ca2+ spark that was triggered at the higher photolytic power. This spatial separation indicates that the small events are not just downscaled versions of Ca2+ sparks. An analysis was performed to compare Ca2+ sparks and the small events by estimating the Ca2+ release flux for both signals. Release flux (J) during Ca2+ release signals was estimated as J = B Δ[Ca2+]V t−1 where B is the buffering capacity of the cytosol (taken to be 100), Δ[Ca2+] is the amplitude of the signal, t is the rise time and V the volume occupied by the event. With these assumptions, the average equivalent ionic current was calculated to be 100–200 fA. Since the small Ca2+ signals are near the optical resolution limit, our calculations would tend to overestimate the volume governed by these events. Deconvolution of the recorded detection PSF (FWHM for x, y, z: 290 × 290 × 900 nm) would indicate a FWHM of ∼ 400 nm for the smallest Ca2+ signalling events. From these calculations we conclude that the release flux of the small events was at least ∼ 20–40 times smaller than during a typical Ca2+ spark, again suggesting that they may represent a completely different entity and another elementary Ca2+ release event. The two categories of elicited release events are therefore not a property of the cell or the particular subcellular region, but result from the different amplitudes of the two trigger signals. Presumably, these Ca2+ quarks can also occur spontaneously and may occasionally be present in records showing no obvious Ca2+ sparks. However, the reliability of detection has been recognized to decline dramatically for very small events and such events would most likely be missed, but due to the two-photon excitation photolysis we know when and where to look for such signals and we can identify them.
Figure 4. Ca2+ quarks triggered by TPP.
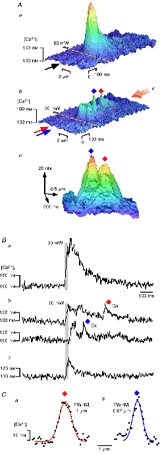
Aa shows Ca2+ signal triggered by TPP at 60 mW (duration, 25 ms), most likely containing a CICR component. Uncaging of DM-nitrophen slightly below threshold (30 mW) for SR Ca2+ release was followed by several tiny Ca2+ transients (Ab). A view from the end of the trace (in the direction of the large red arrow) is depicted in Ac to emphasize the spatial separation (0.4 μm) of the small Ca2+ release events. Ba shows the time course of the Ca2+ signal at 60 mW while Bb demonstrates [Ca2+]i at the location of photolysis (upper trace, red diamond) and ≈ 0.5 μm beneath this location (lower trace, blue diamond). Bc illustrates the TPP signal in the presence of 20 mM caffeine. The spatial characteristics of fundamental Ca2+ release signals are shown in more detail in C. The average distance between the Ca2+ quarks triggered by TPP was ≈ 0.4 μm while the average amplitude of Ca2+ quarks was ≈ 37 nM (n = 25 quarks, recorded from 4 cells).
DISCUSSION
The concept of Ca2+ sparks has been helpful to untangle a paradox of CICR that has puzzled researchers for many years, the problem being how a regenerative but also graded amplification of the cellular Ca2+ signal could be accomplished while still preventing the rise of cytosolic Ca2+ from becoming entirely self-sustaining. Such a positive feedback mechanism would lead to uncontrolled regenerativity and all-or-none behaviour of the CICR. This apparent paradox was explained with Ca2+ sparks that were only triggered by the local rise of [Ca2+]i in the nanodomain around the cytosolic opening of L-type Ca2+ channels. The regenerativity would thus be limited to a particular Ca2+ spark site. However, with the discovery of smaller events we are now faced with a similar paradox, albeit on a much smaller spatial scale. How can subpopulations of RyRs, possibly even single channels, generate Ca2+ signals without triggering their neighbours? Under what conditions do they trigger neighbours to elicit ‘spontaneous’ Ca2+ sparks? A reasonable possibility is that the spatial coherence of Ca2+ signalling is quite variable not only in the micrometre range, but also on the nanometre scale of the diadic cleft. From the experimental observation of subcellular Ca2+ waves in single cells we know that the range of spatial coherence between Ca2+ release units can span at least the distance corresponding to the sarcomere length (∼ 1.8 μm) under conditions of elevated Ca2+ load and increased SR Ca2+ release flux. Much less is known, however, of whether and how the Ca2+ sparks are coupled by the CICR mechanism under conditions of normal SR Ca2+ load.
Interestingly, it has been reported that two release sites can be coherent over a distance corresponding to ∼ 600 nm, giving rise to resolvable double release events when scanned in the transverse direction of the cell (Parker, Zang & Wier, 1996). It is perfectly conceivable that the size of the actual release site (i.e. the number and gating of participating RyRs) not only depends on the precise subcellular microarchitecture in the junctional region but also on functional properties of the signalling system including the SR Ca2+ load and spatiotemporal features of the trigger signal itself. This behaviour could then give rise to Ca2+ release signals of various sizes. In the nanometre domain of the diadic cleft, extremely brief openings during rapid gating of RyRs may lead to significant Ca2+ release from the SR without reaching the high Ca2+ concentrations in the diadic cleft to trigger Ca2+ release from neighbouring channels. Mathematical simulations of Ca2+ concentration changes in this space indicate that the peak [Ca2+] is only reached several hundred microseconds after opening of the channel (Soeller & Cannell, 1997). Since gating of the RyRs may be much faster in situ than in bilayer experiments, the recently reported low and high open-probability gating modes of the RyR may offer another possibility to resolve the new paradox (Zahradnikova & Zahradnik, 1996). In addition, the complex 3-dimensional shape of the RyR foot structure in the diadic cleft may contain molecular pockets with preferential access for Ca2+ entering from the sarcolemma or leaving the SR. It may be possible that these extremely rapid events taking place in nanoscopic spaces exhibit properties that can no longer be adequately modelled by simple diffusion of Ca2+. Future models of these signalling events may need to consider the 3-dimensional spatial features of the proteins and the free space as well as electrodiffusion and other electrostatic interactions of Ca2+ in the diadic cleft (Soeller & Cannell, 1997).
With the discovery of Ca2+ sparks and quarks, the search for elementary Ca2+ release events substantially widened our knowledge about Ca2+ signalling on the cellular level. These findings are not unique to excitable cells; analogous Ca2+ signalling events have also been found in non-excitable cells such as Xenopus oocytes (Parker, Choi & Yao, 1996) and HeLa cells (Bootman, Niggli, Berridge & Lipp, 1997). In the heart, the interplay of these Ca2+ signalling events on different levels of a hierarchical Ca2+ signalling system (Niggli & Lipp, 1995; Lipp & Niggli, 1996a;Lipp & Bootman, 1997) may be relevant in the understanding of how submicroscopic disturbances of this communication pathway can lead to impaired cardiac function in pathological heart conditions (Gomez et al. 1997). Thus, to comprehensively appreciate all aspects of CICR and Ca2+ signalling we need to understand how the individual RyR channels co-operatively interact and ‘talk’ to each other. Their language is CICR, but we also need to consider and appreciate the subtleties of their dialects that may vary considerably depending on the subcellular microenvironment of the involved SR Ca2+ release channels and on the functional state of the cell.
Acknowledgments
This project was supported by the Swiss National Science Foundation (Grant 31-50564.97 to E. N.). We would like to thank Drs M. D. Bootman, H. P. Clamann, F. DelPrincipe, H. R. Lüscher, S. Rohr, and B. Schwaller for thoughtful comments on the manuscript and Mrs M. Herrenschwand for excellent technical assistance.
References
- Bootman M, Niggli E, Berridge M, Lipp P. Imaging the hierarchical Ca2+ signalling system in HeLa cells. The Journal of Physiology. 1997;499:307–314. doi: 10.1113/jphysiol.1997.sp021928. [DOI] [PMC free article] [PubMed] [Google Scholar]
- Cannell MB, Cheng H, Lederer WJ. Spatial non-uniformities in [Ca2+]i during excitation-contraction coupling in cardiac myocytes. Biophysical Journal. 1994;67:1942–1956. doi: 10.1016/S0006-3495(94)80677-0. [DOI] [PMC free article] [PubMed] [Google Scholar]
- Cannell MB, Cheng H, Lederer WJ. The control of calcium release in heart muscle. Science. 1995;268:1045–1049. doi: 10.1126/science.7754384. [DOI] [PubMed] [Google Scholar]
- Cheng H, Lederer WJ, Cannell MB. Calcium sparks - elementary events underlying excitation-contraction coupling in heart muscle. Science. 1993;262:740–744. doi: 10.1126/science.8235594. [DOI] [PubMed] [Google Scholar]
- Denk W. Two-photon scanning photochemical microscopy: mapping ligand-gated ion channel distributions. Proceedings of the National Academy of Sciences of the USA. 1994;91:6629–6633. doi: 10.1073/pnas.91.14.6629. [DOI] [PMC free article] [PubMed] [Google Scholar]
- Ellis-Davies GCR, DelPrincipe F, Egger M, Niggli E. Two-photon and laser flash photolysis of the new caged calcium compound DMNPE-4. Biophysical Journal. 1998;74:A271. [Google Scholar]
- Ellis-Davies GCR, Kaplan JH, Barsotti RJ. Laser photolysis of caged calcium: rates of calcium release by nitrophenyl-EGTA and DM-nitrophen. Biophysical Journal. 1996;70:1006–1016. doi: 10.1016/S0006-3495(96)79644-3. [DOI] [PMC free article] [PubMed] [Google Scholar]
- Fabiato A. Simulated calcium current can both cause calcium loading in and trigger calcium release from the sarcoplasmic reticulum of a skinned canine cardiac Purkinje cell. Journal of General Physiology. 1985;85:291–320. doi: 10.1085/jgp.85.2.291. 10.1085/jgp.85.2.291. [DOI] [PMC free article] [PubMed] [Google Scholar]
- Gomez AM, Cheng HP, Lederer WJ, Bers DM. Ca2+ diffusion and sarcoplasmic reticulum transport both contribute to [Ca2+]i decline during Ca2+ sparks in rat ventricular myocytes. The Journal of Physiology. 1996;496:575–581. doi: 10.1113/jphysiol.1996.sp021708. [DOI] [PMC free article] [PubMed] [Google Scholar]
- Gomez AM, Valdivia HH, Cheng H, Lederer MR, Santana LF, Cannell MB, McCune SA, Altschuld RA, Lederer WJ. Defective excitation-contraction coupling in experimental cardiac hypertrophy and heart failure. Science. 1997;276:800–806. doi: 10.1126/science.276.5313.800. 10.1126/science.276.5313.800. [DOI] [PubMed] [Google Scholar]
- Isenberg G, Han S. Gradation of Ca2+-induced Ca2+ release by voltage-clamp pulse duration in potentiated guinea-pig ventricular myocytes. The Journal of Physiology. 1994;480:423–438. doi: 10.1113/jphysiol.1994.sp020372. [DOI] [PMC free article] [PubMed] [Google Scholar]
- Lipp P, Bootman MD. To quark or to spark, that is the question. The Journal of Physiology. 1997;502:1. doi: 10.1111/j.1469-7793.1997.001bl.x. [DOI] [PMC free article] [PubMed] [Google Scholar]
- Lipp P, Niggli E. Modulation of Ca2+ release in cultured neonatal rat cardiac myocytes - insight from subcellular release patterns revealed by confocal microscopy. Circulation Research. 1994;74:979–990. doi: 10.1161/01.res.74.5.979. [DOI] [PubMed] [Google Scholar]
- Lipp P, Niggli E. A hierarchical concept of cellular and subcellular Ca2+ signalling. Progress in Biophysics and Molecular Biology. 1996a;65:265–296. doi: 10.1016/s0079-6107(96)00014-4. 10.1016/S0079-6107(96)00014-4. [DOI] [PubMed] [Google Scholar]
- Lipp P, Niggli E. Submicroscopic calcium signals as fundamental events of excitation-contraction coupling in guinea-pig cardiac myocytes. The Journal of Physiology. 1996b;492:31–38. doi: 10.1113/jphysiol.1996.sp021286. [DOI] [PMC free article] [PubMed] [Google Scholar]
- López-López JR, Shacklock PS, Balke CW, Wier WG. Local, stochastic release of Ca2+ in voltage-clamped rat heart cells: visualization with confocal microscopy. The Journal of Physiology. 1994;480:21–29. doi: 10.1113/jphysiol.1994.sp020337. [DOI] [PMC free article] [PubMed] [Google Scholar]
- López-López JR, Shacklock PS, Balke CW, Wier WG. Local calcium transients triggered by single L-type calcium channel currents in cardiac cells. Science. 1995;268:1042–1045. doi: 10.1126/science.7754383. [DOI] [PubMed] [Google Scholar]
- Niggli E, Lipp P. Subcellular features of calcium signalling in heart muscle: what do we learn? Cardiovascular Research. 1995;29:441–448. 10.1016/0008-6363(96)88517-8. [PubMed] [Google Scholar]
- Niggli E, Lipp P. Elementary events of INa- and ICa- triggered EC-coupling. Biophysical Journal. 1996;70:A201. [Google Scholar]
- Parker I, Choi J, Yao Y. Elementary events of InsP3-induced Ca2+ liberation in Xenopus oocytes: hot spots, puffs and blips. Cell Calcium. 1996;20:105–121. doi: 10.1016/s0143-4160(96)90100-1. 10.1016/S0143-4160(96)90100-1. [DOI] [PubMed] [Google Scholar]
- Parker I, Zang WJ, Wier WG. Ca2+ sparks involving multiple Ca2+ release sites along Z-lines in rat heart cells. The Journal of Physiology. 1996;497:31–38. doi: 10.1113/jphysiol.1996.sp021747. [DOI] [PMC free article] [PubMed] [Google Scholar]
- Protasi F, Sun XH, Franzini-Armstrong C. Formation and maturation of the calcium release apparatus in developing and adult avian myocardium. Developmental Biology. 1996;173:265–278. doi: 10.1006/dbio.1996.0022. 10.1006/dbio.1996.0022. [DOI] [PubMed] [Google Scholar]
- Shirokova N, Rios E. Small event Ca2+ release: a probable precursor of Ca2+ sparks in frog skeletal muscle. The Journal of Physiology. 1997;502:3–11. doi: 10.1111/j.1469-7793.1997.003bl.x. [DOI] [PMC free article] [PubMed] [Google Scholar]
- Soeller C, Cannell MB. Construction of a two-photon microscope and optimisation of illumination pulse duration. Pflügers Archiv. 1996;432:555–561. doi: 10.1007/s004240050169. [DOI] [PubMed] [Google Scholar]
- Soeller C, Cannell MB. Numerical simulation of local calcium movements during L-type calcium channel gating in the cardiac diad. Biophysical Journal. 1997;73:97–111. doi: 10.1016/S0006-3495(97)78051-2. [DOI] [PMC free article] [PubMed] [Google Scholar]
- Spencer CI, Berlin JR. Control of sarcoplasmic reticulum calcium release during calcium loading in isolated rat ventricular myocytes. The Journal of Physiology. 1995;488:267–279. doi: 10.1113/jphysiol.1995.sp020965. [DOI] [PMC free article] [PubMed] [Google Scholar]
- Stern MD. Theory of excitation-contraction coupling in cardiac muscle. Biophysical Journal. 1992;63:497–517. doi: 10.1016/S0006-3495(92)81615-6. [DOI] [PMC free article] [PubMed] [Google Scholar]
- Takamatsu T, Wier WG. Calcium waves in mammalian heart: quantification of origin, magnitude, waveform and velocity. FASEB Journal. 1990;4:1519–1525. doi: 10.1096/fasebj.4.5.2307330. [DOI] [PubMed] [Google Scholar]
- Trafford AW, O'Neill SC, Eisner DA. Factors affecting the propagation of locally activated systolic Ca2+ transients in rat ventricular myocytes. Pflügers Archiv. 1993;425:181–183. doi: 10.1007/BF00374521. [DOI] [PubMed] [Google Scholar]
- Zahradnikova A, Zahradnik I. A minimal gating model for the cardiac calcium release channel. Biophysical Journal. 1996;71:2996–3012. doi: 10.1016/S0006-3495(96)79492-4. [DOI] [PMC free article] [PubMed] [Google Scholar]