

Abstract
To evaluate the effects of cardiac contraction on intramyocardial (midwall) microvessels, we measured the phasic diameter change of left ventricular intramural arterioles and venules using a novel needle-probe videomicroscope with a CCD camera and compared it with the diameter change in subepicardial and subendocardial vessels.
The phasic diameter of the intramural arterioles decreased from 130 ± 79 μm in end-diastole to 118 ± 72 μm (mean ± s.d.) in end-systole by cardiac contraction (10 ± 6 %, P < 0.001, n= 21).
The phasic diameter in the intramural venules was almost unchanged from end-diastole to end-systole (85 ± 44 vs. 86 ± 42 μm, respectively, 2 ± 6 %, n. s., n= 14).
Compared with intramural vessels, the diameters of subendocardial arterioles and venules decreased by a similar extent (arterioles: 10 ± 8 %, P < 0.001; venules: 12 ± 10 %, P < 0.001) from end-diastole to end-systole, respectively, whereas the diameter of the subepicardial arterioles changed little during the cardiac cycle, and subepicardial venule diameter increased by 9 ± 8 % (P < 0.01) from end-diastole to end-systole. These findings are consistent with our previous report.
We suggest that the almost uniform distribution of the cardiac contractility effect and arteriolar transmural pressure between the subendocardium and the midmyocardium, which together constitute the systolic vascular compressive force, accounts for the similarity in the arteriolar diameter changes in both myocardial layers. The smaller intravascular pressure drop from deep to superficial myocardium relative to the larger intramyocardial pressure drop explains the difference in the phasic venular diameter changes across the myocardium.
The inflow of arterial blood to the myocardium is almost exclusively limited to diastole (Chilian & Marcus, 1982; Kajiya, Tomonaga, Tsujioka, Ogasawara & Nishihara, 1985a; Hiramatsu, Mito & Kajiya, 1990; Kajiya, Hiramatsu, Mito, Tadaoka, Ogasawara & Tsujioka, 1990), whereas venous outflow is predominantly systolic (Kajiya et al. 1985b; Vergroesen, Noble & Spaan, 1987; Hiramatsu et al. 1990; Kajiya et al. 1990; Canty & Brooks, 1990). These findings suggest a substantial phasic volume change in intramyocardial vessels during the cardiac cycle, as observed by Iwasaki et al. (1984). Thus, observations of intramyocardial microvessels during the cardiac cycle should be helpful in understanding the relationship between the intramyocardial vascular volume changes and the phasic coronary arterial and venous blood flow patterns during the cardiac cycle. Previous observations of subepicardial microvessels with intravital microscopy (Kanatsuka, Lamping, Eastham, Dellsperger & Marcus, 1989; Nellis & Whitesell, 1989) demonstrated that subepicardial artery diameters changed very little during the cardiac cycle, while subepicardial venules increased in diameter by about 20 % during systole. In contrast, our recent observations of subendocardial microvessels in beating pig and dog hearts with a needle-probe videomicroscope (Yada et al. 1993, 1995; Hiramatsu et al. 1994) revealed that cardiac contraction decreased the diameters of both arterioles and venules in the subendocardium by about 15-20 %.
The intramyocardial vascular diameter changes between diastole and systole have been explained as being mainly due to two forces, intramyocardial pressure and compressive force resulting from the contraction of myocytes. The intramyocardial pressure is considered to decrease almost linearly from the endocardium to the epicardium (Bruinsma, Arts, Dankelman & Spaan, 1988), whereas the force due to cardiac contraction may be evenly distributed transmurally (Krams, Sipkema & Westerhof, 1989). The purpose of the present study was to extend our understanding of the relationship between cardiac motion (contraction and relaxation) and the diameter changes of intramyocardial (midwall) microvessels as compared with subepicardial and subendocardial vessels.
METHODS
Animal preparation
Twelve adult mongrel dogs of either sex (15-25 kg body wt) were anaesthetized with ketamine (250 mg, i.m.) and sodium pentobarbitone (25 mg kg−1, i.v.). If necessary, on observing a withdrawal reflex, a small supplemental dose (50-100 mg) of the pentobarbitone was given to the dog. After intubation, each animal was artificially ventilated with room air supplemented by 100 % oxygen at a rate sufficient to maintain arterial oxygen and carbon dioxide tensions within the physiological range. A high-frequency jet ventilator (model VS 600, IDC, Pittsburgh, PA, USA) was used to minimize the effects of lung motion on the observation of vascular images. Each animal was placed on a heating pad to maintain body temperature at 37 °C. Polyvinyl catheters were introduced into the left femoral artery and external left jugular vein for blood sampling and drug infusion. Metabolic acidosis during an experiment was prevented by an intravenous infusion of sodium bicarbonate, which maintained arterial pH at approximately 7.4. The electrocardiogram was recorded, and aortic and left ventricular pressures were measured with an 8F pigtail double manometer catheter (Millar model SPC-784A; Millar, Houston, TX, USA) inserted via the right carotid artery. The chest was opened by both a median thoracotomy and a left thoracotomy of the fourth or fifth intercostal space. The heart was exposed and suspended in a pericardial cradle. The proximal portion of the left anterior descending artery (LAD) was isolated near its origin and an electromagnetic flowmeter (model FI; Nihon Kohden, Tokyo, Japan) was placed around the artery for the measurement of coronary blood flow. All measurements were recorded on a direct writing recorder (model RIJ 5608; Nihon Kohden, Tokyo, Japan).
Complete atrioventricular (AV) heart block was produced by injecting formaldehyde (40 %) into the AV node, and pacing wires were sewn onto the right ventricular outflow tract. The heart was paced at a constant rate (100 beats min−1) throughout each experiment.
The experimental protocol was approved by the Committee on Animal Research of the Kawasaki Medical School and the care of all animals used in these experiments complied with the guiding principles of the American Physiological Society on animal experimentation. At the end of the experiment, the animals were killed by injecting a KCl solution and/or by electrical fibrillation.
Measurement of diameters of intramural arterioles and venules
The needle-probe videomicroscope with a CCD camera (VMS 1210; Nihon Kohden) and the method we used to detect vessel diameter have been described in detail elsewhere (Yada et al. 1993; Hiramatsu et al. 1994). Briefly, the system consisted of a needle probe, a camera body containing a CCD camera, a lens and light guides, a control unit, a light source, a monitor and a videocassette recorder (Fig. 1, right). The needle probe (diameter, 4.5 mm; length, 65 mm) contained a gradient index (GRIN) lens surrounded by an annular light guide. The image passed through the GRIN lens and focused on the CCD image sensor. Images on the CCD were converted into colour video signals and recorded on a videotape. The tissue was illuminated by light from a halogen lamp, which was transmitted through light guides surrounding the GRIN lens. A green filter was used to accentuate the contrast between the image of the vessel and the surrounding tissue. The spatial resolution of this system was approximately 5 μm (motion resolution, 2.5 μm) for the × 200 objective with a GRIN lens using a United States Air Force 1951 test target. The maximum depth of field was about ±250 μm. The time sequential images were stored on a Macintosh IIfx (Apple Computer) using a data translation 24-bit analog-to-digital colour video board with a sampling interval of 33 ms.
Figure 1. Experimental preparation for the observation of intramural microvessels by a novel needle-probe videomicroscope with a CCD camera.
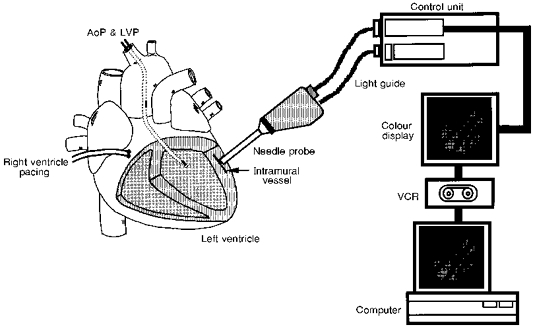
The needle probe was inserted into the myocardium (3-6 mm from the myocardial surface) of the left anterior descending artery-perfused territory. The probe tip was pulled several tens of micrometres away from the microvessels to avoid direct compression of the vessels. AoP, aortic pressure; LVP, left ventricular pressure; VCR, videocassette recorder.
Figure 1 (left) shows the experimental preparation for observation of the intramural microvessels. Following a stab wound by the needle tip, the needle probe was inserted into the myocardium in the territory perfused by the LAD, below the myocardial surface. After obtaining a clear image of the intramural vessels by careful movement of the needle tip at a depth of between 3 and 6 mm, the probe tip was pulled several tens of micrometres away from any microvessels to avoid direct compression of these vessels. The observation of microvessels was performed for only a short time and discontinued immediately if a haemorrhage occurred. Diameters were measured in sections of vessel in which the diameter was relatively uniform. Diameters in consecutive images were measured in the same section of vessel by using a detectable marker in the vessel (e.g. a vascular branch) as a reference point. Arterioles and venules were distinguished by intracoronary injection of Indocyanine Green (ICG) via a small cannula inserted into a branch of the LAD. Injected ICG appeared immediately in arterioles, while its appearance in venules was delayed by a few seconds. Vascular diameters were measured at end-diastole and end-systole as timed by the left ventricular pressure recording. Diameter changes of intramural arterioles and venules throughout the cardiac cycle were evaluated in some cases, but the data were not conclusive because of the limited temporal resolution (33 ms). Subepicardial and subendocardial microvessels were also observed. The methods of observation we used were reported previously; subendocardial vascular images were obtained by placing a needle probe, inserted into the left ventricle from the left atrial appendage via the mitral valve, on the endocardial surface. Subepicardial vessels were observed by placing the probe directly onto the cardiac surface (Yada et al. 1993).
To evaluate the effect on the microvessels of introducing the needle probe into the myocardium, we measured the intramyocardial fluid pressure near the tip of the needle probe at a depth of about 3 and 6 mm beneath the epicardial surface in two dogs. The intramyocardial pressure was measured with a 1 mm diameter fibre-optic pressure sensor (Camino Laboratories, San Diego, CA, USA) (Rabbany, Kresh & Nordergraaf, 1989). The fibre-optic sensor was placed side by side with the needle lens and inserted together with the needle probe so that the tip of the pressure sensor was 20-30 μm beyond the end of the needle; intramyocardial pressure was measured at that position. The needle probe was then pulled out of the myocardium and the intramyocardial pressure was measured without the needle probe.
Using these same two dogs, we inserted the needle probe into the middle of the cardiac wall (≈3-6 mm from the epicardial surface) to visualize a given arteriole and measured the diameter change of this midwall arteriole during a prolonged diastole. Diameter changes measured in this way were compared with those measured in subendocardial arterioles (Hiramatsu et al. 1994). Prolonged diastole was produced by cessation of right ventricular pacing. Sequential vascular images were analysed from the beginning of prolonged diastole until the zero-flow point. Then we advanced the needle probe to a position close to the subendocardium (at a depth of about 1 cm from the cardiac surface) and observed the phasic diameter change of arterioles near the endocardium. The diameter changes were compared with our previous data obtained in dogs by inserting the needle probe from the left ventricular cavity (Hiramatsu et al. 1994).
Statistical analysis
Results were expressed as means ± standard deviation (s.d.). The differences between two means were compared by Student's paired t test. The criterion for statistical significance was P < 0.05.
RESULTS
Haemodynamics
The systemic haemodynamic variables during the vascular observations were: systolic and diastolic aortic pressures, 122 ± 28 and 86 ± 18 mmHg, respectively; left ventricular end-diastolic pressure, 5 ± 2 mmHg; and mean coronary blood flow in the LAD, 26 ± 12 ml min−1.
Validation study of probe introduction into the myocardium
Figure 2 shows an example of intramyocardial pressure waveforms near the tip of the needle probe at a depth of about 6 mm from the epicardium before and after extraction of the needle probe. The intramyocardial pressures and their phasic patterns were similar before and after needle probe extraction. Overall, when the fibre-optic pressure sensor was placed in combination with the needle probe, the maximum (systolic) and minimum (diastolic) intramyocardial pressures were 38 ± 6 and 7 ± 4 mmHg at a depth of about 3 mm from the epicardium (n = 3) and 102 ± 10 and 11 ± 2 mmHg at a depth of about 6 mm (n = 3). After extraction of the needle probe, the pressures were 39 ± 5 and 6 ± 3 mmHg at 3 mm depth and 108 ± 8 and 7 ± 3 mmHg at 6 mm depth. Since the pressure values before and after probe extraction were close at each measuring position, this indicates that the absolute value of the intramyocardial pulse pressure is not influenced significantly by probe insertion.
Figure 2. Phasic changes in the intramyocardial pressure waveform near the tip of the needle probe before and after extraction of the needle probe.
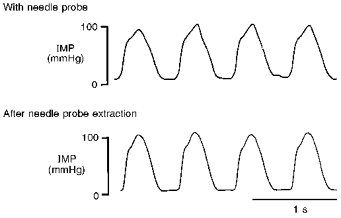
Recordings were made by a fibre-optic sensor at a depth of about 6 mm from the epicardium. Intramyocardial pressure (IMP) and phasic pattern were more or less the same before and after needle probe extraction.
Figure 3 shows the typical diameter changes of an intramural arteriole during prolonged diastole. The intramural arteriole diameter decreased gradually with decreasing aortic pressure. Mean diameter at the zero-flow point in a prolonged diastole (105 ± 34 μm, n = 4) was less than at the beginning of this prolonged diastole (138 ± 45 μm, n = 4, P < 0.05). The percentage change in diameter (24 %) was similar to that of the subendocardial arteriole in our previous study (25 %; Hiramatsu et al. 1994). Moreover, like the subendocardial arterioles, the intramural arteriole did not collapse at the zero-flow point. End-diastolic arteriolar diameters in the subendocardium observed by transmural access were 130 and 80 μm, respectively, and the percentage shortening of the diameters during systole was 12 ± 8 % per five beats and 16 ± 6 % per five beats, respectively, also consistent with our previous observations from the left ventricular cavity (Hiramatsu et al. 1994). These results also indicate that the insertion of the probe into the myocardium did not seriously affect our intramural microvascular observations.
Figure 3. Diameter changes of an intramural arteriole during prolonged diastole.
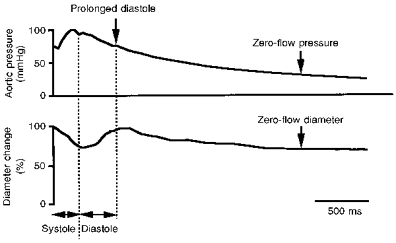
The diameter of the intramural arteriole decreased gradually with decreasing aortic pressure. The intramural arteriole did not collapse at zero coronary flo
Phasic diameter changes of intramural microvessels
Figure 4 shows representative images of an intramural arteriole and two accompanying venules throughout one cardiac cycle. The diameter of the intramural arteriole decreased from end-diastole (77 μm) to end-systole (59 μm). The diameter change of the intramural venule from end-diastole to end-systole was small compared with the arteriole; the upper left venule diameter changed from 75 to 76 μm and the lower right venule from 60 to 60 μm. These vessels did not collapse during systole. The middle panels of Fig. 5 show the phasic diameter changes of the intramural arteriole and the upper left venule shown in Fig. 4. The top panels of Fig. 5 exhibit the diameter changes of a subepicardial arteriole and venule. The corresponding bottom panels show subendocardial arteriolar and venular diameter changes. These measurements were not taken simultaneously with those of the intramural vessels. The diameter changes of subepicardial, intramural and subendocardial arterioles were all synchronized during the cardiac cycle, i.e. the diameters decreased during systole while they increased during diastole. By contrast, the diameter of subendocardial venules decreased during systole, while the diameter of subepicardial venules increased. Hence, the venular diameter changes in the three layers were not synchronized.
Figure 4. Typical vascular images in the intramural arteriole and accompanying two venules during one cardiac cycle.
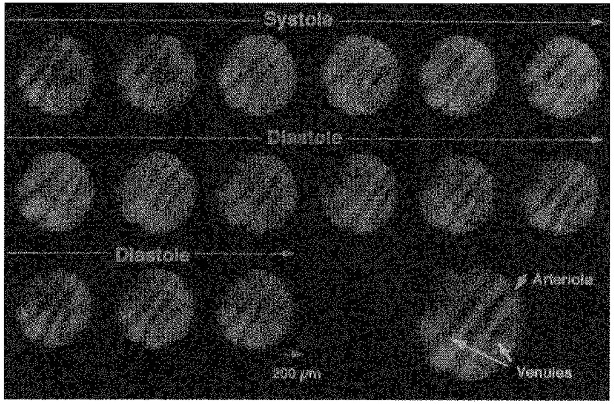
The enlarged view bottom right shows the positions of the arteriole and the venules. The arteriolar diameter decreased during systole, while the venular diameters remained almost unchanged. The intramural arteriole and venules did not collapse throughout the cardiac cycle. Diameter was measured at the best-focused part of each image. The sequential diameter measurement was performed at the best-focused centre part of each image.
Figure 5. An example of phasic diameter changes of subepicardial, intramural and subendocardial arterioles and venules during a cardiac cycle.
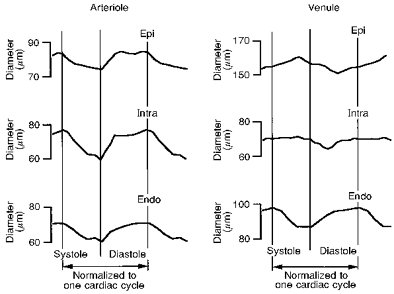
The intramural arteriole and venule (Intra; middle of both left and right panels) are the same vessels as shown in Fig. 4, i.e. the arteriole at the centre and the venule at the top left. Note that the intramural arteriolar diameter decreased during systole and increased during diastole and also that this behaviour was synchronized with the subepicardial (Epi) and subendocardial (Endo) arterioles, although the subepicardial diameter change was small. For the venule, the intramural venular diameter was almost constant during systole, while the subepicardial venular diameter increased and the subendocardial venular diameter decreased.
The left panel of Fig. 6 shows the diameters of twenty-one intramural arterioles (ranging from 45 to 235 μm at end-diastole) at end-diastole and end-systole. The diameter of the intramural arterioles decreased from 130 ± 79 μm at end-diastole to 118 ± 72 μm at end-systole (P < 0.001). The corresponding left ventricular (LV) end-diastolic and end-systolic pressures were 5 ± 2 and 107 ± 21 mmHg, respectively. The right panel of Fig. 6 shows the diameters of fourteen intramural venules (ranging from 26 to 150 μm at end-diastole) at end-diastole and end-systole. The diameter of the intramural venules was almost unchanged from systole to diastole (85 ± 44 and 86 ± 42 μm, respectively, n.s.). The LV end-diastolic and end-systolic pressures during the diameter measurements were 5 ± 2 and 105 ± 15 mmHg, respectively.
Figure 6. Diameter changes of intramural arterioles and venules from end-diastole to end-systole.
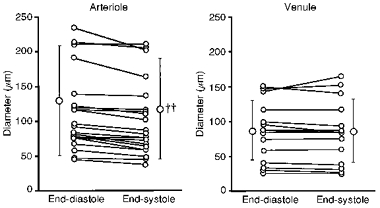
The diameters of intramural arterioles (n = 21) decreased from end-diastole to end-systole, while the diameters of intramural venules (n = 14) were almost unchanged from end-diastole to end-systole. ††
Behaviour of subepicardial and subendocardial microvessels
Figure 7 shows the percentage diameter changes of the subepicardial and subendocardial arterioles and venules from end-diastole to end-systole, together with those of intramural microvessels. The diameter of the subendocardial arterioles and venules decreased by 10 ± 8 % (P < 0.001, n= 16) and 12 ± 10 % (P < 0.001, n= 20), respectively. The LV end-diastolic and end-systolic pressures for the subendocardial arteriolar diameter measurements were 5 ± 4 and 93 ± 9 mmHg, while those for the venular measurements were 5 ± 4 and 93 ± 6 mmHg, respectively. The diameter of the subepicardial arterioles was almost unchanged (3 ± 7 %, n.s., n = 40) during the cardiac cycle, whereas that of the venules increased by 9 ± 8 % (P < 0.01, n= 25). The LV end-diastolic and end-systolic pressures for the subepicardial arteriolar diameter measurements were 6 ± 1 and 101 ± 15 mmHg, while those for the venular measurements were 5 ± 1 and 105 ± 10 mmHg, respectively. It should be noted that the diameter of the intramural arterioles decreased by 10 ± 6 % (P < 0.001, n= 21) and that the diameter of intramural venules was almost constant during the cardiac cycle.
Figure 7. Percentage diameter changes of subepicardial, intramural and subendocardial arterioles and venules from end-diastole to end-systole.
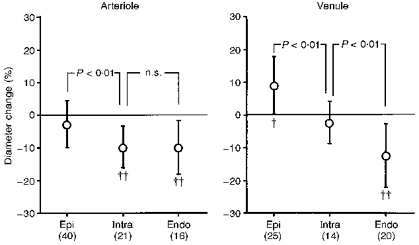
Diameter changes in intramural (Intra) and subendocardial (Endo) arterioles were similar, while the subepicardial (Epi) arteriolar diameter was almost unchanged. The subepicardial venular diameter increased during systole, while the subendocardial diameter decreased. The intramural venular diameter was almost unchanged. †P < 0.01; ††P < 0.001 vs. the value at end-diastole. n values are given in parentheses.
DISCUSSION
This is the first study to visualize intramural arterioles and venules of the beating heart and to measure their diameter changes during the cardiac cycle. The major findings from this study are as follows. (1) The diameter of intramural arterioles decreased from end-diastole to end-systole, in a similar manner to subendocardial arterioles. Subepicardial arteriolar diameter changed very little during the cardiac cycle. (2) The phasic diameter change of intramural venules was small, unlike subendocardial venules which showed systolic narrowing, and subepicardial venules which showed systolic enlargement.
Whilst interpreting our results the following factors should be taken into account: (1) methodological limitations; and (2) the interpretation of the effects caused by cardiac contraction and relaxation.
Methodological limitations
Since the tip of the needle probe was inserted 3-6 mm into the myocardium from the epicardial surface, there is the possibility that this may influence the behaviour of intramural microvessels during the cardiac cycle. However, when the intramyocardial pressures measured with the fibre-optic pressure sensor combined with the needle probe were compared with those measured on insertion of the pressure sensor alone, the diastolic and systolic intramyocardial pressures at a depth of 3 mm from the cardiac surface were similar. The diastolic intramyocardial pressure at a depth of 6 mm was slightly lower and the systolic pressure slightly higher in the case of the combined insertion, both by about 5 mmHg. Although the technique of intramyocardial pressure measurements always has some limitations, these observations suggest that the needle probe does not have a significant effect on the pulsation of intramural vessels by changing the intramyocardial fluid pressure.
Beside the influence on intramyocardial pressures, there is the possibility that insertion of the needle probe into the myocardium may affect the local myocardial fibre geometry and function and also the geometry and function of the extracellular matrix, which could in turn affect the behaviour of intramural microvessels. To analyse this influence, we observed arteriolar behaviour near the midwall during a prolonged diastole. The arteriolar diameter decreased by 24 % from the beginning of the long diastole to the time point of zero flow without any collapse of arteriolar segments. The degree of diameter decrease was in good agreement with our previous experiment on subendocardial arterioles (25 % decrease; Hiramatsu et al. 1994) and also with the data for epicardial arterioles (23 %; Kanatsuka, Ashikawa, Komaru, Suzuki & Takishima, 1990). We also inserted the needle probe deeply into the subendocardium to visualize the subendocardial arterioles: the percentage diameter changes seen in the arterioles were in the same range as our previous observations made from the left ventricular cavity. Thus, these observations support the validity of the present measurements. Nevertheless, the needle probe must produce some degree of distortion of local forces, and may alter the phasic nature of diameter excursion, perhaps leading to a slight underestimation of the pulsation. At the present time we cannot ascertain the extent of this artifact.
Finally, there is the possibility that bleeding associated with the insertion of the needle probe could affect the diastolic and systolic intramyocardial pressures. However, we analysed the vascular diameters when the bleeding was minimal or invisible; actually we could not observe the intramural vessels when visible bleeding occurred, because the bleeding obscured the visual field. It has been reported that during anaesthesia, subendocardial flow is lower than in the conscious state (Hoffman & Spaan, 1990). Moreover, Spaan (1991) demonstrated that the pulsatility in the epicardial venous pressure without the pericardium was altered compared with when the pericardium is present, e.g. the venous pressure waveform with pericardium seemed to be more spiky during systole. These findings indicate that anaesthesia and/or opening of the pericardium may have had some influence on the present results: both of these procedures were essential to the present study.
Diameter changes of the intramural arterioles
The diameter change seen in the intramural arterioles of the present study was greater than that seen in the epicardium but similar to that seen in the endocardium. Kanatsuka et al. (1989) observed only a 1 % diameter change of left ventricular epicardial arterioles during the cardiac cycle using an intravital floating microscope system. Yada et al. (1993) observed a 2 % decrease at end-systole in the subepicardial arterioles of pig hearts as measured with a needle probe videomicroscope and CCD camera. In contrast, the diameter of subendocardial arterioles was about 15-20 % during end-systole (Yada et al. 1993; Hiramatsu et al. 1994). The present observation that the diameter change of subendocardial arterioles is greater than that of subepicardial arterioles is consistent with the earlier reports. The smaller diameter change of subendocardial arterioles in the present study compared with that found in our previous paper may be due to a difference in size of the arterioles, i.e. the arterioles in this study were smaller (and would show less pulsation; Yada et al. 1993) and also to a species difference (Hiramatsu et al. 1994).
Many investigators have reported that intramyocardial pressure is highest in the endocardium and decreases gradually to the subepicardium (Brandi & MacGregor, 1969; Heinneman & Grayson, 1985; Rabbany et al. 1989; Hoffman & Spaan, 1990). If intramyocardial pressure is the dominant determinant of systolic narrowing of the arterial vessels in the myocardium, systolic arteriole narrowing would be predicted to be greatest in the subendocardium, smallest in the subepicardium and in-between in the midmyocardium. However, the finding that the percentage systolic narrowing of the intramural arterioles is about the same as for subendocardial arterioles suggests involvement of other factors in addition to the effects of intramyocardial pressure. One possible factor may be a similar systolic pressure drop in both the intramyocardium and the arteriolar lumen from the endocardium to the midmyocardium, resulting in a transmural pressure similar to that of a systolic compressive force. On the other hand, Krams, Sipkema & Westerhof (1990) showed the dominance of cardiac contractility over left ventricular pressure in determining the pulsatility of coronary flow. Although the importance of contractility as the extravascular compressive force is still controversial, the squeezing effect of cardiac contraction may be almost evenly distributed in the myocardial layers. This may explain the similar arteriolar diameter changes in both subendocardium and midmyocardium. The other possible factors that could decrease arteriolar diameter during systole are the shortening and thickening of adjacent muscle fibres with extracellular matrices. Taken together, these factors could explain our findings of similar vascular compression in both the subendocardium and midmyocardium.
The inflow of blood to the myocardium is almost exclusively limited to diastole, and cardiac contraction even causes retrograde flow in the coronary artery (Chilian & Marcus, 1982; Kajiya et al. 1985a; Hiramatsu et al. 1990; Kajiya et al. 1990). The presence of systolic retrograde blood flow indicates the translocation of blood from the deeper to the more superficial myocardial layers by cardiac contraction. When subepicardial and subendocardial blood flow were compared between beating and arrested conditions (Flynn et al. 1992), the subepicardial flow decreased and the subendocardial flow increased during arrest, supporting retrograde pumping of blood from the deep to the superficial layers of the left ventricle. Since the pulsation amplitude of subendocardial arterioles was greater in larger arterioles, as discussed above (Yada et al. 1993), the intramural arterioles may behave similarly. Accordingly, subendocardial and intramural arterioles that are larger than those in our present study may function more effectively as ‘charging’ and ‘discharging’ capacitors.
Diameter changes of the intramural venules
The diameter changes we observed in the intramyocardial venules during systole were small, while subepicardial venular diameter increased and subendocardial diameter decreased. Because of the relatively low pressure in the venous system the diameters of venules, especially the epicardial venules, may be much more variable than those of the arterioles, and interpretation should be done with care. However, the directional change of subepicardial venular diameter during the cardiac cycle was in good agreement with the report of Nellis & Whitesell (1989) and our previous observations (Yada et al. 1993). The systolic compression of subendocardial venules was also consistent with our previous report (Yada et al. 1993).
During systole, the venous flow occurs in a direction from deep myocardium towards superficial myocardium. Great cardiac vein pressure is high during systole (Spaan et al. 1991). However, the systolic intravascular pressure gradient of venules from deep to superficial myocardium may be small because of the lower resistance of a venous system. On the other hand, as discussed above, the systolic intramyocardial pressure decreases from endocardium to epicardium and that of the midmyocardium may be in between the values of the subepicardium and the subendocardium. Thus, the extravascular compressive force and intraluminal venous pressure in the midmyocardium may be well balanced, and the venular diameter will not change significantly. However, the larger venules and small veins may exhibit some phasic excursion since their intraluminal pressure is lower than that of the proximal smaller venules.
The systolic increase in subepicardial venular diameter may be explained by the greater intraluminal pressure change than by the extravascular compressive force, since the intramyocardial pressure is small in the subepicardium, while the decrease in intravascular pressure may be much less. The systolic decrease in the subendocardial venular size may be due to the high intramyocardial pressure there. The similar degree of vascular compression between venules and arterioles in the subendocardium may be explained mainly by the direct effect of cardiac contraction on both types of vessel, as discussed in our previous paper (Yada et al. 1993). The transient decrease in the venular diameter of superficial and middle layers in diastole may be related to the translocation of venous blood from these layers to deeper layers during the early part of diastole. The subsequent increase may be caused by delayed venous filling during the later part of diastole.
In conclusion, the diameter of intramural arterioles decreased from end-diastole to end-systole. Their percentage systolic narrowing did not differ from that of subendocardial arterioles, but both showed a much greater percentage narrowing than subepicardial arterioles. The change in venular diameter recorded during systole differed depending on the depth of the myocardial layer: the diameter of the intramural venules was almost unchanged from end-diastole to end-systole, while the diameter increased in the subepicardium and decreased in the subendocardium. We suggest that the almost uniformly distributed cardiac contractility effect and the arteriolar transmural pressure between the subendocardium and midmyocardium together make up the systolic vascular compressive force and cause similar arteriolar diameter changes in both myocardial layers. We also suggest that the smaller intravascular pressure drop from deeper to superficial myocardium relative to the larger intramyocardial pressure drop explains the differences in the phasic venular diameter changes across the myocardium.
Acknowledgments
This study was supported by Grant-in-Aid 06558130 for Developmental Scientific Research from the Ministry of Education, Science and Culture, Japan and by a Research Project Grant (No 4-107) from Kawasaki Medical School.
References
- Brandi G, McGregor M. Intramural pressure in the left ventricle of the dog. Cardiovascular Research. 1969;3:472–475. doi: 10.1093/cvr/3.4.472. [DOI] [PubMed] [Google Scholar]
- Bruinsma P, Arts T, Dankelman J, Spaan J. Model of coronary circulation based on pressure dependence of coronary resistance and compliance. Basic Research in Cardiology. 1988;83:510–524. doi: 10.1007/BF01906680. [DOI] [PubMed] [Google Scholar]
- Canty JM, Jr, Brooks A. Phasic volumetric coronary venous outflow patterns in conscious dogs. American Journal of Physiology. 1990;258:H1457–1463. doi: 10.1152/ajpheart.1990.258.5.H1457. [DOI] [PubMed] [Google Scholar]
- Chilian WM, Marcus ML. Phasic coronary flow velocity in intramural and epicardial coronary arteries. Circulation Research. 1982;50:775–781. doi: 10.1161/01.res.50.6.775. [DOI] [PubMed] [Google Scholar]
- Flynn AE, Coggins DL, Goto M, Aldea GS, Austin RE, Doucette JW, Husseini W, Hoffman JIE. Does systolic subepicardial perfusion come from retrograde subendocardial flow. American Journal of Physiology. 1992;262:H1759–1769. doi: 10.1152/ajpheart.1992.262.6.H1759. [DOI] [PubMed] [Google Scholar]
- Heinneman FW, Grayson J. Transmural distribution of intramyocardial pressure measured by micropipette technique. American Journal of Physiology. 1985;249:H1216–1223. doi: 10.1152/ajpheart.1985.249.6.H1216. [DOI] [PubMed] [Google Scholar]
- Hiramatsu O, Goto M, Yada T, Kimura A, Tachibana H, Ogasawara Y, Tsujioka K, Kajiya F. Diameters of subendocardial arterioles and venules during prolonged diastole in canine left ventricles. Circulation Research. 1994;75:393–399. doi: 10.1161/01.res.75.2.393. [DOI] [PubMed] [Google Scholar]
- Hiramatsu O, Mito K, Kajiya F. Evaluation of the velocity waveform in intramyocardial small vessels. In: Kajiya F, Klassen GA, Spaan JAE, Hoffman JIE, editors. Coronary Circulation: Basic Mechanism and Clinical Relevance. Tokyo: Springer Verlag; 1990. pp. 169–172. [Google Scholar]
- Hoffman JIE, Spaan JAE. Pressure-flow relation in coronary circulation. Physiological Review. 1990;70:331–390. doi: 10.1152/physrev.1990.70.2.331. [DOI] [PubMed] [Google Scholar]
- Iwasaki T, Sinak LJ, Hoffman EA, Robb RA, Harris LD, Bahn RC, Ritman EL. Mass of left ventricular myocardium estimated with dynamic spatial reconstructor. American Journal of Physiology. 1984;246:H138–142. doi: 10.1152/ajpheart.1984.246.1.H138. [DOI] [PubMed] [Google Scholar]
- Kajiya F, Hiramatsu O, Mito K, Tadaoka S, Ogasawara Y, Tsujioka K. Evaluation of coronary blood flow by fiber-optic laser Doppler velocimeter. In: Kajiya F, Klassen GA, Spaan JAE, Hoffman JIE, editors. Coronary Circulation: Basic Mechanism and Clinical Relevance. Tokyo: Springer Verlag; 1990. pp. 43–53. [Google Scholar]
- Kajiya F, Tomonaga G, Tsujioka K, Ogasawara Y, Nishihara H. Evaluation of local blood flow velocity in proximal and distal coronary arteries by laser Doppler Method. Journal of Biomechanical Engineering. 1985a;107:10–15. doi: 10.1115/1.3138511. [DOI] [PubMed] [Google Scholar]
- Kajiya F, Tsujioka K, Goto M, Wada Y, Tadaoka S, Nakai M, Hiramatsu O, Ogasawara Y, Mito K. Evaluation of phasic blood flow velocity in great cardiac vein by laser Doppler method. Heart Vessels. 1985b;29:429–464. doi: 10.1007/BF02066482. [DOI] [PubMed] [Google Scholar]
- Kanatsuka H, Ashikawa K, Komaru T, Suzuki T, Takishima T. Diameter change and pressure-red blood cell velocity relation in coronary microvessels during long diastoles in the canine left ventricle. Circulation Research. 1990;66:503–510. doi: 10.1161/01.res.66.2.503. [DOI] [PubMed] [Google Scholar]
- Kanatsuka H, Lamping KG, Eastham CL, Dellsperger KC, Marcus ML. Comparison of the effects of increased myocardial oxygen consumption and adenosine on the coronary microvascular resistance. Circulation Research. 1989;65:1296–1305. doi: 10.1161/01.res.65.5.1296. [DOI] [PubMed] [Google Scholar]
- Krams R, Sipkema P, Westerhof N. Varying elastance concept may explain coronary systolic flow inpediment. American Journal of Physiology. 1989;257:H1471–1479. doi: 10.1152/ajpheart.1989.257.5.H1471. [DOI] [PubMed] [Google Scholar]
- Krams R, Sipkema P, Westerhof N. Coronary oscillatory flow amplitude is more affected by perfusion than ventricular pressure. American Journal of Physiology. 1990;258:H1889–1898. doi: 10.1152/ajpheart.1990.258.6.H1889. [DOI] [PubMed] [Google Scholar]
- Nellis SH, Whitesell L. Phasic pressure and diameters in small epicardial veins of the unrestrained heart. American Journal of Physiology. 1989;257:H1056–1061. doi: 10.1152/ajpheart.1989.257.4.H1056. [DOI] [PubMed] [Google Scholar]
- Rabbany SY, Kresh JY, Nordergraaf A. Intramyocardial pressure: interaction of myocardial fluid pressure and fiber stress. American Journal of Physiology. 1989;257:H357–364. doi: 10.1152/ajpheart.1989.257.2.H357. [DOI] [PubMed] [Google Scholar]
- Spaan JAE. Coronary Blood Flow. Dordrecht: Kluwer Academic Publishers; 1991. Structure and function of the coronary venous system; pp. 87–98. [Google Scholar]
- Vergroesen I, Noble MIM, Spaan JAE. Intramyocardial blood volume change in first moments of cardiac arrest in anesthetized goats. American Journal of Physiology. 1987;253:H307–316. doi: 10.1152/ajpheart.1987.253.2.H307. [DOI] [PubMed] [Google Scholar]
- Yada T, Hiramatsu O, Kimura A, Goto M, Ogasawara Y, Tsujioka K, Yamamori S, Ohno K, Hosaka H, Kajiya F. In vivo observation of subendocardial microvessels of the beating porcine heart using a needle-probe video-microscope with a CCD camera. Circulation Research. 1993;72:939–946. doi: 10.1161/01.res.72.5.939. [DOI] [PubMed] [Google Scholar]
- Yada T, Hiramatsu O, Kimura A, Tachibana H, Chiba Y, Lu S, Goto M, Ogasawara Y, Tsujioka K, Kajiya F. Direct in vivo observation of subendocardial arteriolar response during reactive hyperemia. Circulation Research. 1995;77:622–631. doi: 10.1161/01.res.77.3.622. [DOI] [PubMed] [Google Scholar]