

Abstract
The whole-cell Na+-K+ pump current (INa-K) and Na+-Ca2+ exchange current (INa-Ca) were recorded in guinea-pig ventricular myocytes to study the interaction between the two Na+ transport mechanisms.
INa-K was isolated as an external K+-induced current, and INa-Ca as an external Ca2+- induced or Ni2+-sensitive current. The experimental protocol used for one ion carrier did not affect the other.
The amplitude of INa-K decreased to 54 ± 17 % of the initial peak during continuous application of K+ with 20 mM Na+ in the pipette. The outward INa-Ca, which was intermittently activated by brief applications of Ca2+, decreased during activation of INa-K, and recovered after cessation of INa-K activation. These findings revealed a dynamic interaction between INa-K and INa-Ca via a depletion of Na+ under the sarcolemma.
To estimate changes in Na+ concentration ([Na+]i) under the sarcolemma, the reversal potential (Vrev) of INa-Ca was measured. Unexpectedly, Vrev hardly changed during activation of INa-K. However, when INa-Ca was blocked by Ni2+ at the same time that INa-K was activated, Vrev changed markedly, maximally by +100 mV, immediately after the removal of Ni2+ and K+.
Subsarcolemmal [Na+]i was calculated from the Vrev of INa-Ca on the assumption that the subsarcolemmal Ca2+ concentration ([Ca2+]i) was fixed with EGTA, and mean [Na+]i was calculated from both the time integral of INa-K and the cell volume. The subsarcolemmal [Na+]i was about seven times greater than the mean [Na+]i.
The interaction between the Na+-K+ pump and Na+-Ca2+ exchange was well simulated by a diffusion model, in which Na+ diffusion was restricted to one-seventh (14 %) of the total cell volume.
Na+-Ca2+ exchange like other secondary active transporters utilizes the electrochemical gradient of Na+ across the sarcolemma, which is generated by the primary active transporter, the Na+-K+ pump. In cardiac muscle, the inhibition of the Na+-K+ pump by cardiac glycosides enhances contractility by increasing the cytoplasmic Ca2+ concentration ([Ca2+]i) through modified Na+-Ca2+ exchange activity (Langer, 1971; Allen & Blinks, 1978; Barry, Hasin & Smith, 1985; Lee, 1985). Thus, the activities of the two ion transporters are closely coupled. This mutual dependency of the two ion transporters may become more efficient when the ion transporters are spatially coupled on the cell membrane and/or the change in intracellular Na+ concentration ([Na+]i) due to ion exchanges is limited to a common space under the sarcolemma. The spatial coupling was first reported by Moore et al. (1993) in smooth muscle. They revealed that the Na+-K+ pump and Na+-Ca2+ exchange molecules are located close together in the sarcolemma.
As to [Na+]i under the sarcolemma, direct [Na+]i measurement using the X-ray microprobe method revealed that subsarcolemmal [Na+]i is different from that in the bulk cytoplasm (Isenberg & Wendt-Gallitelli, 1990; Wendt-Gallitelli, Voigt & Isenberg, 1993). These authors demonstrated that rapid Na+ channel activation induced an accumulation of [Na+]i under the membrane, and that [Na+]i decreased from the subsarcolemmal space to the cellular core with a space constant of 28 nm at early systole and 70 nm at diastole. Several studies demonstrated that there was also heterogeneity of [Ca2+]i in cardiac muscle (Lipp, Pott, Callewaert & Carmeliet, 1990; Trafford, Díaz, O'Neill & Eisner, 1995), squid axon (Mullins & Requena, 1979), pancreatic acinar cells (Osipchuk, Wakui, Yule, Gallacher & Peterson, 1990) and smooth muscle (Stehno-Bittel & Sturek, 1992). On the other hand, the reversal potential (Vrev) of the Na+-Ca2+ exchange current (INa-Ca) shifts when the exchange is continuously accelerated, most probably due to a change in [Na+]i and [Ca2+]i via the exchange (Ehara, Matsuoka & Noma, 1989; Crespo, Grantham & Cannell, 1990). However, it is still not clear whether the change in the ion concentrations occurs mainly in a restricted space under the membrane during the activation of the ion transporters.
The aim of the present study was to explain the mutual dependency of the Na+-K+ pump and Na+-Ca2+ exchange in a quantitative manner by estimating changes in subsarcolemmal [Na+]i during activation of the Na+-K+ pump. We recorded both the whole-cell Na+-K+ pump current (INa-K) and INa-Ca in single ventricular myocytes. Na+ efflux was estimated from the time integral of INa-K and changes in [Na+]i at the subsarcolemmal space were calculated from the Vrev of INa-Ca. We demonstrate that the activities of the Na+-K+ pump and Na+-Ca2+ exchange are tightly correlated via a change in [Na+]i and that this change in [Na+]i occurs in a restricted interactive space, which is about 14 % of the total cell volume.
METHODS
Isolation of ventricular myocytes
The ventricular myocytes were dissociated by treating guinea-pig hearts with collagenase using Langendorff-type coronary perfusion (Powell, Terrar & Twist, 1980). Guinea-pigs (200-300 g) were deeply anaesthetized by intraperitoneal injection of pentobarbitone sodium (≥ 0.1 mg g−1). Under artificial ventilation, the chest was opened and the aorta was cannulated in situ. After starting the coronary perfusion with a control Tyrode solution, the heart was dissected out and its spontaneous beat was stopped by switching the perfusate to a nominally Ca2+-free Tyrode solution. The heart was then perfused with the nominally Ca2+-free Tyrode solution containing collagenase (40 mg (100 ml)−1, Sigma Type I) for 20 min. The enzyme was washed out by perfusing the heart with a high-K+, low-Cl− solution, and the myocytes were dispersed from the digested left ventricle in the same solution. The isolated cells were transferred to and stored in a culture medium (5 mM Hepes-buffered minimal essential medium (MEM); Dainippon Pharmaceutical Co. Ltd, Japan; pH 7.4). The cells were used for experiments within 8 h.
Solutions
The control Tyrode solution contained (mM): NaCl, 140; KCl, 5.4; CaCl2, 1.8; MgCl2, 0.5; NaH2PO4, 0.33; glucose, 5.5; and Hepes, 5. The pH was adjusted to 7.4 with NaOH. To obtain the Ca2+-free solution, CaCl2 was simply omitted. The high-K+, low-Cl− solution contained (mM): KCl, 25; glutamate, 70; KH2PO4, 10; taurine, 10; EGTA, 0.5; glucose, 11; and Hepes, 10 (pH adjusted to 7.3 with KOH).
The composition of the standard internal (pipette) solution was (mM): aspartate, 42; NaOH, 10; CaCl2, 37.1; EGTA, 42; MgATP, 10; sodium creatine phosphate, 5; Hepes, 10; and TEA-Cl, 20; pH adjusted to 7.2 with CsOH. The Na+ concentration was 20 mM in this standard internal solution and it was increased to 50 or 100 mM when necessary by replacing Cs+ with Na+. The calculated free Ca2+ concentration was 1 μM (Bers, Patton & Nuccitelli, 1993). The free Ca2+ concentration was set to various levels by varying the amount of CaCl2. The composition of the standard external solution was (mM): NaCl, 145; BaCl2, 2; MgCl2, 2; CsCl, 2; CaCl2, 2; EGTA, 0.1; glucose, 5.5; Hepes, 5; and nicardipine, 0.001; the pH was adjusted to 7.4 with CsOH. An activator (5.4 mM K+), or a blocker (100-200 μM ouabain), of the Na+-K+ pump, or a blocker (5 mM Ni2+) of Na+-Ca2+ exchange was added to the external solution when required. For each experiment, Na+ and Ca2+ concentrations in the external solution ([Na+]o and [Ca2+]o), and Na+ and Ca2+ concentrations in the pipette solution ([Na+]pip and [Ca2+]pip) are given in the text or figure legends. Ouabain was purchased from Sigma.
Whole-cell voltage clamp
Whole-cell voltage clamp was conducted with a patch clamp amplifier (Axopatch 200B; Axon Instruments). The patch electrodes were made from borosilicate glass capillaries with tip diameters of 1.5-3 μm and the tip resistance was 1-2.5 MΩ when filled with the pipette solution. The current signal was filtered by a low-pass filter at 1 kHz. The membrane voltage and current were recorded by an on-line computer (PC-9821AP; NEC, Japan) through an A/D converter (ADX-98H; Canopus, Japan) and by a digital tape recorder (RD-120T; TEAC, Japan).
All measurements of membrane potential were corrected for the liquid junction potential of the low-Cl− pipette solution in contact with the Tyrode solution (assumed to be -10 mV for convenience). The membrane capacitance was determined from integration of capacitive current induced by a 5 mV voltage step, provided that the capacitive surge ended within 5 ms after the onset of the pulse. The holding potential was set to -50 mV, and all experiments were carried out at 35-36°C. The current-voltage (I-V) relationship was recorded with ramp pulses (dV/dt=± 423 mV s−1), during which the membrane potential was changed from the holding potential to +70 mV, then to -120 mV and then returned to the holding potential. The I-V relationship was measured during the repolarizing phase of the ramp pulse.
All statistical data are presented as means ±s.d., and statistical significance was assessed using Student's t test (unpaired samples, two-sided) at the significance level (P) indicated.
RESULTS
Isolation of INa-K and INa-Ca
It was essential to isolate INa-K or INa-Ca without affecting the other current, in the present study, to investigate the interaction of these two mechanisms. Therefore, we first examined experimental protocols for the isolation of each of the two carrier-mediated currents. Results from an experiment to investigate whether a Na+-Ca2+ exchange blocker, Ni2+, affected INa-K are shown in Fig. 1A. INa-K was evoked by applying 5.4 mM K+ in the absence and presence of 5 mM Ni2+. In this experiment, Na+-Ca2+ exchange was inhibited throughout the experiment by removal of Ca2+ from both the pipette solution (42 mM EGTA and no added CaCl2) and the external solution (0.1 mM EGTA and no added CaCl2). No significant difference was observed between the amplitude of INa-K recorded in the absence and presence of Ni2+ at the holding potential (-50 mV; Fig. 1A, left) and between the I-V relationships recorded with ramp pulses (Fig. 1A, right). In four experiments, the amplitude of INa-K at 0 mV was 1.27 ± 0.09 pA pF−1 in the absence of Ni2+ and 1.20 ± 0.17 pA pF−1 in the presence of Ni2+ (not significant (n.s.), P > 0.1).
Figure 1. Isolation of INa-K and INa-Ca.
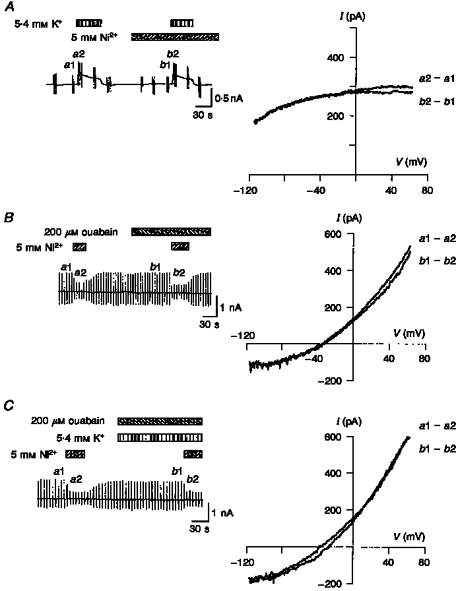
A-C, chart records of the change in holding current (left) and I-V relationships (right). The vertical deflections in the chart recordings were evoked by application of ramp pulses. The I-V relationships were obtained by calculating the difference between the pair of current records induced by the ramp pulse as shown to the right of each I-V relationship. The application of test solutions is indicated above the chart recordings. A, effect of Ni2+ on INa-K. B, effect of ouabain on INa-Ca. C, effect of K+ on INa-Ca. Note that the difference current has an I-V relationship typical of INa-K (A) or INa-Ca (B and C). In A, [Na+]o= 145 mM, [Ca2+]o= 0 mM (0.1 mM EGTA), [Na+]pip= 50 mM and [Ca2+]pip= 0 μM (42 mM EGTA). In B and C, [Na+]o= 145 mM, [Ca2+]o= 2 mM, [Na+]pip= 20 mM and [Ca2+]pip= 1.0 μM.
The K+-induced I-V relationship was almost identical to the 200 μM ouabain-sensitive I-V relationship (data not shown). Therefore, we assumed that membrane K+ channel conductance was effectively suppressed by K+ channel blockers included in both internal and external solutions. However, it should be noted that the subtraction of the control current from that in the presence of K+ did not always give an INa-K, unless Na+-Ca2+ exchange was blocked. This is because the activation of the pump indirectly modifies INa-Ca (see Fig. 2).
Figure 2. Decrease in outward INa-Ca during Na+-K+ pump activation.
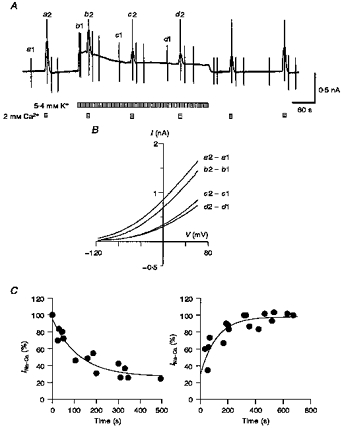
In A, the application of 2 mM Ca2+ and 5.4 mM K+ is indicated below the chart recordings of the whole-cell current. The vertical deflections were evoked by ramp pulses, which were applied during the control period and near the peak of the responses. B, I-V relationships were obtained by calculating the difference between the pairs of current recordings as shown to the right of each curve. C, the amplitude of outward INa-Ca from four cells was plotted during activation (left) and after cessation of activation (right) of the Na+-K+ pump. INa-Ca at +50 mV was normalized to the current before pump activation. Two exponentials were fitted (continuous curves): left, 70.7e-t/99.9+ 29.3; and right, -68.3e-t/118.1+ 98.3. [Na+]o= 145 mM, [Ca2+]o= 0 or 2 mM, [Na+]pip= 50 mM and [Ca2+]pip= 0.3 μM.
Other divalent cations, such as Ca2+ and Mg2+, were also examined. In the presence of 2-5 mM Ca2+, the amplitude of INa-K at 0 mV was 1.19 ± 0.05 pA pF−1 compared with 1.22 ± 0.07 pA pF−1 in the absence of Ca2+ (n= 4, n.s., P > 0.1). In the presence of 0.5-50 mM Mg2+, the amplitude was 1.26 ± 0.11 pA pF−1 compared with 1.27 ± 0.08 pA pF−1 without Mg2+ (n= 6, n.s., P > 0.1). We concluded that Ni2+, Ca2+ and Mg2+ do not affect INa-K from the external side of the membrane.
INa-K was isolated as an external K+-activated current. Therefore the effect of K+ and also the effect of ouabain on Na+-Ca2+ exchange were examined, in experiments shown in Fig. 1B and C. The holding potential was set to -50 mV, which was close to the equilibrium potential of Na+-Ca2+ exchange (ENa-Ca; -44 mV), and ramp pulses were applied every 6 s. The Na+-K+ pump was suppressed by removal of external K+ (Fig. 1B) and by addition of ouabain (Fig. 1C) to avoid overlap with INa-Ca. INa-Ca was isolated as a Ni2+- sensitive current. Ouabain (100-200 μM) and 5.4 mM K+ did not affect the I-V relationship of the Ni2+-sensitive current. The amplitude of INa-Ca at +50 mV in the absence and presence of ouabain was 2.97 ± 0.20 and 3.11 ± 0.27 pA pF−1, respectively (n= 4, n.s., P > 0.1). The amplitude in the absence and presence of both ouabain and K+ was 3.08 ± 0.20 and 3.21 ± 0.18 pA pF−1, respectively (n= 4, n.s., P > 0.1). It was concluded that ouabain and external K+ do not have a significant effect on Na+-Ca2+ exchange. These results are in good agreement with those of Yasui & Kimura (1990) and Noma, Shioya, Paver, Twist & Powell (1991).
Modification of INa-Ca through activation of INa-K
Under whole-cell voltage clamp, [Na+]i should equilibrate with [Na+]pip during inhibition of the Na+-K+ pump, and then activation of the pump should decrease [Na+]i. This change in [Na+]i should be reflected by an alteration of both INa-K and INa-Ca. In the experiment shown in Fig. 2A, outward INa-Ca was evoked every 2 min by a brief application (∼10 s) of 2 mM Ca2+ to the bath in the presence of 0.3 μM Ca2+ (Ca2+pip) and 50 mM Na+ (Na+pip) in the pipette solution. Usually, the amplitude of INa-Ca gradually increased after internal dialysis of the cell was begun. When the amplitude of INa-Ca became stable, INa-K was continuously activated by the addition of 5.4 mM K+ to the external solution. The amplitude of INa-K gradually decreased from its initial peak, most probably due to a decrease in [Na+]i through the pump activity. In agreement with a depletion of [Na+]i, the amplitude of the outward INa-Ca, which exchanges internal Na+ for external Ca2+, also decreased with time. After cessation of activation of the Na+-K+ pump by removal of external K+, the amplitude of INa-Ca recovered to the control level.
A comparison of I-V relationships of INa-Ca, which were obtained by subtraction of the corresponding control current from that recorded in the presence of 2 mM external Ca2+ (Ca2+o) at the times indicated in Fig. 2A, is shown in Fig. 2B. INa-Ca decreased after activation of the pump at all membrane potentials examined, but the reduction was larger at more negative potentials (55 % reduction at +60 mV and 73 % reduction at -60 mV). This voltage-dependent decrease in INa-Ca is similar to the change in the INa-Ca-V relationship induced by decreasing cytoplasmic Na+ in inside-out giant patch recordings (Matsuoka & Hilgemann, 1992).
The time course of decay and recovery of INa-Ca are plotted in Fig. 2C, where the amplitude of outward INa-Ca at +50 mV was normalized to the current before activation of the Na+-K+ pump (n= 4). The current decay and recovery were fitted with single exponential functions with time constants of 100 and 118 s, respectively. It should be noted that the current completely recovered to the control level.
Decay of INa-K and decrease in [Na+]i
To further support the view that the decay of both INa-K and INa-Ca during the activation of the Na+-K+ pump is due to a decrease in [Na+]i, [Na+]pip was increased to a saturating concentration of 100 mM (half-maximal concentration (Kh) = 10 mM; Nakao & Gadsby, 1989). Diffusion of Na+ from the pipette to the cell interior should be able to compensate for the extrusion of Na+ through activity of the Na+-K+ pump. A comparison of INa-K recorded with 100 mM Na+pip with that recorded with the control 20 mM Na+pip in different myocytes is shown in Fig. 3A. To exclude involvement of INa-Ca, Ca2+ was removed, and 5 mM Ni2+ and 0.1 mM EGTA were added to the external solution. As expected, the decay of INa-K observed with 20 mM Na+pip was greatly attenuated by increasing [Na+]pip. The ratio of the current amplitude at 60 s to the initial peak of INa-K is summarized in Fig. 3B. The current decay was significantly attenuated by increasing [Na+]pip from 20 to 100 mM (P < 0.01).
Figure 3. Decay of INa-K and [Na+]pip.
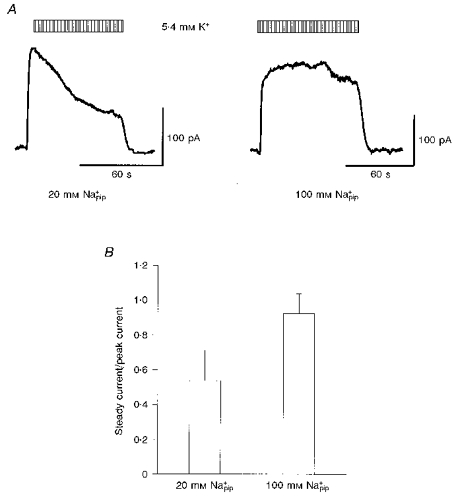
A, typical INa-K induced by external 5.4 mM K+ at 20 and 100 mM Na+pip in different myocytes. Note that the current decay was greatly suppressed by increasing [Na+]pip to 100 mM. B, ratio of INa-K measured at 60 s after the start of the pump activation with 5.4 mM K+ to the peak current recorded soon after pump activation. The ratio was 0.54 ± 0.17 (n= 11) and 0.93 ± 0.11 (n= 8) in the presence of 20 and 100 mM Na+pip, respectively. [Na+]o= 145 mM, [Ca2+]o= 0 mM, [Na+]pip= 20 or 100 mM and [Ca2+]pip= 0 μM.
Vrev of INa-Ca during Na+-K+ pump activation
To obtain more quantitative insight into the dependency of Na+-Ca2+ exchange on the activity of the Na+-K+ pump, changes in Vrev of INa-Ca were measured during activation of the pump. The equilibrium potential, ENa-Ca, was determined from the concentration gradient for both Na+ and Ca2+ according to the following equation for 3Na+ and 1Ca2+ exchange (Ehara et al. 1989; Crespo et al. 1990; Matsuoka & Hilgemann, 1992):
| (1) |
where ENa and ECa are the Nernst equilibrium potentials for Na+ and Ca2+, respectively. In Fig. 4, the INa-Ca-V relationship was measured by applying ramp pulses and INa-Ca was isolated as the 5 mM Ni2+-sensitive current. The Vrev of INa-Ca was -38 mV (-36.2 ± 3.5 mV, n= 5) in the control, which was near to ENa-Ca calculated from the ionic distributions across the membrane (ENa-Ca= -44.3 mV with [Na+]o= 145 mM, [Ca2+]o= 2 mM, [Na+]pip= 20 mM, and [Ca2+]pip= 1 μM). The slope conductance of both outward and inward INa-Ca was decreased by activation of the pump (Fig. 4B). The value of Vrev shifted only by ∼+10 mV near the end of the pump activity, and recovered to the control level within 100 s after cessation of pump activation (Fig. 4C). This shift of the Vrev is consistent with a previous finding that the Na+-Ca2+ exchange current reversed from outward to inward during activation of the Na+-K+ pump (Bielen, Glitsch & Verdonck, 1991).
Figure 4. Vrev of INa-Ca during Na+-K+ pump activation.
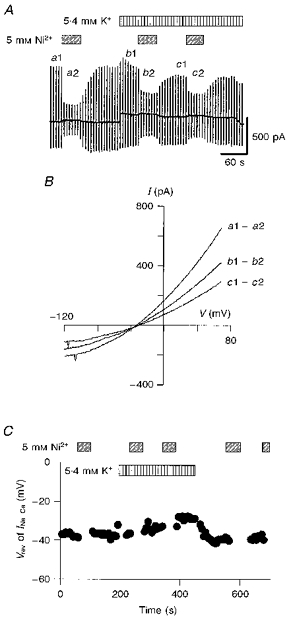
A, chart recording of whole-cell current during the application of Ni2+ and K+. The ramp pulses were applied every 6 s. Ni2+ (5 mM) and K+ (5.4 mM) were added as indicated. B, I-V relationships for the Ni2+-sensitive current were obtained by calculating the difference as shown to the right. Vrev of INa-Ca was determined from the intersection of these I-V curves with the abscissa. C, values of Vrev plotted against time. During the application of Ni2+, the measurement was discontinuous.
The decrease in the outward INa-Ca in Fig. 4B is easily explained by a decrease in [Na+]i due to the pump activation, which can be estimated from the decay of INa-K. In Fig. 4A, the amplitude of INa-K decreased by 35 % from the initial peak to the steady state. According to the dependence of INa-K on [Na+]pip (Nakao & Gadsby, 1989), this decrease in INa-K suggests a decrease in [Na+]i from 20 to about 7 mM. However, the decrease in the inward INa-Ca (Fig. 4B) is contradictory to the increase in the driving force for inward Na+ movement. This discrepancy could be reconciled by assuming a simultaneous decrease in [Ca2+]i beneath the sarcolemma due to Na+-Ca2+ exchange. The Na+-Ca2+ exchange causes redistribution of the ions in a way to bring the value of ENa-Ca close to the holding potential (Noma et al. 1991). Thus, the increase in the driving force for the inward Na+ flux might induce an additional Ca2+ efflux via Na+-Ca2+ exchange during the pump activation, resulting in the depletion of [Ca2+]i and the decrease in the inward INa-Ca even in the presence of 42 mM EGTA in the pipette solution.
According to the above hypothesis, the decrease in [Na+]i during the pump activity should be measured in the absence of Na+-Ca2+ exchange activity. In the experiments shown in Fig. 5A, the exchanger was suppressed by superfusing the myocyte with a 5 mM Ni2+-containing solution prior to the activation of the Na+-K+ pump. The Vrev of INa-Ca was measured only after the cessation of the pump activation, i.e. simultaneous removal of Ni2+ and K+. In the control, the I-V curve recorded during Ni2+ application (curve b in Fig. 5B) crossed at ∼-40 mV with that obtained in the absence of Ni2+ (curve a). The current (curve g in Fig. 5C) recorded during Ni2+ application after washout of K+ was almost identical to that obtained in the control (curve b). Therefore, Vrev of INa-Ca was determined from the intersection between curve g and the other current records (curves c-f). It can be seen that the Vrev of INa-Ca was +55 mV at the end of the pump activation and returned to the control potential with time. Because the major Ca2+ pathways through the membrane, Na+-Ca2+ exchange and the L-type Ca2+ channel, were suppressed by Ni2+ and nicardipine during activation of the pump, [Ca2+]i was assumed to be equal to [Ca2+]pip (1 μM). According to eqn (1), a Vrev of +55 mV gives a [Na+]i of 6 mM.
Figure 5. Shift of Vrev of INa-Ca caused by Na+-K+ pump activation.
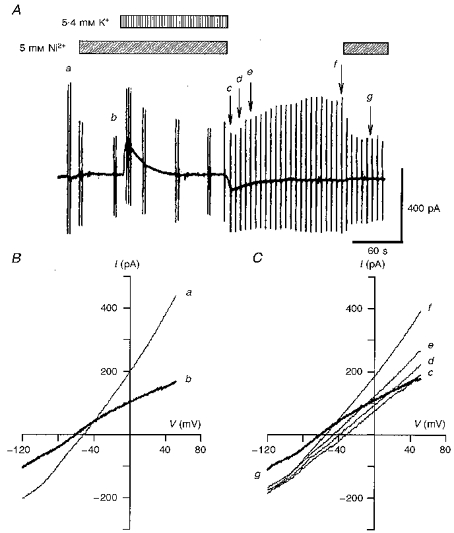
A, chart recording of the whole-cell current during the application of 5.4 mM K+ and 5 mM Ni2+ as indicated. The holding potential was -50 mV and the ionic distributions were the same as in Fig. 4 (ENa-Ca= -44.3 mV with [Na+]o= 145 mM, [Ca2+]o= 2 mM, [Na+]pip= 20 mM and [Ca2+]pip= 1 μM). The second application of Ni2+ was made to confirm the stable background current. B, I-V relationships of the control current in the absence (a) and presence (b) of Ni2+. Vrev of INa-Ca was -40 mV. C, measurement of Vrev of INa-Ca after the cessation of Na+-K+ pump activation. Curves c-g correspond to the points labelled in A.
Since variation in [Na+]i affects both the amplitude and Vrev of INa-Ca, these parameters were plotted in Fig. 6 during the recovery time course after the cessation of pump activation. The amplitude of the Ni2+-sensitive current was measured at +50 mV (filled circles) and at -100 mV (open circles). The gradual increase in the outward INa-Ca together with the negative shift of Vrev supports the view that [Na+]i gradually recovered from the depletion caused by activation of the pump. Na+ was most probably supplied by both diffusion from the pipette solution and the forward mode of Na+-Ca2+ exchange.
Figure 6. Recovery time course of INa-Ca and Vrev.
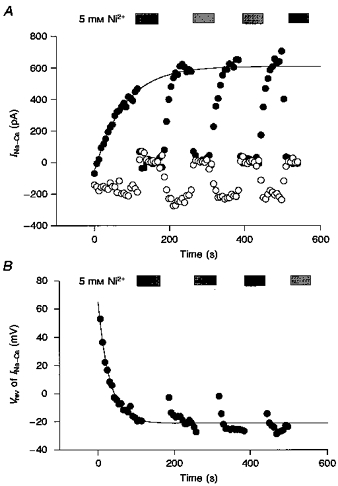
A, the amplitude of Ni2+-sensitive current at +50 mV (filled circles) and -100 mV (open circles) was measured after the cessation of Na+-K+ pump activation (time zero) in the same experiment as shown in Fig. 5. The continuous curve is a fit of an exponential, -664e-t/78.9+ 610, to the current at +50 mV (τ= 78.8 ± 8.2 s, n= 6). B, changes in Vrev of INa-Ca after cessation of Na+-K+ pump activation. The continuous curve is given by 86e-t/29.2 - 21, fitted to the data points (τ= 25.0 ± 8.4 s, n= 6). Periods during which Ni2+ was applied were omitted from the fit.
If it is assumed that the time-dependent current change during the application of K+ and Ni2+ in Fig. 5A was solely due to INa-K, the time integral of INa-K should reflect the Na+ efflux through the pump. If this is the case, the total charge carried by the Na+-K+ pump was 14.7 nC during the application of K+. It might also be assumed that the inward shift of the holding current during the recovery phase of [Na+]i was due to the forward mode of Na+-Ca2+ exchange. The time integral of the inward INa-Ca within 3 min after removal of both K+ and Ni2+ was 4.4 nC. Considering the stoichiometry of 3Na+ : 2K+ of the Na+-K+ pump and 3Na+ : 1Ca2+ of Na+-Ca2+ exchange, the magnitude of the charge should be equally proportional to a Na+ flux. Thus, we estimate that at least 20 % (21.4 ± 8.5 %, n= 7) of Na+ was supplied via Na+-Ca2+ exchange, and that the rest of the Na+ might be supplied from the pipette for re-equilibration after the pump activation. Therefore, the recovery time course may largely reflect diffusion speed of Na+ from the pipette solution.
Relationship between Vrev change and Na+ efflux via pump activation
Under the present experimental conditions, the change in [Na+]i is determined not only by the ionic flux through the exchange mechanisms but also by the effective volume of the intracellular space. To obtain more insight into the effective cell volume, the relationship between changes in Vrev of INa-Ca and Na+ efflux via the Na+-K+ pump was examined by varying the duration of activation of the Na+-K+ pump from 10 to 140 s. The value of Vrev was measured with the same protocol as in Fig. 5A. In Fig. 7A, the maximal change in Vrev (ΔVrev) is plotted against the time integral (Q) of INa-K. ΔVrev was calculated as the difference between the Vrev of INa-Ca immediately after the cessation of the pump activation and that before the pump activation. The magnitude of Q was measured by integrating the outward deviation of the holding current from the current level immediately before the application of 5.4 mM K+. ΔVrev increased in proportion to the increase in Q, but saturated with Q of more than 5.0 nC. This saturation may be caused by a compensatory diffusion of Na+ accelerated by the increased [Na+]i gradient over the distance from the pipette tip to the sarcolemma.
Figure 7. Subsarcolemmal [Na+]i based on Vrev of INa-Ca.
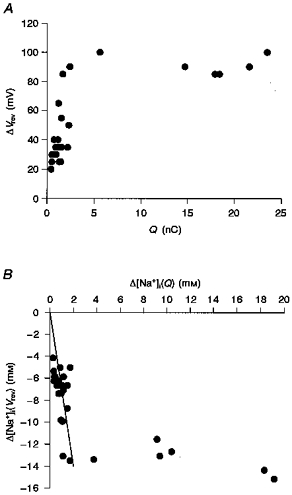
A, relationship between the total charge of INa-K (Q) and ΔVrev of INa-Ca. B, relationship between the decrease in the intracellular mean [Na+] (Δ[Na+]i(Q)) obtained by integrating INa-K and the decrease in [Na+]i (Δ[Na+]i(Vrev)) determined from Vrev of INa-Ca. Over the period of about 40 s activation of the Na+-K+ pump, the relationship between Δ[Na+]i(Q) and Δ[Na+]i(Vrev) was fitted with a linear function (Δ[Na+]i(Vrev) = 7Δ[Na+]i(Q)).
The change in [Na+]i was estimated by two methods. Firstly, it was calculated from the Vrev of INa-Ca based on eqn (1) (Δ[Na+]i(Vrev)). In this calculation, [Ca2+]i was assumed to be equal to [Ca2+]pip (1 μM). This is because the major Ca2+ pathways through the membrane, Na+-Ca2+ exchange and the L-type Ca2+ channel, were suppressed with Ni2+ and nicardipine during activation of the pump (as shown in Fig. 5). Secondly, considering the stoichiometry of 3Na+ : 2K+ of the Na+-K+ pump, the change in [Na+]i (Δ[Na+]i(Q)) was calculated from Q by the equation:
| (2) |
where F is Faraday's constant. The volume (V)of individual cells was calculated from a relationship between input capacitance and cell volume (Satoh, Delbridge, Blatter & Bers, 1996). It should be noted that Δ[Na+]i(Q) reflects the change in mean [Na+]i in the entire cell volume, while Δ[Na+]i(Vrev) reflects the change in subsarcolemmal [Na+]i.
Figure 7B shows the relationship between the magnitude of Δ[Na+]i(Q) and Δ[Na+]i(Vrev). As with the relationship between ΔVrev and Q in Fig. 7A, a linear relationship was observed with relatively small changes in Δ[Na+]i(Q), and Δ[Na+]i(Vrev) saturated with Δ[Na+]i(Q) of more than 2 mM. Within the initial linear range, it should be noted that the value of Δ[Na+]i(Vrev) was roughly seven times larger than that of Δ[Na+]i(Q). This finding can be explained by assuming that Na+ was pumped out from a restricted space within the myocyte (about 14 % of the total cell volume). By sharing this restricted interactive space, the activity of Na+-Ca2+ exchange might be efficiently modulated by Na+-K+ pump activity.
DISCUSSION
The activity of Na+-Ca2+ exchange, a secondary active ion transporter, depends on the Na+-K+ pump, a primary transporter. The mechanism underlying the dependency of Na+-Ca2+ exchange was examined experimentally in the present paper. It was demonstrated that the activation of the Na+-K+ pump shifted Vrev of INa-Ca to a more positive potential (Fig. 5), and thereby accelerated the forward mode of Na+-Ca2+ exchange (pumping out Ca2+), while decelerating the reverse mode (Fig. 2). Subsarcolemmal [Na+]i was calculated from the Vrev of INa-Ca and mean [Na+]i was calculated from both the time integral of INa-K and the cell volume. Comparison of the subsarcolemmal [Na+]i with the mean [Na+]i (Fig. 7B) revealed that the interaction between Na+-Ca2+ exchange and the Na+-K+ pump is effectively performed via the change in [Na+]i in a restricted space which was only 14 % of the total cell volume.
The cardiac myocytes possess a Na+-sensitive background current (Hagiwara, Irisawa, Kasanuki & Hosoda, 1992; Kiyosue, Spindler, Noble & Noble, 1993), which might be partially responsible for the change in [Na+]i primarily caused by activation of the pump in the present study. The decrease in [Na+]i caused by the pump might induce an increase in Na+ influx through the Na+-sensitive background current via an increase in the Na+ concentration gradient. The increase in the Na+ background inward current might overlap with the outward INa-K. If this is the case, the magnitude of real Na+ efflux ([Na+]efflux) is defined by both the charge movement through the pump (QNa-K) and that through the background current (Qbg) as follows:
In the experiment, the recorded Na+ efflux ([Na+]recorded) was obtained from the apparent amplitude of INa-K as:
Therefore:
Since Qbg has a negative sign, [Na+]efflux > [Na+]recorded.
Thus, Δ[Na+]i(Q) obtained from the total charge carried by INa-K (eqn (2)) might be underestimated, and the interactive space obtained from Fig. 7B might be larger than 14 %. However, the contribution of the Na+-sensitive background current was probably small under our experimental conditions. The holding current just after 60-80 s activation of the pump shifted in an inward direction by 12.5 ± 5.1 pA (n= 5) from that before the activation, when the exchanger was suppressed using the protocol in Fig. 1A. This inward shift was only 6.12 ± 1.69 % (n= 5) of the peak INa-K.
In preliminary experiments, the contribution of another Na+ transport mechanism, Na+-H+ exchange, was examined. Na+-H+ exchange was blocked by 10 μM 5-(N-ethyl-N-isopropyl)-amiloride (EIPA) and the experimental protocol in Fig. 5 was performed. There was no significant difference in the shift of Vrev of INa-Ca with or without EIPA (authors' unpublished data).
The interactive space of 14 % cell volume is not identical to the subsarcolemmal restricted space described previously (Mullins & Requena, 1979; Lipp et al. 1990; Osipchuk et al. 1990; Stehno-Bittel & Sturek, 1992; Trafford et al. 1995). Ion concentration change in the subsarcolemmal restricted space is believed to occur with a time constant of several tens to hundreds of milliseconds (for example, see Leblanc & Hume, 1990; Trafford et al. 1995). On the other hand, the [Na+]i change observed in the present study (see Fig. 6) continued over a period of several tens of seconds, indicating that the interactive space is not confined to a narrow space just under the sarcolemma.
To clarify the nature of the interactive space, we simulated [Na+]i change during activation of the Na+-K+ pump in the absence of Na+-Ca2+ exchange. In the computer model (Fig. 8A), a rectangular-shaped myocyte with dimensions of x of 150 μm, y of 40 μm, and z of 7 μm (cell volume, 42 pl) was assumed. For application of Euler's method for integrating changes in [Na+]i, the model cell was divided into small compartments along the z-axis (Fig. 8A and B, top panels)or the x-axis (Fig. 8C, top panel). Na+ flux (fn) and Na+ concentration change (d[Na+]n) after a unit time (dt) in the nth compartment was expressed using Fick's first law of diffusion as follows:
| (3) |
| (4) |
where [Na+]n is the Na+ concentration, Vn is volume and Ip,n is the Na+-K+ pump current of the nth compartment, Sn is the cross-sectional area between compartments n and n+ 1, D is the diffusion coefficient of Na+ in the cytoplasm, and dx is the distance between two compartments. The diffusion coefficient of Na+ used was that for free diffusion (Dfree= 1.33 × 10⁻⁵ cm2 s−1; Robinson & Stokes, 1965) or was modified to fit the experimental data. The amplitude of Ip,n was determined as a function of the surface membrane area of each compartment (Sa,n) and [Na+]n (Nakao & Gadsby, 1989) as follows:
| (5) |
where Ip,max is the maximum current density of the whole-cell INa-K, nH is the Hill coefficient (1.36), and Kh is the half-maximal concentration (10 mM). Our experimental data of INa-K of 0.0091 pA μm−2 with 20 mM Na+pip gives an Ip,max of 0.0126 pA μm−2.
Figure 8. Simulation of [Na+]i during Na+-K+ pump activation (one-dimensional rectangular parallelepiped model).
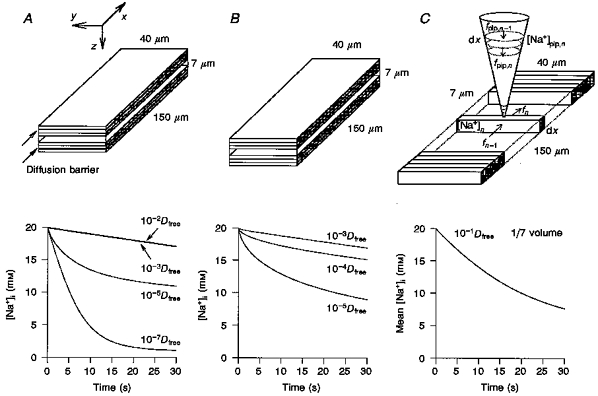
First, we tested whether a simple diffusion of Na+ could explain the experimental finding of the 14 % interactive space. For simplicity only Na+ diffusion along the z-axis was considered, since the Na+ flux of the Na+-K+ pump through both the top and bottom surface membranes is the major source of the perturbation of Na+ distribution. The cell was divided into 100 compartments along the z-axis. No obvious decrease in [Na+]n could be induced by INa-K within 30-60 s, when a cytoplasmic free diffusion of Na+ (Dfree) was assumed (data not shown). This fact indicated the necessity of assuming a retarded diffusion of Na+ within the myocyte. Next, a subsarcolemmal restricted space, ‘fuzzy space’ (LeBlanc & Hume, 1990; Lederer, Niggli & Hadley, 1990; Carmeliet, 1992), was simulated by assuming a diffusion barrier limited in the top and bottom seven compartments (14 % cell volume) underneath the membranes. The magnitude of D was varied from 10−2-10−7Dfree in these compartments, while a value of D of 10−1Dfree was applied in the rest of the cell volume. In Fig. 8A, the decrease in [Na+]n in the top compartment is shown for 30 s after the start of activation of the Na+-K+ pump. The experimental decay of [Na+]i to ∼7 mM was simulated only when D in the top and bottom seven compartments was set below 10−5Dfree.
Alternatively, in Fig. 8B, the retarded diffusion was expanded within the whole cell space. However, even under this condition, the value of D had to be decreased below 10−5Dfree to simulate the time-dependent decrease in [Na+]i. Under this condition, a steep Na+ gradient could be simulated along the z-axis (with a core [Na+]i of ∼17 mM). However, this retarded diffusion of Na+ was not realistic, since the Ca2+ diffusion coefficient was only 25 % of that for free diffusion in cytosolic extracts from Xenopus laevis oocytes, in which intracellular Ca2+ buffers were saturated (Allbritton, Meyer & Stryer, 1992). It should also be noted that the above simulation did not include a supply of Na+ from the whole-cell electrode containing 20 mM Na+. The supply of Na+ from the pipette should further attenuate the decrease in [Na+]i. In conclusion, the simple retarded diffusion along the z-axis cannot explain the experimental decay of [Na+]i.
Page & McCallister (1973) measured the fraction of ventricular cell volume made up of myofibrils (47.6 %), mitochondria (35.8 %), sarcotubules (3.5 %), T-system (1 %) and sarcoplasm (12 %, including nuclei and other structures) based on electron microscopy. These membranous components may constitute a dead space for Na+ diffusion, and the space filled up with myofibrils may retard Na+ diffusion. Such dead space is distributed throughout the entire cell. Thus, in the model calculation in Fig. 8C, the volume of individual compartments was decreased by a factor (fV) of variable magnitude. Furthermore, the dead space may also cause a winding diffusion pathway. This winding diffusion was simulated by decreasing the cross-sectional area (Sn) in eqn (3) in proportion to the volume decrease:
 |
where Veff and Seff are the effective diffusion volume and area of the nth compartment, respectively.
In the simulation in Fig. 8C, a whole-cell pipette was attached at the middle of the cell surface. The dimensions of the pipette were: length, 150 μm; semi-vertical angle, 16 deg; and tip diameter, 1.5 μm. Na+ diffusion along the pipette axis was calculated in the same way as described by eqns (3) and (4). To calculate the diffusion of Na+ from the pipette to the cell interior, the cell was divided into 100 compartments along the x-axis. The integration of [Na+]i was started from an equilibrium concentration of 20 mM at the onset of pump activation, and values of both D and fV were varied until the experimental data were well reconstructed. Values of [Na+]i in each compartment were different from each other, so that an algebraic mean of Na+ concentrations in all compartments was plotted against time. The experimental [Na+]i change was well simulated with values of fV and D of 1/7 and 10−1Dfree, respectively, as shown in Fig. 8C. In Fig. 9, the mean [Na+]i during 60 s pump activation was simulated with values of D of 1, 10−1, 10−2, and 10−3Dfree, and values of fV of 1, 1/7 and 1/35. It was found that the magnitude of fV largely determines the time course of the [Na+]i decrease, and D is responsible for the extent of the [Na+]i decrease within the simulation time. It should be noted that the amplitude of whole-cell INa-K (sum of INa-K in all compartments) changed in parallel with the mean [Na+]i (data not shown). It should also be noted that both the mean [Na+]i and the pump current also hardly decreased with a fV of 1 in this diffusion model along the x-axis.
Figure 9. Effects of varying the effective diffusion volume (Veff) and diffusion coefficient (D) in the model calculation.
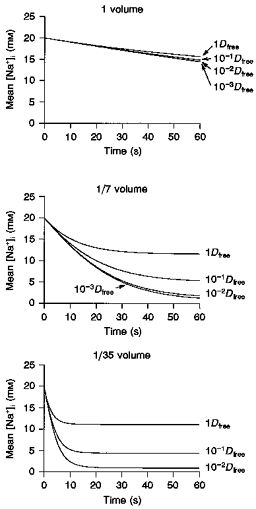
Mean [Na+]i during 60 s pump activation was simulated against time with D of 1, 10−1, 10−2 and 10−3Dfree, and fV of 1 (top), 1/7 (middle) and 1/35 (bottom).
Finally the model shown in Fig. 8C was tested to determine whether it could be used to reconstruct other experimental findings with values of fV and D of 1/7 and 10−1Dfree, respectively. Figure 10A shows a reconstructed whole-cell INa-K superimposed on a typical time-dependent decay of INa-K evoked by 5.4 mM K+. The model also well simulated general experimental findings. A summary of experimental data obtained by changing the duration of activation of the Na+-K+ pump (Figs 5 and 7) is shown in Fig. 10B-D. The time integral of INa-K over various durations of pump activation obtained in twenty-seven experiments was well reproduced in Fig. 10B. The continuous curves in Fig. 10C and D were obtained from the mean [Na+]i. The experimental changes in both the Vrev of INa-Ca and [Na+]i were well reproduced. According to the model, the saturation of Vrev is determined by the balance of the Na+ supply from the pipette and the Na+ efflux through the pump.
Figure 10. Reconstruction of the experimental findings.
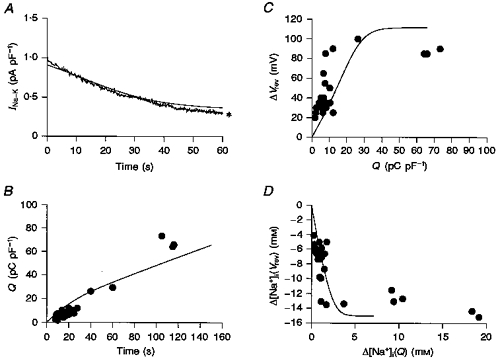
The continuous curves in A-D were calculated using the model with fV of 1/7 and D of 10−1Dfree. A, the trace indicated by an asterisk is the experimental record of INa-K. B, the data points show the time integral of INa-K recorded by varying the period of pump activation in the absence of Na+-Ca2+ exchange activity. The experimental data points in C and D are the same as in Fig. 7.g1
The above simulations suggest that the 14 % interactive space results from a restricted diffusion space, which is distributed throughout the entire cell volume. It was not possible to clarify experimentally localization of the restricted diffusion space, but intracellular organelles may be in part responsible for the diffusion limitation.
Acknowledgments
We thank Professor T. Powell for discussion during his stay in Kyoto University, and Mr M. Fukao for his technical support. This work was supported by Grant-in-Aid for Scientific Research from the Ministry of Education, Science and Culture (to A. N., S. M. and T. B.) and by a Japan Heart Foundation and IBM Japan Research Grant (to S. M.).
References
- Allbritton NL, Meyer T, Stryer L. Range of messenger action of calcium ion and inositol 1,4,5-trisphosphate. Science. 1992;258:1812–1815. doi: 10.1126/science.1465619. [DOI] [PubMed] [Google Scholar]
- Allen DG, Blinks JR. Calcium transients in aequorin-injected frog cardiac muscle. Nature. 1978;273:509–513. doi: 10.1038/273509a0. [DOI] [PubMed] [Google Scholar]
- Barry WH, Hasin Y, Smith TW. Sodium pump inhibition, enhanced calcium influx via sodium-calcium exchange, and positive inotropic response in cultured heart cells. Circulation Research. 1985;56:231–241. doi: 10.1161/01.res.56.2.231. [DOI] [PubMed] [Google Scholar]
- Bers DM, Patton CW, Nuccitelli R. A practical guide to the preparation of Ca2+ buffers. Methods in Cell Biology. 1993;40:3–29. doi: 10.1016/s0091-679x(08)61108-5. [DOI] [PubMed] [Google Scholar]
- Bielen FV, Glitsch HG, Verdonck F. Changes of the subsarcolemmal Na+ concentration in internally perfused cardiac cells. Biochimica et Biophysica Acta. 1991;1065:269–271. doi: 10.1016/0005-2736(91)90239-5. [DOI] [PubMed] [Google Scholar]
- Carmeliet E. A fuzzy subsarcolemmal space for intracellular Na+ in cardiac cells. Cardiovascular Research. 1992;26:433–442. doi: 10.1093/cvr/26.5.433. [DOI] [PubMed] [Google Scholar]
- Crespo LM, Grantham CJ, Cannell MB. Kinetics, stoichiometry and role of the Na-Ca exchange mechanism in isolated cardiac myocytes. Nature. 1990;345:618–621. doi: 10.1038/345618a0. [DOI] [PubMed] [Google Scholar]
- Ehara T, Matsuoka S, Noma A. Measurement of reversal potential of Na+-Ca2+ exchange current in single guinea-pig ventricular cells. The Journal of Physiology. 1989;410:227–249. doi: 10.1113/jphysiol.1989.sp017530. [DOI] [PMC free article] [PubMed] [Google Scholar]
- Hagiwara N, Irisawa H, Kasanuki H, Hosoda S. Background current in sino-atrial node cells of the rabbit heart. The Journal of Physiology. 1992;448:53–72. doi: 10.1113/jphysiol.1992.sp019029. [DOI] [PMC free article] [PubMed] [Google Scholar]
- Isenberg G, Wendt-Gallitelli M-F. X-ray microprobe analysis of sodium concentration reveals large transverse gradients from the sarcolemma to the centre of voltage-clamped guinea-pig ventricular myocytes. The Journal of Physiology. 1990;420:86. P. [Google Scholar]
- Kiyosue T, Spindler AJ, Noble SJ, Noble D. Background inward current in ventricular and atrial cells of the guinea-pig. Proceedings of The Royal Society. 1993;252:65–74. doi: 10.1098/rspb.1993.0047. B. [DOI] [PubMed] [Google Scholar]
- Langer GA. The intrinsic control of myocardial contraction - ionic factors. New England Journal of Medicine. 1971;285:1065–1071. doi: 10.1056/NEJM197111042851910. [DOI] [PubMed] [Google Scholar]
- Leblanc N, Hume JR. Sodium current-induced release of calcium from cardiac sarcoplasmic reticulum. Science. 1990;248:372–376. doi: 10.1126/science.2158146. [DOI] [PubMed] [Google Scholar]
- Lederer WJ, Niggli E, Hadley RW. Sodium- calcium exchange in excitable cells: fuzzy space. Science. 1990;248:283. doi: 10.1126/science.2326638. [DOI] [PubMed] [Google Scholar]
- Lee CO. 200 years of digitalis: the emerging central role of the sodium ion in the control of cardiac force. American Journal of Physiology. 1985;249:C367–378. doi: 10.1152/ajpcell.1985.249.5.C367. [DOI] [PubMed] [Google Scholar]
- Lipp P, Pott L, Callewaert G, Carmeliet E. Simultaneous recording of Indo-1 fluorescence and Na+/Ca2+ exchange current reveals two components of Ca2+-release from sarcoplasmic reticulum of cardiac atrial myocytes. FEBS Letters. 1990;275:181–184. doi: 10.1016/0014-5793(90)81467-3. 10.1016/0014-5793(90)81467-3. [DOI] [PubMed] [Google Scholar]
- Matsuoka S, Hilgemann DW. Steady-state and dynamic properties of cardiac sodium-calcium exchange. Ion and voltage dependencies of the transport cycle. Journal of General Physiology. 1992;100:963–1001. doi: 10.1085/jgp.100.6.963. 10.1085/jgp.100.6.963. [DOI] [PMC free article] [PubMed] [Google Scholar]
- Moore EDW, Etter EF, Philipson KD, Carrington WA, Fogarty KE, Lifshitz LM, Fay FS. Coupling of the Na+/Ca2+ exchanger, Na+/K+ pump and sarcoplasmic reticulum in smooth muscle. Nature. 1993;365:657–660. doi: 10.1038/365657a0. 10.1038/365657a0. [DOI] [PubMed] [Google Scholar]
- Mullins LJ, Requena J. Calcium measurement in the periphery of an axon. Journal of General Physiology. 1979;74:393–413. doi: 10.1085/jgp.74.3.393. 10.1085/jgp.74.3.393. [DOI] [PMC free article] [PubMed] [Google Scholar]
- Nakao M, Gadsby DC. [Na] and [K] dependence of the Na/K pump current-voltage relationship in guinea pig ventricular myocytes. Journal of General Physiology. 1989;94:539–565. doi: 10.1085/jgp.94.3.539. 10.1085/jgp.94.3.539. [DOI] [PMC free article] [PubMed] [Google Scholar]
- Noma A, Shioya T, Paver LFC, Twist VW, Powell T. Cytosolic free Ca2+ during operation of sodium-calcium exchange in guinea-pig heart cells. The Journal of Physiology. 1991;442:257–276. doi: 10.1113/jphysiol.1991.sp018792. [DOI] [PMC free article] [PubMed] [Google Scholar]
- Osipchuk YV, Wakui M, Yule DI, Gallacher DV, Petersen OH. Cytoplasmic Ca2+ oscillations evoked by receptor stimulation, G-protein activation, internal application of inositol triphosphate or Ca2+: simultaneous microfluorimetry and Ca2+ dependent Cl− current recording in single pancreatic acinar cells. EMBO Journal. 1990;9:697–704. doi: 10.1002/j.1460-2075.1990.tb08162.x. [DOI] [PMC free article] [PubMed] [Google Scholar]
- Page E, McCallister LP. Quantitative electron microscopic description of heart muscle cells. American Journal of Cardiology. 1973;31:172–181. doi: 10.1016/0002-9149(73)91030-8. 10.1016/0002-9149(73)91030-8. [DOI] [PubMed] [Google Scholar]
- Powell T, Terrar DA, Twist VW. Electrical properties of individual cells isolated from adult rat ventricular myocardium. The Journal of Physiology. 1980;302:131–153. doi: 10.1113/jphysiol.1980.sp013234. [DOI] [PMC free article] [PubMed] [Google Scholar]
- Robinson RA, Stokes RH. Electrolyte Solutions. London: Butterworths; 1965. p. 571. [Google Scholar]
- Satoh H, Delbridge LMD, Blatter LA, Bers DM. Surface : volume relationship in cardiac myocytes studied with confocal microscopy and membrane capacitance measurements: species-dependence and developmental effects. Biophysical Journal. 1996;70:1494–1504. doi: 10.1016/S0006-3495(96)79711-4. [DOI] [PMC free article] [PubMed] [Google Scholar]
- Stehno-Bittel L, Sturek M. Spontaneous sarcoplasmic reticulum calcium release and extrusion from bovine, not porcine, coronary artery smooth muscle. The Journal of Physiology. 1992;451:49–78. doi: 10.1113/jphysiol.1992.sp019153. [DOI] [PMC free article] [PubMed] [Google Scholar]
- Trafford AW, Díaz ME, O'Neill SC, Eisner DA. Comparison of subsarcolemmal and bulk calcium concentration during spontaneous calcium release in rat ventricular myocytes. The Journal of Physiology. 1995;488:577–586. doi: 10.1113/jphysiol.1995.sp020991. [DOI] [PMC free article] [PubMed] [Google Scholar]
- Wendt-Gallitelli M-F, Voigt T, Isenberg G. Microheterogeneity of subsarcolemmal sodium gradients. Electron probe microanalysis in guinea-pig ventricular myocytes. The Journal of Physiology. 1993;472:33–44. doi: 10.1113/jphysiol.1993.sp019934. [DOI] [PMC free article] [PubMed] [Google Scholar]
- Yasui K, Kimura J. Is potassium co-transported by the cardiac Na-Ca exchange. Pflügers Archiv. 1990;415:513–515. doi: 10.1007/BF00373636. [DOI] [PubMed] [Google Scholar]