

Abstract
Following an intracellular alkali load (imposed by acetate prepulsing in CO2/HCO3− buffer), intracellular pH (pHi) of the guinea-pig ventricular myocyte (recorded from intracellular SNARF fluorescence) recovers to control levels. Recovery has two phases. An initial rapid phase (lasting up to 2 min) is followed by a later slow phase (several minutes). Inhibition of sarcolemmal acid-loading carriers (by removal of extracellular Cl−) inhibits the later, slow phase but the initial rapid recovery phase persists. It also persists in the absence of extracellular Na+ and in the presence of the HCO3− transport inhibitor DIDS (4,4-di-isothiocyanatostilbene-2,2-disulphonic acid).
The rapid recovery phase is not evident if the alkali load has been induced by reducing PCO2 (from 10 to 5 %), and it is inhibited in the absence of CO2/HCO3− buffer (i.e. Hepes buffer). It is also slowed by the carbonic anhydrase (CA) inhibitor acetazolamide (ATZ). We conclude that it is caused by buffering of the alkali load through the hydration of intracellular CO2 (CO2-dependent buffering).
The time course of rapid recovery is consistent with an intracellular CO2 hydration rate constant (k1) of 0.36 s−1 in the presence of CA activity, and 0.14 s−1 in the absence of CA activity. This latter k1 value matches the literature value for uncatalysed CO2 hydration in free solution. Natural CO2 hydration is accelerated 2.6-fold in the ventricular myocyte by endogenous CA.
The rapid recovery phase represents a period when the intracellular CO2/HCO3− buffer is out of equilibrium (OOE). Modelling of the recovery phase using our k1 value, indicates that OOE conditions will normally extend for at least 2 min following a step rise in pHi (at constant PCO2). If CA is inactive, this period can be as long as 5 min. During normal pHi regulation, the recovery rate during these periods cannot be used as a measure of sarcolemmal acid loading since it is a mixture of slow CO2-dependent buffering and transmembrane acid loading. The implication of this finding for quantification of pHi regulation during alkalosis is discussed.
Intracellular H+ buffering is an essential component of pHi regulation. Intrinsic buffer moieties on cytoplasmic proteins comprise one source of buffering power (βi) but in cardiac cells, as in many other cell types (Roos & Boron, 1981), a significant, additional buffering component is due to the CO2/HCO3− system (βCO2). One important requirement for optimal buffering by the CO2/HCO3− system is that dissolved CO2 should be at equilibrium with HCO3− and H+ ions. During changes of pHi, this condition applies only if the kinetics of equilibration are sufficiently fast. An important step here is the hydration of CO2 to produce carbonic acid (that then dissociates essentially instantaneously into H+ and HCO3−). CO2 hydration is slow in free solution, with a time constant of several seconds (Swenson & Maren, 1978; Forster, 1991).
While some cells express a high activity of carbonic anhydrase (CA), an enzyme which catalyses CO2 hydration, cardiac cells are notable for possessing little of the enzyme (Geers & Gros, 1991; Bruns & Gros, 1992). This raises the possibility that, during rapid pHi transients in heart, intracellular CO2-dependent buffering capacity will be considerably attenuated if the CO2/HCO3− system cannot equilibrate fast enough. The extent to which such out-of-equilibrium conditions occur during pHi regulation in the heart is not known.
In the present work we have investigated the kinetics of re-equilibration of the CO2/HCO3− system in the guinea-pig ventricular myocyte following an alkaline displacement of resting pHi. The pHi, monitored with carboxy SNARF-1, was displaced from its control level by reducing PCO2 in the superfusate or by using the acetate prepulse technique. We find that, depending on experimental conditions, CO2 can be out of equilibrium with H+ and HCO3− for several minutes following a step rise of pHi. We discuss the effects of this on intracellular buffering power, and we consider the consequences for calculating membrane acid transport rate from pHi transients in the cardiomyocyte.
A preliminary report of this work has been published (Leem & Vaughan-Jones, 1996).
METHODS
Isolation of guinea-pig ventricular myocytes
The composition of solutions used for cell isolation and the details of the procedure have been described previously (Lagadic-Gossmann, Buckler & Vaughan-Jones, 1992). Briefly, single ventricular myocytes were isolated from albino guinea-pigs (killed by cervical dislocation) weighing 350-450 g, using a combination of enzymatic and mechanical dispersion (0.7 mg ml−1 collagenase, Boehringer Mannheim and 0.04 mg ml−1 protease, Sigma). The cells were finally suspended in Hepes-buffered Dulbecco's modified Eagle's medium and left at room temperature (18-21°C) until use. Only myocytes displaying a rod shape and calcium tolerance were used in the study.
Measurement of intracellular pH
SNARF loading and calibration
The pHi was measured by using AM (acetoxy-methyl ester)-loaded carboxy-SNARF-1, a dual-emission, pH-sensitive fluorophore. Full details of dye loading plus pHi measurement and dye signal calibration have been given previously (e.g. Buckler & Vaughan-Jones, 1990; Sun, Leem & Vaughan-Jones, 1996). Briefly, isolated cells were loaded for 7 min at room temperature with 10 μM carboxy-SNARF-1 AM ester. SNARF fluorescence from individual cells was excited at 540 ± 12 nm and measured simultaneously at 590 ± 5 and 640 ± 5 nm, with an inverted microscope (Nikon Diaphot) converted for epifluorescence. The signals were then digitized at 0.5 kHz (CED 1401 Plus). The emission ratio was calculated and converted to a pH value using the pH ratiometric fluorescence equation (Grynkiewicz, Poenie & Tsien, 1985; Buckler & Vaughan-Jones, 1990; Sun et al. 1996). This calculation requires knowledge of ‘default’ pH calibration data for intracellular SNARF, obtained in situ for individual cells and averaged for more than ten cells from at least three animals. These default data were obtained with the nigericin (10 μM) calibration technique (see Sun et al. 1996, for details of calibration solutions). The default values were determined routinely once a month, and were for the terms Rmax (maximum emission ratio at pH 5.5); Rmin (minimum ratio at pH 9.5), and F640,max/min (9.5/5.5 pH fluorescence ratio measured at 640 nm). Typical values were 1.556, 0.129 and 2.049, respectively. These predict a pKa for intracellular SNARF of 7.365. Default data were used in place of performing a nigericin calibration after every experiment, in order to reduce potential contamination of the cell superfusion system with nigericin (Richmond & Vaughan-Jones, 1997). The accuracy of the in situ calibration was cross-checked regularly during experiments, by using the weak acid-base (propionate-trimethylamine) null-point technique (Eisner, Kenning, O'Neill, Pocock, Richards & Valdeolmillos, 1989; see Buckler & Vaughan-Jones, 1990, for details of experimental procedure). An acceptable cross-check was one where pHi of a myocyte determined by the null point and default data methods agreed to within 0.1 pH units (more usually agreement was within 0.05).
Cleaning the superfusion apparatus
Care was taken to clean this thoroughly after a nigericin calibration. The superfusion lines were replaced. The superfusion chamber and switcher tap (see Richmond & Vaughan-Jones, 1997, for details of superfusion) were dismantled and soaked in ethanol for several hours, followed by a soak for at least 12 h in a 20 % solution of Decon 75 (Decon Laboratories Ltd, Sussex, UK), followed by simmering in deionized water for several hours.
Solutions
Hepes-buffered Tyrode solution
This contained (mM): 135 NaCl, 4.5 KCl, 1 MgCl2, 2 CaCl2, 11 glucose and 20 Hepes (pKa= 7.5). For Na+-free Tyrode solution, Na+ was replaced by 145 mM N-methyl-D-glucamine (NMDG). Cl−-free Tyrode solution contained (mM): 140 sodium gluconate, 4.5 potassium gluconate, 4 calcium gluconate, 2 magnesium gluconate, 11 glucose and 20 Hepes. Na+-free, Cl−-free Tyrode solution contained (mM): 145 NMDG, 4.5 potassium gluconate, 2 magnesium gluconate, 11 glucose and 20 Hepes. When acetate was added to solutions, an equimolar amount of anion (either Cl− or gluconate) was omitted. The pH of all solutions was adjusted to 7.4 at 37°C using 4 n NaOH, except for Na+-free Tyrode solution which was adjusted with 5 n HCl, and Cl−-free, Na+-free Tyrode solution which was adjusted using glucuronic acid.
CO2/HCO3−-buffered Tyrode solution
Solutions were saturated with 5 % CO2-95 % O2 (or 95 % air). The basic solution contained (mM): 120 NaCl, 4.5 KCl, 1 MgCl2, 2 CaCl2, 11 glucose and 22 NaHCO3. For Na+-free Tyrode solution, NaCl and NaHCO3 were replaced isosmotically by NMDG and the pH of the CO2-saturated solution adjusted to 7.4 at 37°C with HCl. The Cl−-free Tyrode solution contained (mM): 120 sodium gluconate, 4.5 potassium gluconate, 4 calcium gluconate, 1 magnesium gluconate and 11 glucose; pH adjusted to 7.4 at 37°C with NaHCO3. For Na+-free Cl−-free Tyrode solution, 140 mM NMDG replaced the NaCl and NaHCO3, and the pH of the CO2-saturated solution was adjusted to 7.4 at 37°C with glucuronic acid.
Acetazolamide (ATZ) was made up as a 10 mM stock solution in DMSO (dimethyl sulphoxide) at the beginning of an experiment and diluted in Tyrode solution to a final concentration of 10-100 μM.
All chemicals were from Sigma except for carboxy SNARF-1 AM (Molecular Probes Inc).
The apparent pKa of CO2/HCO3−
As the apparent pKa for CO2  HCO3− is used in many calculations in the present paper, we determined it empirically by titrating 0.5 l of Tyrode salt solution (see Solutions above, for recipe) with NaHCO3 in the range 0-32 mM (added as the solid to the Tyrode solution in aliquots to raise the concentration by 4 mM for each addition). Although standard values for pKa are quoted in the literature, there is considerable variability regarding the bicarbonate concentration reported to titrate the pH of a 5 % CO2-equilibrated isotonic salt solution to a value of 7.40 (cf. Putnam & Roos, 1991), even when allowance is made for variation in altitude (which affects PCO2). As outlined below we have identified one of the possible causes of this. Tyrode solution was saturated at 37°C with 5 % CO2-95 % O2. The precise CO2 content of the gas mixture was determined by mass spectrometry (Airspec 3000). The solution was held within a glass beaker covered by aluminium foil to prevent solution evaporation. The new steady-state pH was recorded (Corning pH meter 150, with separate pH electrode and flowing 3 M KCl reference electrode) 7 min after each addition. Each pH value was used to calculate apparent pKa from the Henderson-Hasselbalch equation:
where α is the CO2 solubility coefficient (0.03253 mM mmHg−1). Successive pKa values decreased slightly. As cumulative additions of NaHCO3 raise the solution ionic strength, we plotted apparent pKaversus ionic strength as shown in Fig. 1. As expected, apparent pKa decreased with increasing ionic strength (Putnam & Roos, 1991), conforming to the best-fit linear expression (within the range 0.125-0.17):
where I is the solution ionic strength. This relationship predicts that, for normal cardiac Tyrode solution (I= 0.16 M), pKa= 6.148.
Figure 1. Experimental determination of pKa of Tyrode solution.
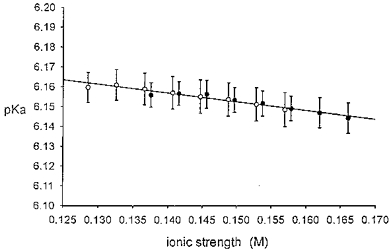
Tyrode solution saturated with 5 % CO2-95 % O2 was titrated with NaHCO3 (4 mM aliquots) at 37 °C, and steady-state pH was measured. Each pH value was used to compute apparent pKa from the Henderson-Hasselbalch equation (see text for details). This value is then plotted versus computed solution ionic strength. •, normal CO2-buffered Tyrode solution composition except for the varied [HCO3−]. ○, as above, but without divalent cation salts CaCl2 and MgCl2. See ‘Solutions’ in Methods for Tyrode solution composition. Line fitted by least-squares linear regression; n= 10 for all samples. No significant difference between • and ○, P > 0.05. Normal Tyrode solution containing 22 mM HCO3−, pH 7.40, has an ionic strength of 0.16 M, at which the graph indicates a pKa of 6.15.
It may seem puzzling that our experimentally determined pKa (≈ 6.15) is higher than the more classical value of 6.118 (e.g. Putnam & Roos, 1991). The knock-on effect is that the bicarbonate concentration required in practice for a solution pH of 7.40 (5 % CO2) is 22 mM, lower than the theoretically assumed value of 24 mM, or more accurately 23.55 mM, for standard physiological salt solution (Putnam & Roos, 1991). These latter values, however, are not strictly applicable in the present experimental situation. The atmosphere above the bubbled solution will have been fully saturated with water vapour, especially since bubbling was vigorous and the beaker covered with metal foil. Saturated water vapour pressure (VP) makes a contribution to atmospheric pressure of 0.0619 atm at 37°C (Lentner, 1984) which therefore reduces PCO2 dissolved in Tyrode solution to a value lower than that in the bottled dry gas mixture used to equilibrate the solutions. Failure to compensate for this reduction produces an apparent rise in the estimated value of pKa. We calculate that correcting for the effect of VP on PCO2 reduces the experimentally determined pKa from 6.148 to 6.120, a value very close to that reported previously (6.118; Putnam & Roos, 1991). When using our experimental recordings of pHi to calculate the intracellular CO2 hydration rate constant (k1; see Results and Appendix), we have therefore employed a value for [CO2] (CO2 concentration in solution) corrected for the effects of VP, and we have employed a pKa value of 6.12. The [CO2] was calculated as follows:
| (1) |
where α is the CO2 solubility coefficient (expressed as 0.02472 M atm−1), A is atmospheric pressure, and %CO2 is the percentage CO2 in the cylinder used for solution gassing (dry gas mixture).
Calculation of acid loading
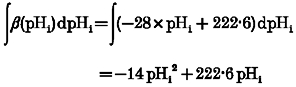
Details are given in the Appendix. The product of -dpHi/dt and β (intracellular buffering power) gives net acid loading. The value selected for β depends on intrinsic (non-CO2) buffering (βi) and (where appropriate) CO2-dependent buffering (βCO2). The former value is estimated using the empirical equation of Lagadic-Gossmann et al. 1992: βi= -28pHi+ 222.6. The latter value is estimated as βCO2= 2.3[HCO3−]i= 2.3[HCO3−]o× 10(pHi-pHo). It is important to realise that this latter equation assumes CO2/HCO3− buffer equilibrium and therefore will not be applicable for those out-of-equilibrium periods described in the present work. The latter equation also assumes equality of pKa for CO2/HCO3− and equality of CO2 solubility and CO2 concentration on both sides of the sarcolemma.
Rates of change of pHi (dpHi/dt) from an intracellular alkali load (e.g. Fig. 2) were obtained by computer from the first time differential of the best-fit polynomial equation (Sigmaplot, Jandel Corp.) to the experimental data points sampled at 0.5 s intervals. The computer fit was confirmed by a P value > 0.99, obtained from Student's paired t test.
Figure 2. Two-phase recovery of pHi from an acetate prepulse.
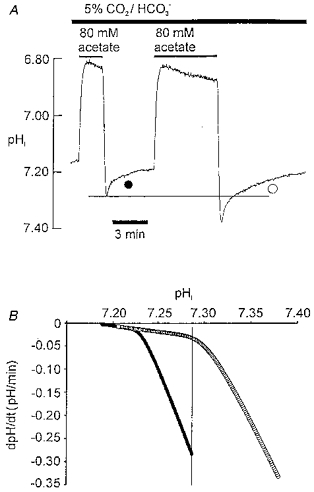
A, ratiometric SNARF recording of pHi in isolated ventricular myocyte bathed in 5 % CO2-22 mM HCO3−-buffered Tyrode solution. Bars above trace show period of superfusion of acetate. Acetate removal induces intracellular alkalosis. B, recovery rate from alkali load is plotted versus pHi. Recovery rate at a given pHi was estimated from the first differential (dpHi/dt) of the polynomial equation for best fit (SigmaPlot) to the pHi trace shown during the two recovery periods in Fig. 1A (difference not significant between best-fit curve and original data: P > 0.9999, paired t test; estimates made at 0.5 s intervals). Filled and open circles refer to the pHi recoveries illustrated in A. Vertical line in B defines a common pHi of 7.28, which is also defined by the horizontal line in A.
All statistical data were expressed as means ±s.e.m.
RESULTS
Fast and slow recovery from alkalosis
Figure 2A illustrates the imposition of two intracellular alkali loads, using the acetate prepulse technique (Roos & Boron, 1981). The size of the alkali load was adjusted by varying the exposure time to acetate. The superfusate was buffered to pHo 7.40 with CO2/HCO3−. Each alkali load was followed by pHi recovery. The time course of this was examined by plotting recovery rate as a function of pHi, as shown in Fig. 2B. For both plots there were two phases of recovery, the initial phase being distinctly faster. This is evident from the slope of the plots which show a clear division into two regions with a steeper slope occurring at the higher pHi. Note, however, that recovery rate in the two cases was not a unique function of pHi, since the plots are not superimposed. For example, at pHi 7.28 (vertical line in Fig. 2B; horizontal line in Fig. 2A), recovery from the small alkali load was over 10-fold faster than that from the large alkali load.
Although the plots in Fig. 2B are not superimposed, it is notable that they are nearly identical in shape, suggesting that similar recovery mechanisms may be involved. There is also a final region of overlap where the shallower slope of both plots coincide (pHi range, 7.021-7.230). In this limited range, rate is related uniquely to pHi. Overall, the analysis suggests that while a pHi-independent mechanism may govern the initial rapid recovery, a pHi-dependent mechanism may govern the later, slow phase.
A similar two-phase recovery was clearly seen in three other experiments subjected to the same graphical analysis as in Fig. 2. The initial rapid phase is investigated in the present work and shown to be due principally to intracellular H+ buffering via the CO2/HCO3− system, while the later, slow phase is explored in the following paper (Leem & Vaughan-Jones, 1998) and shown to be caused by activation at high pHi of sarcolemmal acid-influx carriers.
Rapid recovery is dependent on CO2/HCO3−
The membrane transporters for acid influx are inhibited by removal of extracellular Cl− (Sun et al. 1996; Leem & Vaughan-Jones, 1998). The experiments shown in Fig. 3 were performed in Cl−-free solution (Cl− replaced by gluconate). Under these conditions, an acetate prepulse in Hepes-buffered solution (nominally free of CO2/HCO3−) promptly produced an alkali load with no subsequent recovery (Fig. 3A; n= 11). Even in Cl−-containing, Hepes-buffered solutions, a rapid recovery phase was not observed, an intracellular alkali load being followed only by a slow phase of pHi recovery taking several minutes to reach completion (not shown, but see Figs 1A, 2A and B, 3, 5A and 6A of the accompanying paper, Leem & Vaughan-Jones, 1998). In contrast, in the presence of CO2/HCO3−-buffered solution (Fig. 3B; n= 17), an intracellular alkalosis was followed by an initial rapid recovery (similar to the rapid phase seen previously in Fig. 2) but this was incomplete, leaving a sustained alkali load and no later, slow recovery (see also Fig. 4A of Leem & Vaughan-Jones, 1998). A similar result was seen in CO2/HCO3− buffer when a propionate prepulse (80 mM) was used instead of acetate (n= 6, not shown). Comparison of Fig. 3A and B therefore shows that the rapid phase is abolished in CO2-free conditions and is Cl−o independent. Furthermore, the rapid phase persisted after complete Na+o removal (Na+ replaced by NMDG+; n= 5), and after elevation of K+o (from 4.5 to 144.5 mM; equivalent replacement of Na+ by K+; n= 3). The rapid phase is therefore CO2/HCO3− dependent but is unlikely to be caused by sarcolemmal ion transport.
Figure 3. Rapid recovery phase is abolished in Hepes buffer and absent during respiratory alkalosis.

All solutions Cl− free (replaced by gluconate). A, sample acetate prepulse in Hepes buffer. Note lack of recovery from alkali load; pHo 7.40. B, sample acetate prepulse in CO2/HCO3− buffer; pHo 7.40. Note the rapid partial pHi recovery. C, alkalosis induced by reducing PCO2 (as shown in bar above trace) from 10 to 5 % (gas mixture balanced with air); [HCO3−]o reduced simultaneously from 44 to 22 mM to maintain constant pHo. Note lack of pHi recovery from alkalosis.
Figure 5. Measuring the rate constant for intracellular CO2 hydration, k1.
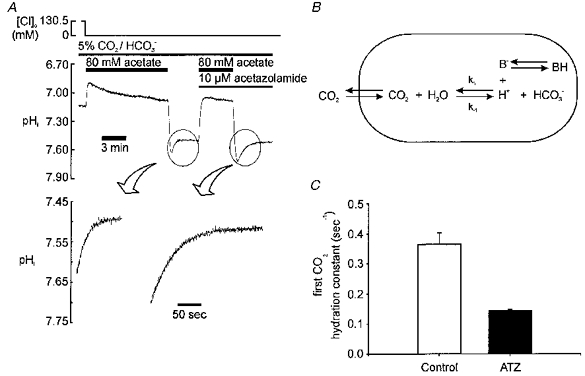
A, upper panel: sample experiment showing acetate prepulse with and without ATZ; lower panel: amplified sections of trace showing recovery phase with and without ATZ; continuous lines are fitted using the estimated value for k1, as described in the text and Appendix; correlation coefficient > 0.9999 (Student's paired t test). B, diagram of scheme assumed when calculating k1. CO2 has rapid access across sarcolemma. Hydration generates H+, most of which is buffered instantaneously by intrinsic buffers in the cell (B). C, histogram showing mean value of k1 derived from experiments like that shown in A, in absence (control) and presence of 10 μM ATZ.
Figure 6. Computational model of alkali loading and subsequent pHi response.

The experimentally derived value of k1 was used in calculations when a CO2/HCO3− buffer system was assumed to be present. In all simulations, sarcolemmal acid-equivalent carriers were assumed to be inactive. The results of the simulations should be compared with the experimental results shown in Fig. 3. Calculation details are given in the text and in the Appendix. A, the left-hand panel shows a simulated acetate prepulse in Hepes buffer. Note the rapid, monotonic alkalosis; this result should be compared with the experimental result shown in Fig. 3A. The right-hand panel shows a simulated respiratory alkalosis in CO2/HCO3− buffer. The simulation is for a reduction of ambient PCO2 from 10 to 5 %, as shown in the bar above the trace. Note the monotonic rise of pHi (with no subsequent recovery). This simulation should be compared with the experimental result shown in Fig. 3C.B, simulations of an acetate prepulse in CO2/HCO3− buffer. ▪, k1 set to 0.365 s−1 (this is the control value of k1 taken from Fig. 5C); the simulation should be compared with the experimental result shown in Fig. 3B.•, k1= 7.3 s−1 (i.e. 20 × control k1). ♦, k1= 0.144 s−1 (this is the value of k1 measured in the presence of ATZ (taken from Fig. 5C); it is equivalent to a zero level of intracellular CA activity). Note that removing CA activity in the model increases peak pHi and slows the subsequent pHi recovery, as found experimentally in Fig. 4A.
Figure 4. Rapid recovery is slowed by acetazolamide.
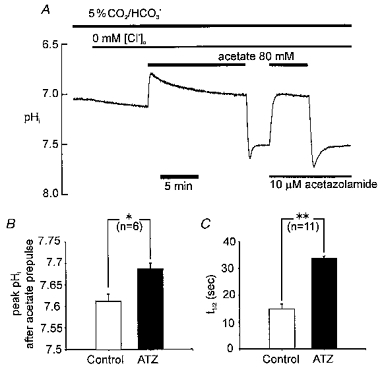
A, pHi recording showing experimental protocol. Cl−o was removed (replaced by gluconate) at the beginning of the recording (indicated by bar above trace) in order to inhibit Cl−o-dependent acid loading transporters. Note that pHi slowly rises as Cl− leaves the cell in exchange for HCO3− and OH−. B, histogram showing peak pHi following 80 mM acetate removal in Cl−-free solution in absence (control) and presence of 10 μM acetazolamide (ATZ) C, histogram showing time for 50 % recovery from peak pHi in absence (control) and presence of ATZ. * Significant difference, P < 0.05; ** significant difference, P < 0.001.
Rapid recovery is due to CO2 hydration
A clue to the mechanism underlying the rapid phase is given in Fig. 4A that shows it is slowed considerably by acetazolamide (ATZ), a carbonic anhydrase (CA) inhibitor. The drug increases peak pHi following acetate removal (Fig. 4B), and it increases the half-time of subsequent pHi recovery 2.6-fold (Fig. 4C).
Since CA catalyses CO2 hydration, the above observation suggests that the hydration step may be involved in pHi recovery. Consistent with this idea, the stilbene drug DIDS (0.1-0.5 mM), which inhibits HCO3−-dependent acid influx in the cardiac cell (Vaughan-Jones, 1982), had no inhibitory effect (n= 7; see also Fig. 5 of Leem & Vaughan-Jones, 1998).
A further clue to the rapid phase is that it is not observed when an alkali load is imposed by reducing PCO2 as illustrated in Fig. 3C (n= 17). Once again Cl−o was absent in order to inhibit the sarcolemmal acid loaders. PCO2 was stepped from 10 to 5 % (extracellular pH, 7.4 throughout). CO2 readily leaves the cell under these conditions producing the alkali load, but there was no subsequent recovery. In CO2/HCO3−-buffered conditions, the rapid recovery phase therefore occurs after a simulated metabolic alkalosis (i.e. a pHi rise at constant PCO2), but not after a respiratory alkalosis (i.e. a pHi rise by PCO2 reduction).
The foregoing observations indicate a role for the intracellular CO2/HCO3− buffer system. This can be illustrated with reference to the reaction sequence for hydration of CO2:
Since the dissociation of carbonic acid to H+ and HCO3− is almost instantaneous, this can be reduced to a single-step reaction:
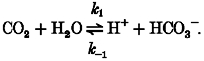 |
(2) |
An acetate prepulse at constant PCO2 (as in Fig. 3B) reduces intracellular H+ concentration. The above reaction (eqn (2)) will therefore be shifted to the right, tending to restore [H+]i. In free solution, the rate-limiting step for the forward reaction is the CO2 hydration step (k1). Given that this uncatalysed rate is slow (Swenson & Maren, 1978; Forster, 1991) and that CA activity in heart is low (Bruns & Gros, 1992), the initial recovery of pHi is consistent with H+i regeneration through the forward reaction. The fact that pHi recovery is slowed by ATZ (Fig. 4) supports this hypothesis.
When PCO2 is reduced (as in Fig. 3C), then the equilibrium condition for eqn (2) is shifted to the left as CO2 leaves the cell. Assuming that CO2 diffusion across the sarcolemma is not rate limiting (see Discussion), the speed of the reaction will be governed by k-1 (eqn (2)). In this case, the rate of reduction of [H+]i is limited by the rate of formation of CO2 and, irrespective of the speed of the reverse reaction (k-1, eqn (2)), the change of pHi must be monotonic, as observed experimentally (Fig. 3C).
In summary, results of experiments where the reaction described in eqn (2) is driven forwards or backwards (metabolic and respiratory alkalosis, respectively) support the hypothesis that the rapid recovery phase from metabolic alkalosis is an H+i-buffering reaction, the kinetics of which describe the intracellular hydration of CO2.
The intracellular CO2 hydration rate constant
The rate of pHi recovery after an acetate prepulse was used to estimate the apparent rate constant for CO2 hydration (k1 of eqn (2)). The scheme illustrated in Fig. 5B indicates that intracellular H+ ions arising from CO2 hydration will interact with intrinsic buffers of the cell (βi). In the absence of membrane transport, the product (βi× dpHi/dt) defines the CO2 hydration rate at a given pHi, and k1 can be calculated from this. Details of the method are given in the Appendix. The lower panels of Fig. 5A show specimen experimental records taken from pHi recoveries (upper panel of Fig. 5A) with and without the CA inhibitor acetazolamide (ATZ). The continuous line drawn through these recoveries shows the best fit for the rate constant (k1) determination. The values of k1, determined from several such experiments, are averaged in Fig. 5C. This shows that k1 was reduced 2.5-fold in the presence of 10 μM ATZ. A similar inhibition was seen with 100 μM ATZ (n= 2; not shown) indicating that the lower dose (10 μM) was likely to have been supramaximal. The absolute values for k1 are considered in the Discussion.
Simulation of fast pHi recovery
We find that the average values of k1 (Fig. 5C) can be used successfully to model the pHi changes associated with alkali loading under the variety of conditions encountered in the present work. Details of these calculations are given in the Appendix.
Figure 6 shows results of the simulations. As expected, the model predicts the fast but incomplete pHi recovery following acetate prepulsing in CO2/HCO3−-buffered conditions (Fig. 6B, ▪). Such recovery is not seen when the model is run in Hepes-buffered conditions (Fig. 6A), or when k1 is set to a value twenty times higher than normal (Fig. 6B, •). This latter prediction occurs because the much faster hydration rate ensures that, during the initial alkali-loading phase, intracellular CO2 remains essentially at equilibrium with intracellular H+ and HCO3−. Conversely, setting k1 to the value measured in the presence of ATZ (Fig. 5C), slows pHi recovery as shown in Fig. 6B (♦; cf. the experimental result shown in Fig. 4). Finally, the model successfully predicts that, on reducing PCO2 from 10 to 5 %, there is a monotonic rise of pHi, with no subsequent recovery phase (Fig. 6A; cf. experimental record of Fig. 3C). The above simulations therefore show that a relatively slow rate of CO2 hydration can lead to pHi recovery transients that might otherwise be ascribed to membrane transport processes.
Estimating the out-of-equilibrium period during intracellular alkali regulation
We have used our computational model to estimate the time period for the out-of-equilibrium state of the CO2/HCO3− buffer during pHi recovery from alkalosis, under conditions where sarcolemmal acid loaders are also functional. This approximates to the physiological condition. The pHi recovery will be a mixture of CO2-dependent buffering and carrier-mediated H+ equivalent influx. Figure 7 shows a simulation where, for simplicity, the alkali load (acetate prepulse) was imposed simultaneously with a step activation of sarcolemmal HCO3− ion efflux from 0 to 1.3 mM min−1 and a similar step activation of sarcolemmal OH− efflux from 0 to 0.5 mM (equivalent to a combined acid-equivalent influx of 1.8 mM min−1, as shown in the top trace in Fig. 7). This combined value is taken from Fig. 7B of Leem & Vaughan-Jones (1998), where a total acid-loading influx of 1.8 mM min−1 comprising the same AE : CHE ratio, was estimated experimentally at pHi 7.3 in CO2/HCO3− buffer. The combined activation of HCO3− and OH− ion efflux modelled in the present Fig. 7 therefore approximates the activation of sarcolemmal Cl−-HCO3− and Cl−-OH− exchange at high pHi. The predicted pHi recovery under these conditions (▪ in bottom panel) consists of two phases, an initial fast (mainly CO2 buffering) phase and then a secondary slow (acid-influx activity) phase, similar to that observed experimentally. The middle panel of Fig. 7 shows the apparent combined acid-equivalent influx (JH) computed from the modelled pHi recovery rate (assuming buffer equilibrium). As described in the legend, assuming instant intrinsic buffering, this equals the real sarcolemmal acid-equivalent influx set in the model (1.8 mM min−1) only when the CO2/HCO3− buffer is at equilibrium. Immediately after imposing the alkali load, apparent JH is >> 1.8 mM min−1, indicating out-of-equilibrium buffer conditions. As the CO2-dependent buffering phase nears equilibrium, apparent JH decreases monotonically towards a final value of 1.8 mM min−1. Thereafter, the CO2/HCO3− buffer remains at equilibrium and all pHi recovery is due solely to acid-influx activity.
Figure 7. Modelling the out-of-equilibrium period for CO2/HCO3− buffer during alkali regulation.

Top trace (JH) indicates that sarcolemmal acid-equivalent loading (in the form of a combined bicarbonate and hydroxyl ion efflux, thus simulating simultaneous activation of AE and CHE) is switched on instantaneously in the model at the moment of acetate removal (shown by bar above bottom trace). Bottom trace shows the predicted time course of pHi during alkali loading and subsequent recovery, for cases where the k1 selected in the model equals the experimentally measured control value for k1 (from Fig. 5C; ▪); the k1 value determined in ATZ (from Fig. 5C; ♦), and 20 × control k1 (•). Middle trace (apparent JH) shows the apparent value of modelled acid-equivalent flux when calculated simply from the pHi time course shown in the bottom trace as: dpHi/dt×β, where β is assumed to equal the sum of intrinsic buffering (βi= -28pHi+ 222.6; Lagadic-Gossmann et al. 1992) plus equilibrium CO2 buffering (β{bold on}{bold}CO2= 2.3 [HCO3−]i; intracellular bicarbonate is calculated from the Henderson-Hasselbalch equation assuming CO2/HCO3− equilibrium; see Methods). In the middle trace, JH=apparent JH only when intracellular CO2/HCO3− buffer is at equilibrium in the model and only when no other acid-equivalent transport (such as acetate movement) is occurring across the sarcolemma. Largely because of acetate efflux, the computed value of apparentJH immediately after external acetate removal is off scale. All acetate efflux ceases in the model within about 30 s, but apparentJH remains larger than JH because a considerable fraction of dpHi/dt in the bottom trace is due to slow CO2 hydration and not to sarcolemmal transport of bicarbonate and hydroxyl ions. Eventually the CO2 hydration comes into equilibrium, and now apparentJH=JH. This marks the end of the OOE period. The middle trace predicts this will normally occur about 2 min after acetate removal (▪). Note that the OOE period is greatly extended when k1 is low (♦), and truncated when k1 is increased 20-fold above control (•). Full details of the computational method are given in the Appendix.
The analysis presented in Fig. 7 is important because it suggests that during the first 2 min of pHi recovery from an alkali load (induced by weak acid prepulsing), the CO2-dependent buffer system in the cardiomyocyte will be out of equilibrium. Figure 7 also analyses pHi recovery when CA activity is inhibited (♦). Under these conditions the out-of-equilibrium condition is predicted to extend for more than 5 min following acetate removal (Fig. 7, ▴; middle and lower panels). Conversely, if CA activity is increased in the model (20-fold increase in control value of k1; equivalent to a high functional expression of intracellular CA), then the CO2 system remains at equilibrium for virtually the whole period of pHi recovery (•, middle and lower panels). The consequence of these analyses for the characterization of sarcolemmal acid loading in the cardiac cell is considered in the Discussion.
DISCUSSION
Two-phase pHi recovery from alkalosis
In the mammalian ventricular cell, we find two kinetic phases of pHi recovery from a simulated metabolic alkali load (acetate prepulse). The initial rapid phase seems not to be due to membrane transport. Our evidence suggests it is caused by a slow intracellular buffering reaction relying on CO2 and HCO3−. These solutes are interlinked through a common intermediate, carbonic acid, which rapidly dissociates such that its intracellular concentration is no more than micromolar (Forster, 1991). The slow phase of pHi recovery is due to membrane acid transport, as shown in the following paper (Leem & Vaughan-Jones, 1998). Identification of slow intracellular buffering is pertinent because its effect on pHi might otherwise be mistaken for sarcolemmal acid loading. An important consequence of slow buffering is that rapid metabolic base disturbances in the cardiomyocyte will readily drive the CO2 buffer system out of equilibrium (OOE, using the abbreviation of Zhao, Hogan, Bevensee & Boron, 1995). The membrane transport reactions that subsequently normalize pHi may therefore also occur under OOE conditions. This has major implications for the quantification of acid transport derived from pHi measurements, as discussed later.
Slow CO2-dependent buffering
There are several possible rate-limiting steps that might lead to slow buffering. These could be (i) CO2 diffusion into the cell, (ii) CO2 hydration to carbonic acid and (iii) the dissociation of carbonic acid into H+ and HCO3−. In free solution, the rate constant for carbonic acid dissociation is extremely rapid (8 × 10⁶ s−1; Gibbons & Edsall, 1963), and therefore unlikely to be rate limiting in the present work. Although the rate constant for membrane diffusion of CO2 is significantly lower (Forster, 1969; 1170 s−1), it still predicts a rapid membrane passage for CO2 (i.e. time constant of about 1.0 ms) unless major extracellular unstirred layers exist adjacent to the cell membrane. Unstirred layers as thick as 100-200 μm have been proposed for artificial lipid bilayers and for some multicellular preparations including cardiac preparations (de Hemptinne, Marranes & Vanheel, 1987), where they may significantly reduce the rate of transmembrane CO2 diffusion (see Kreuser & Hoofd, 1987, for a review). It seems extremely unlikely, however, that layers of this magnitude are established outside an isolated superfused myocyte. It should be noted that, in the model simulations of CO2-dependent buffering shown in Figs 6 and 7, a 1000-fold reduction of membrane CO2 permeability has virtually no effect on the predicted changes of pHi. It is therefore unlikely that CO2 permeation is rate limiting during the slow buffering reaction. This leaves CO2 hydration as the possible rate-limiting step.
In free solution the hydration is naturally slow in the absence of CA, with k1 values ranging from 0.08 s−1 (Swenson & Maren, 1978) to 0.19 s−1 at 37°C (Forster, 1991). The present work (Fig. 5C) indicates that, in the absence of CA activity, the intracellular CO2 hydration time constant is about 7 s (k1= 0.144 s−1), similar to that in free solution. However, CO2-dependent pHi buffer transients persist for minutes rather than seconds in the cardiac cell, even in the presence of active CA (see, for example, Figs 4 and 5). It is important to note that CO2 hydration in the intracellular compartment occurs in the presence of relatively high-capacity intrinsic buffers (βi) which will slow pHi equilibration. The modelling displayed in Fig. 6C indicates that in the cardiac cell, the presence of ∼25 mM intrinsic buffer slows pHi equilibration to 2-5 min (depending on whether or not CA is active), in good agreement with the experimental observations. Slow CO2-dependent intracellular buffering is therefore consistent with slow CO2 hydration in the presence of intrinsic buffers.
It is important to stress that the kinetics of the intrinsic buffers themselves seem to be fast, as evidenced by the rapid monotonic rise of pHi (Fig. 3A) in response to an acetate prepulse in Hepes-buffered conditions (when effects of CO2-dependent buffering can be ignored).
Forward and backward rate constant of CO2 hydration
In the presence of ATZ, we estimate a k1 of 0.144 s−1. Assuming complete inhibition of CA by ATZ, k1 provides a direct measure of the uncatalysed hydration rate constant for CO2 in the cytoplasmic compartment. It is notable, therefore, that our value for k1 is very similar to the values quoted above (previous section) for uncatalysed CO2 hydration in free solution (e.g. Swenson & Maren, 1978; Forster, 1991). This reinforces our proposal that initial pHi recovery following an alkali load is caused by CO2-dependent buffering.
CA activity increases the forward CO2 hydration rate constant, k1, 2.6-fold (to 0.36 s−1). Assuming (i) an apparent pK for the whole CO2 hydration reaction (eqn (2)) of 6.12 (Putnam & Roos, 1991) and (ii) a pK for the partial reaction H2CO3→ H++ HCO3− of 3.456 (Forster, 1991), we calculate the backward rate constant for the CA-catalysed partial reaction H2CO3→ CO2+ H2O to be 1.66 × 10² s−1, nearly 400-fold faster than the CA-catalysed forward (k1) rate constant. Interestingly, the apparent rate constant for the whole backward reaction H++ HCO3−→ CO2+ H2O becomes 3.11 × 10⁵ s−1, nearly half a million times faster than k1. Thus, as in free solution, the rate constant for CO2 hydration is very much slower than that of the reverse reaction.
Low CA activity in the ventricular myocyte
The acceleration of CO2 hydration by CA (2.6-fold) is modest in the ventricular myocyte. In contrast, CA activity in the erythrocyte increases k1 17 000-fold (Forster, 1991). Functional expression of CA is thus low in the cardiac cell. This is in agreement with previous functional studies in heart (Ellis & Thomas, 1976; Lagadic-Gossmann et al. 1992). It is also in line with biochemical studies showing that mammalian myocardium contains low overall CA levels (Bruns & Gros, 1992). Seven CA isoforms are known (CA I-V II, Dodgson, 1991). They vary in their subcellular localization, with CA I-III and VII being cytoplasmic, CA V mitochondrial, and CA IV localized to the surface membrane. A salivary secretory form (CA VI) has also been proposed. We do not know which isoform catalyses the CO2-dependent intracellular buffering reported in the present work. Given that there seems to be virtually no cytoplasmic CA in heart but high, localized activity in sarcolemmal and sarcoplasmic membranes (Bruns & Gros, 1992) it may be CA IV or V (or both), especially since these particular isoforms are highly susceptible to ATZ (Maren, Wynns & Wisbrand, 1993; Heck, Tanhauser, Manda, Tu, Laipis & Silverman, 1994).
In some cell types, plasmalemmal-bound CA appears to be located on the extracellular facing side where it may facilitate the buffering of extracellular pH (e.g. Huang, Smith & Chesler, 1995). Although we do not exclude some extracellular CA activity in heart (de Hemptinne et al. 1987), the active site of CA that catalyses CO2-dependent intracellular buffering in the ventricular myocyte must itself be intracellular. If the relevant CA were only extracellular, the development of intracellular acidosis produced by CO2 influx would be rate limited by the uncatalysed hydration of CO2 within the cell. The pHi buffering transient in the cardiomyocyte is, however, too fast to be produced in this way. In the absence of ATZ, it is 2.6-fold faster than that expected from the rate of uncatalysed CO2 hydration (Fig. 5).
The relevance of a low functional expression of intracellular CA (CAi) in heart is unclear, especially since its spatial distribution within the cell is not known. If localized at the sarcolemma (Bruns & Gros, 1992) it might assist in the facilitation of CO2 diffusion across the membrane (Kreuser & Hoofd, 1987), a function that would be aided by any matching extracellular expression of CA (de Hemptinne et al. 1987). Although CA activity is low, however, it nevertheless catalyses a component of intracellular buffering that is of major importance, provided that intracellular acid/base challenges do not occur extremely rapidly.
Out-of-equilibrium conditions affect estimates of buffering power and acid flux
Errors in βCO2
A rapidly imposed metabolic alkali load (e.g. by acetate prepulse) initially titrates only the intracellular intrinsic buffers. Depending on conditions (e.g. level of CAi activity), full CO2-dependent buffering is imposed over the next few minutes. Thus βCO2 calculated from pHi displacements immediately following a weak acid prepulse will be much smaller than that measured from the subsequent steady-state change of pHi, when OOE conditions have subsided. The problem will be compounded if, when measuring the amplitude of the pHi change, the initial and rapid pHi recovery phase is back-extrapolated to time zero (a procedure frequently adopted when estimating intrinsic buffering power in Hepes buffer; see Bountra, Powell & Vaughan-Jones, 1990, for discussion of this technique). Back-extrapolation will remove the CO2-dependent component of buffering entirely. Thus the full CO2/HCO3− contribution to intracellular buffering should be assessed only when pHi has stabilized following an acid/base injection (with the added requirement of no net sarcolemmal acid/base transport occurring during the measurement).
There have been several reports recently that CO2-dependent buffering is not detectable in certain cell types. These include uterine (Eiseland, Baro, Raimbach, Eisner & Wray, 1991), ureteric (Aickin, 1994) and mesenteric vascular (Baro, Eisner, Raimbach & Wray, 1989) smooth muscle, as well as cultured CNS neurones (Amos, Pocock & Richards, 1996). A complete absence of βCO2 is puzzling given that these cell types clearly behave as open systems for CO2. In contrast βCO2 is readily observed in molluscan neurones (Thomas, 1976), cardiac cells (Buckler, Denyer, Vaughan-Jones & Brown, 1990), pulmonary vascular smooth muscle cells (Stevens & Vaughan-Jones, 1995), skeletal muscle (Aickin & Thomas, 1977) and the squid giant axon (Zhao et al. 1995). In the present work, once OOE conditions subsided, an increased intracellular buffering capacity in bicarbonate buffer was also readily observed. For example in Fig. 3, the amplitude of alkali loading in Hepes buffer (panel A) matches steady-state loading in CO2/HCO3− buffer (panel B) despite the fact that twice the concentration of acetate was used in the prepulsing shown in panel B, consistent with a large βCO2 in the latter case. It is notable that utereric smooth muscle (Aickin, 1994) and some CNS neurones (Trachtenberg & Sapirstein, 1980) may express little functional CAi. It therefore seems possible that previous measurements of βCO2 in these cell types may have been underestimated due to OOE conditions prevailing at the time of measurement. For example, previous estimates of negligible βCO2 in CNS neurones were routinely made only tens of seconds after imposing an intracellular alkali load (Amos et al. 1996), a procedure virtually guaranteed to eliminate contributions from any CO2-dependent buffering. In this latter work, however, it is notable that immediately following the alkali load (constant PCO2), there was no rapid recovery phase of pHi, again suggesting no apparent CO2-dependent buffering (Fig. 2 of Amos et al. 1996). This result is puzzling and merits further investigation
Errors in estimating acid-loading flux: the ‘OOE window’
When sarcolemmal acid carriers are functional, membrane flux calculated from pHi recovery rate (standard method, assuming buffer equilibrium) will be greatly overestimated under OOE conditions (see Fig. 7). This is because pHi recovery here is actually a mixture of slow buffering and sarcolemmal transport. In an isolated myocyte, the OOE window lasts for about 2 min following an acetate prepulse, but for over 5 min in the absence of CA activity (Fig. 7). Quantitative measurements of acid influx following an intracellular alkali load have been reported recently for the guinea-pig ventricular myocyte (Xu & Spitzer, 1994), where values as high as 9 mM min−1 were calculated from initial pHi recovery rates. Such high values should perhaps be regarded with caution until the possibility of an OOE condition at the time of measurement has been rigorously eliminated.
The extent to which the OOE window will affect measurements of acid loading in non-cardiac cell types has not been considered in the literature. The problem will be most acute in small superfused cells with a high surface area : volume ratio, since these are alkali loaded rapidly using the weak acid prepulse technique, and the subsequent pHi recovery can be complete in only a few minutes. In such cells, if CAi activity is absent, then the OOE window will encompass the whole pHi recovery period. Potential examples of such cell types are smooth muscle and CNS neurones featuring low expression of CAi. In any cell type, care should therefore be taken to ascertain if recovery is due to buffering or to membrane transport, and whether recovery is occurring under OOE conditions.
The problem of OOE conditions distorting estimates of H+-equivalent membrane flux need not be restricted to only isolated cells. In multicellular preparations such as those from heart, where diffusion delays result in slower pHi transients (Bountra et al. 1990), it is possible that the OOE window may extend for considerably longer than 2-5 min. This would occur, for example, if CO2 levels took longer to equilibrate across all surface membranes because of extracellular tortuosity.
The OOE window during recovery from acidosis
An important question is whether the OOE window occurs after intracellular acid as well as alkali loads. In CO2/HCO3−-buffered media, rapid initial pHi transients have not so far been seen following acid loading (ammonium prepulsing, in Na+-free conditions to inhibit sarcolemmal acid extruders, e.g. Lagadic-Gossman et al. 1992). This is most likely because the CO2-dependent buffering reaction operates in the reverse direction under acidotic conditions, and the apparent rate constant (H++ HCO3−→ CO2+ H2O) is very fast (about half a million times faster than the CO2 hydration rate constant; see earlier Discussion). We have simulated by computer the effects on pHi of rapidly imposing an acid load, and the results suggest that a CO2-dependent buffer overshoot of pHi may be visible for about 10 s following the acid load, providing the loading is instantaneous. This OOE window is much briefer than that reported above during intracellular alkalosis. Since the exchange time in our superfusion chamber can be several seconds, an OOE pHi transient following acidosis in CO2/HCO3− buffer may therefore be difficult to detect.
Conclusions
Following a rapidly imposed intracellular alkali load (e.g. weak acid prepulse) the CO2/HCO3− buffer within the cell is driven out of equilibrium for a few minutes. Re-equilibration of the buffer results in a partial pHi recovery from the alkali load. The time course of this recovery provides information on the intracellular CO2 hydration rate constant within the cardiomyocyte and therefore on the functional expression of carbonic anhydrase. The pHi changes associated with CO2 buffer re-equilibration should not be confused with sarcolemmal acid influx. Accurate estimates of this latter flux are difficult to make during the out-of-equilibrium period and should be made at least 2 min after the alkali load, and even longer if intracellular carbonic anhydrase activity has been inhibited. It seems likely that this problem will not be confined to cardiac cells. In small non-cardiac cells, if functional expression of carbonic anhydrase is low, out-of-equilibrium conditions are also likely to occur, and will similarly affect quantitative analyses of pHi regulation.
Acknowledgments
We thank Ms Anna Clarke for excellent technical assistance and for helping to prepare the figures. This work was funded by a grant (to R. D. V.-J.) from the British Heart Foundation.
APPENDIX
Simulation of alkali loading and pHi recovery Calculation of CO2 hydration rate constant (k1)
To obtain k1 from the pHi recoveries shown in Fig. 4, we make the following assumptions. (i) All pHi recovery in Cl−-free conditions is due to CO2 hydration. (ii) Since membrane permeability to CO2 is high (e.g.0.58 cm s−1; Forster, 1969), CO2 remains at equilibrium across the membrane during simulated metabolic alkalosis (e.g. acetate removal). (iii) Apparent intracellular pKa for CO2/HCO3− is the same as in extracellular Tyrode solution (i.e. 6.12; see Table 1). (iv) Except for the CO2 hydration reaction, all other reactions are instantaneous. (v) There is no membrane permeability to H+, OH− or HCO3− (note that pHi in cardiomyocytes is voltage independent, consistent with low conductances for these ions; Lagadic-Gossmann et al. 1992; Sun et al. 1996).
Table 1.
Parameters used in the simulations
| Parameter | Value | Reference |
|---|---|---|
| Myocyte volume1 | 46289 × 10−12 cm3 | This paper |
| Myocyte surface area/volume ratio | 2017 cm−1 | This paper |
| Non-ionized acetate permeability (PHA) 2 | 0.12 cm s−1 | Stein, 1986 |
| Ionized acetate permeability (PA−) 3 | 6.77 × 10⁻⁸ cm s−1 | See legend |
| CO2 permeability | 0.58 cm s−1 | Forster, 1969 |
| Ionization constant of acetate | 10 −4.528 | Harned & Hickey, 1937 |
| Equilibrium constant of CO2 reaction | 10−6.12 | This paper |
Assume cylindrical shape; myocyte diameter, 21.5 ± 0.7 μm (mean ±s.e.m., n= 33); length, 127.5 ± 3.3 μm (mean ±s.e.m., n= 33).
Calculated value from the equation PHA=KHADHA/δ, where KHA (partition coefficient) = 0.49, DHA (diffusion constant) = 2.51 × 10⁻⁷ cm2 s−1, and δ (membrane thickness) = 100 × 10−8 cm).
We calculated this value on the assumption that acetate ion current is 50 pA at a resting membrane potential of -80 mV (this is an arbitrary current value, chosen to be of an acceptable amplitude for a whole-cell anion current with a driving force of 50-100 mV) and [A−]i and [A−]o are 0.03 and 0.08 m, respectively.
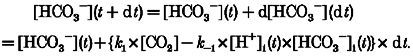
Since carbonic acid dissociation into HCO3− and H+ is essentially instantaneous, and since CO2 hydration is rate limiting for the whole CO2/HCO3− reaction, we have represented the reaction as a single step (eqn (A1)). Net CO2 hydration rate inside the cell (at time t after the alkali load) must equal the rate of production of intracellular bicarbonate ions, which in turn must equal the net rate of proton production as measured from pHi recovery rate (eqn (A2)).
 |
(A1) |
 |
(A2) |
where k1 is the forward rate constant for hydration, k-1 is the reverse rate constant, βi= -28pHi+ 222.6; see Methods), and [H+]i(t) = 10-pHi(t)/γH (the H+ activity coefficient, γH, was taken as 0.8089 at ionic strength 0.16 and temperature 37°C; Harned & Owen, 1950). [CO2] was calculated using eqn (1) in the Methods section.
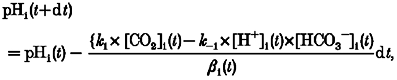
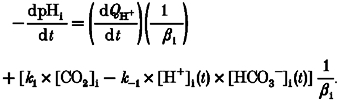
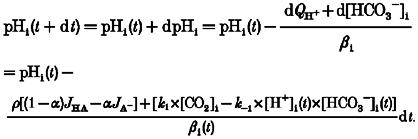
From eqn (A2), when dt is small enough, we can describe, iteratively, the time course of the whole pHi recovery as follows:
 |
(A3) |
 |
(A4) |
In order to use k1 and k-1 to calculate the time course of pHi recovery, one therefore requires a value for [HCO3−]i(t). This was obtained as follows:
 |
(A5) |
where
 |
and
The latter equation is a rearrangement of the Henderson- Hasselbalch equation, giving intracellular bicarbonate concentration when CO2 hydration has reached equilibrium (at time ∞).
A value for k1 (and hence also k-1; recall that k1 and k-1 are interrelated: k1=k-1× 10-pK, where pK = pKa+ logγH) was deduced by trial and error. By using a selected k1 (and k-1) value, the predicted time course of pHi recovery was computed iteratively from eqns (A3) and (A4), and compared with the experimental pHi record. If the two curves were statistically the same, with a P value > 0.9999 (Student's paired t test; see e.g. Fig. 5A), then the k1 value for that experiment was accepted. For P < 0.9999, the k1 value was modified and the computing process repeated. In this way, k1 values were progressively refined. Accepted k1 values from several experiments were averaged to give the mean values shown in Fig. 5C.
Simulation of alkali loading following acetate removal or CO2 removal
In order to simulate the full time course of a pHi change during alkali loading and recovery (e.g. Figs 6B and 7), it was necessary to simulate initial alkali loading. We did this for the cases of acetate removal and PCO2 reduction/removal.
CO2 reduction/removal
Given the membrane permeability coefficient for CO2 (PCO2), the following relationships are valid.
and
| (A6) |
where JCO2 is the membrane CO2 flux, and ρ is the surface area : volume ratio of the cell.
When dt is sufficiently small we can calculate, iteratively, the time course of a pHi change by using eqn (A13):
 |
(A7) |
where [CO2]i (t + dt) =[CO2]i(t) + d[CO2]i.
A computed time course for pHi change following PCO2 reduction is shown in Fig. 6B.
Acetate removal
In addition to the assumptions outlined above (in ‘Calculation of CO2 hydration rate constant (k1)’) we assume the following. (i) The stability constant for acetate ions is the same inside and outside the myocyte. (ii) Non-ionized acetic acid diffuses readily through the lipid sarcolemmal phase (in accordance with Fick's Law; see eqn (A8)) whereas, for the acetate anion, there is a low constant field channel conductance (eqn (A9)). We find that by adopting these assumptions concerning acetate movement we can reproduce adequately the time course of alkali loading. The following relationships hold.
| (A8) |
| (A9) |
where HA and A− represent the undissociated and dissociated forms of acetic acid, respectively. JHA and JA− represent the net fluxes of each form; PHA and PA− are permeability coefficients for each form; Vm is the membrane potential; ε represents exp(-VmF/RT)where F, R and T have their usual meaning. Note that efflux of acetate anions (JA−) indirectly blunts the alkali load, because it lessens the fraction of acetate leaving as HA. The net rate of intracellular proton depletion (-dQH+/dt) due to the combined effluxes JA− and JHA is:
| (A10) |
where α=[H+]i/([H+]i+K), ρ is the area : volume ratio of the cell, and K is the dissociation constant of acetic acid. Therefore, the rate of rise of pHi is given by:
| (A11) |
Combining eqns (A11) and (A2) gives the rate of change of pHi when the alkali load is induced in the presence of CO2/HCO3− buffer:
 |
(A12) |
Since the above differential equation cannot be solved for pHi, we again use numerical methods. When dt is sufficiently small we can calculate, iteratively, the time course of pHi changes by using eqn (A13):
 |
(A13) |
All required parameters are listed in Table 1. A full predicted time course of pHi change after acetate removal is shown in Fig. 6, computed using eqn (A11). In the case of acetate removal in Hepes-buffered conditions, d[HCO3−]i is zero.
Alkali loading and pHi recovery in the presence of functional AE and CHE carriers
If sarcolemmal acid-equivalent influxes on the AE or CHE carriers (JHCO3− and JOH−, respectively) are active during an alkali load, then eqns (A8) and (A4) become, respectively:
| (A14) |
| (A15) |
Figure 7 shows a pHi simulation after acetate removal in the presence of CO2/HCO3− buffer, and in the presence of sarcolemmal acid influxes on Cl−-OH− exchange and Cl−-HCO3− exchange.
References
- Aickin CC. Regulation of intracellular pH in smooth muscle of guinea-pig ureter: bicarbonate dependence. The Journal of Physiology. 1994;479:301–316. doi: 10.1113/jphysiol.1994.sp020297. [DOI] [PMC free article] [PubMed] [Google Scholar]
- Aickin CC, Thomas RC. Microelectrode measurement of the intracellular pH and buffering power of mouse soleus muscle fibres. The Journal of Physiology. 1977;267:791–810. doi: 10.1113/jphysiol.1977.sp011838. [DOI] [PMC free article] [PubMed] [Google Scholar]
- Amos BJ, Pocock G, Richards CD. On the role of bicarbonate as a hydrogen ion buffer in rat CNS neurones. Experimental Physiology. 1996;81:623–632. doi: 10.1113/expphysiol.1996.sp003963. [DOI] [PubMed] [Google Scholar]
- Baro I, Eisner DA, Raimbach SJ, Wray S. Intracellular pH regulation and buffering power in single, isolated vascular and intestinal smooth muscle cells. The Journal of Physiology. 1989;417:161. P. [Google Scholar]
- Bountra C, Powell TP, Vaughan-Jones RD. Comparison of intracellular pH transients in single ventricular myocytes and isolated ventricular muscle of guinea-pig. The Journal of Physiology. 1990;424:343–365. doi: 10.1113/jphysiol.1990.sp018071. [DOI] [PMC free article] [PubMed] [Google Scholar]
- Bruns W, Gros G. Membrane-bound carbonic anhydrase in the heart. American Journal of Physiology. 1992;262:H577–584. doi: 10.1152/ajpheart.1992.262.2.H577. [DOI] [PubMed] [Google Scholar]
- Buckler KJ, Vaughan-Jones RD. Application of a new pH-sensitive fluoroprobe (carboxy SNARF-1) for intracellular pH-measurement in small isolated cells. Pflügers Archiv. 1990;417:234–239. doi: 10.1007/BF00370705. [DOI] [PubMed] [Google Scholar]
- Buckler KJ, Denyer J, Vaughan-Jones RD, Brown HA. Intracellular pH regulation in rabbit isolated sino-atrial node cells. The Journal of Physiology. 1990;426:22. P. [Google Scholar]
- de Hemptinne A, Marrannes R, Vanheel B. Surface pH and the control of intracellular pH in cardiac and skeletal muscle. Canadian Journal of Physiology and Pharmacology. 1987;65:970–977. doi: 10.1139/y87-154. [DOI] [PubMed] [Google Scholar]
- Dodgson SJ. The carbonic anhydrase. In: Dodgson SJ, Tashian RE, Gros G, Carter ND, editors. The Carbonic Anhydrases: Cellular Physiology and Molecular Genetics. London: Plenum Press; 1991. pp. 3–14. [Google Scholar]
- Eiseland J, Baro I, Raimbach S, Eisner DA, Wray S. Intracellular pH and buffering power measured in isolated single cells from pregnant rat uterus. Experimental Physiology. 1991;76:815–818. doi: 10.1113/expphysiol.1991.sp003548. [DOI] [PubMed] [Google Scholar]
- Eisner DA, Kenning NA, O'Neill SC, Pocock G, Richards CD, Valdeolmillos M. A novel method for absolute calibration of intracellular pH indicators. Pflügers Archiv. 1989;413:553–558. doi: 10.1007/BF00594188. [DOI] [PubMed] [Google Scholar]
- Ellis D, Thomas RC. Direct measurement of the intracellular pH of mammalian cardiac muscle. The Journal of Physiology. 1976;262:755–771. doi: 10.1113/jphysiol.1976.sp011619. [DOI] [PMC free article] [PubMed] [Google Scholar]
- Forster RE. The rate of CO2 equilibrium between red cells and plasma. In: Forster RE, Edsall JT, Otis AB, Roughton FJW, editors. CO2: Chemical, Biological, and Physiological Aspects. Washington: NASA SP-188; 1969. pp. 275–286. [Google Scholar]
- Forster RE. Methods for the measurement of carbonic anhydrase activity. In: Dodgson SJ, Tashian RE, Gros G, Carter ND, editors. The Carbonic Anhydrases: Cellular Physiology and Molecular Genetics. London: Plenum Press; 1991. pp. 79–97. [Google Scholar]
- Geers C, Gros G. Muscle carbonic anhydrases: function in muscle contraction and in the homeostasis of muscle pH and pCO2. In: Dodgson SJ, Tashian RE, Gros G, Carter ND, editors. The Carbonic Anhydrases: Cellular Physiology and Molecular Genetics. London: Plenum Press; 1991. pp. 227–240. [Google Scholar]
- Gibbons, Edsall Rate of hydration of carbon dioxide and dehydration of carbonic acid at 25 °. Journal of Biological Chemistry. 1963;238:3502–3507. [PubMed] [Google Scholar]
- Grynkiewicz G, Poenie M, Tsien RY. A new generation of Ca2+ indicators with greatly improved fluorescent properties. Journal of Biological Chemistry. 1985;260:3440–3450. [PubMed] [Google Scholar]
- Harned HS, Hickey FC. The ionization of acetic acid in aqueous sodium chloride solutions from 0 to 40°C. Journal of American Chemical Society. 1937;59:1284–1291. [Google Scholar]
- Harned HS, Owen BB. The Physical Chemistry of Electrolytic Solutions. 2. New York: Reinhold Publishing Corporation; 1950. pp. 547–558. [Google Scholar]
- Heck RW, Tanhauser SM, Manda R, Tu C, Laipis PL, Silverman DN. Catalytic properties of mouse carbonic anhydrase V. Journal of Biological Chemistry. 1994;269:24742–24746. [PubMed] [Google Scholar]
- Huang H, Smith SE, Chesler M. Addition of carbonic anhydrase augments extracellular pH buffering in rat cerebral cortex. Journal of Neurophysiology. 1995;74:1806–1809. doi: 10.1152/jn.1995.74.4.1806. [DOI] [PubMed] [Google Scholar]
- Kreuser F, Hoofd L. Facilitated diffusion of oxygen and carbon dioxide. In: Farhi LE, Tenney SM, editors. Handbook of Physiology The Respiratory System Gas Exchange. IV. Bethesda, MA, USA: American Physiological Society; 1987. pp. 89–111. section 3 chap. 6. [Google Scholar]
- Lagadic-Gossmann D, Buckler KJ, Vaughan-Jones RD. Role of bicarbonate in pH recovery from intracellular acidosis in the guinea-pig ventricular myocyte. The Journal of Physiology. 1992;458:361–384. doi: 10.1113/jphysiol.1992.sp019422. [DOI] [PMC free article] [PubMed] [Google Scholar]
- Leem CH, Vaughan-Jones RD. Out-of-equilibrium pHi transients of the CO2/HCO3− buffer system in guinea-pig ventricular myocytes. The Journal of Physiology. 1996;494:109. P. [Google Scholar]
- Leem CH, Vaughan-Jones RD. Sarcolemmal mechanisms for pHi recovery from alkalosis in the guinea-pig ventricular myocyte. The Journal of Physiology. 1998;509:487–496. doi: 10.1111/j.1469-7793.1998.487bn.x. [DOI] [PMC free article] [PubMed] [Google Scholar]
- Lentner C. Geigy Scientific Tables: Physical Chemistry, Composition of Blood, Hematology and Somatometric Data. 8. Basle, Switzerland: Ciba-Geigy; 1984. p. 32. [Google Scholar]
- Maren TH, Wynns GC, Wisbrand PJ. Chemical properties of carbonic anhydrase IV, the membrane bound enzyme. Molecular Pharmacology. 1993;44:901–905. [PubMed] [Google Scholar]
- Putnam W, Roos A. Which value for the first dissociation constant of carbonic acid should be used in biological work. American Journal of Physiology. 1991;260:C1113–1116. doi: 10.1152/ajpcell.1991.260.5.C1113. [DOI] [PubMed] [Google Scholar]
- Richmond P, Vaughan-Jones RD. Assessment of evidence for K+-H+ exchange in isolated type-1 cells of neonatal rat carotid body. Pflügers Archiv. 1997. in the Press. [DOI] [PubMed]
- Roos A, Boron WF. Intracellular pH. Physiological Reviews. 1981;61:296–434. doi: 10.1152/physrev.1981.61.2.296. [DOI] [PubMed] [Google Scholar]
- Stein WD. Transport and Diffusion Across Cell Membranes. London: Academic Press; 1986. pp. 76–89. [Google Scholar]
- Stevens KD, Vaughan-Jones RD. Intracellular H+ buffering power in isolated pulmonary arterial smooth muscle cells of rabbit. The Journal of Physiology. 1995;487:88. P. [Google Scholar]
- Sun B, Leem CH, Vaughan-Jones RD. Novel chloride-dependent acid loader in the guinea-pig ventricular myocyte: part of a dual acid-loading mechanism. The Journal of Physiology. 1996;495:65–82. doi: 10.1113/jphysiol.1996.sp021574. [DOI] [PMC free article] [PubMed] [Google Scholar]
- Swenson ER, Maren TH. A quantitative analysis of CO2 transport at rest and during maximal exercise. Respiratory Physiology. 1978;35:129–159. doi: 10.1016/0034-5687(78)90018-x. [DOI] [PubMed] [Google Scholar]
- Thomas RC. The effect of carbon dioxide on the intracellular pH and buffering power of snail neurones. The Journal of Physiology. 1976;255:715–735. doi: 10.1113/jphysiol.1976.sp011305. [DOI] [PMC free article] [PubMed] [Google Scholar]
- Trachtenberg MC, Sapirstein VS. Carbonic anhydrase distributions in central and peripheral nervous system of the rat. Neurochemical Research. 1980;5:573–581. doi: 10.1007/BF00964994. [DOI] [PubMed] [Google Scholar]
- Vaughan-Jones RD. Chloride activity and its control in skeletal and cardiac muscle. Philosophical Transactions of the Royal Society. 1982;299:537–548. doi: 10.1098/rstb.1982.0150. B. [DOI] [PubMed] [Google Scholar]
- Xu P, Spitzer KW. Na+-independent Cl−-HCO3− exchange mediates recovery of pHi from alkalosis in guinea-pig ventricular myocytes. American Journal of Physiology. 1994;267:H85–91. doi: 10.1152/ajpheart.1994.267.1.H85. [DOI] [PubMed] [Google Scholar]
- Zhao J, Hogan EM, Bevensee MO, Boron WF. Out-of-equilibrium CO2/HCO3− solutions and their use in characterising a new K+/HCO3− cotransporter. Nature. 1995;374:636–639. doi: 10.1038/374636a0. [DOI] [PubMed] [Google Scholar]