

Abstract
A novel method of ‘entire soma isolation’ was used to describe the distribution of voltage-gated K+ channels between soma, axon and dendrites of dorsal horn neurones identified in spinal cord slices of newborn rat.
The soma contained 36 % of total inactivating (KA) current but only 15 % of delayed rectifier (KDR) current. The axon initial segment possessed almost half (47 %) of the total KA current and 38 % of KDR current. In contrast, dendrites contained a small portion (17 %) of KA but 47 % of KDR current.
Under current-clamp conditions, the soma isolated from axon and dendrites was not able to generate action potentials. It passively conducted weak (≤ -50 mV) and amplified pronounced (-50 to 0 mV) depolarizations but inhibited strong (≤ 0 mV) depolarizations.
It is concluded that the soma plays a complex role in the excitability of spinal dorsal horn neurones. It conducts passively or amplifies excitatory postsynaptic potentials on their way from dendrites and soma to the axon initial segment but it inhibits back-propagation of the action potential from the axon to the dendrites.
Voltage-gated Na+ and K+ channels play a central role in action potential generation in neuronal membranes. The properties and spatial distribution of these channels determine the threshold and shape of the action potential as well as the firing pattern in the neurone. Numerous electrophysiological and staining experiments have shown that the majority of Na+ channels is located in the axon hillock or the axon initial segment (Catterall, 1981; Boudier et al. 1985; Wollner & Catterall, 1986; Angelides, Elmer, Loftus & Elson, 1988; Safronov, Wolff & Vogel, 1997). An increased density of Na+ channels in the axon was suggested to lower the firing threshold, making the axon a favourable site for action potential initiation (Coombs, Curtis & Eccles, 1957a, b; Eccles, 1964). Inactivating (A) and delayed-rectifier (DR) K+ channels contribute to membrane repolarization during single action potentials as well as influence repetitive firing in many types of neurones (Hodgkin & Huxley, 1952; Connor & Stevens, 1971; Llinas, 1988; Hille, 1992). Unfortunately, little is known until now about the spatial distribution and localization of these types of K+ channels in neuronal soma, axon and dendrites. This lack of information renders a gap in the comprehension of the mechanisms underlying the generation of both single action potentials and complex firing patterns.
The recently described method of ‘entire soma isolation’ (ESI) has been successfully used to study Na+ channel distribution in dorsal horn neurones of the spinal cord (Safronov et al. 1997). By using this method we have compared the whole-cell Na+ currents recorded from an intact neurone in the slice with those recorded from its isolated soma or from its isolated soma with an attached axon. In the present work the ESI method was further employed to describe the spatial distribution of voltage-gated K+ channels.
An additional advantage of the ESI method is the possibility of studying the properties of the neuronal soma separated from the axon and the dendritic tree. It was shown that the soma of dorsal horn neurones contains only 14 % of Na+ channels and is not able to generate action potentials, probably because of the low density of Na+ channels and/or higher density of voltage-gated K+ channels (Safronov et al. 1997). However, a number of questions concerning the role of the soma in action potential generation remains to be answered. Does the soma passively follow the action potentials originating from the axon initial segment or can it play an active role by amplifying or attenuating them? Can it support the propagation of excitatory postsynaptic potentials from dendrites and soma to the axon initial segment as well as the back-propagation of action potentials from the axon to the dendrites? To answer these questions, additional knowledge about the spatial distribution of both Na+ and K+ channels is needed.
In the present paper we show that, in addition to 14 % of the total Na+ conductance, the soma possesses 36 % of K+ A-channels and 15 % of K+ DR-channels. The axon or its initial segment is equipped with 47 % of the A-channels, but the dendrites possess almost half (47 %) of the DR-channels. Such a distribution of Na+ and K+ channels determines the function of the soma of dorsal horn neurones. It cannot generate action potentials. It amplifies small but inhibits strong depolarizations. It is concluded that the soma of dorsal horn neurones amplifies excitatory postsynaptic potentials propagating from dendrites and soma to the axon, but it weakens the back-propagation of action potentials from axon to dendrites.
METHODS
Preparation
Experiments were performed by means of the patch-clamp technique (Hamill, Marty, Neher, Sakmann & Sigworth, 1981) on 200 μm thin slices (Edwards, Konnerth, Sakmann & Takahashi, 1989) prepared from the lumbar enlargement (L3-L6) of the spinal cord of 3- to 7-day-old rats. Rats were rapidly decapitated and the spinal cords were carefully cut out. The slices were prepared and kept according to a description given by Takahashi (1990). The study was performed on 8-12 μm dorsal horn neurones (laminae I-III) identified and separated from glial cells on the basis of a procedure described previously (Safronov et al. 1997).
Solutions
The preparation solution, also used for maintaining the slices, contained (mM): NaCl, 115; KCl, 5.6; CaCl2, 2; MgCl2, 1; glucose, 11; NaH2PO4, 1; NaHCO3, 25 (pH 7.4 when bubbled with 95 %-5 % mixture of O2-CO2). In order to reduce synaptic activity in neurones, the slices in the experimental chamber were perfused with low-Ca2+, high-Mg2+ solution (Ringer solution). The Ringer solution was obtained from the preparation solution by setting the concentrations of Ca2+ and Mg2+ to 0.1 mM and 5 mM, respectively. Na+-free choline chloride solution contained (mM): choline chloride, 141; KCl, 0.6; CaCl2, 0.1; MgCl2, 5; glucose, 11; and Hepes, 10 (pH 7.4 adjusted with KOH giving a final concentration of 5 mM). External high-K+ solution (high-) used for pipette filling in experiments with inside-out patches contained (mM): NaCl, 5; KCl, 152.5; CaCl2, 2.2; MgCl2, 1; and Hepes, 5 (pH was adjusted to 7.4 by KOH giving a final concentration of 2.5 mM). TTX (100 nM) was added to this solution to block voltage-gated Na+ channels. Specific blockers of K+ channels TEA and 4-AP were directly added to Ringer solution.
The standard internal solution (high-) contained (mM): NaCl, 5; KCl, 144.4; MgCl2, 1; EGTA, 3; and Hepes, 10 (pH was adjusted to 7.3 by NaOH giving a final concentration of 10 mM). The internal solution for studying K+ channels (high-) contained (mM): NaCl, 5; KCl, 144.4; MgCl2, 1; EGTA, 3; and Hepes, 10 (pH was adjusted to 7.3 by KOH giving a final concentration of 10.6 mM).
Current recordings
Patch pipettes were pulled from borosilicate glass tubes (GC 150, Clark Electromedical Instruments, Pangbourne, UK). The pipettes used for single-channel recordings were coated with Sylgard 184 (Dow Corning) and had a resistance of 3-9 MΩ. Pipettes for whole-cell recordings had a resistance of 2-7 MΩ. All pipettes were fire-polished directly before the experiments. The patch-clamp amplifier was a List EPC-7 (Darmstadt, Germany) in all voltage- and current-clamp experiments. The effective corner frequency of the low-pass filter was 1 kHz. The frequency of digitization was 2-10 kHz. The data were stored and analysed using commercially available software (pCLAMP, Axon Instruments). In all voltage-clamp experiments, transients and leakage currents were digitally subtracted using records with either negative pulses or positive pulses which activated no channels. Offset potentials were nulled directly before formation of a seal.
The inside-out patches were studied in an additional small chamber as described elsewhere (Safronov & Vogel, 1995), to avoid the destruction of the whole slice during its superfusion with internal solutions.
The method of ‘entire soma isolation’
The channel distribution and the functions of soma were studied by means of the ‘entire soma isolation’ (ESI) method (Safronov et al. 1997). In brief, in whole-cell recording mode, the entire soma of the neurone was isolated from the slice by slow withdrawal of the recording pipette. The isolated structure was classified as ‘soma’ if it had lost all of its processes during isolation. The isolated structure was classified as ‘soma+axon’ complex if it contained one process and preserved more than 90 % of the original Na+ current recorded in the slice before isolation. The good physiological state of the isolated structures was confirmed by a decrease in membrane leakage conductance, by stable or even improved membrane resting potentials and by the ability of ‘soma+axon’ complexes to generate action potentials (Safronov et al. 1997). The channel distribution was studied by comparing the macroscopic currents recorded in neurones before and after their isolation.
The present study is based on recordings from sixty-five intact neurones in the slice, forty-five isolated ‘somata’ and ‘soma+axon’ complexes and from twenty-nine inside-out patches. All numerical values are given as means ± standard error of the mean (s.e.m.). The data points were fitted by linear or non-linear least squares procedures. The errors of the fitting parameters are given as ± standard error (s.e.). All experiments were carried out at a room temperature of 21-24°C.
RESULTS
Distribution of K+ channels between soma, axon and dendrites
Since the axons and dendrites of dorsal horn neurones had a small diameter of less than 0.5 μm, the channel distribution could not be investigated using direct axonal or dendritic patch-clamp recordings. The distribution of K+ A- and DR-channels was therefore studied by comparing the whole-cell K+ currents recorded in neurones before and after their isolation from the slice (Safronov et al. 1997). An isolated structure which has lost all of its processes during isolation was classified as ‘soma’. The isolated structure with one adjacent process (25-100 μm) was considered as ‘soma+axon'if it preserved at least 90 % of its original Na+ current. An experiment in which the neurone isolation resulted in the formation of a ‘soma+axon’ complex is shown in Fig. 1. At the beginning of the experiment a whole-cell configuration was established with a neurone in the slice and the maximal Na+ current (usually at -30 to -10 mV) was measured in Ringer solution. It should be noted that in most cases Na+ currents recorded from the neurones in the slice were not adequately voltage clamped (see Fig. 10A of Safronov et al. 1997); however, the insufficient space clamp seemed to have little effect on the amplitude of the maximal current. The measurements of Na+ currents were followed by recordings of K+ currents in the external choline chloride solution. In this solution, the neurone was isolated from the slice and K+ currents were again recorded. Finally, the bath was perfused with Ringer solution for Na+ current recording in the isolated structure. A large Na+ current (> 90 % of its original amplitude) measured at the end of the experiment and one visible process attached to the soma indicated that the isolated structure was ‘soma+axon’. A and DR K+ currents (KA and KDR) were separated using a standard method with different prepulses (see legend to Fig. 1). In eight isolated ‘soma+axon’ complexes which preserved 98 ± 2 % of their original Na+ currents, the remaining KA and KDR currents were 83 ± 4 % and 53 ± 5 %, respectively.
Figure 1. K+ currents in an intact neurone in the slice and in its isolated ‘soma+axon’ complex.
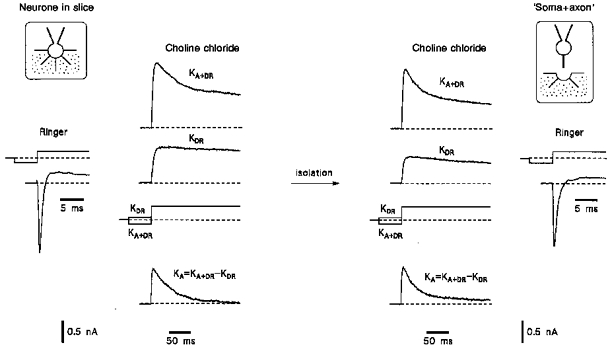
The whole-cell recording mode was established with the intact neurone in the slice and Na+ currents were recorded in Ringer solution. After perfusion of the slice with the choline chloride solution, KA and KDR currents were recorded. Thereafter, the neurone was isolated from the slice by slow withdrawal of the recording pipette resulting in the formation of a ‘soma+axon’ complex. Recording of K+ currents in a ‘soma+axon’ complex was followed by perfusion of the bath with Ringer solution and Na+ currents were recorded again. The pipettes were filled with high- solution. The holding potential was -80 mV. Na+ currents were elicited by a voltage step to -20 mV after a 50 ms prepulse to -120 mV. Total K+ currents KA+DR were activated by a voltage step to +40 mV following a 150 ms prepulse to -120 mV. KDR currents were elicited by a voltage step to +40 mV after a 150 ms prepulse to -60 mV. KA currents were obtained by digitally subtracting KDR currents from KA+DR currents. The scheme of the isolation of the neurone is given in insets (for details see Safronov et al. 1997).
Na+ and K+ currents recorded using the same experimental protocol, from a neurone whose isolation led to a ‘soma’ configuration (no processes attached and considerably reduced Na+ current), are shown in Fig. 2. The amplitudes of both KA and especially KDR currents measured in isolated ‘somata’ were considerably smaller than those recorded in intact neurones. Remaining KA and KDR currents were 36 ± 5 % and 15 ± 2 %, respectively (17 neurones).
Figure 2. K+ currents in an intact neurone in the slice and in its isolated ‘soma’.
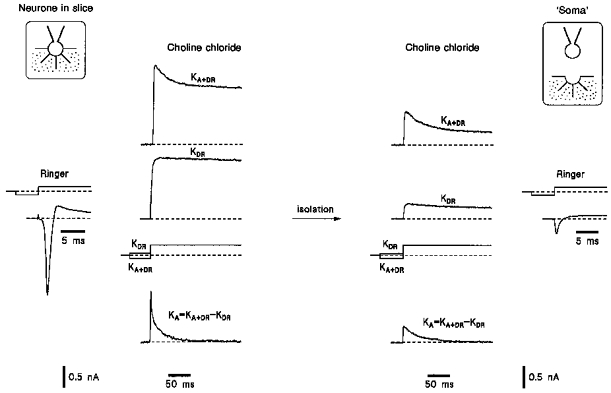
K+ currents were recorded in a neurone before and after its isolation according to protocols given in Fig. 1. The isolation resulted in the formation of a ‘soma’ configuration. Na+ currents were activated by a voltage step to -30 mV after a 50 ms prepulse to -120 mV.
The present results show that the majority of A-channels (83 %) is located in the soma and the axon initial segment, whereas dendrites are mostly equipped with DR-channels (47 %). This observation was further supported by studying the activation of KA and KDR currents in intact neurones and isolated ‘somata’ and ‘soma+axon’ complexes. In intact neurones in the slice, the steady-state activation characteristic of KA current had already reached its maximum at 0 mV whereas that of KDR current was not saturated at potentials as positive as +60 mV (Fig. 3A). Two possible explanations could be given for the lack of KDR current saturation: (1) the intrinsic properties of DR-channels or (2) the location of a large portion of DR-channels in remote membrane regions which were not adequately voltage clamped. The activation of KDR currents, however, had already reached its saturation at +30 mV when studied in isolated ‘somata’ as well as ‘soma+axon’ complexes (Fig. 3B). Thus, loss of the dendritic tree but not of the axon was the major step in changing KDR current activation. The lack of KDR current saturation in neurones in the slice could be therefore explained by the location of a large portion of DR-channels in remote dendritic regions rather than by their intrinsic properties.
Figure 3. Activation characteristics of KA and KDR currents.
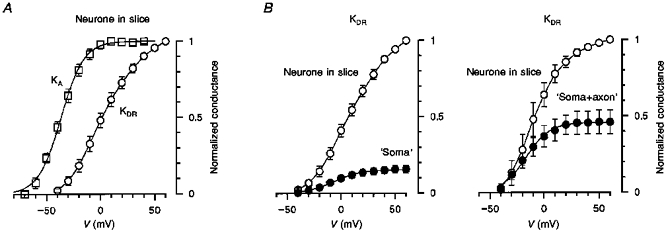
A, activation curves for KA and KDR currents recorded from intact neurones in slice (n = 13). The data points for KA current were fitted by the Boltzmann equation: 1/(1 + exp((V½ - V)/k)), where V½ = -37 ± 1 mV (the potential of half-maximal activation) and k = 11 ± 1 mV (a steepness factor). The data points for KDR currents were connected by straight lines. B, activation curves for KDR currents recorded before (○) and after (•) neurone isolation resulting in the formation of ‘somata’ (left, n = 19) and ‘soma+axon’ complexes (right, n = 4). The data points for KDR currents recorded in the slice were connected by straight lines and those for isolated structures were fitted with the Boltzmann equation with the following parameters: V½ = -6 ± 1 mV and k = 12 ± 1 mV for ‘somata’ and V½ = -17 ± 1 mV and k = 11 ± 1 mV for ‘soma+axon’ complexes.
In further experiments we tested the validity of the application of the ESI method in studying the channel distribution. For this purpose we compared channel densities estimated by the ESI method and by a standard patch-clamp technique. Since very fine processes of dorsal horn neurones were not accessible for the patch pipettes (Safronov et al. 1997), channel densities could be compared only for the soma membrane. The mean whole-cell KA and KDR currents recorded in an isolated ‘soma’ in the external choline chloride solution at +40 mV were 330 ± 43 pA and 240 ± 19 pA (n = 18), respectively. Taking the single A- and DR-channel currents in spinal neurones at +40 mV as 2.4 and 1.3 pA (Safronov & Vogel, 1995), respectively, and assuming that the soma is a sphere with 10 μm diameter, one can calculate the somatic density as 0.4 per μm2 for A-channels and 0.6 per μm2 for DR-channels. For comparison, the activity of single A- and DR-channels was recorded in twenty-nine inside-out patches originating from the soma of intact dorsal horn neurones. The channels were identified on the basis of their gating and inactivation kinetics as well as amplitudes of unitary currents in symmetrical high-K+ solutions (Fig. 4A and B) according to a procedure described for K+ channels in spinal motoneurones (Safronov & Vogel, 1995). The mean pipette resistance in these twenty-nine experiments was 4.8 ± 0.4 MΩ giving a mean membrane patch area of 2.9 μm2 (Sakmann & Neher, 1995). The frequency of A- and DR-channel appearance in the patch was 1.3 and 1.4, respectively. Thus, the estimate of the density from the single-channel recordings is about 0.4 per μm2 for A-channels and 0.5 per μm2 for DR-channels. These values are in good agreement with those obtained from our ESI experiments.
Figure 4. Single A- and DR-channels in dorsal horn neurones.
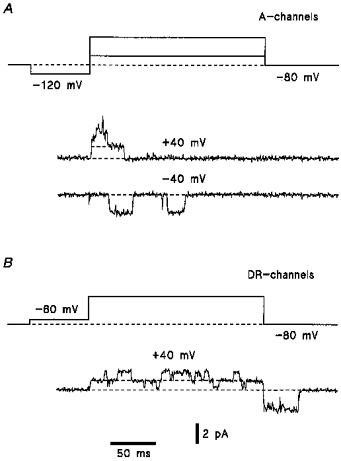
A, recordings of A-channels in inside-out patches. The pipettes were filled with high- solution and the bath contained high- solution. Holding potential was -80 mV. The channels were activated by voltage steps to -40 or +40 mV after a 150 ms prepulses to -120 mV. The channel conductance was about 50 pS for inward currents and 30 pS for outward currents. B, recordings of single DR-channel currents. Inside-out patch. Holding potential was -80 mV. The channels were activated by a voltage pulse to +40 mV following a 150 ms prepulse to -60 mV inactivating A-channels. High-K+ solutions on both sides of the membrane. The channel conductance was 24-30 pS for inward currents and about 20 pS for outward currents.
Role of soma in action potential generation
In current-clamp experiments, the use of the ESI method was extended to study the role of the neuronal soma in action potential generation. It has been shown in our previous paper (Safronov et al. 1997) that the soma of dorsal horn neurones is not able to generate action potentials. The soma contained only 14 % of Na+ channels (Safronov et al. 1997) but, as we show here, 36 % of K+ A-channels and 15 % of K+ DR-channels. It could be assumed that the failure of action potential generation resulted from a relatively high proportion of somatic K+ channels which could just shunt membrane depolarization. In six experiments with isolated ‘somata’ we failed to evoke action potentials even if most K+ channels were blocked by the addition of 10 mM tetraethylammonium (TEA) and 5 mM 4-aminopyridine (4-AP) to the Ringer solution (Fig. 5). Therefore, the inability of the soma to generate action potentials seems to be due to a low density of Na+ channels (1 per μm2, Safronov et al. 1997) and a relatively large capacitance of the soma membrane.
Figure 5. Effect of TEA and 4-AP on the responses of the ‘soma’.
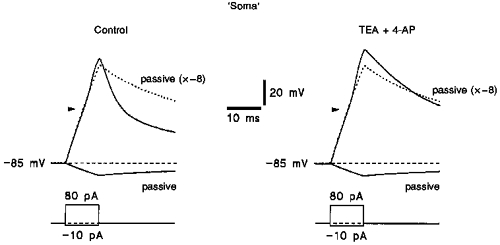
Responses of the ‘soma’ to 10 ms current pulses of -10 and +80 pA in the presence and absence of 10 mM TEA and 5 mM 4-AP. The membrane potential in the ‘soma’ was held at -85 mV by injection of steady-state currents through the recording electrode. The response to a hyperpolarizing -10 pA pulse was considered to be passive. Twenty-five passive responses (to -10 pA pulses) were averaged and then multiplied by a factor of -8 giving the passive membrane response to a +80 pA pulse (indicated by dashed curves). Arrowheads indicate the threshold of action potential firing in this neurone before isolation.
In order to understand the function of the neuronal soma, we compared membrane responses to hyper- and depolarizing 10 ms current pulses injected into intact neurones in the slice and into their isolated ‘somata’ (Fig. 6). The amplitude of injected currents varied between -50 and +140 pA. In neurones in the slice, membrane hyper- or depolarization increased with the amplitude of injected current until the threshold of the action potential was reached (Fig. 6A). Injection of stronger currents produced almost no change in amplitude or time course of the action potential in agreement with the classical ‘all-or-nothing’ principle. In contrast, injection of stronger currents into the ‘soma’ progressively increased membrane depolarization. In order to analyse membrane responses, we plotted the maximal amplitude of hyper- (•) and depolarizations (○) as a function of injected current (V-I plot) for an intact neurone and for its ‘soma’ (Fig. 6B). Since the dorsal horn neurones studied here did not possess inward-rectifier K+ currents, hyperpolarizations produced by an injection of -50 to 0 pA currents (•) were considered to be passive membrane responses. For both the intact neurone and its isolated ‘soma’, the data points indicated by filled symbols were fitted with a linear function, a line of passive responses, which was extrapolated into the region of depolarizations. The V-I plot for the intact neurone has two main regions: (1) a passive region (up to -50 mV) where the open symbols follow the line of passive responses, and (2) a region of action potentials with an overshoot of +20 to +30 mV. However, the V-I plot for the ‘soma’ showed three different regions: (1) a passive region (up to -50 mV), (2) an amplification region (between -50 and 0 mV), where the activation of somatic Na+ channels produced a local response and, therefore, amplified the passive membrane response, and (3) an inhibition region (positive to 0 mV), where activation of K+ channels inhibited the passive membrane response.
Figure 6. Responses of neurones and their ‘somata’ to current injections.
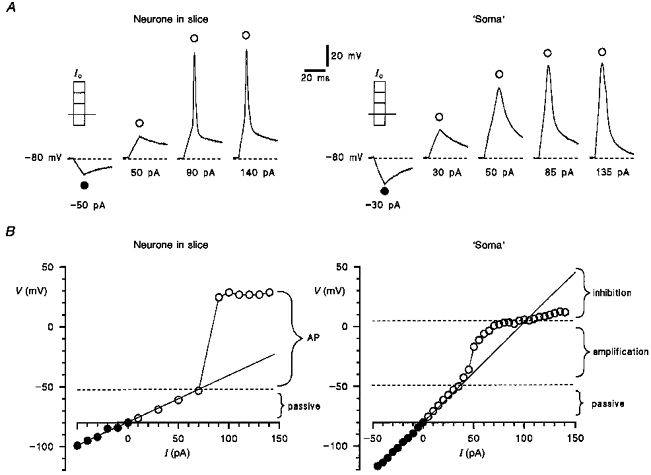
A, voltage responses of an intact neurone in the slice and its isolated ‘soma’ to hyper- and depolarizing 10 ms command current pulses (IC). The membrane potential in neurone and ‘soma’ was kept at -80 mV by injecting a steady-state current. B, V-I plots for an intact neurone in the slice and for its ‘soma’. The maximal deflection of membrane potential in either hyper- (•) or depolarizing direction (○) was plotted as a function of IC.
In the following experiments the responses of the ‘soma’ to depolarizing currents of different strengths were compared with the passive responses (Fig. 7). It can be seen that the response of the ‘soma’ to an injection of a small current (30 pA) was almost identical to the passive response (indicated by a dashed curve). The ‘soma’ response to a stronger current (50 pA) exceeded the corresponding passive response and, thus, it was amplified. In contrast, the response of the ‘soma’ to the strongest current injection (135 pA) was clearly smaller than the passive response indicating an inhibition of strong depolarizations. For comparison, we recorded a subthreshold spontaneous postsynaptic potential and an action potential in this neurone before its ‘soma’ was isolated (Fig. 7). It can be seen that postsynaptic potentials were either in passive or in amplification regions whereas the action potentials with an overshoot of +5 to +40 mV were always in the inhibition region of the V-I plot constructed for the ‘soma’. Therefore, the ‘soma’ will conduct passively or amplify postsynaptic potentials but it will suppress the propagation of action potentials.
Figure 7. Membrane properties of ‘soma’.
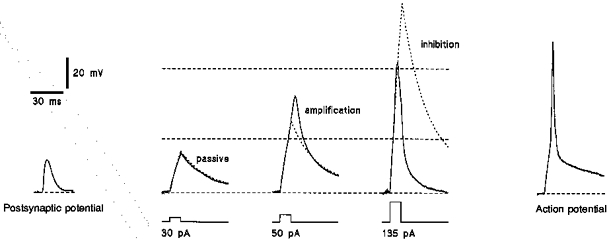
Responses of a ‘soma’ to current pulses of increasing strength. Membrane potential of the ‘soma’ was kept at -80 mV. Passive membrane responses to different depolarizing pulses (dashed curves) were obtained in the following way: five responses to different hyperpolarizing pulses of -10, -20, -30, -40 and -50 mV were divided by factors of 1, 2, 3, 4 and 5, respectively, and then averaged. The averaged response was fitted with two exponentials (one for rising phase and one for decay). This fitted averaged response was supposed to be the passive membrane response to a hyperpolarizing -10 pA pulse. It was multiplied by the factors of -3, -5 and -13.5 giving the passive membrane responses to +30, +50 and +135 pA pulses, respectively. Horizontal dashed lines indicate the borders of passive, amplification and inhibition regions from Fig. 6B. A spontaneous postsynaptic potential and an action potential had been recorded from the same neurone in the slice before its ‘soma’ was isolated.
It should be noted that the overshoot of the action potentials recorded from the soma of intact neurones in the slice (0 to +40 mV, n = 39) was considerably smaller than the expected value of around +57 mV corresponding to the equilibrium potential for sodium (ENa) under present experimental conditions. Therefore it can be assumed that action potentials recorded from the soma of intact neurones in the slice already represented a suppressed form of action potentials generated in the axon initial segment.
DISCUSSION
In this study we used the ESI method (Safronov et al. 1997) to describe the distribution of K+ channels between soma, axon and dendrites of dorsal horn neurones as well as to investigate the functional role of the soma in action potential generation. The presence of a large Na+ current (> 90 % of its original amplitude) in an isolated structure with one process indicated that this process was the axon or its initial segment. All these axons were longer than 25 μm. Somata with shorter axons (not included in the present results) preserved smaller Na+ currents whose amplitudes generally showed a correlation with the length of the axon. Thus, the length of the axon initial segment in a dorsal horn neurone of a newborn rat could be estimated to be 25 μm.
Distribution of K+ channels
Potassium A- and DR-channels were unevenly distributed between soma, axon and dendrites of dorsal horn neurones. The largest portion of A-channels (47 %) is located in the axon initial segment whereas most DR-channels (47 %) are distributed in dendrites. The soma contained 36 % of A-channels but only 15 % of DR-channels. The densities of A- (0.4 per μm2) and DR-channels (0.6 per μm2) estimated using the ESI method for somatic membrane were also confirmed by the single-channel recordings. K+ channel distribution was also supported by comparing the steady-state activation characteristics for whole-cell currents recorded from intact neurones and their isolated ‘somata’ and ‘soma+axon’ complexes. The activation of KA currents in intact neurones reached its saturation suggesting the location of A-channels in adequately voltage-clamped membrane regions, probably in the soma and axon initial segment. In contrast, the activation of KDR currents reached saturation only in isolated ‘somata’ and ‘soma+axon’ complexes, but not in intact neurones in the slice. The simplest explanation for this phenomenon would be a distant location of a large portion of DR-channels in the dendritic membrane which was not sufficiently voltage clamped.
The distribution of K+ channels was quite different from that of inactivating and steady-state Na+ channels (Safronov et al. 1997). The soma contained only 14 % of inactivating Na+ channels, but about 80 % of them were located in the axon. The steady-state Na+ channels were not present in the soma but were almost equally distributed between axon (ca 50 %) and dendrites. Localization of inactivating Na+ channels in the axon hillock or axon initial segment found in many neurones (Catterall, 1981; Boudier et al. 1985; Wollner & Catterall, 1986; Angelides et al. 1988; Safronov et al. 1997) is supposed to play a crucial role in lowering the threshold of the action potential (Coombs et al. 1957a, b; Eccles, 1964). A different distribution of K+ channels described here determines the properties of neuronal soma and dendrites and, therefore, plays an important role in action potential generation.
The role of the soma in action potential generation
Numerous studies of mechanisms of action potential generation in neurones were mostly focused on the role of the axon initial segment (Coombs et al. 1957a, b; Stuart & Sakmann, 1994; Colbert & Johnston, 1996) or, more recently, of apical dendrites (Johnston, Magee, Colbert & Christie, 1996), but only little is known about the role of the neuronal soma. For example, it is still unclear whether the soma itself (without axon) is able to generate action potentials. The lack of such a knowledge originated, probably, from the inability to study the properties of the soma separated from the axon and dendrites. In standard experiments, action potentials generated in the axon initial segment are usually recorded by sharp electrodes inserted into the soma, so that the contributions of soma and axon to membrane depolarization during the action potential could not be distinguished. By means of the ESI method we have recently shown that the isolated soma of dorsal horn neurones possesses only a small portion of Na+ channels and is not able to generate action potentials if the axon is lost (Safronov et al. 1997). In the present study we failed to evoke action potentials in the isolated ‘soma’ even if K+ channels were blocked by TEA and 4-AP. Therefore, it is concluded that the failure of the soma to generate action potentials was not due to the shunting of depolarization by K+ channels, but resulted from the low density of Na+ channels, 1 per μm2 (Safronov et al. 1997) compared with 3-4 per μm2 in the soma of pyramidal neurones (Colbert & Johnston, 1996) or 1000-2000 per μm2 in nodal membrane (Black, Kocsis & Waxman, 1990), and from a relatively large membrane capacitance. Such a conclusion, however, has raised several other questions concerning the function of the soma. Is it a passive structure which can only follow action potentials generated in the axon hillock or does it play a more active role by facilitating or suppressing back-propagation of action potentials from the axon hillock to dendrites? Our present results indicate that the neuronal soma conducts passively or amplifies excitatory postsynaptic potentials but it inhibits action potentials. A simple physiological interpretation could be given to these properties of the soma. It improves the propagation of synaptic potentials from dendrites and soma to the axon initial segment (Stuart & Sakmann, 1995) but suppresses the propagation of action potentials from the axon initial segment to soma and dendrites.
It should be noted that the inhibition of large membrane depolarizations by the soma of an intact neurone may be stronger than that shown in Fig. 6B for an isolated soma. For the V-I plot we measured the peak ‘soma’ depolarization produced by a current pulse which activated simultaneously both Na+ and K+ channels. In an intact neurone, however, excitatory postsynaptic potentials amplified by Na+ channels propagate from dendrites and soma to the axon. Therefore, a fraction of somatic Na+ channels could already be inactivated at the moment of action potential initiation in the axon. These somatic Na+ channels will no longer be able to support active back-propagation of the action potential. Thus, somatic and dendritic non-inactivating K+ DR-channels could produce even stronger inhibition of the action potential.
Role of dendrites in action potential generation
On the basis of our ESI experiments (Safronov et al. 1997, and this study) it can be concluded that dendrites of dorsal horn neurones possess almost no inactivating Na+ channels and only a small proportion (17 %) of K+ A-channels, but they do possess approximately half of the steady-state Na+ channels and K+ DR-channels. This distribution of Na+ and K+ channels can determine the function of dendrites of dorsal horn neurones. Steady-state Na+ channels were activated at potentials positive to -60 mV (Safronov et al. 1997) whereas K+ DR-channels started to activate at -30 to -20 mV (Fig. 3). Thus, dendritic Na+ and K+ channels create a voltage ‘window’ between -60 and -30 to -20 mV in which membrane depolarizations will be amplified. Similarly to the soma, dendrites could conduct passively or amplify excitatory postsynaptic potentials (Schwindt & Crill, 1995) with peak amplitudes below -30 to -20 mV but they will inhibit back-propagating action potentials with peaks exceeding 0 mV.
The present data about the distribution of K+ channels differ in a certain degree from those reported for apical dendrites of hippocampal pyramidal neurones. The apical dendrites showed a high density of A-channels and a lower density of DR-channels (Hoffman, Magee, Colbert & Johnston, 1997). More surprisingly, the density of A-channels increased with distance from the soma. This discrepancy might be explained by the difference in the properties of primary apical dendrites and ‘classical’ dendrites of spinal neurones. In contrast to those of spinal neurones (Safronov et al. 1997), the primary apical dendrites of neocortical pyramidal neurones are equipped with inactivating Na+ channels at densities approximately equal to those in the somatic membrane (Huguenard, Hamill & Prince, 1989; Stuart & Sakmann, 1994; Magee & Johnston, 1995; Johnston et al. 1996) so that soma and apical dendrite are often considered as one relatively uniform compartment (Huguenard et al. 1989). It should also be noted that by applying the ESI method to spinal neurones we have estimated dendritic K+ currents as a relative fraction of total currents, but not the absolute densities of K+ channels, which could be high, especially for DR-channels, if the small diameters (< 0.5 μm) and therefore the small membrane area of dendrites of the dorsal horn neurone were taken into account. Furthermore, we evoked K+ currents in dendrites of the dorsal horn neurone with an electrode placed on its soma and so channels from electrotonically remote dendritic regions might not have experienced applied depolarization and therefore might not have contributed to the current recorded.
Finally, in contrast to pyramidal neurones, in which back-propagation of action potentials from axon to soma and dendrites can play an important role in providing a feed-back link between in- and outcoming signals, the soma and dendrites of spinal neurones seem to have a classical integrative function. They passively conduct or amplify excitatory postsynaptic potentials on their way to the axon but suppress the back-propagation of action potentials from the axon to dendrites. ‘All-or-nothing’ action potentials generated in the axon play a major role in signal propagation, whereas the graded responses of the soma studied here enable the modulation of neuronal activity needed for complex integrative processes.
Acknowledgments
We would like to thank Dr M. E. Bräu, for critically reading the manuscript, Mrs B. Agari and Mr O. Becker for excellent technical assistance. The work was supported by the Deutsche Forschungsgemeinschaft (DFG Vo188/16).
References
- Angelides KJ, Elmer LW, Loftus D, Elson E. Distribution and lateral mobility of voltage-dependent sodium channels in neurons. Journal of Cell Biology. 1988;106:1911–1925. doi: 10.1083/jcb.106.6.1911. 10.1083/jcb.106.6.1911. [DOI] [PMC free article] [PubMed] [Google Scholar]
- Black JA, Kocsis JD, Waxman SG. Ion channel organization of the myelinated fiber. Trends in Neurosciences. 1990;13:48–54. doi: 10.1016/0166-2236(90)90068-l. [DOI] [PubMed] [Google Scholar]
- Boudier JA, Berwald-Netter Y, Dellmann HD, Boudier JL, Couraud F, Koulakoff A, Cau P. Ultrastructural visualization of Na+-channel associated [125I]α-scorpion toxin binding sites on fetal mouse nerve cells in culture. Developmental Brain Research. 1985;20:137–142. doi: 10.1016/0165-3806(85)90097-5. [DOI] [PubMed] [Google Scholar]
- Catterall WA. Localization of sodium channels in cultured neural cells. Journal of Neuroscience. 1981;1:777–783. doi: 10.1523/JNEUROSCI.01-07-00777.1981. [DOI] [PMC free article] [PubMed] [Google Scholar]
- Colbert CM, Johnston D. Axonal action-potential initiation and Na+ channel densities in the soma and axon initial segment of subicular pyramidal neurons. Journal of Neuroscience. 1996;16:6676–6686. doi: 10.1523/JNEUROSCI.16-21-06676.1996. [DOI] [PMC free article] [PubMed] [Google Scholar]
- Connor JA, Stevens CF. Prediction of repetitive firing behaviour from voltage clamp data on an isolated neurone soma. The Journal of Physiology. 1971;213:31–53. doi: 10.1113/jphysiol.1971.sp009366. [DOI] [PMC free article] [PubMed] [Google Scholar]
- Coombs JS, Curtis DR, Eccles JC. The interpretation of spike potentials of motoneurones. The Journal of Physiology. 1957a;139:198–231. doi: 10.1113/jphysiol.1957.sp005887. [DOI] [PMC free article] [PubMed] [Google Scholar]
- Coombs JS, Curtis DR, Eccles JC. The generation of impulses in motoneurones. The Journal of Physiology. 1957b;139:232–249. doi: 10.1113/jphysiol.1957.sp005888. [DOI] [PMC free article] [PubMed] [Google Scholar]
- Eccles JC. The Physiology of Synapses. Berlin, Göttingen, Heidelberg: Springer Verlag; 1964. [Google Scholar]
- Edwards FA, Konnerth A, Sakmann B, Takahashi T. A thin slice preparation for patch clamp recordings from neurones of the mammalian central nervous system. Pflügers Archiv. 1989;414:600–612. doi: 10.1007/BF00580998. [DOI] [PubMed] [Google Scholar]
- Hamill OP, Marty A, Neher E, Sakmann B, Sigworth FJ. Improved patch-clamp techniques for high-resolution current recording from cells and cell-free membrane patches. Pflügers Archiv. 1981;391:85–100. doi: 10.1007/BF00656997. [DOI] [PubMed] [Google Scholar]
- Hille B. Ionic Channels of Excitable Membranes. 2. Sunderland: Sinauer Associates; 1992. [Google Scholar]
- Hodgkin AL, Huxley AF. A quantitative description of membrane current and its application to conduction and excitation in nerve. The Journal of Physiology. 1952;117:500–544. doi: 10.1113/jphysiol.1952.sp004764. [DOI] [PMC free article] [PubMed] [Google Scholar]
- Hoffman DA, Magee JC, Colbert CM, Johnston D. K+ channel regulation of signal propagation in dendrites of hippocampal pyramidal neurons. Nature. 1997;387:869–875. doi: 10.1038/43119. [DOI] [PubMed] [Google Scholar]
- Huguenard JR, Hamill OP, Prince DA. Sodium channels in dendrites of rat pyramidal neurons. Proceedings of the National Academy of Sciences of the USA. 1989;86:2473–2477. doi: 10.1073/pnas.86.7.2473. [DOI] [PMC free article] [PubMed] [Google Scholar]
- Johnston D, Magee JC, Colbert CM, Christie BR. Active properties of neuronal dendrites. Annual Review of Neuroscience. 1996;19:165–186. doi: 10.1146/annurev.ne.19.030196.001121. [DOI] [PubMed] [Google Scholar]
- Llinas RR. The intrinsic electrophysiological properties of mammalian neurons: insights into central nervous system function. Science. 1988;242:1654–1664. doi: 10.1126/science.3059497. [DOI] [PubMed] [Google Scholar]
- Magee JC, Johnston D. Characterization of single voltage-gated Na+ and Ca2+ channels in apical dendrites of rat CA1 pyramidal neurons. The Journal of Physiology. 1995;487:67–90. doi: 10.1113/jphysiol.1995.sp020862. [DOI] [PMC free article] [PubMed] [Google Scholar]
- Safronov BV, Vogel W. Single voltage-activated Na+ and K+ channels in the somata of rat motoneurones. The Journal of Physiology. 1995;487:91–106. doi: 10.1113/jphysiol.1995.sp020863. [DOI] [PMC free article] [PubMed] [Google Scholar]
- Safronov BV, Wolff M, Vogel W. Functional distribution of three types of Na+ channel on soma and processes of dorsal horn neurones of rat spinal cord. The Journal of Physiology. 1997;503:371–385. doi: 10.1111/j.1469-7793.1997.371bh.x. [DOI] [PMC free article] [PubMed] [Google Scholar]
- Sakmann B, Neher E. Geometric parameters of pipettes and membrane patches. In: Sakmann B, Neher E, editors. Single-Channel Recording. 2. New York: Plenum Press; 1995. [Google Scholar]
- Schwindt PC, Crill WE. Amplification of synaptic current by persistent sodium conductance in apical dendrite of neocortical neurons. Journal of Neurophysiology. 1995;74:2220–2224. doi: 10.1152/jn.1995.74.5.2220. [DOI] [PubMed] [Google Scholar]
- Stuart GJ, Dodt H-U, Sakmann B. Patch-clamp recordings from the soma and dendrites of neurons in brain slices using infrared video microscopy. Pflügers Archiv. 1993;423:511–518. doi: 10.1007/BF00374949. [DOI] [PubMed] [Google Scholar]
- Stuart GJ, Sakmann B. Active propagation of somatic action potentials into neocortical pyramidal cell dendrites. Nature. 1994;367:69–72. doi: 10.1038/367069a0. [DOI] [PubMed] [Google Scholar]
- Stuart GJ, Sakmann B. Amplification of EPSPs by axosomatic sodium channels in neocortical pyramidal neurons. Neuron. 1995;15:1065–1076. doi: 10.1016/0896-6273(95)90095-0. [DOI] [PubMed] [Google Scholar]
- Takahashi T. Membrane currents in visually identified motoneurones of neonatal rat spinal cord. The Journal of Physiology. 1990;423:27–46. doi: 10.1113/jphysiol.1990.sp018009. [DOI] [PMC free article] [PubMed] [Google Scholar]
- Wollner DA, Catterall WA. Localization of sodium channels in axon hillocks and initial segments of retinal ganglion cells. Proceedings of the National Academy of Sciences of the USA. 1986;83:8424–8428. doi: 10.1073/pnas.83.21.8424. [DOI] [PMC free article] [PubMed] [Google Scholar]