Abstract
The respiratory centre of neonatal mice (4 to 12 days old) was isolated in 700 μm thick brainstem slices. Whole-cell K+ currents and single ATP-dependent potassium (KATP) channels were analysed in inspiratory neurones.
In cell-attached patches, KATP channels had a conductance of 75 pS and showed inward rectification. Their gating was voltage dependent and channel activity decreased with membrane hyperpolarization. Using Ca2+-containing pipette solutions the measured conductance was lower (50 pS at 1.5 mM Ca2+), indicating tonic inhibition by extracellular Ca2+.
KATP channel activity was reversibly potentiated during hypoxia. Maximal effects were attained 3-4 min after oxygen removal from the bath. Hypoxic potentiation of open probability was due to an increase in channel open times and a decrease in channel closed times.
In inside-out patches and symmetrical K+ concentrations, channel currents reversed at about 0 mV. Channel activity was blocked by ATP (300-600 μM), glibenclamide (10-70 μM) and tolbutamide (100-300 μM).
In the presence of diazoxide (10-60 μM), the activity of KATP channels was increased both in inside-out, outside-out and cell-attached patches. In outside-out patches, that remained within the slice after excision, the activity of KATP channels was enhanced by hypoxia, an effect that could be mediated by a release of endogenous neuromodulators.
The whole-cell K+ current (IK) was inactivated at negative membrane potentials, which resembled the voltage dependence of KATP channel gating. After 3-4 min of hypoxia, K+ currents at both hyperpolarizing and depolarizing membrane potentials increased. IK was partially blocked by tolbutamide (100-300 μM) and in its presence, hypoxic potentiation of IK was abolished.
We conclude that KATP channels are involved in the hypoxic depression of medullary respiratory activity.
Mammals react to acute hypoxia with a biphasic change in respiration, consisting of an initial augmentation followed by a secondary depression (Cherniack, Edelman & Lahiri, 1970; Haddad & Mellins, 1984; Trippenbach, Richter & Acker, 1990; Richter, Bischoff, Anders, Bellingham & Windhorst, 1991; Sun & Reis, 1994; Richter & Ballanyi, 1996). The hypoxic response observed in neurones is also biphasic (cf. Rosen & Morris, 1993; Mercuri, Bonci, Johnson, Stratta, Calabresi & Bernardi, 1994; Luhmann & Heinemann, 1994; Nieber, Sevcik & Illes, 1995), suggesting a common pattern of hypoxic reaction within the CNS. The mechanisms which underlie both augmentation and depression are as yet unclear. Since inhibition of electrical activity lowers metabolic demands and helps to overcome O2 deprivation, hypoxic depression could be considered as a protective mechanism rather than indicating severe disruption of neuronal functions.
Recent advances in preparation techniques for the isolated respiratory centre, or pre-Bötzinger complex (Smith, Ellenberger, Ballanyi, Richter & Feldman, 1991), opened up the possibility of studying the neural mechanisms of respiratory rhythm generation and the pathways of its modulation in isolation. In slices that show spontaneous rhythmic activity (Smith et al. 1991; Ramirez, Quellmalz & Richter, 1996), the influences of peripheral chemoreceptors or more rostral nervous structures that contribute to the respiratory hypoxic response, are excluded. This study aimed to investigate hypoxic changes in the activity of ATP-dependent potassium (KATP) channels in inspiratory neurones. K+ conductances set the neuronal excitability of respiratory neurones in vivo (Champagnat & Richter, 1994), thus controlling the processes of generation and maintenance of the rhythm. A small elevation of extracellular K+ leads to neuronal depolarization, which stabilizes respiratory activity in vitro (Smith et al. 1991; Ramirez et al. 1996), but K+ channels can hyperpolarize respiratory neurones, which leads to hypoxic depression. In other neurones, hypoxic hyperpolarization is mediated by activation of a Ca2+-dependent conductance due to Ca2+ mobilization from intracellular stores (Belousov, Godfraind & Krnjevic, 1995; Yamamoto, Tanaka & Higashi, 1997) and/or by ATP-sensitive K+ channels (Zhang & Krnjevic, 1993; Trapp & Ballanyi, 1996; Fujimura, Tanaka, Yamamoto, Shigemori & Higashi, 1997). Both types of channels are present in respiratory neurones in vivo. Ca2+-activated conductances experience phasic modulation during each respiratory cycle due to changes in intracellular [Ca2+] (Richter, Champagnat, Jacqiun & Benacka, 1993), and the discharge patterns of respiratory neurones are modified after the pharmacological modulation of KATP channels (Pierrefiche, Bischof & Richter, 1996). In the present study, the effects of hypoxia were examined in inspiratory neurones of the pre-Bötzinger complex of neonatal mice. During hypoxia, whole-cell K+ currents and activity of single KATP channels reversibly increased, indicating that these effects contribute to hypoxic depression of the respiratory network.
METHODS
Slice preparations
Experiments were performed on medullary slice preparations from neonatal mice, following the approach developed for rats (Smith et al. 1991) and mice (Ramirez et al. 1996). This preparation contains a functional respiratory network and generates on-going rhythmic activity. Briefly, neonatal mice (4 to 12 days old) were deeply anaesthetized with ether, decorticated and decerebrated at the C3-C4 spinal level. The neuraxis was isolated by dissection in ice-cold artificial cerebrospinal fluid (ACSF; for composition see below) which was saturated with carbogen (95 % O2 and 5 % CO2). The cerebellum was removed and the brainstem-spinal cord fixed with acrylic glue onto an agar block, ventral surface upwards. The block was mounted in the vise of a vibratome bath (Campden Instruments, Loughborough, UK) containing ice-cold ACSF that was continuously bubbled with carbogen. The brainstem was sectioned serially in a rostral to caudal direction in the transverse plane with an angle of 135 deg between the vibratome blade and the neuraxis. When the rostral boundary of the pre-Bötzinger complex was reached, as identified by specific cytoarchitectonic landmarks such as the inferior olive (IO), nucleus tractus solitarii (NTS), hypoglossal nucleus (XII) and nucleus ambiguus (NA) and by disappearance of the facial nucleus, a single thick transverse slice (650-750 μm) was cut. The slice was transferred to a recording chamber and put on a nylon mesh overlaid with a threaded home-made platinum-iridium ‘horse-shoe’ (Edwards, Konnerth, Sackman & Takahashi, 1989) for mechanical stabilization. The slice was continuously superfused with ACSF at 28°C. One rootlet was sucked into a blunt glass pipette for extracellular recording of hypoglossal (XII) nerve activity, which was used as a monitor of central respiratory rhythm (Smith et al. 1991).
The reduced brainstem slice preparation lacks several factors that might be important for maintenance of the respiratory rhythm as it occurs in vivo. Perhaps the most important is a tonic drive from the reticular formation. In order to simulate such persistent excitatory input, bath K+ concentration was elevated in 1 mM steps (each lasting 10-15 min). For most preparations, a stable rhythm (up to 14 h) was obtained at an extracellular K+ concentration of 8-10 mM. Data presented here were obtained from pre-Bötzinger complex inspiratory neurones collected in forty-six rhythmic slices.
For maintenance of the respiratory rhythm it was absolutely necessary to superfuse the thick slice at a fast rate (> 25 ml min−1), otherwise respiratory activity subsided irreversibly within 1-2 h. The standard solution with elevated K+ concentration was recycled into a 200 ml reservoir equilibrated with 95 % O2 (N2) and 5 % CO2. In order to prevent loss of dissolved gases, the perfusing solution was delivered through stainless-steel tubing. All drugs were added directly to the reservoir and arrived at the experimental chamber after a delay of 8-12 s. Drug washout was achieved by perfusing 400-500 ml fresh solution containing the same [K+]o.
Tissue oxygen pressure was measured using oxygen-sensitive electrodes (tip diameter, 10-20 μm) connected to a chemical microsensor meter (Diamond Electro-Tech Inc., Ann Arbor, MI, USA). Before measurements, the PO2-sensitive electrode was polarized for 1 h by passing a current of -750 nA and calibrated in the perfusion chamber using two ACSF solutions saturated with carbogen or a gas mixture containing 95 % N2, 5 % CO2 and 1 mM Na2S2O3 to determine a zero oxygen level. It was assumed that the calibration curve between the two points was linear. The oxygen-sensitive electrode was gently driven into the tissue using a piezomanipulator (SPI, Oppenheim, Germany). At about 100 μm below the slice surface, within a layer where most respiratory neurones were intact, mean PO2 was 200 ± 50 mmHg. In order to induce hypoxic conditions in the slice, the bubbling gas mixture was changed from carbogen to 95 % N2-5 % CO2. Within 15-20 s after the beginning of hypoxia, mean PO2 decreased and remained at 3 ± 3 mmHg. The responses to hypoxia for a given slice were readily reproducible and could be performed 20-30 times with a complete restoration of rhythmic activity even when O2 had been removed for 20-30 min.
Electrophysiological recordings
Inspiratory output activity, used to monitor respiratory rhythm in the slices, was recorded unilaterally with a suction electrode applied to the cut end of the hypoglossal (XII) rootlets. Recording electrodes were made from broken patch pipettes with fire-polished tips (5-10 μm opening). When the activity of one rootlet declined during the course of an experiment, it was possible to take the rootlet on the other side to verify persistence of the central respiratory rhythm. It also happened that the rootlet(s) detached from the slice, but in these cases rhythmic respiratory activity could be monitored by recording from the exit site of XII rootlets. Signals were amplified 20 000 times, band-pass filtered (0.1-3 kHz), rectified and low-pass filtered (50-100 ms time constant).
Patch electrodes were manufactured from borosilicate glass (Clarke Electromedical, Pangbourne, UK), had tip openings of 1.5-2 μm and a resistance of 2-4 MΩ. Intracellular signals were fed to an EPC-7 patch-clamp amplifier (ESF, Friedland, Germany). Junction potentials were compensated before seal formation. Patch electrodes were advanced into the slice by a nanostepper until spiking of a particular respiratory neurone was recorded extracellularly. Neurones were thus identified functionally by correlating their discharge with XII nerve rhythmic activity. In about 80 % of all trials, gentle sucking led to the formation of a gigaseal (generally higher than 2 GΩ). Thereafter, spikes sharpened and were seen as large deflections (Fig. 1A). After rupturing the plasma membrane, a whole-cell configuration was obtained. Spike discharges were then blocked and replaced by synaptic drive currents (Fig. 1B). Depending on the previous recording configuration, withdrawal of the patch pipette often resulted in the formation of inside-out or outside-out patches.
Figure 1. Identification of inspiratory neurones in the rhythmic brainstem slice.
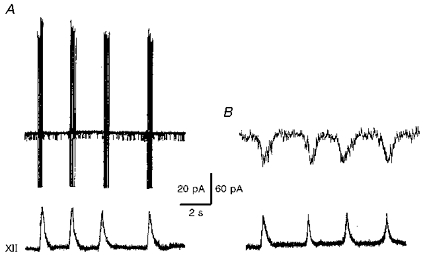
Recordings were made first in cell-attached (A) and then in whole-cell (B) mode. Membrane currents (upper traces) were recorded at holding potentials of 0 mV (A) and -50 mV (B). Lower traces show integrated hypoglossal (XII) nerve activity.
Only data obtained from inspiratory neurones are presented here. For other cell types, e.g. expiratory and tonically active neurones, spikes occurred too frequently and masked single-channel openings, which complicated analysis of the single channels. In inspiratory neurones, spike activity was absent during interburst intervals, which lasted for 2 to 10 s depending on the experimental conditions. Therefore most data (except Figs 1 and 2) were measured during the time windows between inspiratory bursts. For quantitative analysis, currents were also evaluated only during interburst periods.
Figure 2. Response of the respiratory network and inspiratory neurones to hypoxia.
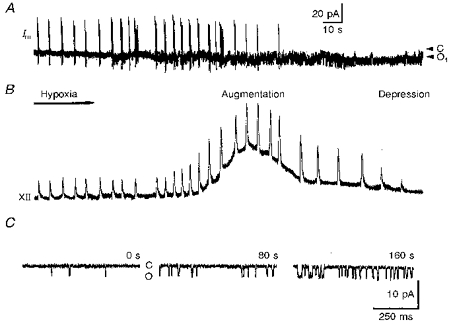
The recordings show membrane currents (Im) in cell-attached mode measured at a holding potential of 0 mV (A) and integrated hypoglossal (XII) nerve activity (B). The spike discharges of the inspiratory neurone (sharp vertical deflections in A) correlate with respiratory bursts in the XII nerve. Note the inhibition of spike discharges and activation of channels already starting after 1 min of hypoxia. Two arrowheads in A denoted as C and O1 indicate the closed and first open channel levels, respectively. The pipette solution contained 125 mM KCl and no Ca2+. B shows recordings starting with the beginning of hypoxia, which lasted for 5 min. Augmentation and depression define two phases of hypoxic respiratory response. C, representative traces showing single-channel activity as measured at a patch holding potential of 0 mV during control (left trace), augmentation (middle trace) and depression (right trace) at the times indicated.
In whole-cell measurements, series resistance (Rs), input resistance (RN), and whole-cell capacitance were measured using a 10 mV depolarization. Rs was 16.5 ± 1.5 MΩ, indicating that the voltage error caused by Rs will be 1.7 mV for currents of 100 pA. Therefore, Rs compensation (80 %) was used only for larger currents. The mean input resistance was 350 ± 42 MΩ and the mean capacitance was 32 ± 2 pF. Whole-cell currents were not leak corrected, since at resting membrane potentials, KATP channels had an almost linear I-V relationship (Fig. 3) and contributed to RN. The resting potentials of inspiratory neurones measured in current-clamp mode using a ‘low-chloride’ intracellular solution (see below) ranged from -53 to -67 mV (mean, -60 ± 4 mV, n = 31).
Figure 3. Characteristics of K+ channels activated by hypoxia.
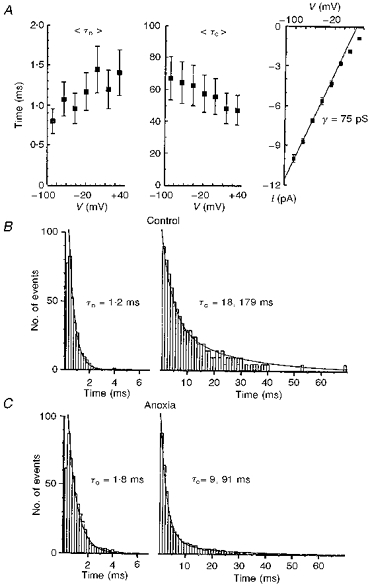
A, the voltage dependencies of mean open (τo) and closed (τc) times, and the I-V curve for single-channel currents. The pipette solution contained 125 mM KCl without Ca2+. The patch holding voltages are given on the x- axis. The extrapolated reversal potential was +60 mV, which corresponded to an actual membrane potential of 0 mV if the measured resting potential (-60 mV) was taken into account. Points represent mean values averaged for 8 different patches with vertical bars indicating ± s.e.m.B and C, histograms of open (left) and closed (right) channel times obtained for a cell-attached patch at a holding potential of 0 mV. Mean lifetimes were not corrected for missed events. Time distributions were approximated by single or double exponentials with the open and closed time constants as shown. For the closed times, the ratios of fast to slow exponentials in the approximating function were 2:1 (B) and 10:1 (C), respectively.
Membrane currents were filtered at 3 kHz (-3 dB), digitized at 5 kHz, and stored for analysis using an IBM-compatible PC. Data evaluation was performed using self-written programs on Turbo-Pascal 7.0. Data are presented as means ± s.e.m. Statistical significance was determined using Student's t test; results were considered significant if P≤ 0.05. In the presentation of single-channel data, the current and patch command potentials were inverted, i.e. their values were taken as inside the cell minus outside, according to the conventions for intracellular recordings.
Solutions and drugs
ACSF contained (mM): 128 NaCl, 3 KCl, 1.5 CaCl2, 1.0 MgSO4, 21 NaHCO3, 0.5 NaH2PO4, 30 D-glucose. The pH was adjusted to 7.4 with NaOH. Solutions with elevated K+ (8-10 mM) were obtained by replacing NaCl with KCl. For single-channel recordings, the pipette solution contained (mM): 125 KCl, 15 NaCl, 2 MgCl2, 10 Hepes, 1 CaCl2, 3 BAPTA. When used for whole-cell recordings this solution is referred to as the ‘high-chloride’ solution. Single-channel recordings were also made (as indicated in the text) with a pipette solution containing (mM): 131 KCl, 1.5 CaCl2, 1.0 MgSO4, 21 NaHCO3, 0.5 NaH2PO4, 30 D-glucose. For whole-cell recordings, the pipette solution denoted as ‘low chloride’ contained (mM): 125 potassium gluconate, 15 NaCl, 2 MgCl2, 10 Hepes, 1 CaCl2, 3 BAPTA. For all pipette solutions the pH was adjusted to 7.4 with KOH and had an osmolarity of 285-290 mosmol l−1. All salts used for extra- and intracellular solutions were obtained from Sigma. TTX and K+ channel blockers (tetraethylammonium (TEA), 4-aminopyridine, charybdotoxin, iberiotoxin, diazoxide, tolbutamide and glibenclamide) were purchased from Alomone Labs (Israel).
RESULTS
Respiratory response to hypoxia
The reaction of the respiratory centre to hypoxia in vitro consists of an initial augmentation and a secondary depression. On the peak of hypoxic augmentation the mean interval between XII nerve burst discharges decreased to 3.4 ± 0.3 s in comparison with a control value of 5.0 ± 0.5 s (N = 46; here and below, N and n correspond to the number of slices and inspiratory neurones measured, respectively). At the same time, the amplitude of inspiratory bursts increased by a factor of 2.1 ± 0.2. As shown in Fig. 2B, the increase in inspiratory burst frequency occurred about 1 min after the beginning of hypoxia (mean, 46 ± 5 s). Taking into account that there is a dead time for the establishment of low tissue oxygen pressure in the slice (< 20 s, see Methods), this means that the relevant processes are activated with a delay greater than 25 s.
Enhancement of the burst rate was superimposed on a slowly developing DC signal in integrated XII nerve discharge (Fig. 2B), which had a half-width ranging from 30 to 50 s (mean, 42 ± 7 s, N = 46). Such tonic activation is specific for hypoglossal motoneurones (Haddad & Donnelly, 1990).
When hypoxia persisted, depression became evident by a decrease in inspiratory burst frequency and, finally, the arrest of the rhythm (Fig. 2A and B). When the oxygen supply was restored, respiratory activity did not recover immediately. It took, on average, 200 ± 23 s (N = 46) for the rhythm to reappear. We did not notice any deleterious effects of brief (10-20 min) periods of hypoxia on the lifespan of the slice. Therefore it was possible to apply twenty to thirty hypoxic episodes without any noticeable deterioration. This demonstrates the robustness to hypoxia of the isolated respiratory network of the neonatal mouse.
K+ channels are potentiated by hypoxia
The activity of single K+ channels in inspiratory neurones increased during hypoxia (Fig. 2A and C). The effect developed slowly, matching the time course of hypoxic depression. On average, 3 min after oxygen removal the open probability (Po) increased from 0.07 ± 0.04 to 0.21 ± 0.09 (n = 26; all Po values were obtained as the mean current for a particular sweep divided by the unitary current and the number of active channels which was estimated from the maximal current level seen in a given experiment).
There was no channel activity when K+ was replaced by 80 mM Cs+ and 40 mM TEA in the pipette solution (n = 17), which excludes involvement of non-selective cationic channels. Channels with similar characteristics were recorded using pipette solutions in which KCl was replaced by potassium methanesulphonate (n = 15). This proves that they did not belong to a class of Cl−-permeable channels. The selectivity of channels to K+ was also confirmed by the observation that in excised patches, the channel current reversed at the K+ equilibrium potentials (Figs 5 and 6).
Figure 5. ATP block of KATP channels in inside-out patches.
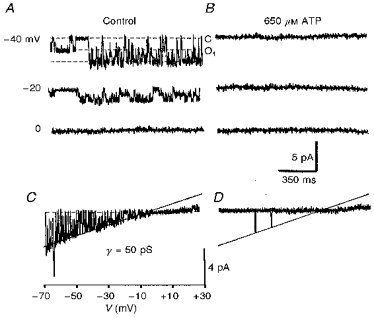
Recordings were made in control solutions (A and C) and 3 min after ATP application (B and D). The holding potentials are indicated near each trace in A. Dotted lines show closed (C) and first open levels (O1). C and D, I-V relationships for the same patch obtained using a ramp protocol. The recording pipette contained 133 mM KCl and 1.5 mM Ca2+. The straight line corresponds to a channel conductance (γ) of 50 pS. Note that the channel current deviates from the straight line at positive potentials, indicating inward rectification.
Figure 6. KATP channels in outside-out patches are less sensitive to oxygen withdrawal.
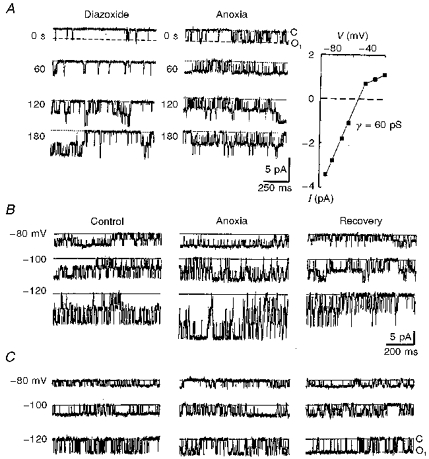
The pipette solution contained 125 mM KCl without Ca2+ (see Methods). A, the actions of diazoxide and subsequent hypoxia on an outside-out patch located 75 μm below the slice surface. The records were obtained at a holding potential of -70 mV at different times (as indicated) after starting the corresponding test. The open probabilities were obtained as averages of 10 sweeps each lasting 2 s. Mean Po values were 0.05 ± 0.02 (control), 0.23 ± 0.05 (5 min after diazoxide addition to the bath) and 0.28 ± 0.06 (after 3 min hypoxia). The righthand panel in A shows the I-V relationship. The bath contained 12 mM K+ and the theoretical reversal potential for K+ was -58 mV. The interpolated reversal potential for single-channel current was -53 mV. In B and C, channels were measured in control, 3 min after hypoxia and 5 min after restoration of oxygen levels. The patch holding potentials are indicated for each trace at the lefthand side. Dotted lines indicate the closed channel levels. After excision from the cell, but still located 100 μm beneath the slice surface, the hypoxic response of KATP channels was evident (B), while the same patch became insensitive to hypoxia when it was moved to 100 μm above the slice surface (C).
Properties of hypoxia-sensitive K+ channels
Figure 3 summarizes the voltage- and time-dependent properties of hypoxia-activated K+ channels. At positive command voltages larger than +40 mV, i.e. positive to -20 mV in terms of assumed membrane potential, the single-channel current showed deviations from a linear voltage dependence, indicating inward rectification (Fig. 3A; see also Figs 5C and 6A). The linear part corresponded to a channel conductance (γ) of 75 pS. When Ca2+-containing pipette solutions were used, the channel conductance was 50 pS (n = 23; Fig. 5C). Channel gating was weakly voltage dependent in that the mean open time increased and mean closed time decreased with membrane depolarization (Fig. 3A). These effects can be responsible for inactivation of KATP channels at negative potentials (see below).
At resting membrane potentials, the distribution of open times can be described by a single exponential. The closed time distribution was best fitted by two exponentials with time constants differing by an order of magnitude (Fig. 3B and C). Their voltage dependence was not analysed since many sweeps would have been necessary to obtain the slow time constant at all voltages, and because long closures were also masked by inspiratory bursts of spikes. At resting membrane potential, the ratio of weights of the fast to the slow exponential components was 2.1 ± 0.2 (n = 6). During hypoxia, long closures occurred rarely (Figs 2 and 3) and the above ratio increased to 9.5 ± 0.9 (n = 6).
Under hypoxic conditions, channel conductance remained unchanged and only channel gating was modified. The open time constant (τo) increased and the closed time constants (τc) decreased (Fig. 4B and C). Both effects resulted in an increase in open probability. The simplest kinetic scheme which would satisfy such behaviour contains at least two closed states (C1 and C2) and one open state (O):
for which Po = 1/[1 + (k4/k3)(1 +k2/k1)] (cf. Brown, Lux & Wilson, 1984). When transitions between the two closed states are slower than those between the open and the second closed state, i.e. k3, k4 >> k1, k2, which is usually the case for most ion channels, then τo = 1/k3, τc1 = 1/k4, τc2 = 1/k2+τc1 (1 +k4/k3) ≪ 1/k2, Po≪ 1/[1 +k4/k3] = 1/[1 +τc1/τo].
Figure 4. Pharmacological properties of KATP channels with 75 pS conductance in Ca2+-free pipette solution.
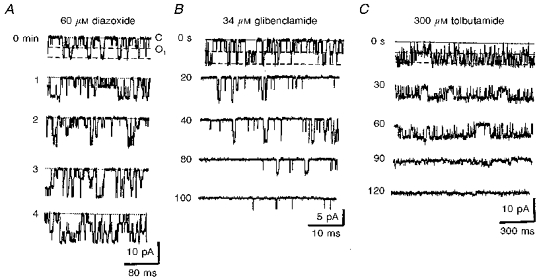
Drugs were applied at the beginning of each recording and representative traces are shown at the times indicated. The dotted lines indicate the closed level and dashed lines indicate the open levels. A, time course of diazoxide action. Patch holding potential, 0 mV. B and C, two representative experiments of KATP channel inhibition in inside-out patches by tolbutamide (B) and glibenclamide (C) at holding potentials of -25 and -40 mV, respectively. The data shown in B and C were obtained in patches that had not been subjected to any prior treatment.
At resting membrane potential, the control values were τo = 1.2 ms and τc1 = 18 ms (Fig. 3), which gave a Po of 0.06. During hypoxia, τo was 1.8 ms and τc1 was 9 ms, which gave a Po of 0.17. These values are consistent with measured changes in Po during hypoxia. The actual behaviour of KATP channels is likely to be more complicated and this model must be extended and modified in future. The kinetic scheme must include the voltage dependence of the rate constants as well as some slower processes (see below).
Pharmacological identification of KATP channels
The observed K+ channels had a large conductance, therefore the list of possible candidates could be restricted to KATP or Ca2+-activated K+ channels. The latter possibility was excluded, because channel activity declined steadily and was not enhanced after excision of the patch to the bath containing millimolar amounts of Ca2+. In outside-out patches, the channels were neither blocked by charybdotoxin nor by iberiotoxin (both at 100 nM, n = 4).
Diazoxide (10-60 μM), a specific KATP channel opener, markedly enhanced the activity of K+ channels in cell-attached patches (Fig. 4A). Appearance of new channels reflected recruitment of previously inactive channels. At resting potentials (holding potential, 0 mV), Po increased from 0.07 ± 0.05 to 0.24 ± 0.11 (n = 11). The effect of diazoxide developed after a few minutes, which was accounted for by diffusion of the drug across the membrane. The channels activated by diazoxide could be further potentiated by hypoxia and vice versa (n = 4 for both protocols, data not shown). After 3 min of hypoxia, mean Po for diazoxide-activated channels increased further from 0.22 ± 0.08 to 0.41 ± 0.11 (n = 11). The activity remained enhanced even after 30 min of single drug application and subsequent washout, and three to four channels (mean, 3.4 ± 0.5, n = 14) were usually observed in cell-attached patches whereas in control conditions no more than two simultaneously active channels were seen (mean, 1.5 ± 0.2, n = 42). In the presence of diazoxide, the number of active channels was unchanged during the ensuing hypoxic episode.
The effects of hypoxia were specific for channels with large conductances. In inspiratory neurones, channels with lower conductances (20 pS at symmetrical K+ concentrations) and voltage-independent gating were also observed (n = 24; data not shown). Neither diazoxide nor hypoxia was able to affect the activity of these channels.
KATP channel blockers such as tolbutamide (100-300 μM) and glibenclamide (10-70 μM) suppressed the channel activity in inside-out patches (Fig. 4B and C). On average, 200 μM tolbutamide decreased Po from 0.12 ± 0.06 to 0.02 ± 0.01 (n = 5) and 50 μM glibenclamide lowered Po from 0.29 ± 0.05 to 0.03 ± 0.01 (n = 6). Sulphonylureas were not applied during hypoxia, since the effects of oxygen withdrawal could not be observed in inside-out patches (see below). The data presented in Fig. 4B and C were obtained in inside-out patches not subjected to any prior treatment. In inside-out patches, KATP channels activated by diazoxide were also blocked by sulphonylureas (n = 4; data not shown). In cell-attached patches, tolbutamide and glibenclamide were less active: when applied at similar concentrations, the channels were blocked within 5-10 min, but the inhibition was much weaker than in inside-out patches (n = 6; data not shown).
In excised patches, KATP channels were stable for 5-15 min (mean, 8 ± 4 min; n = 32). In inside-out patches, submillimolar amounts of ATP decreased the channel activity (Fig. 5). Po decreased to 80 ± 5 % and 8 ± 4 % of control values in the presence of 200 μM and 1 mM ATP, respectively (n = 5). However, due to run-down, the activity of KATP channels was never restored completely when ATP was washed out.
The effects of hypoxia on KATP channels in outside-out patches
We next examined whether hypoxic effects could be mediated by an oxygen-sensing channel site such as suggested for K+ channels in glomus cells (Lopez-Barneo, 1996). In outside-out patches, diazoxide enhanced the activity of KATP channels (Fig. 6A). Note that these channels also revealed inward rectification (Fig. 6A). Their Po values increased from 0.06 ± 0.03 to 0.21 ± 0.06 (n = 9), but their O2 sensitivity was much less prominent. After 3 min of hypoxia, Po changed from 0.23 ± 0.05 to 0.29 ± 0.07 (n = 9).
It was found that hypoxia activated KATP channels in outside-out patches only when they remained within a slice. When the patch was excised from the cell, but left within the slice, hypoxia increased channel activity (Fig. 6B). For five other outside-out patches, located 100-150 μm below the slice surface, Po changed from 0.11 ± 0.06 to 0.18 ± 0.09 (P≤ 0.05) after 4 min of oxygen depletion. However, when the patch was moved outside the slice 100-150 μm above its surface, the channels did not sense hypoxia at all (Fig. 6C); the mean values of Po were 0.09 ± 0.04 and 0.11 ± 0.05 under control conditions and after 4 min of hypoxia, respectively (P≤ 0.05, n = 6).
Voltage-dependent gating of KATP channels
The gating of KATP channels was dependent on the patch voltage such that τo increased and τc decreased with membrane depolarization (Fig. 3A). The voltage-dependent closure and opening of the channels is shown in Fig. 7; the activity diminished at the end of the hyperpolarizing command pulses and then slowly increased again during the positive voltage steps. Ensemble averages of channel activity also showed the same tendency for KATP channels to inactivate at negative voltages.
Figure 7. Voltage-dependent gating of single KATP channels.
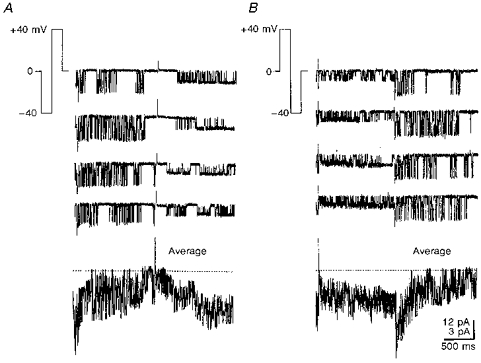
Records of channel activity obtained by shifting the patch holding potential to ± 40 mV using pulse protocols shown in the insets of A and B. At these potentials, all single-channel currents were inward. The lowest traces show the ensemble average of 16 single-channel records. Note the two different calibration scales for single-channel (top) and ensemble (bottom) currents. The recording pipette contained 125 mM K+ without Ca2+. For ensemble averages, the horizontal dotted lines indicate a zero current.
Whole-cell K+ currents and their modulation by hypoxia
Whole-cell K+ currents also demonstrated voltage-dependent kinetics and during hyperpolarizing steps the currents were slowly inactivated (Fig. 8A). This was not due to the charging of membrane capacitance, since only brief transients were observed after stepping back to the holding potential. The currents evoked by depolarization (IKd) and hyperpolarization (IKh) had similar forms and magnitudes when recorded with the low-chloride and high-chloride intracellular solutions (see Methods), but both were about 10-fold smaller when pipette solutions contained caesium gluconate (n = 12; data not shown). This indicated that both currents were mediated by K+-permeable channels and IKh did not correspond to the non-selective current Ih, which is activated by hyperpolarization (Pape, 1996). We saw this current in about 10 % of all cells examined (n = 14). Interestingly, Ih was reversibly inhibited by oxygen withdrawal (data not shown, but see also Duchen, 1990).
Figure 8. Hypoxic potentiation of whole-cell K+ currents is abolished by tolbutamide.
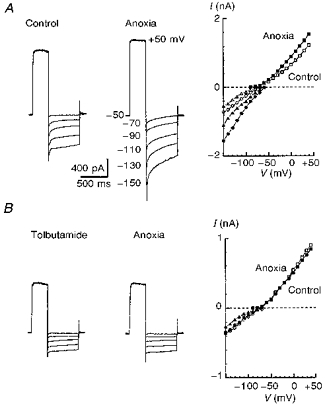
Whole-cell currents were recorded in the presence of 1 μM TTX to block fast Na+ currents and on-going synaptic activity. The membrane was first depolarized from -50 to +50 mV and then hyperpolarized to potentials indicated in the second panel in A. Whole-cell currents were recorded before and after 4 min of hypoxia (A). The recordings were repeated 10 min after addition of 300 μM tolbutamide (B). In the righthand parts of both A and B, I-V relationships are shown for the peak (circles) and steady-state currents (triangles). Peak currents activated by applying depolarizing steps from -100 mV (original traces not shown) are indicated by squares. Open and filled symbols correspond to currents measured before and after hypoxia, respectively. Note a 2-fold difference in current scales in plotting I-V relationships in A and B.
After 3-4 min of hypoxia, the whole-cell K+ currents increased (Fig. 8A), an effect that was fully reversed after 5 min of reoxygenation (data not shown). Relative changes showed no apparent voltage dependence, but IKh was enhanced by hypoxia more than IKd. IKd measured for nine neurones as a steady-state current at a membrane voltage of +50 mV increased after 4 min of hypoxia by 21 ± 6 %, while IKh measured as a steady-state current at a membrane voltage of -130 mV increased by 55 ± 9 %. Both IKh and IKd were suppressed by tolbutamide, but again to a different extent. For seven neurones in the presence of 300 μM tolbutamide the mean amplitude of IKd measured was 83 ± 4 % of control amplitude at +50 mV, while the mean amplitude of IKh measured as a steady-state current at a membrane voltage of -130 mV was 51 ± 3 % of the control value. In the presence of tolbutamide, no changes in IK during hypoxia could be recorded (Fig. 8B). The time course of IKh was best fitted by two exponentials (Fig. 9A), whose voltage dependence is shown in Fig. 9B and C.
Figure 9. The time courses of whole-cell K+ currents at hyperpolarized membrane potentials.
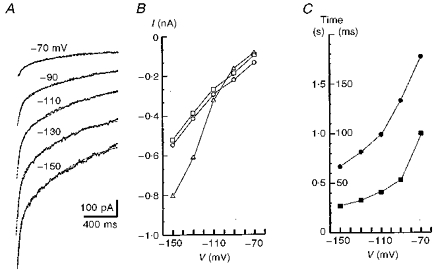
A, current traces measured after 4 min of hypoxia. The records were obtained after a 400 ms long prepulse to +50 mV (see Fig. 8) at potentials indicated near each trace. The dashed lines show the approximation of currents by a double-exponential function plus a constant term. B,○ and □ show the weights of slow and fast exponentials, respectively and ▵ indicates the offset value (steady-state current) in the approximating function. C,• and ▪ show the time constants for slow and fast exponentials, respectively (corresponding time scales are to the left and right of the y-axis). Presented are mean values averaged for 4 cells and standard deviations have been omitted for clarity.
DISCUSSION
The biphasic changes in respiratory rhythm induced by hypoxia as observed in the present study are similar to those obtained previously in in vivo and in vitro preparations (Cherniack et al. 1970; Haddad & Mellins, 1984; Haddad & Donnelly, 1990; Trippenbach et al. 1990; Richter et al. 1991; Sun & Reis, 1994; Ramirez, Quellmalz & Wilken, 1997). In this paper we have tried to find an explanation for the secondary depression. As one of the inhibitory mechanism(s) activated by hypoxia we propose KATP channels, since they are activated on a time scale that matches the development of hypoxic depression. During hypoxia the whole-cell K+ current in inspiratory neurones increased and this effect could be blocked by tolbutamide.
Properties of KATP channels in inspiratory neurones
KATP channels belong to the family of inward rectifiers (cf. Nicolls & Lopatin, 1996). In inspiratory neurones, KATP channels had a conductance of 75 pS, were blocked by the sulphonylureas tolbutamide and glibenclamide, and were activated both by diazoxide and hypoxia. Such characteristics are comparable with the properties of KATP channels recorded in other cells. In hippocampal neurones hypoglycaemia activated K+ channels with 100 pS conductance that were sensitive to glibenclamide and lemakalim (Trombe, Salvaggio, Racagni & Volterra, 1992). In acutely dissociated neurones from neocortex and substantia nigra, channels with 100 pS conductance were reversibly activated by hypoxia, and blocked by glibenclamide, tolbutamide and ATP (Jiang, Sigworth & Haddad, 1994). The activation of these channels required the presence of Ca2+ in the cytosol, which is not typical for traditional KATP channels, possibly implicating a different isoform (Jiang et al. 1994). ATP depletion caused by mitochondrial poisoning activated KATP channels in cardiomyocytes (Leyssens, Nowicky, Patterson, Crompton & Duchen, 1996) and in adult mouse skeletal muscle cells (Allard, Lazdunski & Rougeir, 1995). Their conductances (72 and 67 pS, respectively) and channel gating are very similar to those observed for inspiratory neurones in the present study.
Some features of KATP channels of potential significance have not been described before, or mentioned only marginally. Firstly, in the presence of external millimolar amounts of Ca2+, the channels had lower conductance. Most probably this reflects a tonic block that has been described for other K+ channels (Spires & Begenisich, 1994). Secondly, the channel gating was voltage dependent. The channel activity decreased at negative membrane potentials (see Figs 3 and 7). The whole-cell current at negative membrane potentials behaved similarly (see Fig. 8). Interestingly, currents through KATP channels expressed in oocytes showed a similar slow inactivation at negative membrane potentials (cf. Fig. 1A in Tucker, Gribble, Zhao, Trapp & Ashcroft, 1997). In smooth muscle cells, KATP channels were subdivided into small and large conductance channels (Quayle, Nelson & Standen, 1997). Only the latter demonstrated a voltage-dependent gating (Lorenz, Schnermann, Brosius, Briggs & Furspan, 1992) similar to that which we have observed in the present study. The fast time constant of current decay at -70 mV (100 ms; Fig. 9C), was close to the second closed time constant at the resting membrane potential (91 ms; Fig. 3C). Due to spiking activity in inspiratory neurones, we could not obtain the correlate for the slow time constant of current decay (ca. 2 s at -70 mV; Fig. 9C) on a single-channel level. The channels had quiescent periods which lasted several seconds (see Fig. 2), which manifest channel transitions into silent mode and can underlie the slow decay of whole-cell current.
So far our single-channel data are consistent with the whole-cell recordings. The contribution of KATP channels to the whole-cell current in inspiratory neurones can be estimated from the data obtained with tolbutamide. Such a contribution is potential dependent; at rest it can be as high as 50 %, but at 0 mV it is less than 15 %.
Activation of KATP conductance during hypoxia
Neuromodulators such as adenosine, 5-HT, GABA etc. have been proposed to act as messengers in the hypoxic response, since their extracellular levels increase during hypoxia (Lutz, 1992; Nagel, Schmidt-Garcon & Richter, 1993). Single KATP channels in inspiratory neurones are indeed activated via A1 and GABAB receptors (S. L. Mironov, K. Langohr & D. W. Richter, unpublished observations). We assume that such mechanisms contributed to the activation of KATP channels by hypoxia in outside-out patches which had been left within the slice after excision from the cell. However, hypoxic potentiation was weaker than that observed in cell-attached recordings. Thus, the release of neuromodulators cannot account completely for the activation of KATP channels upon oxygen withdrawal.
KATP channels are often considered as sensors of intracellular metabolism, which is disturbed during hypoxia. In cell-attached patches their activity can serve as an indicator of underlying processes. With the beginning of hypoxia, the intracellular content of ATP falls due to a decline in oxidative phosphorylation and increased ATP consumption by ion pumps. However, the hypoxic response in the respiratory centre was activated too quickly to be accounted for by ATP depletion alone (Pierard et al. 1995). Therefore the causal relationship between [ATP]i and KATP channels during hypoxia in inspiratory neurones needs to be investigated in more detail. In particular, it would be interesting to measure simultaneously the time courses of the [ATP]i fall and KATP channel activity, and correlate the sensitivity of KATP channels with intracellular ATP levels.
Acknowledgments
The study was supported by the SFB 406 (TP C7). The authors would like to thank Hella Timmermann for excellent technical assistance.
References
- Allard B, Lazdunski M, Rougeir O. Activation of ATP-dependent K+ channels by metabolic poisoning in adult mouse skeletal muscle: role of intracellular Mg2+ and pH. The Journal of Physiology. 1995;485:283–296. doi: 10.1113/jphysiol.1995.sp020730. [DOI] [PMC free article] [PubMed] [Google Scholar]
- Belousov AB, Godfraind JM, Krnjevic K. Internal Ca2+ stores involved in anoxic responses of rat hippocampal neurons. The Journal of Physiology. 1995;486:547–556. doi: 10.1113/jphysiol.1995.sp020833. [DOI] [PMC free article] [PubMed] [Google Scholar]
- Brown AM, Lux HM, Wilson DL. Activation and inactivation of single calcium channels in snail neurons. Journal of General Physiology. 1984;83:751–769. doi: 10.1085/jgp.83.5.751. [DOI] [PMC free article] [PubMed] [Google Scholar]
- Champagnat J, Richter DW. The roles of K+ conductance in expiratory pattern generation in anaesthetized cats. The Journal of Physiology. 1994;497:127–138. doi: 10.1113/jphysiol.1994.sp020282. [DOI] [PMC free article] [PubMed] [Google Scholar]
- Cherniack NS, Edelman NH, Lahiri S. Hypoxia and hypercapnia as respiratory stimulants and depressants. Respiration Physiology. 1970;11:113–126. doi: 10.1016/0034-5687(70)90107-6. [DOI] [PubMed] [Google Scholar]
- Duchen MR. Effects of metabolic inhibition on the membrane properties of isolated mouse primary sensory neurones. The Journal of Physiology. 1990;424:387–409. doi: 10.1113/jphysiol.1990.sp018073. [DOI] [PMC free article] [PubMed] [Google Scholar]
- Edwards FA, Konnerth A, Sackman B, Takahashi T. A thin slice preparation for patch recordings from neurons of the mammalian central nervous system. Pflügers Archiv. 1989;414:600–612. doi: 10.1007/BF00580998. [DOI] [PubMed] [Google Scholar]
- Fujimura N, Tanaka E, Yamamoto S, Shigemori M, Higashi H. Contribution of ATP-sensitive potassium channels to hypoxic hyperpolarization in rat hippocampal CA1 neurons in vitro. Of Neurophysiology. 1997;77:378–385. doi: 10.1152/jn.1997.77.1.378. [DOI] [PubMed] [Google Scholar]
- Haddad GG, Donnelly DF. O2 deprivation induces a major depolarization in brain stem neurons in the adult but not in the neonatal rat. The Journal of Physiology. 1990;429:411–428. doi: 10.1113/jphysiol.1990.sp018265. [DOI] [PMC free article] [PubMed] [Google Scholar]
- Haddad GG, Mellins RB. Hypoxia and respiratory control in early life. Annual Review of Physiology. 1984;46:629–643. doi: 10.1146/annurev.ph.46.030184.003213. [DOI] [PubMed] [Google Scholar]
- Jiang C, Sigworth C, Haddad GG. Hypoxia activates ATP- and Ca2+-sensitive K+ channels in substantia nigra neurones. Journal of Neuroscience. 1994;14:5590–5602. doi: 10.1523/JNEUROSCI.14-09-05590.1994. [DOI] [PMC free article] [PubMed] [Google Scholar]
- Leyssens A, Nowicky AV, Patterson L, Crompton M, Duchen MR. The relationship between mitochondrial state, ATP hydrolysis, [Mg2+]i and [Ca2+]i studied in isolated rat cardiomyocytes. The Journal of Physiology. 1996;496:111–128. doi: 10.1113/jphysiol.1996.sp021669. [DOI] [PMC free article] [PubMed] [Google Scholar]
- Lopez-Barneo J. Oxygen-sensing by ion channels and the regulation of cellular functions. Trends in Neurosciences. 1996;19:435–439. doi: 10.1016/0166-2236(96)10050-3. [DOI] [PubMed] [Google Scholar]
- Lorenz JN, Schnermann J, Brosius FC, Briggs JP, Furspan PB. Intracellular ATP can regulate afferent arteriolar tone via ATP-sensitive K+ channels in the rabbit. Journal of Clinical Investigation. 1992;90:733–740. doi: 10.1172/JCI115945. [DOI] [PMC free article] [PubMed] [Google Scholar]
- Luhmann H, Heinemann U. Hypoxia-induced functional alterations in adult rat neocortex. Journal of Neurophysiology. 1994;67:798–809. doi: 10.1152/jn.1992.67.4.798. [DOI] [PubMed] [Google Scholar]
- Lutz PL. Mechanisms for anoxic survival in the vertebrate brain. Annual Review of Physiology. 1992;54:601–618. doi: 10.1146/annurev.ph.54.030192.003125. [DOI] [PubMed] [Google Scholar]
- Mercuri NB, Bonci A, Johnson SW, Stratta F, Calabresi P, Bernardi G. Effects of anoxia on rat midbrain dopamine neurons. Journal of Neurophysiology. 1994;71:116–123. doi: 10.1152/jn.1994.71.3.1165. [DOI] [PubMed] [Google Scholar]
- Nagel H, Schmidt-Garcon R, Richter DW. Extracellular adenosine levels within the respiratory network during sustained hypoxia. XXXII Congress of the International Union of Physiological Sciences. 1993;141:21/P. [Google Scholar]
- Nicolls CG, Lopatin AN. Inward rectifier potassium channels. Annual Review of Physiology. 1996;59:171–191. doi: 10.1146/annurev.physiol.59.1.171. [DOI] [PubMed] [Google Scholar]
- Nieber K, Sevcik J, Illes P. Hypoxic changes in rat locus coeruleus in vitro. Of Physiology. 1995;486:33–46. doi: 10.1113/jphysiol.1995.sp020788. [DOI] [PMC free article] [PubMed] [Google Scholar]
- Pape HC. Queer current and pacemaker: The hyperpolarization-activated cation current in neurons. Annual Review of Physiology. 1996;58:299–327. doi: 10.1146/annurev.ph.58.030196.001503. [DOI] [PubMed] [Google Scholar]
- Pierard C, Champagnat J, Denavit-Saubie M, Gillet B, Beloeil JC, Guezennec CY, Barrere B, Peres M. Brain stem energy metabolism response to acute hypoxia in anaesthetized rats: a 31P NMR study. NeuroReport. 1995;7:281–285. [PubMed] [Google Scholar]
- Pierrefiche O, Bischof AM, Richter DW. ATP-sensitive K+ channels are functional in expiratory neurones of normoxic cats. The Journal of Physiology. 1996;494:399–409. doi: 10.1113/jphysiol.1996.sp021501. [DOI] [PMC free article] [PubMed] [Google Scholar]
- Quayle JM, Nelson M, Standen NB. ATP-sensitive and inwardly rectifying potassium currents in smooth muscle. Physiological Reviews. 1997;77:1165–1216. doi: 10.1152/physrev.1997.77.4.1165. [DOI] [PubMed] [Google Scholar]
- Ramirez JM, Quellmalz UJA, Richter DW. Postnatal changes in the mammalian respiratory network as revealed by the transverse brainstem slice of mice. The Journal of Physiology. 1996;491:799–812. doi: 10.1113/jphysiol.1996.sp021258. [DOI] [PMC free article] [PubMed] [Google Scholar]
- Ramirez JM, Quellmalz UJA, Wilken B. Developmental changes in the hypoxic response of the hypoglossus respiratory motor output in vitro. Of Neurophysiology. 1997;78:383–392. doi: 10.1152/jn.1997.78.1.383. [DOI] [PubMed] [Google Scholar]
- Richter DW, Ballanyi K. Response of the medullary respiratory network to hypoxia: A comparative analysis of neonatal and adult mammals. In: Haddad GG, Lister G, editors. Tissue Oxygen Deprivation: Developmental, Molecular and Integrated Function. Berlin: Marcel Dekker; 1996. pp. 751–777. [Google Scholar]
- Richter DW, Ballanyi K, Schwarzacher S. Mechanisms of respiratory rhythm generation. Current Opinion in Neurobiology. 1992;2:788–793. doi: 10.1016/0959-4388(92)90135-8. [DOI] [PubMed] [Google Scholar]
- Richter DW, Bischoff AM, Anders K, Bellingham M, Windhorst U. Response of the medullary respiratory network of the cat to hypoxia. The Journal of Physiology. 1991;443:231–256. doi: 10.1113/jphysiol.1991.sp018832. [DOI] [PMC free article] [PubMed] [Google Scholar]
- Richter DW, Champagnat J, Jacqiun T, Benacka R. Calcium and calcium-dependent potassium currents in medullary respiratory neurones. The Journal of Physiology. 1993;470:23–33. doi: 10.1113/jphysiol.1993.sp019844. [DOI] [PMC free article] [PubMed] [Google Scholar]
- Rosen AS, Morris ME. Anoxic depression of excitatory and inhibitory postsynaptic potentials in rat neocortical slices. Journal of Neurophysiology. 1993;69:109–117. doi: 10.1152/jn.1993.69.1.109. [DOI] [PubMed] [Google Scholar]
- Schmidt C, Bellingham MC, Richter DW. Adenosinergic modulation of respiratory neurones and hypoxic responses in the anaesthetized cat. The Journal of Physiology. 1995;483:769–781. doi: 10.1113/jphysiol.1995.sp020621. [DOI] [PMC free article] [PubMed] [Google Scholar]
- Smith JC, Ellenberger HH, Ballanyi K, Richter DW, Feldman JL. Pre-Bötzinger complex: a brainstem region that may generate respiratory rhythm in mammals. Science. 1991;254:726–729. doi: 10.1126/science.1683005. [DOI] [PMC free article] [PubMed] [Google Scholar]
- Spires S, Begenisich T. Modulation of potassium channel gating by external divalent cations. Journal of General Physiology. 1994;100:181–193. doi: 10.1085/jgp.104.4.675. [DOI] [PMC free article] [PubMed] [Google Scholar]
- Sun MK, Reis DJ. Central neural mechanisms mediating excitation of sympathetic neurons by hypoxia. Progress in Neurobiology. 1994;44:197–219. doi: 10.1016/0301-0082(94)90038-8. [DOI] [PubMed] [Google Scholar]
- Trapp S, Ballanyi K. KATP channel mediation of anoxia-induced outward current in rat dorsal vagal neurons in vitro. Of Physiology. 1996;487:37–50. doi: 10.1113/jphysiol.1995.sp020859. [DOI] [PMC free article] [PubMed] [Google Scholar]
- Trippenbach T, Richter DW, Acker H. Hypoxia and ion activities within the brainstem of newborn rabbits. Journal of Applied Physiology. 1990;68:2494–2503. doi: 10.1152/jappl.1990.68.6.2494. [DOI] [PubMed] [Google Scholar]
- Trombe C, Salvaggio A, Racagni G, Volterra A. Hypoglycemia-activated K+ channels in hippocampal neurons. Neuroscience Letters. 1992;143:185–189. doi: 10.1016/0304-3940(92)90262-6. [DOI] [PubMed] [Google Scholar]
- Tucker SJ, Gribble FM, Zhao C, Trapp S, Ashcroft FM. Truncation of Kir6.2 produces ATP-sensitive K+ channels in the absence of the sulphonylurea receptor. Nature. 1997;387:179–182. doi: 10.1038/387179a0. [DOI] [PubMed] [Google Scholar]
- Zhang L, Krnjevic K. Whole-cell recording of anoxic effects on hippocampal neurones in slices. Journal of Neurophysiology. 1993;69:118–127. doi: 10.1152/jn.1993.69.1.118. [DOI] [PubMed] [Google Scholar]
- Yamamoto S, Tanaka E, Higashi H. Mediation by intracellular calcium-dependent signals of hypoxic hyperpolarization in rat hippocampal CA1 neurons in vitro. Of Neurophysiology. 1997;77:386–392. doi: 10.1152/jn.1997.77.1.386. [DOI] [PubMed] [Google Scholar]


