

Abstract
Visually driven single-unit activity was recorded in the dorsal lateral geniculate nucleus (dLGN) of the anaesthetized cat while inactivating or stimulating the corticofugal feedback from area 17/18 by means of cortical cooling or application of GABA (inactivation), or application of glutamate or quisqualate (Glu, Quis; stimulation) to layer VI.
Manipulations of the corticofugal feedback primarily affected the multimodal interspike interval pattern previously reported to be present in the tonic component of visual responses elicited by spot-like stimuli.
Sixty-three per cent of all neurons could be influenced, and temporally localized interspike interval distributions were measured which commonly consisted of one fundamental interval peak (leftmost peak) and integer multiples thereof (higher order peaks). During blockade of the corticofugal feedback, interspike intervals were redistributed into the higher order peaks in about 70 % of the cases, accompanied by a reduced mean firing rate. During stimulation the reverse effect occurred in 69 % of cases.
Increased synchronization of the EEG (increased power in the δ-wave range, 1-4 Hz) had an effect similar to cortex inactivation. The specificity of corticofugal effects was verified by consideration of these EEG effects and by dLGN double recordings with one dLGN cell topographically matched with the cortical inactivation/activation site and the second cell outside this area. Clear effects due to manipulation of the corticofugal feedback were found only for the matched dLGN site.
In addition we observed that the peaks of the interval distributions were narrower during active corticofugal feedback, such that the temporal dispersion of the signal transmission to the cortex was reduced.
The mechanisms underlying this effect were further analysed in a biophysically realistic model demonstrating that the timing of the spikes in the dLGN is improved as soon as the cortical feedback is active. The high degree of convergence/divergence between neurons along the closed feedback loop thereby leads to a temporal averaging effect which reduces the interval dispersion and also introduces synchronization between dLGN cells.
Such a mechanism may thus counteract the deterioration of spike timing accuracy which would otherwise occur as a consequence of synaptic noise and other uncorrelated sources of activity at a given neuron.
The spatio-temporal response characteristic of neurons is controlled at all levels in the primary visual pathway by the co-operative action of ascending afferent and descending feedback connections. Still, major controversies exist as to the importance of the details of signal processing in the visual thalamus in this respect. The aspect of temporally structured (coherent) neuronal activity, which is thought to be of relevance for forming a coherent visual percept (see Eckhorn, 1994; Singer & Gray, 1995), serves as an example of this controversy. In the visual system, synchronous activity of two or more neurons, which was often observed during oscillatory activity, was found in cortical cells (Eckhorn et al. 1988; Gray, König, Engel & Singer, 1989) and, as a consequence, mechanisms for the generation of this activity were also suspected to reside there (see Singer & Gray, 1995). Almost in parallel, however, results were described which pointed to a possible thalamic origin of these synchronously oscillating firing patterns (Bringuier, Fregnac, Debanne, Shulz & Baranyi, 1992; Ghose & Freeman, 1992). Even in the retina such activity patterns were described about 30 years ago (Doty & Kimura, 1963) and these findings were reconfirmed recently (Meister, Lagnado & Baylor, 1995). In 1994 another aspect was added to this already complex situation by the results of Sillito and co-workers. This group was able to demonstrate that the synchronicity of spike trains in the dLGN is strongly influenced by feedback signals which originate in the visual cortex (Sillito, Jones, Gerstein & West, 1994).
Thus, currently these problems can only be resolved by trying to accumulate a more detailed knowledge of the underlying functional characteristics of the subsystems involved.
Recently, we were able to show that dLGN relay cells respond to a small visual stimulus with a characteristic interspike interval pattern (during the tonic part of the response) which consists of a single interval length (called the fundamental interval) and integer multiples thereof (higher order intervals; Funke & Wörgötter, 1995; Wörgötter & Funke, 1995). With increasing stimulus size, stronger surround inhibition is induced in the dLGN, and we found that the interval pattern changes in a predictable way such that the total number of higher order intervals increases. Therefore, we suspected that the fundamental firing frequency (fundamental spike interval) is already generated in the retinal ganglion cells and that intra-dLGN inhibition could be involved in generating the multimodal interval patterns by cancelling individual retinal EPSPs (‘deletion inhibition’; Bishop, Levick & Williams, 1964). However, so far our understanding of the underlying mechanisms (e.g. short-lasting and well-timed versus long-lasting and unspecific inhibition) and also the possible functional relevance of such interspike interval patterns remains rather incomplete.
In addition to these inhibitory interactions, dLGN relay cell activity is further controlled by feedback projections from the visual cortex. Early reports suggested a predominantly facilitatory but rather unspecific action of the corticofugal feedback projection on visual responses in the dLGN (Kalil & Chase, 1970; Baker & Malpeli, 1977). A specific corticofugal modulation of the spatial characteristics of the receptive fields of dLGN relay cells (orientation-sensitive modulation) was shown by Sillito, Cudeiro & Murphy (1993) and Cudeiro & Sillito (1996). The results of Sillito et al. (1994), on the other hand, also support a rather specific action of the corticofugal feedback which controls synchronization in the dLGN. At a first inspection the unspecific and rather small, temporally unmodulated (tonic) depolarization of the cell membrane of dLGN relay cells (9 mV; Curró Dossi, Nuñez & Steriade, 1992) resulting from an active corticofugal feedback seems to be in conflict with the tight timing requirements for synchronization between dLGN cells (Sillito et al. 1994).
Therefore, the goal of the present study was to try to resolve this apparent conflict by assessing the influence of corticofugal feedback on the specificity of dLGN interspike interval patterns. In the first part of this study, we will demonstrate how the multimodal dLGN interval distributions change following reversible inactivation or stimulation of the cortex, performed in parallel with different pharmacological treatments of the studied dLGN cells. The results obtained support a certain generic neuronal wiring pattern of the afferent and feedback connections in the primary visual pathway. This allowed us to define the connectivity pattern in our biophysically realistic model, and we will follow up in the second part of this study by describing simulation results which show that little temporal and spatial specificity is required to improve the timing of dLGN spikes. By enhancing the temporal accuracy of spiking in dLGN relay cells, the temporal jitter of the spike interval distributions is reduced at the single-cell level and, in addition, the temporal correlation between dLGN cells (synchronization) is facilitated due to the divergence and convergence pattern of the cortico-geniculate projection. In particular, we find in computer simulations and experiments that the temporal dispersion of neuronal events in the dLGN is even smaller than that of their retinal afferents as long as the cortex is active. Thus, the apparent conflict between the tight timing requirements for neuronal synchronization in the dLGN and the rather unspecific action of the corticofugal feedback so far reported may be partly resolved here.
Part of this study has been published in preliminary form as a short note (Funke, Nelle, Li & Wörgötter, 1996).
METHODS
Experimental methods
Anaesthesia and general procedures
Experiments were carried out on twenty-one adult cats of both sexes (body weight, 2.5-4.0 kg). Surgeries to enable infusion and artificial respiration were performed under anaesthesia induced with ketamine hydrochloride (20-25 mg kg−1, i.m.; Ketanest, Parke-Davies, Germany) and xylazine (1 mg kg−1, i.m.; Rompun, Bayer, Germany). While still under ketamine-xylazine anaesthesia, the cat was paralysed by alcuronium chloride infusion (0.15 mg kg−1 h−1; Alloferin 10, Hoffmann-La Roche, Germany) through a cannula in the femoral artery, and artificial ventilation with N2O-O2 (70:30) and halothane (0.2-0.4 %; Fluothane, ICI-Pharma, Germany) was started immediately. Further surgeries (e.g. craniotomy) were performed under this state of mixed ketamine-xylazine plus N2O-O2-halothane anaesthesia. Craniotomies were performed for epidural EEG registration (silver ball electrode, area 17 of the hemisphere opposite to the recording site), for lowering two concentric, bipolar stimulation electrodes bilateral to the optic chiasm, and for vertical access to the lateral geniculate nucleus and the visual cortex (area 17/18).
Adequacy of anaesthesia was ensured by continuously and semi-automatically monitoring the blood pressure and the EEG activity. The level of anaesthesia was increased (0.8-1.0 % halothane) as soon as an increase in blood pressure or a desynchronization of EEG activity was observed. During normal recording sessions such changes were almost never observed, which indicated a sufficient level of anaesthesia. Any potentially noxious manipulation of the animal was only performed during an increased level of anaesthesia (0.8-1.0 % halothane) with particularly careful control of blood pressure and EEG.
During recordings the anaesthesia was maintained with N2O-O2 (70:30) and halothane (0.2-0.4 %), the end-expiratory CO2 was kept at about 3.8 %, the body temperature at 38.0°C, and the mean arterial blood pressure above 90 mmHg. The local anaesthetic xylocaine (2 %; Astra Chemicals, Germany) was applied to all wound margins and pressure points. Atropine sulphate (1 %; Atropin-Pos, Ursapharm, Germany) and phenylephrine hydrochloride (5 %; Neosynephrin-Pos, Ursapharm, Germany) were applied topically for mydriasis and retraction of the nictitating membranes. The corneae were protected with zero power contact lenses and the optics were corrected with spectacle lenses of 7-9 dioptres to focus the screen image on the retinal surface.
Recordings, micro-iontophoresis and cortical inactivation
Extracellular recordings were made in seventeen experiments with single- or multibarrelled glass pipettes with an outer tip diameter of 3-9 μm. The recording barrel was filled with 3 M NaCl solution. In three experiments, cells were recorded with glass-coated tungsten electrodes. Micro-iontophoresis was performed in the dLGN using multibarrelled pipettes. Depending on the experimental set-up, the micro-iontophoresis barrels were filled with the following solutions: GABA, 0.5 M (pH 3.0, Sigma; ejection current, +2 to +15 nA); bicuculline methiodide (Bicu, 5 mM, pH 3.0, Sigma; ejection current, +10 to +25 nA); glutamate (Glu, 200 mM, pH 7.5, Sigma; ejection current, -10 to -40 nA); and quisqualate (Quis, 15 mM, pH 7.0, Tocris Neuramin, UK; ejection current, -5 to -20 nA), all dissolved in 165 mM NaCl. Iontophoresis currents were controlled by a Neurophore-2-system (Medical Systems Corp., Great Neck, NY, USA). Retention currents of 7-15 nA with a polarity opposite to that used for ejection prevented the uncontrolled diffusion of drugs from the tip of the pipette.
Cortical inactivation was achieved by two methods: (1) cortical cooling and (2) GABA micro-iontophoresis. (1) Cooling was performed by attaching an open (pressure-free) cooling chamber to the skull above area 17 and 18. The dura was removed and Ringer solution was perfused through the chamber. The temperature of the Ringer solution was held constant at 0°C by a thermostat. In two experiments a recording electrode was placed in the cortex and the process of cooling was monitored. In general, we found that 10 min of cooling were sufficient to silence cells in the lower cortical layers (see also Schmielau & Singer, 1977). In a few cases a transient increase in the cell activity was observed during these 10 min. Recovery to normal cortical activity occurred after stopping the Ringer perfusion, mostly within 20 min. (2) To inactivate a large area of the cortex by GABA micro-iontophoresis, a square array of 4 × 4 micropipettes was inserted into the cortex. The micropipettes were glued to each other and the array was fabricated by us during the experiment under binocular control so as to adjust the individual tip locations to the surface curvature of area 17/18. This allowed for a rather accurate placement of the electrodes in layer VI, which could be confirmed later by histological reconstruction of (most) tracks. The lateral distance between two tips was approximately 1000 μm. Tip diameter was 5 μm. Pipettes were pulled with a programmable electrode puller (DMZ-Universal Puller, Zeitz-Instrumente, Germany), which ensured a very high degree of reproducibility. Thus, the DC resistance ranged only between 8 and 10 MΩ. All pipettes were filled with GABA (see above) and attached in parallel in bundles of four to the channels of the Neurophore control unit. We had to use such a parallel wiring, which was possible due to the almost identical resistances of the individual pipettes, because the Neurophore does not allow operation of more than five channels. For this reason, we scaled the ejection currents up to between 200 and 400 nA per channel (50-100 nA per electrode).
In several experiments we used one multibarrelled pipette to record from the cortex and to activate or inactivate this location subsequently. Two barrels contained GABA, two contained glutamate or quisqualate, and the fifth was used for recording (3 M NaCl). Initially a recording electrode was placed in the dLGN and the dLGN receptive field location was plotted on a plotting table. Then, the cortical multibarrelled pipette was inserted such that a retinotopic match between the cortical and the dLGN receptive fields was achieved with an accuracy of between 0.5 and 1.0 deg. In these experiments a second recording electrode was then inserted in the dLGN which mismatched the cortical site by at least 3.0 deg.
Histology
All animals were fixed by intra-arterial vascular perfusion with 4 % phosphate-buffered paraformaldehyde (pH 7.4) at the end of the experiment under deep halothane (4 %) anaesthesia. Recording electrode tracks and micro-pipette tracks were identified in frozen sections of 50 μm, counterstained with Cresyl Violet.
Visual stimulation and data collection
Visual stimuli were generated by a Picasso cathode ray image generator (Innisfree, Cambridge, MA, USA) and presented on an oscilloscope screen (Tektronics 608; frame rate, 200 Hz) 0.28 m in front of the cat's eyes. Light or dark spots of variable diameter (0.2-5 deg) were used to elicit receptive field centre or centre-surround responses.
Most cells were also tested with moving light or dark bars (0.5 × 10.0 deg) at velocities ranging between 1 and 20 deg s−1. In all experiments background room illumination was 0.1 cd m−2. For the on-cells, light spots were flashed either on a dark background (0.1 cd m−2, spot: max. 10.0 cd m−2) or on a background of intermediate illumination (2.0 cd m−2, spot: max. 20.0 cd m−2). For the off-cells, either a light spot of 10.0 cd m−2 was switched off to the dark background level or dark spots (0.1 cd m−2) were presented on the intermediate background illumination. Contrast between spot and screen background was varied between 0.05 and 0.9 ([Lmax - Lmin]/[Lmax+Lmin], where L is luminance); most cells were tested with at least a contrast of 0.2 in addition to 0.9. Retinal illumination was in the range 0.89-3.19 log cat trolands, a range also used by Troy & Enroth-Cugell (1993).
After conventional electronic amplification, single-unit action potentials were selected through a window discriminator (Model 121, WPI Instruments, USA), converted to transistor-transistor logic (TTL)-pulses and fed on-line via a laboratory interface (Model 1401, Cambridge Electronic Design, UK) into a personal computer (80486). Each record generally contained 100 sweeps of stimulus presentation (400 ms stimulus off, 800 ms on, 800 ms off).
Cell classification
Based on response latency to electrical stimulation of the optic chiasm (Stone & Hoffmann, 1971) and/or the spatial and temporal characteristics of their receptive fields (Cleland, Dubin & Levick, 1971; Derrington & Fuchs, 1979), geniculate relay cells were classified as X- or Y-type. All cells included in this study were of the non-lagged type (Mastronarde, 1987).
Data analysis
Data analysis is based on regular interspike interval histograms covering a short segment of the tonic dLGN cell response to maintained stimulation. To this end, interval histograms were computed from a window of 150 ms duration 300 ms after stimulus onset. Such a strict temporal localization minimizes the influence of adaptation effects, which occur during prolonged stimulation and would distort the shape of the interspike interval histograms. The issue of temporally localized interval analysis has been laid out in great detail in Funke & Wörgötter (1995).
Initially all data were pre-analysed by means of so-called ‘intervalograms’ (Funke & Wörgötter, 1995). Intervalograms represent multiple temporally localized interval histograms combined into one diagram. For the computation of intervalograms, the occurrence of action potentials was recorded with a bin width of 1 ms and interval histograms were computed in a window of 100 ms duration. This time window is shifted stepwise along the time axis. An overlap of 90 % (10 ms steps for a window size of 100 ms) between consecutive time windows is introduced. The interval distribution for each time window is calculated from 100 sweeps (stimulus repetitions) and is shown as a grey-scaled pixel line, centred with respect to the position of the window at the time axis which runs downwards in the diagrams (e.g. Fig. 2). In this study the intervalograms represent only a pre-analysis step. Therefore examples are only shown in Fig. 2. After this pre-analysis, five pixel lines corresponding to a time window of 150 ms centred at 300 ms after stimulus onset were averaged in order to get the regular interspike interval histograms which are used throughout this study to display the data. The reason for the pre-analysis by intervalograms was to confirm that the actual selection of the temporal location of the final interval histogram does not influence the results qualitatively.
Figure 2. Effects of cortical cooling on the spike interval distribution of the tonic light response of dLGN relay cells.
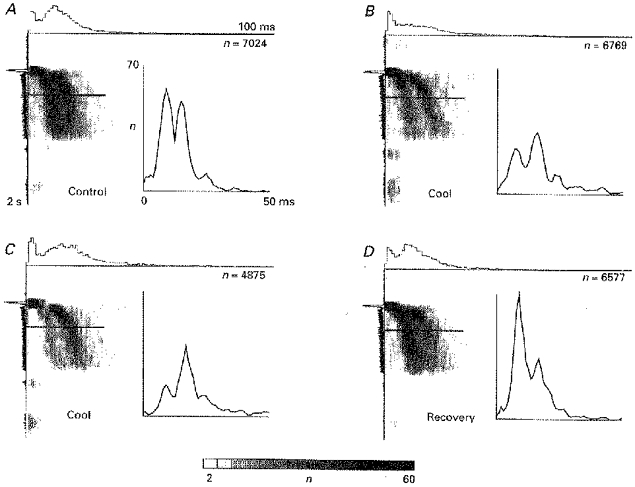
This figure shows the pre-analysis of the data by means of intervalograms and the final resulting temporally localized interspike interval histograms (ISIH, as insets) which are used throughout this study to display the results. One example of a series of intervalograms from a dLGN Y on-cell subjected to cortical inactivation by cooling (A-D) is shown. Number of intervals in each pixel line is coded by different grey levels with scale bar at the bottom. Total number of intervals (n) is given in the top right corner of each intervalogram. The regular ISIHs shown in the insets represent cross-sections through the intervalograms at the location indicated by the horizontal bar. Five adjacent pixel rows were averaged to obtain the ISIHs. The scaling for the insets is given in A, and kept constant for corresponding diagrams. The stimulus was a flashing dot of diameter, 1.0 deg and contrast, 0.9. Onset of the flash was after 400 ms and it was kept on for 800 ms followed by a pause of 800 ms. ISIHs were established from the responses to 100 stimulus repetitions. Start times of the respective recordings after start of cortical cooling were (min): B, 12; C, 34. For the recovery after stopping the inactivation: D, 13 min. The same conventions will be used for the timing notation in the other figures.
EEG analysis
During spike recordings from dLGN relay cells the EEG was continuously recorded from the dural surface of area 17/18 of the opposite hemisphere (sampling rate, 250 Hz). The opposite hemisphere was chosen merely for practical reasons. In some experiments EEG recordings were also made at the same hemisphere but no distinctive differences (within the limits of the analysis techniques used) were found compared with the EEG taken from the other side. It was possible to determine the temporal correlation between changes in the spectral composition of the EEG and the associated changes in geniculate firing rate. To this end we calculated the power spectrum of the EEG for the frequency range of 1-40 Hz by the use of the Fast Fourier Transform and quantitatively determined changes in the spectral composition of the EEG by calculating the logarithmic ratio of the summed power of the 1-8 Hz range to the summed power of the 20-40 Hz range (EEG-PR = log(power1-8 Hz/power20-40 Hz). We have chosen this ratio since changes in the power of δ-waves (1-4 Hz) and often reciprocal changes in the higher frequency range have been shown to be strongly associated with changes in cat dLGN responsiveness (Sawai, Morigawa & Fukuda, 1988). The changes in the EEG power ratio (EEG-PR) were then correlated to changes in mean geniculate firing rate during visually induced activity by the use of cross-correlation analysis. To achieve a high temporal resolution, EEG-PR and mean firing rate were determined using sliding time windows of 2 s length, shifted in steps of 100 ms. The results obtained from the correlated changes in EEG-PR and firing rate were taken as a control against the specific effects deriving from drug applications or cortical inactivation or activation.
Modelling methods
The computer simulations are based on an improved integrate-and-fire neuron model at the membrane potential level. It is implemented in C-code and run on a SUN microcomputer. The basic model is described in Wörgötter & Koch (1991) but without corticofugal feedback.
Single cell model
Single neurons were implemented as single-compartment, leaky integrate-and-fire units (Wörgötter & Koch, 1991). The internal state of a neuron k is described by the membrane potential Vk(t) whose time course is determined according to the equation:
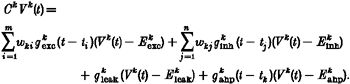 |
In this formula, i represents the summation index and m the number of excitatory inputs, j is the summation index and n the number of inhibitory inputs. Table 1 shows the physiological parameters used for cells in the different populations.
Table 1.
Cell parameters for the model
| Symbol | Parameter | dLGN-TC | dLGN-IN | Cortex |
|---|---|---|---|---|
| C | Membrane capacitance | 1 nF | 0.5 nF | 2 nF |
| gleak | Leakage conductance | 0.1 μS | 0.1 μS | 0.1 μS |
| Eleak | Leakage reversal potential | -60 mV | -60 mV | -60 mV |
| Peak excitatory conductance | 0.15 μS | – | 0.011 μS | |
| Eexc | Excitatory synaptic reversal potential | 20 mV | – | 20 mV |
| Peak inhibitory conductance | – | 0.5 μS | – | |
| Einh | Inhibitory synaptic reversal potential | – | -90 mV | – |
| Peak after-hyperpolarization conductance | 0.59 μS | 0.59 μS | 0.59 μS | |
| Eahp | After-hyperpolarization reversal potential | -95 mV | -95 mV | -95 mV |
| wki | Connection strength from cell i k | var. | var. | var. |
Abbreviations: TC, thalamocortical relay neuron; IN, interneuron; var., variable.
The network
The network model consists of eighty nerve cells, distributed between a retinal, a thalamic and a cortical population. The information flow in the network is sketched in Fig. 1A and the complete connection matrix is given in Fig. 1B, where each connection is indicated by a square of a size representing the synaptic transmission strength (an unfilled area indicates no connection). The connection matrix is arranged such that row i contains all synapses originating from cell i, and column j all projections onto cell j. Hence, the projection from cell i to cell j can be found as indicated by the example in the ‘Retina-IN’ block. The network is designed in order to capture in a most generic way the temporal processing in the primary visual pathway. Therefore, we restricted the architecture to one dimension and omitted most of the spatial characteristics of the cells (like orientation selectivity). These issues, which have been addressed elsewhere (Wörgötter & Koch, 1991), however, are compatible with the 2-dimensional extended version of this model. The specific set-up is as follows. The input stage of the model is the retinal ganglion cell layer. Here, activity arises first and is generated by simulating a truncated Gaussian envelope in the interspike interval distribution, with the centre of the envelope between 5 and 15 ms and a standard deviation of 1-5 ms. This reflects the interval distribution during the tonic response of real ganglion cells to stimulation with a dot stimulus of certain size and contrast.
Figure 1. Schematic diagram of the connections of the model network.
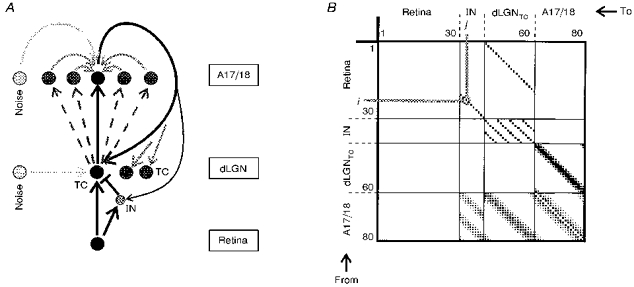
A, schematic set-up of the retino-thalamo-cortical pathway in the computer model. Projections and pathways are indicated by arrows. The spatial structure of the connections is depicted in the connection matrix shown in B for 80 cells in the retino-thalamo-cortical pathway. Each row and each column contains 80 entries, representing the connection from cell i(row i) to cell j(column j). The strength of a connection is encoded by a filled square at location (i, j), whose size corresponds to the strength of the projection from cell i to cell j.
Projections from the retinal cells to dLGN cells are all 1:1, and the cells are topographically arranged along a 1-dimensional retinal stretch. Correspondingly, there are two cell groups in the dLGN. Firstly, there are thalamo-cortical neurons (TC, Fig. 1A), which project to area 17/18 (projections are located in the square marked dLGNTC-A17/18, Fig. 1B). The propagation time of the thalamic spikes to the cortical cells is 3.5 ms with a variance of ± 20 %. In order to treat all cells equally, border cells form wrap-around connections. Secondly, there are interneurons (IN), which send local inhibitory projections to the dLGN relay neurons (TC) and sometimes to other interneurons, as well. In the model, one inhibitory interneuron forms synapses with four dLGNTC neurons and one TC cell receives inhibition from two IN cells (shown in the rectangle IN-dLGNTC in Fig. 1B). The precise form of the inhibition in the model is not crucial, as long as a sufficient number of retinal EPSPs are reduced to remain subthreshold and the multimodal ‘fingerprint’ in the interspike interval histogram as seen in real dLGN cells can be reproduced. The delay of the inhibitory pathway via the interneurons is only slightly longer (about 0.5 ms) than the excitatory retino-thalamic projection.
All cortical neurons in area A17/18 are modelled in a single population, and no distinction is made between different layers. Also, spatial properties, e.g. orientation tuning, that are not directly relevant for the temporal processing in our study, are neglected in the model. Each cortical model neuron receives input from several neighbouring dLGN relay neurons, with a spatial weighting function for the connection strengths that resembles a truncated Gaussian function (see Fig 1B, dLGNTC-A17/18). In addition, there exist excitatory local intracortical connections that link neighbouring cortical cells, again with the connection strength falling off like a Gaussian function with the distance from the target neuron. The propagation delay of spikes within the cortical population is set to 1 ms ( ± 20 %). Generally, the range of the intracortical connections is wider than that of the thalamo-cortical projections, but the strength is weaker. From the cortex population originate two excitatory, topographically matched feedback projections to the dLGN: one to the relay neurons (marked by the bold curved arrow in Fig. 1A, and described in the A17/18-dLGNTC box in Fig. 1B), and another corresponding projection to the dLGN interneurons (marked by a thinner black arrow in Fig. 1A, and shown in the A17/18-IN box in Fig. 1B). The range of the cortico-thalamic projection is wider than that of the afferent projection from dLGN to A17/18, but the strength also drops according to a Gaussian weighting function. Generally, the strength of the feedback connections has been set weak enough that a flow of cortical spikes along the feedback path alone is not sufficient to create spiking activity in the thalamic neurons. The propagation delay from the cortical cells to the thalamic cells is about 5.5 ms (for both relay and interneurons), and also has been subjected to a jitter of ± 20 % for the individual connections. In the model, we considered only the groups of fast- (13-32 m s−1) and intermediate- (3.2-11 m s−1) conducting cortico-geniculate axons, which were classified as being projections of layer VI complex and simple cells (Tsumoto & Suda, 1980). This range of conduction velocities corresponds to a latency range of 2-8 ms (including synaptic delay). Only this subpopulation might be able to control the timing of retino-geniculate signal transfer within an adequate time window. The more slowly conducing axons (0.3-1.6 m s−1; latency, 10-40 ms) were not included in the model. The visual features of these cells are less precisely characterized (Tsumoto & Suda, 1980).
In addition to the retina, dLGN and cortical population, there exists a fourth population of units (marked ‘Noise’ in Fig. 1A; not included in the connection matrix), which feed activity uncorrelated to the retinal input (‘noise’) into the dLGN and cortical cells.
RESULTS
A total of 225 dLGN relay cells of all subtypes (X on, X off, Y on, Y off) were recorded. In 202 of them, the influence of the corticofugal feedback was tested (67 of these were obtained as double-site recordings also used to test the spatial effect of cortex inactivation/activation and for EEG effects; see below). Of these, 127 (63 %) reacted to our experimental procedures. Effects could be obtained by reversible inactivation for ninety-eight cells and by reversible stimulation for thirty-eight cells. The sum is bigger than 127 because some cells were tested with more than one experimental protocol. Seventy-five out of the 202 cells tested could not be influenced or had to be rejected because of interfering EEG effects. Additionally, in twenty-three cells pharmacological tests were performed directly in the dLGN and all of them could be influenced. A combination of several methods was applied to a few dLGN cells as specified below. In general, we did not observe differences between the X and Y cell classes. Examples are almost always taken from on-cells, because their interval peak structure is more pronounced than that of off-cells (Funke & Wörgötter, 1995).
Reversible inactivation of the corticofugal feedback
Figure 2 shows a typical result obtained with cortical cooling during stimulation with a flashing dot stimulus. The insets show regular interspike interval histograms (ISIHs) computed from a cross-section through the intervalograms by averaging five subsequent pixel lines corresponding to 150 ms of the tonic visual response. Averaging was centred around the horizontal bars drawn in the intervalogram. Intervalograms represent only a pre-analysis step. Therefore, only the temporally localized regular interval histograms, which show the essential effects, are displayed in all other figures. The procedure to compute them is identical to that used to get the inset diagrams in Fig. 2.
In this cell, prolonged inactivation leads to a dominance of the second peak in the ISIH (Fig. 2) accompanied by a reduced mean firing rate of the tonic response as can be judged from the total number of intervals ‘n’ in each recording (given in the intervalograms of Fig. 2, and in the legends of most other figures). During recovery the cell re-obtains its original response characteristics.
In all cases the final result of cortical inactivation was a reduction of the firing rate in the recorded dLGN cell. However, in general we observed a rather high degree of variability concerning the inactivation effect. Fluctuations of the (decreased) impulse rate of 10-15 % between two subsequent recordings were quite common.
Controlling for EEG effects
Even during anaesthesia the EEG pattern can change from a purely δ-wave-dominated EEG (synchronized EEG) to a state where fewer δ-waves exist (less-synchronized EEG, de-synchronized EEG). In order to avoid discomfort to the animals, anaesthesia was adjusted such that a truly de-synchronized EEG was never observed, but even smaller changes from fully synchronized to less-synchronized EEG are sometimes accompanied by a rather strong alteration of the cell responses in the dLGN (Sawai et al. 1988). These reports mainly found that a strong rate reduction occured as soon as the EEG switched to a δ-wave-dominated state. Thus, such an effect can mask the effects of cortical inactivation completely (Fig. 3). During a fully synchronized EEG the higher order peaks prevail just as during cortical inactivation (trace C), whereas during less-synchronized EEG the fundamental peak and the lower order peaks dominate (trace A). This means that the experimental finding of a changed interval peak pattern during cortical cooling can easily been confounded with EEG-related effects. The similarity of the effects, however, does not necessarily suggest that the corticofugal influence is reduced during an EEG dominated by δ-waves. This may be possible, but brainstem (and other) influences will certainly add to or even dominate the corticofugally induced effects when an EEG change occurs. Furthermore, it should be noted that a change of the EEG pattern is almost exclusively reflected in the tonic response of the cells. On- or off-transients elicited by the flashing light spot showed little change (Sawai et al. 1988). In order to not clutter too much the following diagrams, EEG traces are not shown, but, because of the possible interference of effects due to manipulation of the corticofugal feedback with those referring to changes in the EEG pattern, all recordings were performed under the highly critical assessment of the EEG state (see also Methods).
Figure 3. Effect of changing EEG on dLGN spike interval distribution.
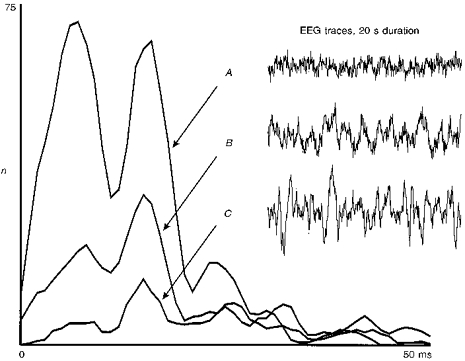
Example of an EEG effect observed at an X on-cell stimulated with a dot (size, 2 deg; contrast, 0.9). Traces on the right show a 20 s-long section (10 stimulus sweeps) of the simultaneously recorded EEG. A clear transition from a less-synchronized EEG (trace A) to a strongly synchronized EEG (trace C) is shown, where trace B represents an intermediate state. A strong change in the tonic (maintained) response component towards a dominance of the higher order peaks is observed the more synchronized the EEG becomes. Total number of intervals is (traces A-C): 8307, 6068, 4618.
Nevertheless, it is conceivable that this control could be insufficient and that some of the observed inactivation effects could actually be just EEG-related observations. To rule out this possibility, apart from the EEG analysis a second control was performed in several experiments, for which we used only a single inactivation pipette in the cortex and performed double-electrode recordings in the dLGN where only one electrode matched the inactivation/stimulation site. We define a matching cell as that which matches the inactivation site and a non-matching cell as that which does not match the site. Figure 4 shows how twenty-two matching/non-matching double-unit recordings behave during cortical inactivation compared with mere EEG changes. In this diagram we evaluate the changes for both cell groups, building ratios for the situation before and during cortical inactivation. On the x-axis is plotted the change of the mean impulse rate taken from the tonic part of the response for matching (⋄) and non-matching (+) cells. On the y-axis is plotted the change in δ-wave power averaged from the power spectrum of the EEG in the range of 0.5-4 Hz. Because matching and non-matching recordings were always taken simultaneously, only one co-ordinate exists on the y-axis (EEG change) for every two values on the x-axis (rate changes matching and non-matching). As a first observation we note that matching and non-matching cells build two almost non-overlapping clusters in the diagram. Non-matching cells centre around a mean of about (1.0, 1.0). Thus, rate and EEG changes in the control group are random. The matching cells, on the other hand, centre around (0.609, 0.952). Thus, the rate is reduced by almost a factor of two compared with the control group. The third smaller cluster on top shows how a few matching/non-matching cell pairs react when comparing two obviously different EEG states. These particular cell pairs in the top cluster are taken from the same cell group which constitutes the other two clusters below. EEG effects are very strong and the mean δ power change is 2.2. As opposed to the situation observed during cortical inactivation, we find that during a mere EEG change the rates of the matching and non-matching cells are both reduced by a factor of two and no difference between matching and non-matching cells can be observed. Thus, the third cluster remains uniform. In summary, Fig. 4 demonstrates that EEG effects can be clearly separated from the experimentally induced effects. Therefore, the major part of our data set, which is based on single-cell recordings under continuous assessment of the EEG, also can be trusted because all recording sessions during which an EEG change was observed were ruled out.
Figure 4. Scatter diagram distinguishing between experimentally induced effects and EEG-related observations by means of double-unit dLGN recordings.
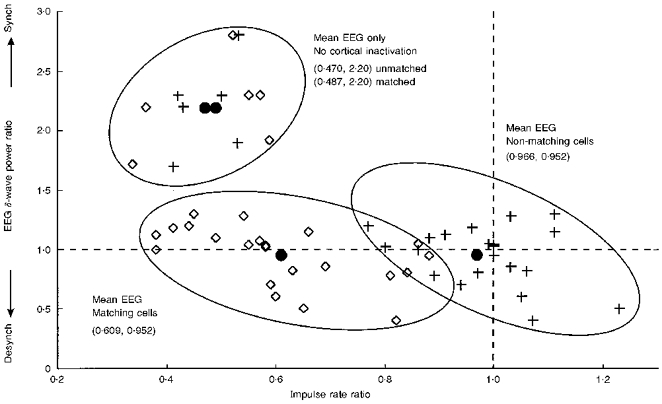
Symbols: ⋄, dLGN cells which match the cortical inactivation site; +, dLGN cells which do not match the cortical inactivation site; •, mean values of the cell groups. Three clusters can be observed. Cells in the top cluster were recorded without cortical inactivation; instead, cases are plotted where the EEG changed to a δ-wave-dominated state. EEG-related effects are clearly separate from effects observed during cortical inactivation (for further explanations see text). Synch, synchronized; Desynch, desynchronized EEG.
Reversible stimulation of the corticofugal feedback
So far our results indicate that the major effect of the corticofugal feedback is facilitatory or disinhibitory, leading to an increase in the mean firing rate of dLGN cells. At the same time, a redistribution of the frequency of distinct spike intervals occurs in such a way that the distribution shifts towards the fundamental spike interval as long as the cortex is active.
This leads to the prediction that an artificial stimulation of the cortex might even enhance the facilitatory effect, leading to an elevated firing rate in the dLGN.
Figure 5 shows the response of an X on-cell during the application of glutamate in the cortex. The cell was recorded during a very pronounced period of δ-wave EEG and, consequentially, the cell response to visual stimulation is initially very weak. Only during glutamate application in the cortex did this dLGN cell start to react more strongly to the visual stimulus, but still almost no spontaneous firing occurred (not shown). Apart from a general elevation of the firing rate, the curves show that the relative part of the fundamental interval peak is more strongly pronounced during cortical stimulation than without.
Figure 5. Effect of cortical activation by glutamate on dLGN spike interval structure.
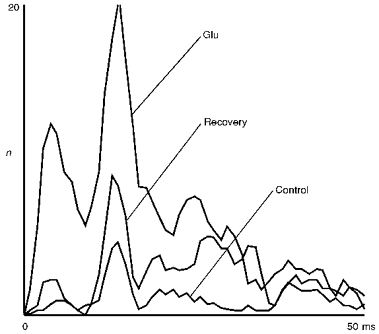
Recording of an X on-cell during stimulation of the cortex by micro-iontophoretical glutamate application (16 single-barrelled pipette array, ejection current ca. 20 nA per barrel, interleaved: 2 s injection, 3 s pause). This dLGN cell was recorded during pronounced synchronized EEG, which leads to an initially weak responsiveness (flashing spot stimulus; size, 0.5 deg; contrast, 0.5; recording times: Glu, 19 min after start of glutamate application; Recovery, 12 min after end of glutamate application; for other conventions see legend of Fig. 2). Total number of intervals: Control, 1028; Glu, 3465; Recovery, 1884.
Figure 6 shows the ISIHs of two X on-cells simultaneously recorded during cortex stimulation by micro-iontophoretical application of the glutamate receptor agonist quisqualate (Quis), and during a subsequent cortical inactivation by GABA. Figure 6A-D shows the activity of a dLGN relay cell possessing a receptive field topographically matched with the activation/inactivation site; the receptive field of the second cell (E-H) was displaced by about 9 deg. The matched cell first shows a slight increase in firing rate (B) during quisqualate application in the cortex. The interval pattern is shifted towards the first peak and only a shoulder remains of the second peak. Following GABA application in the cortex (C), the firing rate of this dLGN cell drops and the second peak now dominates. Recovery (D) is excellent, but both cells (matched and non-matched) produce fewer spikes than during the control recording. The non-matched cell does not react to the experimental manipulations of the cortex.
Figure 6. Effect of cortically applied Quis and GABA on two simultaneously recorded matched/non-matched dLGN cells.
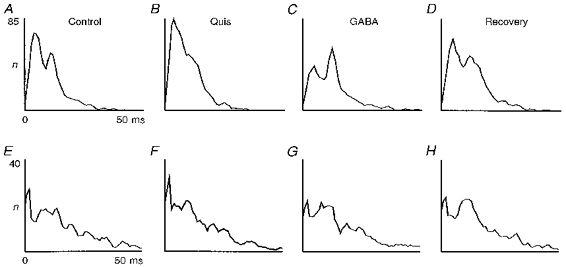
Simultaneous double-unit recording of two X on-cells. Cortex inactivation (GABA) and stimulation (Quis) were performed with a single multi-barrelled pipette (2 inactivation barrels, 2 stimulation barrels; ejection current: 50 nA for GABA; 30 nA per barrel interleaved application, 1 s on-1 s off, for Quis). The cell in A-D was recorded at the dLGN site which matched the cortical site. The other cell (E-H) was recorded at a site 9 deg away (spot stimuli size, 1.0 deg; contrast, 0.9; recording times: B and F, 11 min after stimulation onset, recovery in-between not shown; C and G, 13 min after inactivation onset; D and H, 4 min after start of recovery; for other conventions see legend of Fig. 2). Total number of intervals (A-D): 5003, 5432, 4005, 4862; (E-H): 2980, 3010, 2951, 2893.
As opposed to the other examples shown before, these cells were chosen to show moderate effects, which could easily be taken for a spontaneous change. Such a non-specific effect can be ruled out with confidence because the expected effects, which have an opposite direction for quisqualate and GABA, occurred only at the matched cell. This shows that even moderate responses to an alteration of the corticofugal influence can be reliably detected by such a combination of methods.
Quantitative evaluation
In order to assess the significance of the examples presented above, we further quantitatively analysed 136 (98 with cortical inactivation, plus 38 with cortical activation) recording sets taken from the 127 successfully tested cells. The treatment of the cortex by cooling or micro-iontophoretical application of substances is a rather crude method. Consequently, in many cases the subtle multimodal interval pattern of a response is totally disrupted and the activity decreases (cortical inactivation) or increases (cortical stimulation) so strongly that a change of the interval pattern cannot be observed any more. We define an interval pattern as disrupted if 200 ms after stimulus onset no more distinct peaks can be observed in the intervalograms used for pre-analysis. In general, a strong disruptive effect occured as the consequence of a very dramatic rate reduction during cortical inactivation or, in the case of pharmacological cortex activation, as the consequence of an unspecifically raised firing frequency. Changes in firing rates would in these cases amount to more than 75 % (and sometimes even more than 90 %) of the initial rates. Quantitative evaluation was achieved by semi-automatically fitting curves through the intervalograms. We regarded the interval pattern as disrupted if the fitting process failed after one-quarter of the time following the stimulus onset.
Strong disruptive effects were observed in sixty-seven recording sets; twenty-one of these showed a rate increase during cortical stimulation, and forty-six a rate decrease during cortical inactivation. In the group of ‘strong disruptive cases’ no examples showing the opposite effect were found (i.e. increase during inactivation, decrease during stimulation were not observed). In general, these findings are very similar to those reported in earlier studies (Kalil & Chase, 1970; Baker & Malpeli, 1977). In some cases a reduction of the application current could reduce these dramatic effects such that the resulting cell behaviour was more normal again. In many other cases, however, an ‘all-or-none’ behaviour was observed. We attribute such strong effects to the unnatural situation of influencing the cortical network rather unspecifically by cooling or micro-iontophoresis. Therefore, we focused the quantitative analysis on the distinct changes of the interval pattern which our semi-automatic procedure detected in a total of sixty-nine cells. For analysis, the one particular recording pair (control/treatment) was chosen which showed the strongest differential effect. We determined the ratio of the peak height of two adjacent peaks PN/PN+ 1 (either peak 1/peak 2 or peak 2/peak 3) in the ISIH. Table 2 summarizes the findings. To lead to a table entry in the top or bottom row a decrease/increase had to be more than 15 %, otherwise this cell was counted under ‘No change’. The limit of 15 % was chosen because changes up to 15 % could be observed when comparing control recordings taken from the same cell and during a constant EEG state. Thus, these ‘no change’ cases were ruled out in order to exclude randomly occurring variations of the interval pattern induced by the response variability of the cells. As suggested by the individual examples during cortical inactivation (GABA/Cool), the majority of the cells showed a decrease of the peak ratio, while the opposite effect was observed during cortical stimulation (Glu/Quis). Excluding the ‘No change’ row, a χ2 test could be applied to the data, which showed that these results are highly significant (χ2 = 10.97, P < 0.002). There was a small tendency for X cells to show a more pronounced reaction to cortical manipulations than Y cells, but this effect did not reach statistical significance.
Table 2.
Differential effects of cortical inactivation or stimulation on the ratio of two subsequent interval peaks
| GABA/Cool | Glu/Quis | |
|---|---|---|
| Ratio decrease | 0.70 (39) | 0.23 (3) |
| No change | 0.13 (7) | 0.08 (1) |
| Ratio increase | 0.18 (10) | 0.69 (9) |
Percentage and absolute number (in parentheses) of cells showing a decrease, no change, or an increase of the peak height ratio.
If the strong disruptive cases are included, we find eighty-five (46 + 39) cases with response reduction during cortical inactivation, and only seventeen cases with the opposite (or null) effect, which is equivalent to a percentage ratio of 83 to 17 %. During cortical stimulation, we get thirty (21 + 9) cells with increased response compared with four other cases (88 to 12 %).
Failure to counterbalance the effect of cortical cooling by bicuculline application in the dLGN
The gross effect observed during cortical inactivation in this and other studies (Kalil & Chase, 1970; Baker & Malpeli, 1977) is the reduction of the firing rate in the dLGN cells. An increased firing rate while the cortex is active could in principle result from a direct facilitatory cortical influence (Fig. 7, S1, black connection). On the other hand, it is well known that part of the corticofugal fibres terminate on inhibitory interneurons in the dLGN (Weber, Kalil & Behan, 1989). Thus, activation of the outer neuron in a chain of two connected inhibitory interneurons (Fig. 7, S2, black connections) would ultimately lead to disinhibition of the relay cell, resulting in an increased firing rate. These two alternatives were successfully tested by a rather elaborate combination of cortical inactivation and simultaneous pharmacological manipulation in eight dLGN relay cells, which all showed a similar behaviour. Figure 7A-L shows a sequence of recordings from a dLGN Y on-cell obtained under different conditions. The stimulus was a light spot of size 2.5 deg, which matched the receptive field centre very accurately so that no unbalanced surround inhibition from outside the receptive field centre was induced. A triple-barrelled micropipette was used for micro-iontophoresis and recording in the dLGN. Following the control recording, 5 nA ejection current was applied to the one barrel of the pipette containing GABA. The direct action of GABA at the recorded cell efficiently simulates an increase of inhibition (Fig. 7B), so that the interval pattern shifts strongly to the higher order peaks (Funke & Wörgötter, 1995). GABA application was then continued at the same level but in addition we applied the GABAA antagonist bicuculline (Bicu) with increasing dosage (10-20 nA, Fig. 7C and D). As expected, the inhibitory GABA effect could be almost totally antagonized, and the ejection current of Bicu (20 nA) was adjusted such that an optimal antagonizing effect was obtained without raising the level of spontaneous activity too much compared with control (A) and intermediate recovery (E). In the next step, drug application was stopped and the cooling probe which had been attached to the cortex was activated. Two recordings are shown (F and G) which demonstrate the reduction of dLGN activity during cooling but also show that significant fluctuations in the total number of intervals are observed even in subsequent records. As discussed above (see description of Fig. 2), the cooling effect is not as reliable as direct drug-induced effects shown in Fig. 7B-D, where only very small fluctuations were observed.
Figure 7. Interaction of cortex inactivation with disinhibition of dLGN relay cells by Bicu.
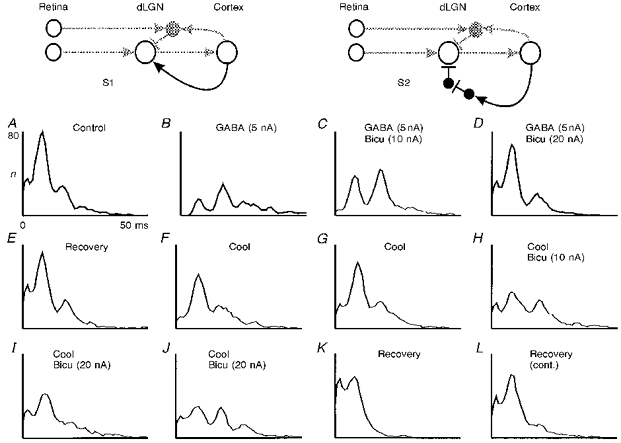
Simplified connection scheme of the primary visual pathway, showing the pathways for corticofugal facilitation (S1) or disinhibition (S2) stressed in black. A-L, combination of cooling the cortex and micro-iontophoresis of GABA and Bicu in the dLGN (Y on-cell; flashing spot stimulus; size, 2.5 deg; contrast, 0.9; single ejection barrels, ejection currents in nA, see figure). Recording times: B-D, starting immediately and continuing during drug application; E, immediate recovery after stopping the drug application; F, 28 min; G, 32 min; H, 36 min; I, 40 min; and J, 44 min after cooling onset; K, 15 min; and L, 18 min after termination of cooling. For other conventions see legend of Fig. 2. Total number of intervals n for the complete recordings (A-L): 8495, 4921, 7664, 8555, 8593, 6281, 6795, 7270, 7580, 7334, 8755, 8703.
If the cooling effect was due to the inactivation of a disinhibitory circuit (e.g. Fig. 7, S2), then increased inhibition at the relay cell should be the basis of the reduced activity. Consequently, in this case we would expect to be able to strongly antagonize the cooling effect with bicuculline. Contrary to this assumption, bicuculline could antagonize very little if any of the cooling effect (Fig. 7H-J). Measured not against the long-past control (A) but against the subsequent recovery (K and L), antagonization is even less. This weak antagonizing effect, however, falls into the range of the observed spontaneous fluctuations during cooling. In particular, the comparison of the small ‘antagonizing’ effect of bicuculline during cooling (I-J) with the total antagonization during GABA application (C-D) suggests that the predominant effect of the corticofugal feedback is mediated by direct facilitatory connections (e.g. Fig. 7, S1) and not by disinhibition.
Reduction of temporal dispersion of dLGN spike events by the action of the corticofugal pathway
Widening of interval peaks during cortical inactivation
During cortical inactivation, the activity was reduced and higher order interval peaks dominated. As an additional very pronounced effect, however, we observed a widening of the interval peaks. A closer inspection of the figures shown above (e.g. Fig. 2) reveals that a broadening of the interval peaks occurs as soon as the cortex is silenced. Figure 8A-D shows two additional examples of ISIHs obtained from cells not included in the other figures. Triangles were fitted by eye to the interval peak, which allowed for a comparison under both conditions - control and cortical inactivation. A significant broadening can be observed in all cases. Statistical analysis showed that this effect leads to a full width at half the height of the peak, which is on average 25 % wider during cortical inactivation than before. No differences in the effect on the peak widths were observed concerning cell classes X and Y, on/off.
Figure 8. Broadening of dLGN interval peaks during cortex inactivation and comparison of retinal and dLGN spike interval distributions.
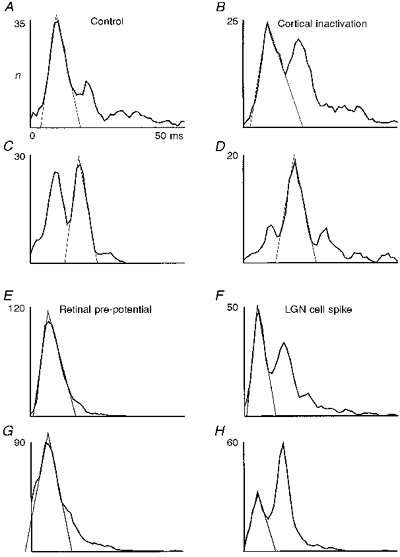
A-D, two ISIH pairs from dLGN cells before and during cortical inactivation. A and B, Y on-cell; C and D, X on-cell. Flashing spot stimuli size: A and B, 2.0 deg; C and D, 0.3 deg; contrast in all cases, 0.5. Recording times: B, 20 min; and D, 17 min after inactivation onset. Total number of intervals n for the complete recordings (A-D): 4375, 3643, 4120, 3511. E-H, ISIHs of 2 pairs of simultaneously recorded retinal pre-potentials and corresponding dLGN target cell spikes. Both recordings from X on-cells. Flashing spot stimuli: E and F: size, 1.0 deg; G and H: size, 0.3 deg; contrast in all cases, 0.9. Total number of intervals n for the complete recordings (E-H): 8656, 6797, 7711, 6812.
Table 3 shows the summary of the findings for the same sixty-nine cells as in Table 2. A change of below ± 10 % was counted as ‘no change’ because variation of up to 10 % can be found when comparing untreated control recordings (during stable EEG). Cortical inactivation leads to a widening of the interval peaks in 57 % of the cases, while cortical stimulation made them sharper in 46 % of the cases. Thus, the widening effect seems to be rather pronounced, while sharpening occurs in a less reliable way. Excluding the ‘No change’ row, we get statistical significance with χ2 = 4.65, P < 0.03. The model described below will be used to explain this effect.
Table 3.
Differential effects of cortical inactivation or stimulation on the sharpness of the interval peaks
| GABA/Cool | Glu/Quis | |
|---|---|---|
| Broader | 0.57 (32) | 0.30 (4) |
| No change | 0.25 (14) | 0.23 (2) |
| Sharper | 0.18 (10) | 0.46 (7) |
Percentage and absolute number (in parentheses) of cells showing a broadening, no change, or a sharpening of the interval peaks.
Retinal pre-potentials
In general one would expect that synaptic noise and other inputs converging at a dLGN or cortex cell would produce significant temporal jitter, which should result in an increasingly larger temporal dispersion of the neuronal events when higher levels of the sensory system are approached. Figure 8E-H shows two examples of ISIHs obtained from retinal pre-potentials (Kaplan & Shapley, 1984) and their respective target dLGN cells. Recordings were obtained from a single tungsten electrode and pre-potentials were separated from neuronal spikes by means of a window discriminator (Funke & Wörgötter 1995).
Quite unexpectedly, the diagrams show that the interval peaks of dLGN cells are narrower than those of their afferents, as can be best judged from the triangles fitted to the peaks. This effect could be quite strong, as seen in Fig. 8E and F, and it did not remain restricted to the first (fundamental) interval peak but could also be observed for the higher order peaks of dLGN activity. This finding was confirmed in twelve pairs of pre-potential and dLGN spike recordings. From the results from the previous section, the possibility that this is an effect of response rate reduction can be ruled out, because the response rate is even more reduced during cortical cooling, but the reverse effect - a widening of the peaks - is observed under this condition.
The results shown in this and the previous section suggest that the corticofugal feedback is able to reduce the temporal dispersion of spike events at the level of the dLGN, thereby sharpening the interval distributions.
Model results
In the context of a physiological study, modelling can have a predictive and/or explanatory function. We are mainly concerned with the second aspect. Thus, the goal of our model is to capture the basic mechanisms which underlie the experimentally observed effects with the smallest possible model set-up in order to depict most clearly the sensitive parameters. The previous sections have provided evidence for the basic connection scheme depicted in Fig. 7, S1. This scheme is certainly an oversimplification of the actual connection pattern of the primary visual pathway. Nevertheless, it is a sufficiently realistic starting point for our biophysical model, the goal of which is to capture the observed temporal effects in a generic way. Several more complicated connection patterns have also been tested, with results being qualitatively identical (not shown).
Example
Figure 9 shows the interspike interval distribution (B and C) and dominant retinal input (A) for an example model dLGN cell. The connections of the model cell correspond to those shown in the connection matrix (Fig. 1B) and the retinal interval distribution was pre-defined reflecting experimentally measured distributions (Troy & Robson, 1992; Funke & Wörgötter, 1995). The example demonstrates that the dLGN cell produces two interval peaks while the retinal afferent has only one. This effect is due to intra-dLGN deletion inhibition (Funke & Wörgötter, 1995). In order to show the fine-tuning of the model behaviour, an example was chosen which showed a moderate effect. Thus, similar to many experimental recordings, in this example the second interval peak is also slightly enhanced in relation to the first (leftmost) peak if the excitatory corticofugal influence is switched off (Fig. 9C). In addition, however, one can observe that the first ISIH peak of the dLGN cell is much narrower (B) than the peak of the afferent input to the dLGN (A) if the corticofugal feedback is active. As soon as the feedback is switched off, this interval peak broadens (C) and becomes similar to the single interval peak of the retinal cell. Here, the broadening amounts to 2.6 ms measured at the base of the fitted triangle (equivalent to 1.4 ms full width at half-peak height), which is similar to the average effect observed experimentally. In general, changes in the peak width of up to 6 ms (baseline) can be induced in the model without leaving the physiological parameter range of the model.
Figure 9. Modelling results.
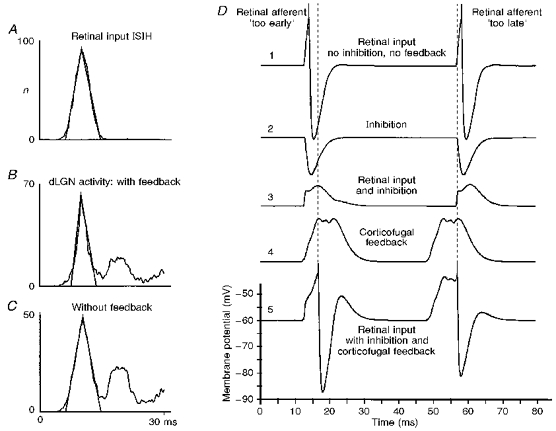
A-C, reduction of the temporal dispersion of dLGN spiking obtained from the computer model. The spatial weighting function for all excitatory projections has the shape of a truncated Gaussian function with a range of 7 cells for thalamo-cortical, 11 cells for the intracortical and 9 cells for the cortico-thalamic projections. Each dLGN relay neuron receives input from 2 inhibitory interneurons, which are also weakly stimulated by the corresponding cortical neurons. A delay was chosen of 3.5 ms for the thalamo-cortical projections, 0.5 ms for intracortical connections and 5.5 ms for corticofugal feedback. A, ISIH of the retinal input, modelled by a truncated Gaussian function of mean, 10 ms and standard deviation, 2 ms. B, corresponding ISIH of the target dLGN cell in the presence of inhibition leading to a partial elimination of spikes and the generation of higher order interval peaks. The corticofugal feedback is active in B. C, ISIH of a dLGN cell in the absence of corticofugal feedback. D, mechanisms of the sharpening effect in a model cell. The top trace (1) shows the action potentials in a model dLGN cell generated by a retinal input that is slightly ahead (left side) or slightly delayed (right side) with respect to the inputs to neighbouring dLGN cells. In the case where the generation of the action potential is masked by inhibition (trace 2) - presumably from thalamic interneurons - the combined input would remain subthreshold (trace 3). However, the corticofugal feedback (trace 4), representing a temporally averaged bulk signal, further modulates the membrane potential of the dLGN cell and leads to a temporal shift of the misplaced action potentials (trace 5) towards the timing represented by the bulk signal (dashed line).
Mechanism
One advantage of a computer simulation is that each individual input to a target cell can be displayed and analysed, which is not even possible with intracellular recordings or cell membrane patching methods. Thus, by using our model, the question of how the individual components co-operate such that the dLGN interval peaks get sharpened, in the case of active corticofugal feedback, can be addressed. Trace 1 in Fig. 9D shows the membrane potential trace resulting if only the afferent retinal input to the dLGN relay cell is active. It has been reported that the retino-geniculate signal transmission is, under optimal circumstances (i.e. optimal stimulus, no inhibition, etc.), very close to 1:1 (Kaplan & Shapley, 1984; Mastronarde, 1987). The high susceptibility of dLGN cells to inhibitory influences as observed experimentally (Sillito & Kemp, 1983; Eysel, Pape & van Schayck, 1987; Funke & Wörgötter, 1995), however, suggests that the spiking threshold is just reached by the afferent EPSPs. We assume that this is also the case in our model. Thus, the input by itself is (almost always) supra-threshold by a small margin, and elicits a spike at the target cell as shown in trace 1. The intra-dLGN deletion inhibition is implemented in a way that it is only weakly correlated to the retinal input (correlation is due to a weak correlation in retinal firing at stimulus onset, and due to cortical projections to inhibitory interneurons). Thus, retinally induced IPSPs are often little correlated to the direct retinal afferent EPSPs. Nonetheless, a situation similar to that shown in trace 2, where both IPSPs are elicited almost simultaneously to the EPSPs, occurs very often, since IPSPs are rather long compared with the short interEPSP intervals. Thus, the inhibition is often sufficient to cancel the excitation and prevent a dLGN spike (trace 3). This leads to the expression of higher order interval peaks in the ISIH of the dLGN cell. Due to the intracortical connection structure (Fig. 1B), a temporal signal averaging occurs in the afferent pathway at the level of the cortical cell population involved in this loop. This averaged signal can be observed in the summed activity of all corticofugal feedback connections converging at this dLGN cell, as shown in trace 4. Almost always it has the shape of a hump with a relatively flat plateau. The final summation of traces 3 and 4 leads to the actual membrane potential of the dLGN cell (trace 5). It can be seen that the first spike in the example is delayed compared with the one which would have been elicited by the retinal afferent alone, while the second spike comes earlier. For the whole spike train this effect essentially amounts to a temporal averaging of the retinal interspike interval lengths, which reduces the signal dispersion and, thus, results in sharper interval peaks.
An essential requirement of this mechanism is, therefore, that the cortex can take over the timing control, which is only possible because intra-dLGN inhibition prevents often direct afferently induced firing. The actual shape of the inhibition (e.g. triadic/correlated versus uncorrelated; short-lasting versus long-lasting), however, seems to play a minor role. Of the two effects - accelerating versus delaying of a dLGN spike - the acceleration effect, which is essentially a latency reduction (Köhn & Wörgötter, 1996), is robust and generic because it always occurs as soon as there is a pre-depolarization plateau from the cortex. The delaying effect depends more critically on a timed inhibition which initially cancels the (‘too early’) retinal EPSPs. Thus, this effect arises less robustly in our model compared with the acceleration of spikes.
Robustness
In addition, the model allows us to determine the robustness of the observed effects. Since the timing of the dLGN events is altered by the corticofugal pathway, we expected that the relationship between the afferent interval duration and the loop duration of the feedback would influence the observed behaviour most strongly. We assumed a total thalamo-cortical (axonal and synaptic) delay of 3.5 ms and a feedback delay of 5.5 ms, leading to 9 ms full-loop delay. In reality the afferent (retinal) interval duration can change easily as a consequence of changing stimulus contrast. This was also simulated in the model. We found a periodically changing relationship between the two curves obtained with and without feedback (Fig. 10A). To obtain these curves, the full width of the first interval peak was measured at half-peak height (FWHH). In the input interval range of 6-8 ms the dLGN interval peaks have the same width as those of their retinal afferents. Thus, here the ‘sharpening mechanism’ is only able to counteract the effect of the simulated noise which would normally lead to a widening of the interval distributions. In this input regime (6-8 ms) the corticofugal spikes arrive after the (next) retinal spike; thus, they cannot accelerate dLGN spiking. The delaying effect described above only plays a minor role and may be responsible for maintaining the initial interval peak width by cancelling the noise-induced distortions. The strongest ‘sharpening effect’ is observed for an input interval length of 9.5 ms. In this case a corticofugal spike with a loop delay of 9 ms reaches the dLGN cell just before the next retinal afferent spike arrives, and the pre-depolarization from the cortex spike accelerates dLGN spiking. The efficacy with which such an effect is induced is dependent on the relationship between input interval and loop delay. As a consequence we find a ‘sharpening effect’ of varying strength within the input interval range of 8.5-12 ms. A similar explanation applies for the input interval range 5-6 ms. Here the second-next retina spike is accelerated by the pre-depolarization plateau. Between 12 and 15 ms the dLGN interval peaks are slightly wider than their retinal counterparts. Here the corticofugal spikes arrive too early and the pre-depolarization plateau has already vanished before the next retinal EPSP comes in. The widening of the interval peaks is induced by the simulated noise inputs, and identical peak widths are obtained as soon as the noise is switched off.
Figure 10. Robustness of the model.
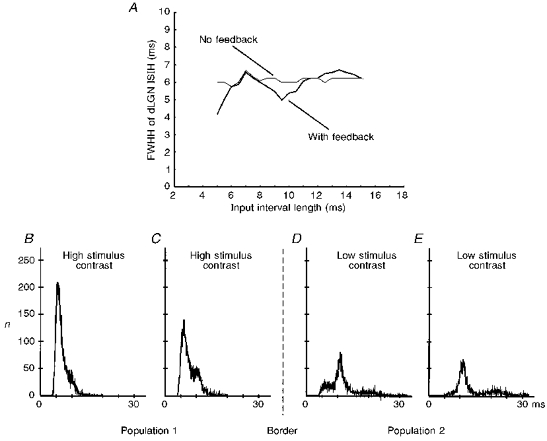
A, full width at half-height (FWHH) of the first interval peak averaged from 50 model dLGN cells with and without corticofugal feedback as a function of the changing retinal input interval length. Standard deviations are in all cases below 1 % of the measured value. Actually overlapping lines around the first peak in the diagram have been slightly displaced for graphical reasons. B-E, ISIHs of 4 simulated dLGN cells located in 2 different populations responding to 2 external stimuli of differing contrast. The cells form a linear stretch across the border of the 2 populations. Connections for all cells are homogeneous and overlapping for the 2 populations. In particular, there is a thalamo-cortical projection that extends over 5 cells, an intracortical projection to 9 cells, and a cortico-thalamic back-projection of a single cortical cell to 7 dLGN cells, with a relative synaptic strength of 2:1:1, respectively. All projections are topographic and the spatial weighting functions are truncated Gaussian functions.
The lateral connections at the level of cortex and dLGN will also induce some degree of sensitivity to variations in the input between adjacent cells, and the spread of lateral interaction could also distort the interval structure in the model cells. In Fig. 10B-E, two stimuli with different contrasts were used (top) which led to different fundamental interval lengths for the retinal input cells. In this figure we show four adjacent dLGN cells taken from the centre of the simulated cell population with the border between both stimuli located between cells C and D. Despite the strong connectivity overlap within the cortex and the rather widespread corticofugal divergence, we observe that only those two cells directly adjacent to the border (cells C and D) will be affected by the ‘wrong’ input intervals, leading to a distorted interval distribution. Already, the neighbouring cells (B and E) respond almost exclusively with their own interval length and only a small shoulder can be observed for cell B. This robustness against lateral distortions is due to the rather weak intracortical and corticofugal connection strength, which will only lead to an effect if afferent (retinal) and efferent (corticofugal) signals coincide within a reasonable temporal interval.
DISCUSSION
Experimental restrictions
This study was intended to show the effect of manipulating the corticofugal feedback on the temporal structure of cell responses elicited from the classical receptive field of dLGN cells. To this end, stimuli were chosen which specifically drive the dLGN receptive fields (small flashing dots), in order to restrict the analysis, as far as possible, to the direct signal flow from retina to dLGN to cortex and back. Larger (moving) stimuli, which would drive the cortex more strongly, were avoided because they induce peripheral effects at all levels in the primary visual pathway. In addition, large stimuli induce responses from other parts of the visual pathway (e.g. pretectum, superior colliculus, perigeniculate nucleus) which may interfere with the analysis. Applying this approach we were able to demonstrate that the interspike interval pattern of the dLGN cells is redistributed into the higher order peaks if the cortex is inactive. This effect is accompanied by an increased temporal dispersion of the spike occurrence times of the cells. Furthermore, the activity redistribution into the higher order peaks was always accompanied by a reduction of the mean firing rate, as has been reported earlier (Kalil & Chase, 1970; Baker & Malpeli, 1977). This indicated either a gross facilitatory or a gross disinhibitory action of the active corticofugal feedback. However, counter-balancing of the corticofugal inactivation by micro-iontophoretical application of the GABAA antagonist bicuculline methiodide in the dLGN (Fig. 7) was largely unsuccessful, voting against corticofugally induced disinhibition. Thus, direct facilitation seems to be the major effect of the corticofugal loop. In support of this, anatomical studies show that probably all corticofugal fibres are excitatory (Baughman & Gilbert, 1980; Scharfman, Lu, Guido, Adams & Sherman, 1990; Montero, 1994), and that the majority of them terminate on the relay cells in the dLGN. The elimination of the gross facilitatory corticofugal effect could lead to the described moderate redistribution of activity; it did, however, in many cases result in a very strong rate reduction, silencing the dLGN cells almost entirely (see ‘Quantitative evaluation’). Currently, cortical inactivation even by a single GABA pipette is still a rather crude method which interferes strongly with the subtle activity equilibrium existing in the network of the primary visual pathway. Thus, in many cases observed in the course of this study, the rate reduction was so strong that the multi-interval pattern was completely disrupted. The focus of this study, however, lay on the time structure of the dLGN responses. Therefore, analysis was prevented in all these cases where silencing of the cortex reduced the dLGN activity too strongly. In the physiological state of an awake and untreated individual it can be expected that the corticofugal influence changes (globally or locally) more moderately than in our experimental procedures. Therefore, it seems reasonable to assume that the sample of sixty-nine cells which showed moderate effects better reflect a physiologically realistic situation than those which were entirely silenced.
Rate reduction was the predominant effect in this and previous studies investigating the influence of the corticofugal effect (Kalil & Chase, 1970; Baker & Malpeli, 1977). The subgroup of cortical synapses which terminate at dLGN interneurons is also silenced during cortical inactivation. Apparently, however, this group of cells does not exert a strong enough influence on the dLGN cells to be observable under our experimental conditions. This may be due to the fact that corticofugally mediated inhibition which involves one more synapse will in general be delayed with respect to the excitation. Removal of the prevalent excitation will, thus, hide any more subtle effects arising from the inhibition. Only during the onset of inactivation did we find, in several cases, a transient rate increase in the dLGN cells (not shown). This could indicate either that the inhibitory interneurons in the dLGN are first affected by removal of the feedback, or that the cortical inactivation first affects the smaller inhibitory interneurons in the cortex itself, which then leads to an increased activity in the cortico-geniculate feedback loop. Differential effects on the dLGN cells could indeed be induced, by Tsumoto, Creutzfeld & Legendy (1978), when varying the spatial relationship between the dLGN recording site and the cortical site of glutamate application. Any conclusion about a possible temporal sequence of inactivation effects, first affecting the interneurons and then the relay cells, however, remains speculative at the currently available state of analysis.
The high susceptibility of dLGN cells to state changes in the neuronal network is also reflected by alterations in the cell responses which occur following fluctuations in the EEG (Sawai et al. 1988; see also Fig. 3). For example, the tonic response that normally follows a flashing dot stimulus during less-synchronized EEG can be strongly reduced during a δ-wave (synchronized) EEG. This effect can be so dominant that it can be confounded easily with a similar activity reduction induced by corticofugal inactivation. Therefore, in the current study, and opposed to all other previous reports (Kalil & Chase, 1970; Baker & Malpeli, 1977; McClurkin & Marrocco, 1984; McClurkin, Optican & Richmond, 1994; Sillito et al. 1994), critical care was taken to ensure stable EEG conditions during a set of records. To ensure the validity of the power spectral analysis method used to determine EEG state changes (see Methods), additional controls were made with double-unit recordings (Fig. 6). We found that corticofugal inactivation/activation affected only the dLGN cells at the topographically matched electrode, supporting the observations of McClurkin et al. (1994). If the activity was reduced at both locations, the EEG spectral power analysis always revealed a change of the EEG towards a more synchronized pattern. Therefore, we could use power spectral analysis with confidence to eliminate all sequences recorded during an EEG change. Obviously, this rigorous procedure reduced the final number of usable data sets markedly, but the remaining sixty-nine cases are optimally controlled for a possible EEG interference. At this point it may be interesting to speculate about the effects of subtle EEG changes in alert animals, e.g. when switching between drowsiness (α-wave EEG) and true alertness (β-wave EEG). In view of our results we would expect that the temporal (and spatial?) structure of the receptive fields in the visual pathway would change significantly during such a transition.
Functional considerations
Probably the most intriguing result of this study is the decreased temporal dispersion of the dLGN activity during active cortex (see also Funke et al. 1996). In general, one would expect that the accumulation of synaptic noise would result in an increasingly larger temporal dispersion of the neuronal events when higher levels of the sensory system are approached. The corticofugal feedback seems to counteract such an unwanted effect at the retino-geniculate connection.
Such a ‘sharpening effect’ may also explain the findings of Sillito et al. (1994), who reported the deterioration of the synchronization between dLGN cells as soon as the cortex was removed. Similarly, here we find that the model dLGN cells are only correlated if the corticofugal feedback is active (not shown). The improved timing accuracy of dLGN spikes is due, very probably, mainly to a reduced latency of ‘lagging’ spikes, as predicted from a different modelling approach addressing the function of the corticofugal feedback (see Discussion in Köhn & Wörgötter, 1996). Synchronization and improved timing accuracy of dLGN spikes during active corticofugal feedback arises, in our model, from a very generic model set-up within a broad parameter range, demonstrating the robustness of this effect. Recent modelling studies suggest that some of the neuronal properties in the visual cortex, like orientation and direction selectivity, arise even without a highly specific wiring of the model (Wörgötter & Koch, 1991; Somers, Nelson & Sur, 1995; Douglas, Koch, Mahowald, Martin & Suarez, 1995). While this cannot be taken as proof, it nevertheless indicates that little connection specificity may in many cases suffice to generate the desired cell characteristics in a very robust way. Two independent lines of evidence arise from our study supporting this notion: (1) subtle modifications of the dLGN firing rate and interval pattern can be induced by relatively broad depolarizing or hyperpolarizing effects, and (2) the improved temporal accuracy of spike transmission arises generically from the feedback loop. Both effects do not rely on a highly specific model set-up, and support the generic operation mode of the primary visual pathway.
Acknowledgments
The authors are grateful to U. Neubacher, W. Kleefeld and J. Köhn for technical support. We wish to thank Z. Kisvarday for his critical comments on the manuscript and U. Eysel for his on-going support and many interesting discussions. This work was supported by the Deutsche Forschungsgemeinschaft, WO388/4-2, 4-3, 6-1 and SFB509,A4 as well as by the Human Frontier Science Program RG0035/1997-B.
References
- Baker FH, Malpeli JG. Effects of cryogenic blockade of visual cortex on the responses of lateral geniculate neurons in the monkey. Experimental Brain Research. 1977;29:433–444. doi: 10.1007/BF00236182. [DOI] [PubMed] [Google Scholar]
- Baughman RW, Gilbert CD. Aspartate and glutamate as possible neurotransmitters of cells in layer 6 of the visual cortex. Nature. 1980;287:848–850. doi: 10.1038/287848a0. [DOI] [PubMed] [Google Scholar]
- Bishop PO, Levick WR, Williams WO. Statistical analysis of the dark discharge of lateral geniculate neurones. The Journal of Physiology. 1964;170:598–612. doi: 10.1113/jphysiol.1964.sp007352. [DOI] [PMC free article] [PubMed] [Google Scholar]
- Bringuier V, Fregnac Y, Debanne D, Shulz D, Baranyi A. Synaptic origin of rhythmic visually evoked activity in kitten area 17 neurons. NeuroReport. 1992;3:1065–1068. doi: 10.1097/00001756-199212000-00008. [DOI] [PubMed] [Google Scholar]
- Cleland BG, Dubin MW, Levick WR. Sustained and transient neurones in the cat's retina and lateral geniculate nucleus. The Journal of Physiology. 1971;217:473–496. doi: 10.1113/jphysiol.1971.sp009581. [DOI] [PMC free article] [PubMed] [Google Scholar]
- Cudeiro J, Sillito AM. Spatial frequency tuning of orientation-discontinuity sensitive corticofugal feedback to the cat lateral geniculate nucleus. The Journal of Physiology. 1996;490:481–492. doi: 10.1113/jphysiol.1996.sp021159. [DOI] [PMC free article] [PubMed] [Google Scholar]
- Curró Dossi R, Nuñez A, Steriade M. Electrophysiology of a slow (0.5-4 Hz) intrinsic oscillation of cat thalamocortical neurones in vivo. Journal of Physiology. 1992;447:215–234. doi: 10.1113/jphysiol.1992.sp018999. [DOI] [PMC free article] [PubMed] [Google Scholar]
- Derrington AM, Fuchs AF. Spatial and temporal properties of X and Y cells in the cat lateral geniculate nucleus. The Journal of Physiology. 1979;293:347–364. doi: 10.1113/jphysiol.1979.sp012893. [DOI] [PMC free article] [PubMed] [Google Scholar]
- Doty RW, Kimura DS. Oscillatory potentials in the visual system of cats and monkeys. The Journal of Physiology. 1963;168:205–218. doi: 10.1113/jphysiol.1963.sp007187. [DOI] [PMC free article] [PubMed] [Google Scholar]
- Douglas RJ, Koch C, Mahowald M, Martin KAC, Suarez HH. Recurrent excitation in neocortical circuits. Science. 1995;269:981–985. doi: 10.1126/science.7638624. [DOI] [PubMed] [Google Scholar]
- Eckhorn R. Oscillatory and non-oscillatory synchronisations in the visual cortex and their possible roles in associations of visual features. Progress in Brain Research. 1994;102:405–426. doi: 10.1016/S0079-6123(08)60556-7. [DOI] [PubMed] [Google Scholar]
- Eckhorn R, Bauer R, Jordan W, Brosch M, Kruse W, Munk M, Reitböck HJ. Coherent oscillations: A mechanism for feature linking in the visual cortex. Biological Cybernetics. 1988;60:121–130. doi: 10.1007/BF00202899. [DOI] [PubMed] [Google Scholar]
- Eysel UT, Pape HC, van Schayck R. Contributions of inhibitory mechanisms to the shift responses of X and Y cells in the cat lateral geniculate nucleus. The Journal of Physiology. 1987;388:199–212. doi: 10.1113/jphysiol.1987.sp016610. [DOI] [PMC free article] [PubMed] [Google Scholar]
- Funke K, Nelle E, Li B, Wörgötter F. Corticofugal feedback improves the timing of retino-geniculate signal transmission. NeuroReport. 1996;7:2130–2134. doi: 10.1097/00001756-199609020-00013. [DOI] [PubMed] [Google Scholar]
- Funke K, Wörgötter F. Temporal structure in the light response of relay cells in the dorsal lateral geniculate nucleus of the cat. The Journal of Physiology. 1995;485:715–737. doi: 10.1113/jphysiol.1995.sp020764. [DOI] [PMC free article] [PubMed] [Google Scholar]
- Ghose GM, Freeman RD. Oscillatory discharge in the visual system – does it have a functional role. Journal of Neurophysiology. 1992;68:1558–1574. doi: 10.1152/jn.1992.68.5.1558. [DOI] [PubMed] [Google Scholar]
- Gray CM, König P, Engel AK, Singer W. Oscillatory responses in cat visual cortex exhibit inter-columnar synchronisation which reflects global stimulus properties. Nature. 1989;338:334–337. doi: 10.1038/338334a0. 10.1038/338334a0. [DOI] [PubMed] [Google Scholar]
- Kalil RE, Chase R. Corticofugal influence on activity of lateral geniculate neurons in the cat. Journal of Neurophysiology. 1970;33:459–474. doi: 10.1152/jn.1970.33.3.459. [DOI] [PubMed] [Google Scholar]
- Kaplan E, Shapley R. The origin of the S (slow) potential in the mammalian lateral geniculate nucleus. Experimental Brain Research. 1984;55:111–116. doi: 10.1007/BF00240504. [DOI] [PubMed] [Google Scholar]
- Köhn J, Wörgötter F. Corticofugal feedback can reduce the visual latency of responses to antagonistic stimuli. Biological Cybernetics. 1996;75:199–209. doi: 10.1007/s004220050287. 10.1007/s004220050287. [DOI] [PubMed] [Google Scholar]
- McClurkin JW, Marrocco RT. Visual cortical input alters spatial tuning in monkey lateral geniculate nucleus cells. The Journal of Physiology. 1984;348:135–152. doi: 10.1113/jphysiol.1984.sp015103. [DOI] [PMC free article] [PubMed] [Google Scholar]
- McClurkin JW, Optican LM, Richmond BJ. Cortical feedback increases visual information transmitted by monkey parvocellular lateral geniculate nucleus neurons. Visual Neuroscience. 1994;11:601–617. doi: 10.1017/s0952523800002492. [DOI] [PubMed] [Google Scholar]
- Mastronarde DN. Two classes of single-input X-cells in cat lateral geniculate nucleus. I. Receptive-field properties and classification of cells. Journal of Neurophysiology. 1987;57:357–380. doi: 10.1152/jn.1987.57.2.357. [DOI] [PubMed] [Google Scholar]
- Meister M, Lagnado L, Baylor DA. Concerted signalling by retinal ganglion cells. Science. 1995;270:1207–1210. doi: 10.1126/science.270.5239.1207. [DOI] [PubMed] [Google Scholar]
- Montero VM. Quantitative immunogold evidence for enrichment of glutamate but not aspartate in synaptic terminals of retino-geniculate, geniculo-cortical, and cortico-geniculate axons in the cat. Visual Neuroscience. 1994;11:675–681. doi: 10.1017/s0952523800002984. [DOI] [PubMed] [Google Scholar]
- Sawai H, Morigiwa K, Fukuda Y. Effects of EEG synchronisation on visual responses of the cat's geniculate relay cells: A comparison among Y, X and W cells. Brain Research. 1988;455:394–400. doi: 10.1016/0006-8993(88)90102-3. 10.1016/0006-8993(88)90102-3. [DOI] [PubMed] [Google Scholar]
- Scharfman HE, Lu SM, Guido W, Adams PR, Sherman SM. N-methyl-D-aspartate receptors contribute to excitatory postsynaptic potentials of cat lateral geniculate neurons recorded in thalamic slices. Proceedings of the National Academy of Sciences of the USA. 1990;87:4548–4552. doi: 10.1073/pnas.87.12.4548. [DOI] [PMC free article] [PubMed] [Google Scholar]
- Schmielau F, Singer W. The role of visual cortex for binocular interactions in the cat lateral geniculate nucleus. Brain Research. 1977;120:354–361. doi: 10.1016/0006-8993(77)90914-3. 10.1016/0006-8993(77)90914-3. [DOI] [PubMed] [Google Scholar]
- Sillito AM, Cudeiro J, Murphy PC. Orientation sensitive elements in the corticofugal influence on centre-surround interactions in the dorsal lateral geniculate nucleus. Experimental Brain Research. 1993;93:6–16. doi: 10.1007/BF00227775. [DOI] [PubMed] [Google Scholar]
- Sillito AM, Jones HE, Gerstein GL, West DC. Feature-linked synchronisation of thalamic relay cell firing induced by feedback from the visual cortex. Nature. 1994;369:479–482. doi: 10.1038/369479a0. 10.1038/369479a0. [DOI] [PubMed] [Google Scholar]
- Sillito AM, Kemp JA. The influence of GABAergic inhibitory processes on the receptive field structure of X and Y cells in cat dorsal lateral geniculate nucleus (dLGN) Brain Research. 1983;277:63–77. doi: 10.1016/0006-8993(83)90908-3. 10.1016/0006-8993(83)90908-3. [DOI] [PubMed] [Google Scholar]
- Singer W, Gray CM. Visual feature integration and the temporal correlation hypothesis. Annual Review of Neuroscience. 1995;18:555–586. doi: 10.1146/annurev.ne.18.030195.003011. 10.1146/annurev.ne.18.030195.003011. [DOI] [PubMed] [Google Scholar]
- Somers DC, Nelson SB, Sur M. An emergent model of orientation selectivity in cat visual cortical simple cells. Journal of Neuroscience. 1995;15:5448–5465. doi: 10.1523/JNEUROSCI.15-08-05448.1995. [DOI] [PMC free article] [PubMed] [Google Scholar]
- Stone J, Hoffmann K-P. Conduction velocity as a parameter in the organisation of the afferent relay in the cat's lateral geniculate nucleus. Brain Research. 1971;32:454–459. doi: 10.1016/0006-8993(71)90339-8. 10.1016/0006-8993(71)90339-8. [DOI] [PubMed] [Google Scholar]
- Troy JB, Enroth-Cugell C. X-ganglion and Y-ganglion cells inform the cat's brain about contrast in the retinal image. Experimental Brain Research. 1993;93:383–390. doi: 10.1007/BF00229354. [DOI] [PubMed] [Google Scholar]
- Troy JB, Robson JG. Steady discharges of X-retinal and Y-retinal ganglion cells of cat under photopic illuminance. Visual Neuroscience. 1992;9:535–553. doi: 10.1017/s0952523800001784. [DOI] [PubMed] [Google Scholar]
- Tsumoto T, Creutzfeldt OD, Legendy CR. Functional organisation of the corticofugal system from visual cortex to lateral geniculate nucleus in the cat. With an appendix on geniculo-cortical mono-synaptic connections. Experimental Brain Research. 1978;32:345–364. doi: 10.1007/BF00238707. [DOI] [PubMed] [Google Scholar]
- Tsumoto T, Suda K. Three groups of corticogeniculate neurons and their distribution in binocular and monocular segments of cat striate cortex. Journal of Comparative Neurology. 1980;193:223–236. doi: 10.1002/cne.901930115. [DOI] [PubMed] [Google Scholar]
- Weber AJ, Kalil RE, Behan M. Synaptic connections between corticogeniculate axons and interneurons in the dorsal lateral geniculate nucleus of the cat. Journal of Comparative Neurology. 1989;289:156–164. doi: 10.1002/cne.902890113. [DOI] [PubMed] [Google Scholar]
- Wörgötter F, Funke K. Fine structure analysis of temporal patterns in the light response of cells in the lateral geniculate nucleus of cat. Visual Neuroscience. 1995;12:469–484. doi: 10.1017/s0952523800008373. [DOI] [PubMed] [Google Scholar]
- Wörgötter F, Koch C. A detailed model of the primary visual pathway in the cat – comparison of afferent excitatory and intracortical inhibitory connection schemes for orientation selectivity. Journal of Neuroscience. 1991;11:1959–1979. doi: 10.1523/JNEUROSCI.11-07-01959.1991. [DOI] [PMC free article] [PubMed] [Google Scholar]