Abstract
The effect of age and body size on the bouncing mechanism of running was studied in children aged 2-16 years.
The natural frequency of the bouncing system (fs) and the external work required to move the centre of mass of the body were measured using a force platform.
At all ages, during running below ≈11 km h−1, the freely chosen step frequency (f) is about equal to fs (symmetric rebound), independent of speed, although it decreases with age from 4 Hz at 2 years to 2.5 Hz above 12 years.
The decrease of step frequency with age is associated with a decrease in the mass-specific vertical stiffness of the bouncing system (k/m) due to an increase of the body mass (m) with a constant stiffness (k). Above 12 years, k/m and f remain approximately constant due to a parallel increase in both k and m with age.
Above the critical speed of ≈11 km h−1, independent of age, the rebound becomes asymmetric, i.e. f < fs.
The maximum running speed (V¯f,max) increases with age while the step frequency at remains constant (≈4 Hz), independent of age.
At a given speed, the higher step frequency in preteens results in a mass-specific power against gravity less than that in adults. The external power required to move the centre of mass of the body is correspondingly reduced.
Walking is characterized by a pendular exchange between gravitational potential energy and kinetic energy of the centre of mass of the body, whereas running is characterized by an elastic rebound of the body within each step. The recovery of mechanical energy through the pendular mechanism of walking has been found to change with age and body size in children, attaining a maximum at lower speeds in the younger subjects (Cavagna, Franzetti & Fuchimoto, 1983). To our knowledge, the changes in the bouncing mechanism of running during growth have not been investigated.
In a previous study (Cavagna, Franzetti, Heglund & Willems, 1988), the mechanism of running was analysed in adult humans and other vertebrates. The step period and the vertical oscillation of the centre of mass of the body were divided into two parts: one during which the vertical ground reaction force is greater than body weight (the lower part of the oscillation, taking place during the contact of the foot on the ground) and the other during which the vertical ground reaction force is less than body weight (the upper part of the oscillation, taking place both during ground contact and aerial phase). The duration of the lower part of the oscillation was considered to be one-half of the period of the elastic bounce of the body. The upper part of the oscillation may be compared with the second half of the oscillation only if the aerial phase is nil. If the body leaves the ground, the elastic model is not valid during the upper part of the oscillation because the restoring force is no longer proportional to the displacement (since the vertical acceleration is constant). However, even when an aerial phase exists, the elastic mechanism functions during the lower part of the oscillation.
In adults running at low and intermediate speeds, the duration and the amplitude of the lower part of the oscillation of the centre of mass of the body are about equal to those of the upper part (symmetric rebound). In this case, the freely chosen step frequency equals the natural frequency of the body bouncing system responsible for the rebound. At high speeds of running, the duration and the amplitude of the upper part of the oscillation are greater than those of the lower part due to the relative increase in the aerial phase (asymmetric rebound). In this case, the freely chosen step frequency is lower than the natural frequency of the bouncing system.
The natural frequency of the body bouncing system depends on the body mass and the stiffness of the elastic structures responsible for the rebound. Between the age of initiation of running and adulthood, body mass increases more than five times, but the effect of growth on stiffness is unknown. In this study, we investigated the factors affecting the freely chosen step frequency, and measured the mechanical work done to move the centre of mass of the body during running at various speeds in children of different ages. It was found that the changes in stiffness and body mass taking place during growth determine the step frequency, and that this in turn affects the mechanical work necessary to move the centre of mass.
METHODS
Subjects and experimental procedure
Experiments were carried out on fifty-one healthy children aged 2-16 years and six healthy adults aged 23-31 years. The characteristics of the subjects were averaged into nine age groups defined as follows: ‘2 years’, those subjects aged 2 to < 3 years; ‘3-4 years’, those subjects aged 3 to < 5 years, and so on (Table 1). Written informed consent of the subjects and/or their parents was obtained. Experiments involved no discomfort, were performed according to the Declaration of Helsinki and approved by the local ethics committee. All subjects wore gym shoes. They were asked to run across a force platform at different speeds ranging from the minimum to the maximum they were able to attain. The mean velocity (V¯f) was measured by two photocells placed at neck level and set 0.7-5.5 m apart according to the speed. In each age group, data were gathered in velocity classes of 1 km h−1. In most cases, two trials per subject were recorded in each class of V¯f. A total of 1979 runs was analysed.
Table 1.
Mean ( ± S.D.) characteristics of the subjects
| Age group (years) | No. subjects Total (f) | Age (years) | Weight (kg) | Height (m) | Leg length (m) | No. trials |
|---|---|---|---|---|---|---|
| 2 | 7 (5) | 2.54 ± 0.29 | 14.10 ± 1.92 | 0.92 ± 0.04 | 0.44 ± 0.03 | 80 |
| 3-4 | 8 (3) | 4.42 ± 0.42 | 17.95 ± 1.61 | 1.07 ± 0.04 | 0.53 ± 0.02 | 187 |
| 5-6 | 6 (3) | 6.13 ± 0.39 | 20.67 ± 1.56 | 1.16 ± 0.04 | 0.60 ± 0.03 | 182 |
| 7-8 | 6 (3) | 8.13 ± 0.65 | 26.13 ± 2.58 | 1.31 ± 0.05 | 0.68 ± 0.03 | 221 |
| 9-10 | 6 (2) | 9.99 ± 0.53 | 30.26 ± 2.37 | 1.40 ± 0.04 | 0.75 ± 0.04 | 213 |
| 11-12 | 6 (5) | 11.47 ± 0.25 | 35.80 ± 2.87 | 1.49 ± 0.03 | 0.81 ± 0.02 | 239 |
| 13-14 | 6 (3) | 13.49 ± 0.33 | 48.29 ± 8.52 | 1.62 ± 0.04 | 0.88 ± 0.04 | 256 |
| 15-16 | 6 (3) | 16.06 ± 0.47 | 57.78 ± 10.10 | 1.73 ± 0.09 | 0.93 ± 0.04 | 295 |
| Adult | 6 (3) | 27.65 ± 2.79 | 63.73 ± 7.80 | 1.74 ± 0.08 | 0.92 ± 0.05 | 306 |
Force platform measurements
The mechanical energy changes of the centre of mass of the body due to its motion in the sagittal plane during a running step (Fig. 1) were determined from the vertical and forward components of the force exerted by the foot against the ground (Cavagna, 1975). The work necessary to sustain the lateral movement of the centre of mass of the body was neglected (Cavagna, Saibene & Margaria, 1963).
Figure 1. Within-step fluctuations in mechanical energy of the centre of mass of the body.
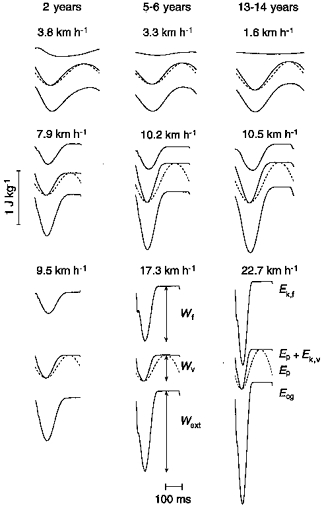
In each set of tracings, the increments in the curves represent, from top to bottom, the mass-specific positive work done at each step: Wf to increase the kinetic energy of forward motion (Ek,f); Wv to increase the sum of the gravitational potential energy (Ep, dashed line) plus the kinetic energy of vertical motion (Ek,v); and Wext≈Wf+Wv to increase the total mechanical energy of the centre of mass (Ecg). Horizontal portions of the curves correspond to the aerial phase, and decrements to negative work. Sets are organized in columns according to the age (Left: 2.8-year-old female, 13.7 kg body weight, 0.95 m tall. Middle: 6.8-year-old male, 20.8 kg, 1.23 m. Right: 13.8-year-old male, 57.0 kg, 1.68 m.) and in rows according to the running speed. Running speed is near to the minimum (top row), mean (middle row) and maximum (bottom row) for that age. Note the marked reduction in Wf, but not in Wv, at the lowest running speeds.
The ground reaction force was measured by means of a force platform (6 m long and 0.4 m wide) mounted at floor level 25 m from the beginning of a path 40 m long. A soft vertical structure fixed against the wall helped the subject to decelerate at the end of the highest speed runs. The force platform was made of ten separate plates, similar to those described by Heglund (1981). The plates had a natural frequency of 180 Hz and a linear response to within 1 % of the measured value for forces up to 3000 N. The difference in the electrical signal to a given force applied at different points on the surface of the ten plates was less than 1 %. The cross-talk between the vertical and forward axis was less than 1 % of the applied force. The individual signals of the ten plates were summed, digitized by a 12 bit analog-to-digital converter every 2 ms (except for 18 initial runs which were digitized every 4 ms) and processed by means of a microcomputer. The principle of the method and the procedures followed to compute the velocity in the forward and vertical directions, the vertical displacement, the changes in gravitational potential energy, and the changes in kinetic energy of the centre of mass of the body have been described in detail by Cavagna (1975) and by Cavagna et al. (1983) and are only briefly described here.
Provided that air resistance and skidding are negligible, the acceleration of the centre of mass of the body in the forward (af) and vertical (āv) directions can be calculated by:
| (1) |
and
| (2) |
where Ff and Fv are the forward and vertical components of the ground reaction force measured by the force platform, Pbis the body weight and m is the body mass. The accelerations af and āv were integrated numerically by the trapezoidal method with time intervals of 2 ms to determine the forward (Vf) and vertical (Vv) components of the velocity of the centre of mass of the body plus an integration constant. In the forward direction, the integration constant was calculated on the assumption that the mean velocity of the centre of mass of the body, computed from the force platform, was equal to the mean velocity of the neck, as measured by the photocells. In the vertical direction, since the subject was running on the level, the integration constant was set to zero on the assumption that the mean vertical velocity was nil over an integral number of steps. The vertical displacement (Sv) of the centre of mass of the body was computed by numerical integration of Vv.
The kinetic energy of the centre of mass of the body due to its motion in the forward direction was calculated as Ek,f = mVf2/2. The energy of the centre of mass due to its vertical movement was calculated as Ep+Ek,v = m gSv+mVv2/2, where g is acceleration due to gravity, and the total mechanical energy of the centre of mass was calculated as Ecg = Ep+Ek,v+Ek,f. The increments of Ek,f, Ep+Ek,v and Ecg represent, respectively, the positive work done to accelerate forward the centre of mass of the body (Wf), the positive work done against gravity (Wv) and the positive work done to maintain the motion of the centre of mass of the body in a sagittal plane (Wext) (Fig. 1).
Only steps in which the subject was running at a constant mean height and speed were selected for analysis, using the following criteria: the steps (1-5) had to be contiguous, and the sum of the increments in both horizontal (forward) and vertical velocity could not differ by more than 25 % from the sum of the absolute values of the decrements (Cavagna, Heglund & Taylor, 1977). According to these criteria, the difference in the forward velocity of the centre of mass of the body from the beginning to the end of the selected steps was usually less than 6 % of V¯f, and the mean vertical force during the same period was within 6 % of the body weight.
Particularly in young children attempting to run at very low speeds, the gait sometimes adopted characteristics more typical of a walk than a run; i.e. there was some transfer between the potential and kinetic energy of the centre of mass. This anomalous gait was detected by measuring the amount of transfer between potential and kinetic energy (R):
| (3) |
(Cavagna, Thys & Zamboni, 1976). In adults R is typically less than 5 % in running and between 30 and 65 % during walking, therefore only runs with R less than 11 % were accepted for analysis (Cavagna, Willems, Franzetti & Detrembleur, 1991).
Analysis of the bounce of the body
If the vertical motion of the centre of mass of the body during running is to be compared with the oscillation of a spring-mass system, then the step period (T) can be divided into two parts (Fig. 2): the effective contact time (tce) and the effective aerial time (tae). The interval tce coincides with the duration of the lower part of the vertical oscillation of the centre of mass, when the vertical force exerted on the ground is greater than body weight. The interval tae coincides with the duration of the upper part of the vertical oscillation of the centre of mass, when the vertical force is less than body weight (Cavagna et al. 1988).
Figure 2. Within-step analysis of the body vertical bounce.
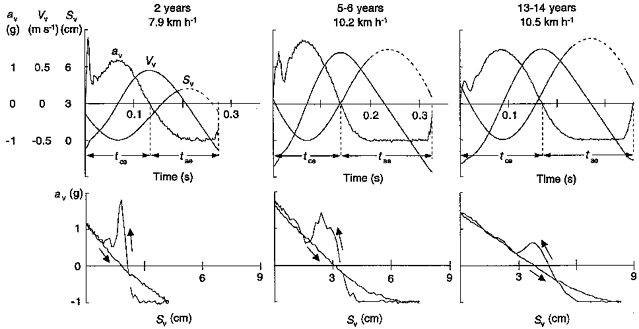
Top panels, vertical acceleration (āv), velocity (Vv) and displacement (Sv) of the centre of mass of the body during a running step at the indicated speeds and ages for the same steps as shown in the middle panels of Fig. 1. Note the different scales for each parameter shown to the left of the ordinate. The dashed portion of the Sv tracing indicates the aerial phase. āv is zero when the vertical force equals the body weight and -1 g when the vertical force is nil. tce and tae indicate the periods of the step during which the vertical force is greater or less, respectively, than the body weight. Bottom panels, āv is plotted as a function of Sv for the same steps illustrated in the top panels. Positive values of āv refer to tce, negative values to tae. The downwards pointed arrows indicate the upward movement before take-off, horizontal portions indicate the aerial phase, and the upwards pointed arrows indicate the downward movement. The mass-specific vertical stiffness (k/m) (where k is vertical stiffness and m body mass) was calculated from the slope of the āv-Sv plot through the points corresponding to the upward displacement during tce. Note the decrease in stiffness with age. This is also evident during the weight acceptance phase of the step (from ground contact to the first peak of the āv-Sv tracing during tce).
The vertical displacements of the centre of mass during tce and tae(Sce and Sae, respectively) were measured as the mean of the upward and downward displacements (in fact, the upward and downward displacements during each of these time intervals were not necessarily equal, see upper right panel in Fig. 2). The step length was defined as L = V¯fT. The fractions of L taking place during tce and tae were calculated as Lce = tceV¯f, and Lae = taeV¯f (Fig. 3), respectively, neglecting the forward velocity changes taking place during the step. Lce and Lae, as calculated, were 1.65 ± 1.91 % larger (mean ± s.d., n = 1979) and 1.80 ± 2.12 % smaller (mean ± s.d., n = 1979), respectively, than their real values because the actual forward velocity was lower than V¯f during tce and higher than V¯f during tae.
Figure 3. Characteristics of the running step at the different ages and speeds.
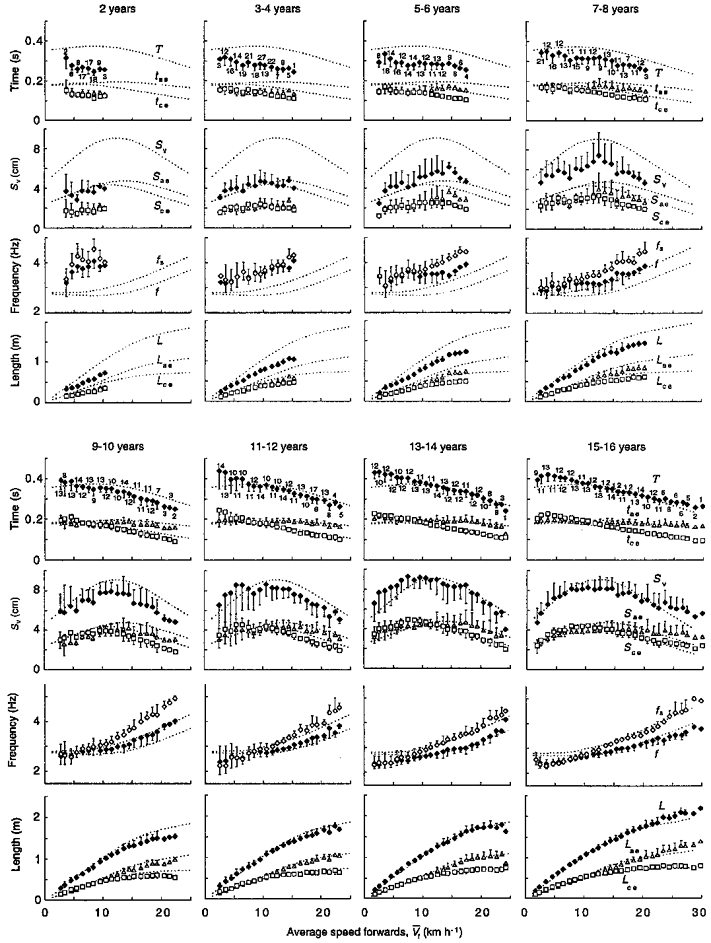
In each age group (see Table 1), ♦ indicate, from top to bottom, the step period (T), Sv, the freely chosen step frequency (f = 1/T) and the step length (L = TVf) as a function of the mean running speed (V¯f). ▵ indicate tae and the displacement of the centre of mass during this phase in the vertical direction (Sae) and in the forward direction (Lae). Similarly, □ indicate tce and the corresponding displacements during this phase in the vertical direction (Sce) and in the forward direction (Lce). ⋄ indicate the natural frequency of the elastic system (fs), calculated using eqn (4) from the stiffness measured as described in the Methods. The points represent the mean values ( ± s.d., n is given by the number near the symbols) of data grouped, when applicable, into the following intervals along the abscissa: 1 to < 2, 2 to < 3,…., 29 to < 30 km h−1. Note that the range of speeds is smaller in children than in adults. Error bars, indicating s.d., are drawn when they exceed the size of the symbol. Note that the point at the maximal speed attained in the 3-4, 13-14, and 15-16 years classes is a single datum; in the 13-14 years class this point exhibits an exceptionally low vertical displacement and acceleration (see Fig. 5). The dotted lines indicate the adults trend determined by averaging data of the present study (bottom row in Table 1) with those of Cavagna et al. (1988). Note that in spite of the fact that f is higher and L is lower in children than in adults, fs diverges from f at about the same speed (≈11 km h−1), independent of age.
In the study of Cavagna et al. (1988), the natural frequency of the body bouncing system was calculated from āv and Sv (upper panel in Fig. 2) as follows. The slope of the āv-Sv plot (Fig. 2, lower panel) during tce (i.e. when āv is positive) was calculated by fitting a straight line through all of the points using the least-squares fit method. This slope was considered to represent the mass-specific vertical stiffness of the body's bouncing system (k/m, where k was the vertical stiffness and m the body mass).
The āv-Sv plot was quite straight during the upward displacement of the centre of mass (downward arrows in the lower panels of Fig. 2), whereas during the downward displacement of the centre of mass (upward arrows in Fig. 2) a more or less pronounced peak was observed after the impact of the heel against the ground (Alexander, Bennett & Ker, 1986). In some of the youngest children, this foot-impact peak was large enough to make unreasonable a linear interpolation of all of the points of the āv-Sv plot during tce. For this reason, in this study, k/m during tce was calculated from the slope of a straight line fitted through the points corresponding to the upward displacement only. The ratio of the k/m computed during the upward displacement to the k/m computed during all of tce (as in Cavagna et al. 1988) was 1.05 ± 0.06 (mean ± s.d., n = 1979). The natural frequency of the body bouncing system (fs) was calculated as:
| (4) |
RESULTS
Symmetric and asymmetric rebound
T, Sv, the step frequency (f = 1/T) and L are given as a function of speed by the filled diamonds in Fig. 3 (top to bottom). The vertical oscillation of the centre of mass was divided into two parts: one taking place when the vertical force was greater than body weight (parameters with subscript ce, e.g. tce, Sce and Lce; Fig. 3, open squares), and the other taking place when the vertical force was smaller than body weight (parameters with subscript ae; Fig. 3, open triangles). Each panel refers to one age group. The dotted lines give, for comparison, the trend obtained for adults by averaging the adult data of the present study with those of Cavagna et al. (1988).
Below ∼11 km h−1, independent of age, the vertical oscillation of the centre of mass was symmetric, i.e. tce≪ tae, Sce≪ Sae and f ≪ fs (open diamonds). Also in children, as in adults, L increased almost linearly with speed during the symmetric rebound when Lce≪ Lae. This was due to the fact that over this range of speeds the step frequency did not change much with running velocity.
Mean values of f and fs were calculated for each age group, for running speeds below 11 km h−1, and are presented in the lower panel of Fig. 4. Both f and fs decreased with age from ∼4 Hz in 2-year-old children down to ∼2.5 Hz in 12-year-old children and increased slightly above 12 years of age.
Figure 4. Determinants of the step frequency during growth.
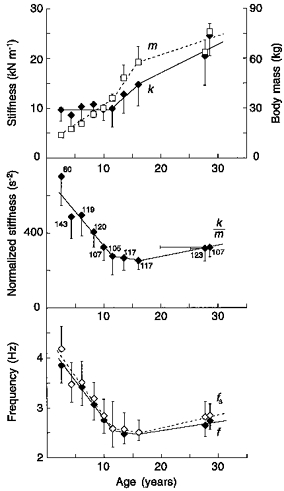
The bottom panel shows that f (♦) changes with age in a similar way to fs (⋄). fs is determined by k/m(middle panel). The top panel illustrates the changes with age of k(♦, left ordinate) and m(□, right ordinate). The large decrease in k/m ( and, as a consequence, in fs and f) taking place from 2 to 12 years of age is due to an increase in m with an approximately constant value of k. After 12 years k and m increase similarly and the step frequency change is less. The symbols indicate the mean of all runs at a speed lower than 11 km h−1 for each age group shown in Table 1 plus a group studied by Cavagna et al. (1988) (mean age, 28.6 years). Other indications as in Fig. 3. Note that, in children younger than 3 years, fs is greater than f. A deviation from the general trend also occurred in walking for the 2-year-old group (see Fig. 8 of Cavagna et al. 1983).
Above ∼11 km h−1, Lae continued to increase whereas Lce approached a constant maximum value, with the consequence that tce became smaller than tae (asymmetric rebound) (Fig. 3). This asymmetry, characterized by tce < tae and Sce < Sae, arose from the fact that the mean vertical acceleration during tce (āv,ce) increased above 1 g whereas that during tae (āv,ae) could not exceed 1 g (Fig. 5). A longer tae was thus required to loose and regain the vertical momentum obtained during tce. The decrease in the deformation of the bouncing system (Sce, Fig. 3), along with the increase in āv,ce (Fig. 5), resulted in an increase in the stiffness. As a consequence of this increase in stiffness, fs became greater than f during the asymmetric rebound. However, even in this case, the half-period of the bouncing system, computed as ε(m/k), corresponded to tce; the mean ± s.d. of *epsi;(m/k)/tce was 1.02 ± 0.05 (n = 948).
Figure 5. Mean vertical acceleration of the centre of mass during the lower and the upper part of the body bounce.
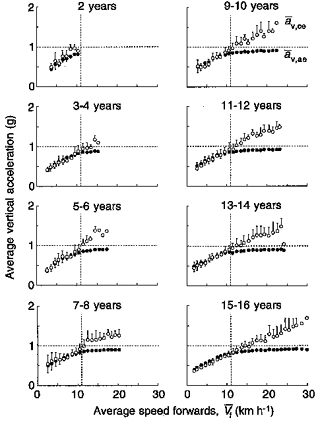
Mean vertical acceleration during tce (āv,ce, ○) and during tae (āv,ae, •) have been measured by dividing the area under the āv curves in Fig. 2 by the corresponding times and plotted as a function of the running speed for each age group. At all ages, āv,ce is about equal to āv,ae when the rebound is symmetric (i.e. tce = tae), up to about 11 km h−1 (vertical dotted line). Above 11 km h−1, the acceleration due to the push against the ground during tce continues to increase whereas the acceleration due to the pull by gravity during tae cannot exceed 1 g and the rebound becomes asymmetric (tce < tae). Other indications as in Fig. 3.
In order to assess the running speed at which the bounce became asymmetric, a two-way repeated measures ANOVA with contrasts (SuperANOVA version 1.11) was applied to the following pairs of variables for each age group: tce-tae, Sce-Sae, f-fs, Lce-Lae and āv,ce-av,ae. The effect of speed was analysed, and the speed at which the two variables became significantly different was determined (Table 2). The speed at which the bounce of the body became asymmetric was close to 11 km h−1 for all pairs of variables except the Sce-Sae pair. This discrepancy is due in part to the fact that the mean value is calculated from both the upward and the downward vertical displacements (see Methods). If the upward vertical displacement only is taken into account, the Sce-Sae values appear to diverge at a lower speed, near 11 km h−1, but the scatter of the data is so large that the difference becomes statistically significant at a speed near 14 km h−1.
Table 2.
Speed at which the pairs of variables listed become significantly different in each group
| Age group (years) | tce-tae (km h−1) | Sce-Sae (km h−1) | f-fs (km h−1) | Lce-Lae (km h−1) | āv,ce-av,ae (km h−1) |
|---|---|---|---|---|---|
| 2 | n.s. | n.s. | n.s. | n.s. | n.s. |
| 3-4 | 11 | n.s. | n.s. | 11 | 11 |
| F | 9.134 | – | – | 20.478 | 8.079 |
| P | 0.0027 | – | – | 0.0001 | 0.0047 |
| 5-6 | 11 | 14 | 11 | 11 | 11 |
| F | 11.084 | 12.079 | 4.660 | 20.185 | 11.360 |
| P | 0.0010 | 0.0006 | 0.0316 | 0.0001 | 0.0008 |
| 7-8 | 11 | 16 | 11 | 11 | 11 |
| F | 13.302 | 6.539 | 7.291 | 14.013 | 6.775 |
| P | 0.0003 | 0.0109 | 0.0072 | 0.0002 | 0.0096 |
| 9-10 | 11 | 17 | 10 | 11 | 11 |
| F | 7.404 | 6.582 | 4.318 | 8.216 | 5.666 |
| P | 0.0068 | 0.0107 | 0.0384 | 0.0044 | 0.0178 |
| 11-12 | 12 | 16 | 13 | 12 | 12 |
| F | 6.054 | 10.305 | 6.318 | 15.304 | 10.938 |
| P | 0.0143 | 0.0014 | 0.0123 | 0.0001 | 0.0010 |
| 13-14 | 11 | 16 | 9 | 11 | 11 |
| F | 8.423 | 5.720 | 5.635 | 6.865 | 5.071 |
| P | 0.0039 | 0.0172 | 0.0180 | 0.0091 | 0.0248 |
| 15-16 | 13 | 18 | 11 | 13 | 13 |
| F | 11.532 | 4.342 | 4.239 | 9.894 | 5.779 |
| P | 0.0007 | 0.0377 | 0.0400 | 0.0018 | 0.0166 |
| Adult | 9 | 12 | 11 | 9 | 9 |
| F | 21.540 | 5.517 | 4.172 | 11.968 | 8.833 |
| P | 0.0001 | 0.0190 | 0.0414 | 0.0006 | 0.0031 |
n.s. indicates this speed does not exist. F and P statistics are given below each value as indicated.
External mechanical work
The mechanical energy changes of the centre of mass taking place within the step during running at different speeds are illustrated in Fig. 1 for three age groups. In each set of tracings, the curves indicate, from top to bottom: Ek,f, Ep+Ek,v, Ep alone (dotted line) and Ecg. Horizontal segments in the curves indicate aerial phases; aerial phases tend to disappear at the lowest running speeds. In children, as in the adults, the Ek,f and Ep+Ek,v curves are in phase during the running steps, which suggests a bouncing mechanism along with its associated storage and release of mechanical energy by the contracting muscles and the tendons (Cavagna et al. 1976).
The increments in the mechanical energy curves in Fig. 1 represent Wf, Wv, and Wext (in running Wext≪Wv+Wf due to the small value of R). The mass-specific mean mechanical power (Ẇext = Wext/(mT)) and work done per unit distance (Wext/(mL)) are plotted in Fig. 6 as a function of the running speed. In children up to 7-8 years old, Wext was smaller than in adults due to a smaller Wv, in spite of an equal or slightly greater Wf. Due to the reduction in Wv, the mean mechanical power Ẇext was almost proportional to speed in the children younger than 7 years, and the external work done per unit distance did not change appreciably with speed. On the contrary, in older children and adults, Ẇext increased linearly from a positive intercept on the ordinate (due to Ẇv) with the consequence that the external work done per unit distance became very large at the lowest speeds.
Figure 6. Work due to the mechanical energy changes of the centre of mass of the body.
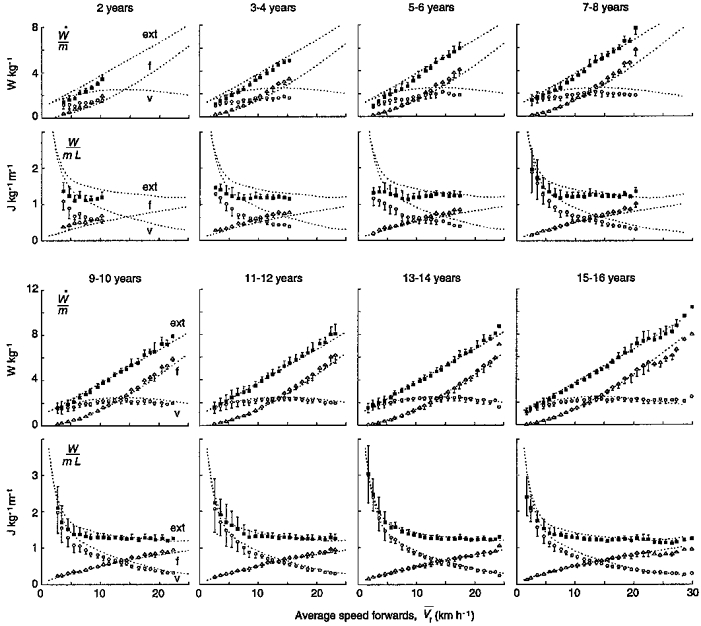
In each age group, the mass-specific power (top panel) and the mass-specific work done per unit distance (lower panel) to maintain the movement of the centre of mass in a sagittal plane (▪, ext), to accelerate it forwards (▵, f) and to lift it against gravity at each step (○, v) are given as a function of V¯f. Note that the higher step frequency in children results in a smaller power done against gravity (see Fig. 9), and thus in a reduction in Wext. Other indications as in Fig. 3.
Most of the changes in the gait mechanics of running took place below the age of 13 years (Figs 3 and 6).
DISCUSSION
Three characteristics of running which we find unaltered in children and adults are: (i) the in-phase changes in the potential and kinetic energy of the centre of mass (Fig. 1), (ii) the mass-specific power to sustain the forward speed changes (Fig. 6) and (iii) the transition from a symmetric rebound to an asymmetric rebound at about 11 km h−1 (Figs 3 and 5). The two main differences between the mechanics of running in children and that in adults are, at a given speed: (i) the step frequency, which is higher in children (Fig. 3), and (ii) the mass-specific power spent against gravity, which is smaller in children (Fig. 6).
In the next paragraphs we will discuss how a simple spring- mass model can explain these differences and similarities between children and adults. We will first show which factors determine the step frequency during growth, and then discuss why the higher step frequency in preteens results in a lower mechanical power. We will end by explaining why the transition from a symmetric to an asymmetric rebound occurs at about 11 km h−1, independent of age.
Determinants of the step frequency at running speeds below 11 km h−1
Below 11 km h−1, both f and fs ( = (ε(k/m))/2π) decrease with increasing age up to 12 years (Fig. 4). During growth, fs changes as a result of a change in k/m (Fig. 4, middle panel); the two terms k and m are plotted separately in the top panel of Fig. 4.
Three phases can be distinguished during growth which correspond to three phases in the increase in m (Fig. 4, top panel). During the first phase, from 2 to 12 years, there is an almost linear increase in m with no appreciable change in k. This leads to a large reduction in k/m, and, as a consequence, fs and f reduce to values similar to those of adults (Fig. 4, bottom panel). During the second phase, from 13 to 16 years, the increase in m with age becomes steeper (Hauspie, Wachholder & Vercauteren, 1993), but a parallel increase in k results in k/m, fs and f remaining about constant. The increase in k above 12 years can be related to the acceleration in the increase in isometric muscle force which seems to occur at that age (Backman, Odenrick, Henriksson & Ledin, 1989; Kanehisa, Ikegawa, Tsunoda & Fukunaga, 1995). During the third phase, above 16 years, the increase in m is less than the increase in k and consequently k/m, fs and f increase slightly.
Determinants of the step frequency at running speeds above 11 km h−1
Above 11 km h−1, Lce tends to a constant value (Fig. 3, bottom panels), probably as a result of an anatomical limit to the step length, and as a consequence tce decreases with increasing speed. In order to maintain symmetry (and therefore f equal to fs, third panels down in Fig. 3), tae should decrease with speed as well. However, a decrease in tae would result in a further increase in the step frequency and in the internal power required to move the limbs relative to the centre of mass. Possibly for this reason tae remains about constant in both children and adults, thus limiting the increase in step frequency and internal power at the expense of symmetry (Cavagna et al. 1991).
The maximum running speed (V¯f,max) increases with age from 9 km h−1 at 2 years to 26 km h−1 in adults (Fig. 7, top panel). The step frequency at V¯f,max is about 4 Hz independent of age, and therefore V¯f,max increases almost in proportion to step length (Fig. 7, bottom panel). It is peculiar that during growth the step frequency at V¯f,max attains the same value (4 Hz) independent of body size.
Figure 7. Determinants of the maximal running speed during growth.
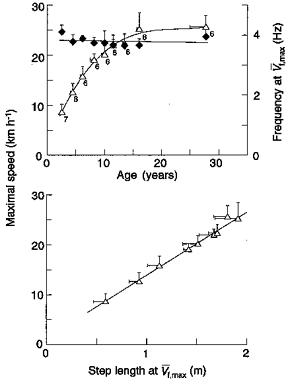
The top panel shows that the maximal running speed (V¯f,max, ▵) increases up to about 16 years of age and then it remains nearly constant. The step frequency f at V¯f,max changes little with age (♦), indicating that the increase in V¯f,max is due to an almost proportional increase in the maximal step length (bottom panel). Points represent mean values obtained by averaging the data of the subjects of each age group (see Table 1). Other indications as in Fig. 3.
Effect of leg length on the natural frequency of the bouncing system
At all running speeds, tce is equal to one-half of the period of the bouncing system and is shorter the younger the subject. Ignoring forward speed changes within the step, the distance travelled by the centre of mass during tce can be computed by:
| (5) |
Lce can approximately be expressed as a function of the leg length (l) by:
| (6) |
where θ is the angle between the vertical and the leg at the beginning of tce (see inset in the upper left panel of Fig. 8). This procedure does not take into account the distance between the centre of mass and the hip joint (see last section of Discussion).
Figure 8. Effect of leg length on the effective step length.
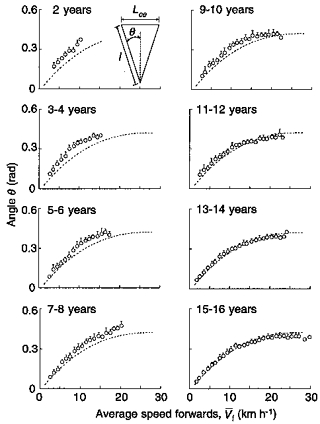
The angle of contact with the ground (θ) was computed from Lce and the leg length (l) (see inset, top left), and plotted as a function of running speed for each age group. It can be seen that the effective step length is largely determined by the length of the leg. Dotted lines indicate the adult trend (Table 1, bottom row). Other indications as in Fig. 3.
The natural frequency of the bouncing system can then be expressed as:
| (7) |
Equation (7) shows that the natural frequency of the bouncing system, which equals the freely chosen step frequency at speeds lower than 11 km h−1, is a unique function of the leg length and limb angle at a given speed.
How are the limb angle and the leg length related to age?Figure 8 shows that the angle θ is slightly larger in children than in adults and decreases with age, attaining the adult value after the age of 12 years when the leg length attains more than 95 % of the adult leg length (Table 1). Therefore, the higher step frequency in children is due to a shorter leg length probably partly compensated by an increased amplitude of movements.
Effect of step frequency on mechanical power
At a given speed, the mass-specific power spent against gravity (Ẇv/m) is lower in preteens than in adults (Fig. 6). This is due to the fact that children run with a higher step frequency (Fig. 3) and that Ẇv/m decreases with increasing step frequency, as shown in Fig. 9. The mechanism of this relationship has been explained previously (Cavagna, Mantovani, Willems & Musch, 1997) and is summarized below.
Figure 9. Reciprocal relation between power spent against gravity and step frequency at a given running speed.
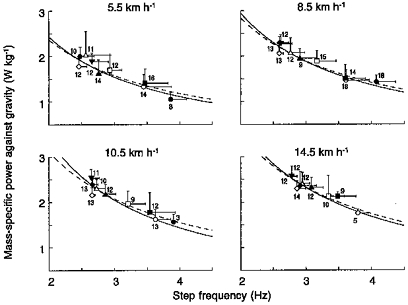
Mass-specific mean power spent sustaining the vertical lift of the centre of mass of the body at each step is plotted as a function of the step frequency during free running at four different speeds (as indicated). Each symbol represents the mean for each of the nine age groups given in Table 1 (•, 2 years; ○, 3-4 years; ▪, 5-6 years; □, 7-8 years; ▴, 9-10 years; ▵, 11-12 years; ♦, 13-14 years; ⋄, 15-16 years; ▾, adults). The continuous line represents the best fit of all the data using a power function. The dashed line shows the theoretical trend (see eqn (8)) obtained by fitting the Wv/m data to a reciprocal function of f. The power spent against gravity and step frequency are inversely proportional: this explains the lower mechanical power spent by children relative to the adults in maintaining the motion of the centre of mass of the body (Fig. 6). Other indications as in Fig. 3.
Assuming that the vertical displacement of the centre of mass at each step is due to the rebound on a linear spring, then
| (8) |
where g is the acceleration due to gravity and āv,max is the maximal vertical acceleration which occurs during tce when the centre of mass reaches its lowest point (Fig. 2). The interrupted lines in Fig. 9 were calculated by fitting the Ẇv/m data to a reciprocal function of f. From the A values so obtained, āv,max can be calculated to be 9.5, 11.3, 12.4 and 13.7 m s−2, respectively, at 5.5, 8.5, 10.5 and 14.5 km h−1, compared with 9.7 ± 1.9 (mean ± s.d., n = 109), 11.9 ± 1.9 (n = 124), 13.6 ± 2.1 (n = 96) and 16.6 ± 2.3 m s−2 (n = 86) at those respective speeds, measured directly from the individual acceleration records (Fig. 2). The discrepancy between calculated and measured values of āv,max has been discussed previously (Cavagna et al. 1997). Note that āv,max during tce is about equal to 1 g at 5.5 km h−1 and increases above 1 g with increasing speed.
Assuming a sinusoidal oscillatory motion of the spring- mass system, the mean vertical acceleration during the lower half of the oscillation, i.e. during tce, would be āv,ce = 2āv,max/π. From the calculated āv,max values above, āv,ce would then be 6.1, 7.2, 7.9 and 8.7 m s−2, respectively at 5.5, 8.5, 10.5 and 14.5 km h−1, compared with 6.0 ± 1.2 (mean ± s.d., n = 109), 7.7 ± 1.3 (n = 124), 8.8 ± 1.3 (n = 96) and 11.3 ± 1.7 m s−2 (n = 86), measured by dividing the area under the āv curve in Fig. 2 by tce. Note that āv,ce is lower than 1 g at low speeds and approaches 1 g at 10.5 km h−1 (Fig. 5), thus making the rebound asymmetric above 11 km h−1 (Cavagna et al. 1988).
The close fit of the Ẇv/m data to eqn (8) and the fair correspondence between calculated and measured values up to 10.5 km h−1 show that, at a given speed, the maximal and the mean vertical acceleration during tce are constant, independent of step frequency and body size. It is worth noting that the described relationship between Wv/m and f, at a given running speed, applies equally well whether the step frequency is consciously changed by a subject (as in the experiments of Cavagna et al. 1997) or whether the step frequency varies naturally among different subjects due to different body dimensions and structure.
Why is the vertical acceleration during tce constant, independent of step frequency and body size? The restoring force in the spring-mass system during the effective aerial phase tae is provided by gravity independent of step frequency and body size. Since the vertical momentum lost and gained during tae (the upper part of the oscillation) must be equal to the vertical momentum lost and gained during tce (the lower part of the oscillation), it follows that in order to keep the rebound symmetric (i.e. tce = tae) the restoring force provided by the muscular push during tce must produce a mean acceleration equal to that produced by gravity during tae.
In conclusion, the inverse relationship between Ẇv/m and f is due to a constant vertical acceleration, independent of size, produced by the upwards push during the lower half of the oscillation of a linear spring-mass system. This, in turn, is due to the muscles counteracting the action of gravity during the upper half of the oscillation (which is independent of body size) in such a way as to maintain a symmetric rebound, i.e. the step frequency equal to the resonant frequency of the body bouncing system (Cavagna et al. 1997).
Similarly, the mean horizontal acceleration (af) at a given speed is also independent of body size. This is inferred from the fact that Ẇf/m at a given speed is about equal in children and adults (Fig. 6). In fact, the positive work done at each step to sustain the forward speed changes (Wf) is, with good approximation:
| (9) |
where ΔVf is the difference between the highest and the lowest speed within the step, and V¯f is the mean speed forward (Cavagna et al. 1976). The mass-specific power Ẇf/m is then:
| (10) |
Since Ẇf/m at a given speed V¯f is the same independent of age, then ΔVff must also be independent of age. Assuming the forward speed change in a symmetric rebound takes place during half of the step period, the mean forward acceleration (af = 2ΔVff) would be independent of age and body size just like the mean vertical acceleration.
The acceleration of the centre of mass at each running step is due to the interaction of the moving body with the ground (air resistance is negligible at the speeds considered). The finding that the acceleration is independent of size indicates that the interaction with the ground is also independent of size. Since this interaction depends on the orientation and the compliance of the link between the centre of mass and the point of contact on the ground, it seems likely that the combination of these two factors is roughly independent of age and size.
It is worth stressing that whereas the same forward acceleration leads to the same mass-specific power necessary to sustain the forward speed changes, independent of step frequency, the same vertical acceleration leads to an inverse relationship between power spent against gravity and step frequency in agreement with a linear spring-mass model (Cavagna et al. 1997).
Since the mass-specific power due to the forward speed changes is similar in children and adults whereas the mass-specific power spent against gravity is smaller in children, the total external power required to move the body centre of mass is less in children than in adults (Fig. 6). In running adults, a trade-off exists between the external power (Wext) which decreases with increasing step frequency, and the internal power (Wint) which increases with increasing step frequency (Cavagna et al. 1991). In children, the total muscular power spent during running will probably also depend on the relative influence of the step frequency on the external and internal power.
Why does the transition from a symmetric to an asymmetric rebound occur at about 11 km h−1, independent of age?
At very low running speeds, most of the effective aerial phase takes place during contact and the elastic model applies both to the lower and the upper part of the vertical oscillation of the centre of mass. As the speed of running increases, a progressively smaller fraction of the vertical oscillation takes place during contact, and a progressively larger fraction takes place during the aerial phase. In spite of this, the rebound remains symmetric, i.e. tce = tae = constant, up to the critical speed of about 11 km h−1 when the effective step length attains a critical value (Lce,cr) near its maximum (Fig. 3).
The increase in running speed up to 11 km h−1 is accompanied by a progressively greater impact against the ground and consequently to a progressively larger deformation of a constant-period spring-mass system (Cavagna et al. 1988): i.e. T remains constant while the vertical displacement Sv increases (Fig. 3). This implies an increase in the restoring force above and below body weight. During tce, the lower part of the oscillation, the increase in the restoring force above body weight is due to a progressively greater deformation of the elastic system leading to a progressively greater upward push. During tae, the upper part of the oscillation, the increase of the restoring force, in the opposite direction, is brought about by a progressive decrease of the supporting action of muscles with a relative increase in aerial phase duration.
The symmetric running limit is reached at the speed of 11 km h−1, where almost all of the upper part of the oscillation is occupied by the aerial phase. During an aerial phase, the downward restoring force cannot result in an acceleration greater than that of gravity, so that the acceleration during tae cannot increase further (Fig. 5). On the contrary, as speed is increased above 11 km h−1, the upward push during tce continues to increase (Fig. 5), and a greater duration of tae is required to dissipate and restore the momentum gained during tce. As a consequence, the ratio tae/tce increases and running becomes asymmetric.
As described in the preceding section, the mean acceleration of the centre of mass during each step, at a given speed, is independent of age suggesting that the braking action due to the combined effect of the orientation and the compliance of the link between the centre of mass of the body and the point of contact of the foot on the ground is independent of body size.
The critical speed Lce,cr/tce = 2Lce,crf at which the vertical acceleration approaches 1 g, and above which the rebound becomes asymmetric, is about 11 km h−1 in children as in the adults due to the fact that a change in Lce,cr is exactly compensated by an opposite change in step frequency (left-hand ordinate in Fig. 10). This is consistent with the idea that the orientation of the link between centre of mass of the body and point of contact on the ground at the beginning and at the end of tce is invariant with age and body size. In this case, a change in the height of the centre of mass would result in a proportional change in Lce and, at a given speed, in an inversely proportional change in f. In fact the angle calculated as described in Fig. 8 does not differ much with age, particularly if one considers that it has been measured without taking into account the distance between centre of mass and hip joint, which is likely to be relatively greater the smaller the size of the body (Medawar, 1945).
Figure 10. Kinematic and dynamic similarity of the running step at the critical speed.
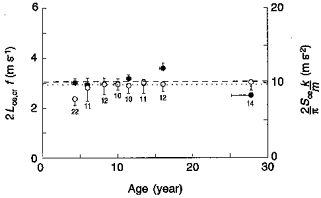
Left-hand ordinate shows that when the effective step length attains its critical value Lce,cr (Table 2), its duration tce = 1/(2f) (since the rebound is symmetric) is such that the critical speed 2Lce,crf(•) is near 11 km h−1 (3.06 m s−1, dashed line) independent of age (abscissa). This is due to the fact that, at the critical speed, the deformation (Sce) and k/m of the spring-mass system result in a mean vertical acceleration (right-hand ordinate, ○) about equal to 1 g (dotted line). Each point represents the mean for each age group in Table 1 (except the 2 years age group which did not attain 11 km h−1). Other indications as in Fig. 3.
The effect of the link compliance is illustrated in Fig. 10 (right-hand ordinate) where the mean vertical acceleration is calculated, assuming a sinusoidal oscillation, from the mass-specific vertical stiffness (k/m) and the deformation of the spring-mass system, Sce. It can be seen that (i) a change in stiffness is compensated by an opposite change in the deformation of the system, with the consequence that the mean vertical acceleration remains constant independent of age, and (ii) this mean vertical acceleration is about equal to 1 g at the critical speed of about 11 km h−1.
In conclusion, both kinetically (Fig. 10, left-hand ordinate) and dynamically (Fig. 10, right-hand ordinate) the body bouncing system during running behaves similarly at all ages and body sizes. The critical speed for the transition from a symmetric to an asymmetric rebound is the same because the effect of the interaction of the body with the ground at each step is the same independent of size. The finding that the critical speed happens to be 11 km h−1 is simply due to the fact that at this speed the mean vertical acceleration during the lower half of the oscillation (tce) attains about 1 g: the critical speed depends on gravity. It is likely that at higher gravity values the critical speed would be greater.
Acknowledgments
We wish to thank Professor N. C. Heglund for revising the manuscript and Professor A. Bouckaert for helpful advice regarding statistics. This study was supported by the Fonds National de la Recherche Scientifique of Belgium and by the Italian Ministero dell'Universita’ e della Ricerca Scientifica e Tecnologica.
References
- Alexander RMcN, Bennett MB, Ker RF. Mechanical properties and functions of the paw pads of some mammals. Journal of Zoology. 1986;209:405–419. [Google Scholar]
- Backman E, Odenrick P, Henriksson KG, Ledin T. Isometric muscle force and anthropometric values in normal children aged between 3.5 and 15 years. Scandinavian Journal of Rehabilitation Medicine. 1989;21:105–114. [PubMed] [Google Scholar]
- Cavagna GA. Force platforms as ergometers. Journal of Applied Physiology. 1975;39:174–179. doi: 10.1152/jappl.1975.39.1.174. [DOI] [PubMed] [Google Scholar]
- Cavagna GA, Franzetti P, Fuchimoto T. The mechanics of walking in children. The Journal of Physiology. 1983;343:323–339. doi: 10.1113/jphysiol.1983.sp014895. [DOI] [PMC free article] [PubMed] [Google Scholar]
- Cavagna GA, Franzetti P, Heglund NC, Willems P. The determinants of the step frequency in running, trotting and hopping in man and other vertebrates. The Journal of Physiology. 1988;399:81–92. doi: 10.1113/jphysiol.1988.sp017069. [DOI] [PMC free article] [PubMed] [Google Scholar]
- Cavagna GA, Heglund NC, Taylor CR. Mechanical work in terrestrial locomotion: two basic mechanisms for minimizing energy expenditure. American Journal of Physiology. 1977;233:R243–261. doi: 10.1152/ajpregu.1977.233.5.R243. [DOI] [PubMed] [Google Scholar]
- Cavagna GA, Mantovani M, Willems PA, Musch G. The resonant step frequency in human running. Pflügers Archiv. 1997;434:678–684. doi: 10.1007/s004240050451. [DOI] [PubMed] [Google Scholar]
- Cavagna GA, Saibene FP, Margaria R. External work in walking. Journal of Applied Physiology. 1963;18:1–9. doi: 10.1152/jappl.1963.18.1.1. [DOI] [PubMed] [Google Scholar]
- Cavagna GA, Thys H, Zamboni A. The sources of external work in level walking and running. The Journal of Physiology. 1976;262:639–657. doi: 10.1113/jphysiol.1976.sp011613. [DOI] [PMC free article] [PubMed] [Google Scholar]
- Cavagna GA, Willems PA, Franzetti P, Detrembleur C. The two power limits conditioning step frequency in human running. The Journal of Physiology. 1991;437:95–108. doi: 10.1113/jphysiol.1991.sp018586. [DOI] [PMC free article] [PubMed] [Google Scholar]
- Hauspie RC, Wachholder A, Vercauteren M. Reference values of the height and weight growth and growth rate of Belgian boys and girls 3-18 years of age. Archives Françaises de Pédiatrie. 1993;50:763–769. [PubMed] [Google Scholar]
- Heglund NC. A simple design for a force-platform to measure ground reaction forces. Journal of Experimental Biology. 1981;97:41–56. [Google Scholar]
- Kanehisa H, Ikegawa S, Tsunoda N, Fukunaga T. Strength and cross-section areas of reciprocal muscle groups in the upper arm and thigh during adolescence. International Journal of Sports Medicine. 1995;16:54–60. doi: 10.1055/s-2007-972964. [DOI] [PubMed] [Google Scholar]
- Medawar PB. Size shape and age. In: Le Gros Clark WE, Medawar PB, editors. Essays on Growth and Form presented to D'Arcy Thompson. Oxford: Clarendon Press; 1945. pp. 157–187. [Google Scholar]


