Abstract
Using conventional microelectrode techniques, membrane potentials were recorded from smooth muscle cells of guinea-pig choroidal arterioles.
Transmural stimulation initiated excitatory junction potentials (EJPs) which were abolished by either guanethidine or α,β-methylene-ATP but not by phentolamine, indicating that they resulted from activation of purinoceptors.
Trains of stimuli evoked EJPs which were followed by a slow depolarization, an inhibitory junction potential (IJP) or a biphasic membrane potential change which consisted of an IJP and a subsequent slow depolarization.
Slow depolarizations were abolished by either phentolamine or guanethidine, indicating that they resulted from activation of α-adrenoceptors.
IJPs were abolished by atropine but not by guanethidine, and were reduced by 50 % by apamin with the residual response being abolished by charybdotoxin, indicating that they resulted from the activation of muscarinic receptors which open two sets of Ca2+-activated K+ channels.
Most responses were followed by slow hyperpolarizations. These were almost abolished by L-nitroarginine, an effect which was partly overcome by L-arginine, and were abolished by glibenclamide, indicating that they resulted from the release of NO and activation of ATP-sensitive K+ channels.
Immunohistochemical analysis showed that arterioles were densely innervated by adrenergic nerve fibres. A population of fibres, likely to be cholinergic, was also identified. Furthermore, populations of nerve fibres immunoreactive to antibodies against either nitric oxide synthase (NOS) or substance P (SP) were also identified.
These findings indicate that choroidal arterioles of the guinea-pig are innervated by at least three different populations of nerves, adrenergic nerves which evoke excitatory responses, cholinergic nerves which evoke inhibitory responses and a population of nerves which cause the release of NO.
In many arteries and arterioles, sympathetic nerve stimulation evokes either a rapid excitatory junction potential (EJP), a slow depolarization or both. When detected, slow depolarizations last for several seconds and are abolished by α-adrenoceptor antagonists, indicating that they result from neurally released noradrenaline-activating α-adrenoceptors located on arterial and arteriolar muscle (Bolton & Large, 1986; Hirst & Edwards, 1989). In contrast, the rapid EJPs recorded from arterial and arteriolar muscle last for approximately 1 s and are not inhibited by α-adrenoceptor antagonists (Bolton & Large, 1986; Hirst & Edwards, 1989). These EJPs result from the activation of purinoceptors by ATP which is co-released with noradrenaline from sympathetic nerves (Suzuki, Mishima & Miyahara, 1984; Sneddon & Burnstock, 1984; Sneddon, McLaren & Kennedy, 1996).
Several reports describe the effects of vasodilator nerve stimulation on the membrane potential of vascular smooth muscle cells. The rabbit facial vein is innervated by adrenergic vasodilator nerves, stimulation of which releases noradrenaline which hyperpolarizes the smooth muscle cells by activating postjunctional β-adrenoceptors (Prehn & Bevan, 1983; Komori, Chen & Suzuki, 1989). Cholinergic inhibitory junction potentials (IJPs) reportedly occur in the lingual artery of the rabbit (Brayden & Large, 1986). Non-adrenergic, non-cholinergic slow hyperpolarizations, triggered by perivascular stimulation, have been described in the cerebral artery of the dog (Suzuki & Fujiwara, 1982) and in mesenteric arteries of the guinea-pig (Meehan, Hottenstein & Kreulen, 1991). In submucosal arterioles of the guinea-pig, transient hyperpolarizations were evoked when nearby submucosal ganglia were stimulated (Kotecha & Neild, 1995). These hyperpolarizations may result from the liberation of endothelium-derived hyperpolarizing factors (EDHFs) from endothelial cells (Hashitani & Suzuki, 1997). Although neurogenic vasodilatations have been described in a number of other vascular beds, e.g. nitrergic vasodilatation of cerebral arteries (Toda & Okamura, 1992), whether or not they are accompanied by membrane potential changes remains uncertain.
The choroid is important for the supply of nutrients to the retina in both lower mammals, e.g. guinea-pig and rabbit, where the nutrients consumed by retina are almost completely derived from the choroid, and in many higher mammals, including human, in which the retina is supplied by both the choroidal and retinal vessels (Albert, 1992). The choroidal circulation has an extremely high blood flow; a blood flow of approximately 2000 ml min−1 (100 g)−1 has been recorded from the choroid of monkey (Albert, 1992). This high rate of blood flow through the choroid, as well as supplying nutrients, also protects the eye from thermal damage even under extreme conditions (Albert, 1992). However, to date, the innervation pattern of the choroid and its responses to stimulation have not been examined at a cellular level.
In this study, intracellular recordings were made from arterioles of guinea-pig choroid. Transmural stimulation of the nerves innervating these vessels evoked (1) rapid EJPs which result from the activation of purinoceptors, (2) slow depolarizations which involve the activation of α-adrenoceptors, (3) IJPs which involve the activation of muscarinic receptors, and (4) non-adrenergic, non-cholinergic slow hyperpolarizations which appear to involve nitric oxide (NO).
METHODS
Male albino guinea-pigs weighing 200-250 g were killed by a blow to the head followed by exsanguination and the eyeballs were rapidly removed. After removal of cornea and lens, the eyeballs were slit open by making six incisions, with each incision starting at regular intervals around the border between the cornea and the sclera. The eye was then pinned out in a dissecting chamber with the retinal layer uppermost. The retina layer was removed and the choroidal sheet containing arterioles was separated from the underlying sclera layer. The choroidal sheet was pinned out in a small shallow recording chamber (volume approximately 1 ml) with the scleral side uppermost and superfused with warmed physiological saline (35°C) at a constant flow rate (4 ml min−1).
The ionic composition of the physiological saline was as follows (mM): NaCl, 121.8; KCl, 4.7; CaCl2, 2.5; MgCl2, 1.2; NaHCO3, 15.5; KH2PO4, 1.2; glucose, 11.5. The solution was aerated with O2 containing 5 % CO2, to maintain the pH of the solution at 7.2-7.3. Solutions containing high concentrations of potassium ions ([K+]o) were prepared by replacing NaCl with equimolar amounts of KCl. Drugs were introduced by switching the inflow line from the control solution to one which contained the appropriate concentration of drug; this procedure introduced a lag time of 1 min which reflected the time taken for solutions to flow through the heating coil. After switching to physiological saline containing a drug, preparations were usually allowed to equilibrate for 10 min in the test solution before any subsequent recordings were made. When the solutions contained guanethidine, L-nitroarginine, L-arginine, calcitonin gene-related peptide (Human, fragment 8-37), vasoactive intestinal peptide fragment 6-28, [D-Arg, D-Trp7,9, Leu11]-substance P or capsaicin, an equilibrium period of at least 20 min was allowed.
Perivascular nerves were stimulated selectively by passing brief square stimulating pulses (duration 50 μs, intensity 20-35 V) between a pair of electrodes (silver plate and wire) which were placed above and below the choroidal sheet. The neuronal selectivity of the stimulating pulses was confirmed by the evoked responses being abolished by tetrodotoxin (TTX, 1 μM); as such the evoked membrane potential changes were considered to represent junctional potentials produced as a result of perivascular nerves stimulation.
Individual arteriolar smooth muscle cells were impaled with sharp glass capillary microelectrodes, filled with 0.5 M KCl (tip resistance 150-300 MΩ). Membrane potential changes were recorded using a high input-impedance amplifier (Axoclamp 2B, Axon Instruments), and displayed on a cathode ray oscilloscope (SS-9622, Iwatsu, Tokyo, Japan). The criteria for the acceptable impalement of a muscle cell were: (1) an abrupt change in potential upon impalement, (2) a stable recording for at least 3 min prior to each experimental procedure, (3) a maintained impalement throughout the experimental manipulation. After low pass filtering (cut-off frequency 0.1 kHz) membrane potential changes, evoked by transmural nerve stimulation, were digitized and stored on a personal computer for later analysis. The following parameters were measured: maximum amplitude; time to peak, measured as time from stimulus artefact to peak potential change; latency, measured as the time taken from the stimulus to 10 % of the peak amplitude of the response; rise time, measured as the time between 10 and 90 % of peak amplitude; and half-width, measured as the time between 50 % peak amplitude on the rising and falling phases of the response. All recorded values are expressed as means ± standard deviation (s.d.). Statistical significance was determined using Student's t test; differences were considered to be significant if P < 0.05.
Preparations used to examine the neurochemical content and distribution of the nerve fibres innervating the choroidal arteries, were similar to those preparations used for electrophysiological experiments, and were prepared as described by Costa, Buffa, Furness & Solcia (1980). Preparations of the choroidal plexus (see above) were stretched flat and pinned to a sheet of Sylgard with fine pins cut from 50 μm tungsten wire. Sylgard-mounted preparations were then fixed by immersion in 4 % paraformaldehyde in 0.1 M phosphate buffer, for 2-4 h at room temperature. Preparations were then unpinned and washed in phosphate-buffered saline (PBS) (pH 7.2), containing 0.05 % Triton X-100 for 10 min. The ionic composition of PBS was (mM): NaCl, 145.4; Na2HPO4, 7.5; NaH2PO4, 2.5. Preparations were cleared in dimethyl sulphoxide (DMSO) (1 × 10 min) and then washed again in PBS (2 × 10 min). The tissue was then incubated in primary antibody for 24-48 h. After incubation, the tissue was once again washed in PBS (3 × 10 min) before incubation in an appropriate secondary antibody for 4-6 h. Preparations were then rinsed in distilled water (2 × 5 min), mounted on slides in carbonate-buffered glycerol, pH 8.2, and visualized under a Zeiss microscope (Akioskop 20), using the filter blocks, Blue 10 and Green 14, which are selective for fluorescein isothiocyanate (FITC) fluorescence and Texas Red or CY3 fluorescence, respectively. Preparations were photographed with a Zeiss MC80 camera fitted to the microscope, using Ektachrome x400 and T Max 400 film (Kodak). Primary antibodies used in these experiments were protein gene product 9.5 (PGP9.5; Ultraclone), the antibodies against vasoactive intestinal polypeptide (αVIP; Amersham), nitric oxide synthase (αNOS; Auspep) all raised in rabbit, used at a dilution of 1: 500, 1:400, 1: 500, respectively, and the antibodies against tyrosine hydroxylase (αTH; Boeh-Mann) and substance P (αSP; Seralab) both raised in rat and at a dilution of 1: 200. Secondary antibodies used were α-rabbit FITC (Amersham), Streptavidin Texas Red (Jackson) (used at 1: 200), α-rabbit biotin, α-rat biotin (both from Amersham and used at 1:100) and Streptavidin CY3 (from Jackson, used at 1:1000).
Drugs used in this study were apamin, atropine sulphate, barium chloride, 1,2-bis(2-aminophenoxy)-ethane-N,N,N',N'-tetraacetic acid tetrakis (acetoxymethyl) ester (BAPTA AM), glibenclamide, guanethidine sulphate, hyoscine hydrochloride, nifedipine, α,β-methylene-ATP, propranolol hydrochloride, vasoactive intestinal peptide fragment 6-28 (VIP antagonist) and tetrodotoxin (TTX) (all from Sigma), L-arginine, Nω-nitro-L-arginine (nitroarginine), calcitonin gene-related peptide (Human, 8-37) (CGRP antagonist), charybdotoxin and [D-Arg1, D-Trp7,9,Leu11]-substance P (spantide) (all from Peptide Institute, Osaka), phentolamine mesylate (from CIBA Geigy, Switzerland) and capsaicin (from Wako Chemicals, Osaka). Where appropriate concentrations in text refer to the salts.
RESULTS
General observations
Microscopically, the choroidal sheet contained both arterioles and veins: arterioles had the smaller outside diameters and thicker walls. Five to ten short posterior ciliary arteries entered the choroid around the optic nerve; each gave rise to three to five arteriolar branches which had outside diameters of about 50 μm. Each arteriolar branch divided into smaller branches, which sometimes anastomosed with neighbouring branches, to give an extensive arteriolar network. Two long posterior ciliary arteries also entered the choroid around the optic nerve. These arteries radiated from either side of the optic nerve and ran anteriorly towards the lens. Each artery gave rise to three to five branches with each branch giving off a further three to five arteriolar branches. Choroidal blood leaves the choroid via three to four vortex veins which drain from each quadrant of choroid. Their collecting branches were seen to radiate from all parts of the neighbouring choroid with the venous network often overlapping the arteriolar network. This arrangement is illustrated in Fig. 1. The location of arterioles and veins is shown at lower magnification in Fig. 1A and an area from which recordings were usually made is shown at higher magnification in Fig. 1B.
Figure 1. Micrographs of guinea-pig choroid.
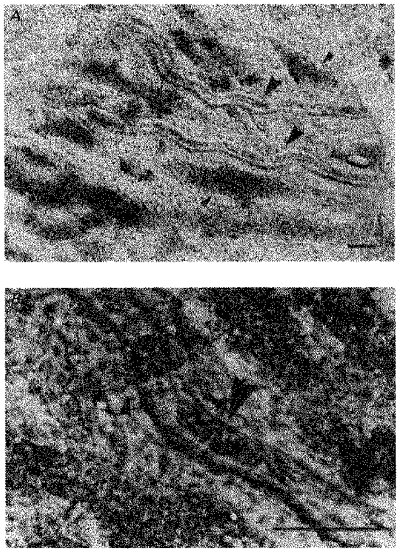
A shows the location of arterioles and veins in the choroid at low magnification. The larger arrowheads indicate arterioles (right side is proximal) and the smaller arrowheads indicate veins. Arterioles had smaller diameter and thicker walls than did veins. B shows a typical recording site at higher magnification. The large arrowhead indicates a section of arteriole which contains red blood corpuscles. The smaller arrowhead indicates an area where a vein overlaps the arteriole. Scale bars, 100 μm in both A and B.
When intracellular recordings were made from choroidal arterioles, three different cell types were identified based on both their responses to transmural stimulation and their resting membrane potentials. In the first group of cells, transmural stimulation at low frequency (0.5-1 Hz) initiated EJPs with a short latency (see Fig. 4) and trains of stimuli at higher frequency (10-50 Hz) elicited complex responses (Fig. 2Aa, Da and Ea). These cells had stable resting membrane potentials which could often be recorded for up to 5 or 6 h, ranging from -31 to −46 mV (mean -38.4 ± 2.8 mV, n = 85 where n represents the number of preparations unless stated otherwise).
Figure 4. The effects of phentolamine, guanethidine, α,β-methylene ATP and tetrodotoxin on the rapid EJPs recorded from choroidal arterioles.
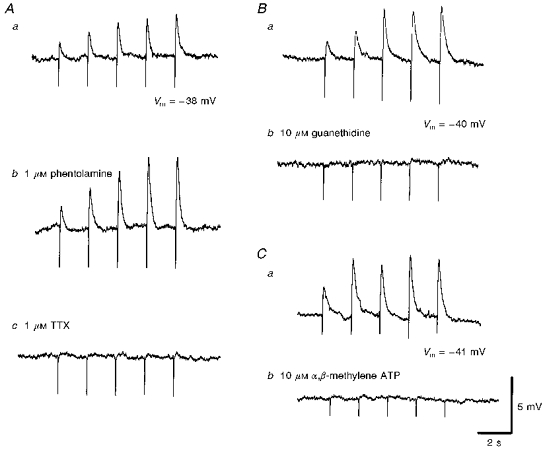
The rapid EJPs evoked by trains of stimuli (supramaximal voltage, 50 μs, 0.5 Hz, 10 s; Aa) in choroidal arterioles persisted in the presence of phentolamine (1 μM; Ab) but were abolished by tetrodotoxin (TTX, 1 μM; Ac). EJPs were abolished by guanethidine (10 μM; Bb) and by α,β-methylene-ATP (10 μM; Cb). A, B and C were recorded from 3 different cells. Aa, Ba and Ca are respective control responses. In each trace, the small downward deflection at the beginning of each EJP indicates the artefact of nerve stimulation. The scale bars on the right refer to all traces. Vm refers to resting membrane potential.
Figure 2. Different types of responses recorded from choroidal vessels in response to train of transmural nerve stimuli.
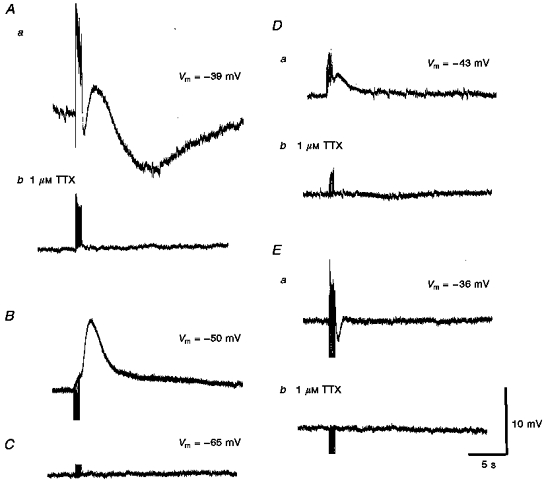
Aa, a train of stimuli (supramaximal voltage, 50 μs, 50 Hz, 1 s) initiated a short-latency depolarization, followed by a transient hyperpolarization, a transient depolarization and a prolonged slow hyperpolarization. Ab, each component was abolished by 1 μM TTX, indicating that each resulted from the stimulation of the perivascular nerves. B, in a vessel, tentatively identified as being a vein, a train of stimuli (supramaximal voltage, 50 μs, 10 Hz, 1 s) failed to evoke the same complex sequence of membrane potential changes. C, in the third type of cell, which could not be identified, trains of stimuli (supramaximal voltage, 50 μs, 50 Hz, 1 s) failed to evoke any membrane potential changes. Da and Ea show other examples of recordings obtained from arterioles stimulated with trains of low frequency (supramaximal voltage, 50 μs, 10 Hz, 1 s); Db and Eb, again the membrane changes were abolished by 1 μM TTX. A, D and E were each recorded from 3 different cells. The scale bars on the right refer to all traces. Vm refers to resting membrane potential.
In the second group of cells, transmural stimulation failed to evoke a short-latency EJP. These cells were detected in 5/85 preparations and had more negative resting membrane potentials than the first group of cells, ranging from -45 to −51 mV (mean -47.6 ± 1.9 mV, calculated from 20 cells in 5 preparations). In these cells trains of stimuli initiated smooth and slow depolarizations (Fig. 2B). When recordings were deliberately made from identified veins, similar resting membrane potentials and depolarizing responses were detected. These observations are similar to those made from other veins (Suzuki, 1981) and suggest recordings were mistakenly made from veins which overlapped the arterioles.
The third type of cell, was detected in only eight impalements in 6/85 preparations examined. These cells had much more negative resting membrane potentials than those in the other two groups (range -59 to −69 mV, mean -62.3 ± 2.9 mV, calculated from 8 cells in 6 preparations). Membrane potential changes were not detected in these cells even when trains of nerve stimuli were delivered at frequencies of up to 50 Hz (Fig. 2C). Presumably these recordings were obtained either from the endothelial layer of the arterioles or from a capillary layer associated with the arteriolar network.
The properties of the second and third types of cells were not investigated further as they were only rarely encountered. The remaining description will be restricted to the responses of the first type of cell which, on the basis of appearance and characteristic responses to nerve stimulation, is considered to be arteriolar smooth muscle cells.
Visual observation of choroidal arterioles indicated that spontaneous irregular constrictions occurred throughout the recording period in the absence of any identifiable stimuli. These constrictions caused the red blood corpuscles within the arteriolar vessels to move back and forth. During these constrictions no change in membrane potential could be detected. Spontaneous constrictions of arterioles and the associated movement of red blood corpuscles persisted in the presence of 1 μM tetrodotoxin, 10 μM guanethidine, or 1 μM nifedipine, but were invariably blocked by 50 μM BAPTA AM. Together, these observations suggest that the spontaneous constrictions result from an increase in the intracellular concentration of calcium ions ([Ca2+]i) via a pathway which involves neither nerve activity nor Ca2+ influx through L-type Ca2+ channels. The source of the spontaneous activity was not investigated further.
Increasing [K+]o from 5.9 mM (control) to either 10 or 15 mM, evoked a membrane hyperpolarization of approximately 10 mV which was abolished by the prior addition of 50 μM Ba2 + (Fig. 3). Increasing [K+]o to over 20 mM, or decreasing [K+]o to 2.5 mM caused a depolarization of the arteriolar membrane (Fig. 3). From similar observations on other cerebral vessels, changes in membrane potential produced by changes in [K+]o result from changes in the activation of inward rectifier K+ channels (Edwards, Hirst & Silverberg, 1988). In some experiments it was found that 5 or 6 h after the preparations had been set up, the resting membrane potential became, gradually, more negative. The membrane potential was invariably restored to its initial value by the addition of 50 μM Ba2+. This suggests that the inward rectifier K+ channels of arteriolar smooth muscle cells are opened over time.
Figure 3. Relationship between [K+]o and the membrane potential of choroidal arterioles.
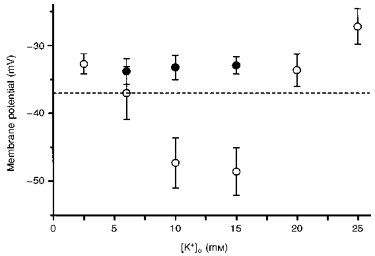
In control solutions (○) the membrane potential was about −37 mV; when [K+]o was increased to either 10 or 15 mM, the membrane hyperpolarized. At higher values of [K+]o the steady-state value of membrane potential was more positive than that detected in control solutions. Prior addition of 50 μM Ba2+ (•) prevented the hyperpolarizations produced by [K+]o (10 and 15 mM). The vertical bars represent ± s.d. (n = 4-25) and the dashed horizontal line indicates the membrane potential recorded in [K+]o = 5.9 mM.
Properties of excitatory junction potentials produced by brief transmural stimuli
In all arteriolar preparations, trains of stimuli (10 Hz) initiated a short-latency depolarization comprising phentolamine (1 μM)-resistant summed EJPs. In 20/25 of these preparations, a single stimulus evoked a rapid EJP. EJPs had peak amplitudes between 0.8 and 9.3 mV (mean 4.2 ± 2.7 mV) and times to peak in the range 58-128 ms (mean 77.5 ± 19.9 ms). The latency of EJPs ranged between 14 and 36 ms (mean 21.1 ± 5.6 ms), with EJP rise times ranging from 22 to 56 ms (mean 38.4 ± 11.1 ms). The half-width of EJPs ranged between 122 and 252 ms (mean 166 ± 37 ms). The decay of the EJP could be fitted by a single exponential and the time constant of the decay ranged from 93 to 302 ms (mean 193.2 ± 48.4 ms). These values were similar to those recorded from other arteries and arterioles (Hirst & Edwards, 1989).
EJPs were abolished by either tetrodotoxin (1 μM; Fig. 4Ac), or guanethidine (10 μM; Fig. 4Bb) but not by phentolamine (1 μM; Fig. 4Ab), indicating that they resulted from the activation of adrenergic nerves. When trains of stimuli were used, at 0.5 Hz, successive EJPs facilitated in amplitude especially in the presence of phentolamine (Fig. 4Ab). Where a single impulse failed to initiate an EJP, EJPs were usually detected by the third or fourth impulse during trains of stimuli (0.5 Hz). Clearly, the probability of release of transmitter varies from vessel to vessel, with transmitter release being only detected in some vessels when the release of transmitter has been facilitated. α,β-Methylene-ATP (10 μM) evoked a transient membrane depolarization, at the peak of which the membrane potential was -27 ± 3.8 mV (n = 13), and then the membrane potential returned to the original level in the presence of α,β-methylene-ATP. In these preparations where purinoceptors had been desensitized, transmural nerve stimulation failed to evoke an EJP (Fig. 4Cb), suggesting that they resulted from ATP which was presumably co-released with noradrenaline from perivascular nerves.
Responses evoked in choroidal arterioles by trains of transmural stimuli
Following trains of transmural stimuli, the arterioles invariably contracted visually. These contractions accompanied three distinct types of membrane potential change. Summed EJPs of short latency were abolished by either guanethidine or desensitization of purinoceptors by α,β-methylene-ATP. In the majority of cells, 65 %, a brief train of nerve stimuli evoked biphasic depolarizations, that is the summed EJPs were followed by a slow depolarization that lasted for some 2-5 s (Fig. 2Da). In a second smaller group of cells (25 %), the summed EJPs were followed by a transient hyperpolarization which lasted some 1-2 s (Fig. 2Ea). As the transient hyperpolarizations were also abolished by tetrodotoxin, they must also have resulted from the activation of perivascular nerve fibres, and consequently these potentials will be termed inhibitory junction potentials (IJPs). In a third group of cells (10 %), a brief train of nerve stimuli initiated triphasic membrane potential changes: initial summed EJPs, followed by an IJP and a slow depolarization (Fig. 2Aa).
In addition to these relatively short-lasting responses, slow long-latency hyperpolarizations were detected in many cells when trains of high-frequency stimuli were presented (see Fig. 2Aa). Thus in 37/47 preparations a train of stimuli, duration 1 s, delivered at 50 Hz evoked slow hyperpolarizations which started after 3 s and lasted for some 15-20 s. Reducing the frequency of stimulation reduced the occurrence of these long-latency responses. Thus slow hyperpolarizations were detected in 21/47 preparations when the stimulation frequency was 20 Hz and only in 8/47 preparations when the stimulation frequency was 10 Hz.
The membrane potential changes initiated by single pulses, or brief low- or high-frequency trains of stimuli were each abolished by 1 μM tetrodotoxin, indicating that each resulted from the selective excitation of perivascular nerve fibres (Fig. 2Ab, Db and Eb). The subsequent sections deal with the properties of the slow depolarizations, IJPs and slow hyperpolarizations.
Properties of slow depolarizations evoked by trains of perivascular nerve stimuli
Where trains of stimuli produced a slow depolarization with or without an obvious peak following the summed purinergic EJPs (Fig. 5Aa and Ba) both components of the response were abolished either by 10 μM guanethidine (n = 10; Fig. 5Cb) or by 1 μM tetrodotoxin (see Fig. 2). Phentolamine (1 μM, n = 31) abolished the slow depolarization (Fig. 5Ab and Bb) but not the purinergic EJPs; visual observation of the preparations suggested that after the addition of phentolamine, perivascular nerve stimulation continued to trigger a contraction. These observations suggest that the slow depolarization results from neurally released noradrenaline activating α-adrenoceptors located on the arteriolar muscle (adrenergic slow depolarizations) but that these receptors are not solely responsible for triggering a contraction. The amplitudes of adrenergic slow depolarizations increased as the frequency of stimulation was increased, with the time to peak being little changed but the half-width being prolonged (Table 1A). The time courses of the adrenergic slow depolarizations, detected in these arterioles, were similar to those in irideal arterioles (Gould & Hill, 1996) but briefer than those detected in many systemic arteries (Bolton & Large, 1986).
Figure 5. The effects of phentolamine and guanethidine on slow depolarizations recorded from choroidal arterioles.
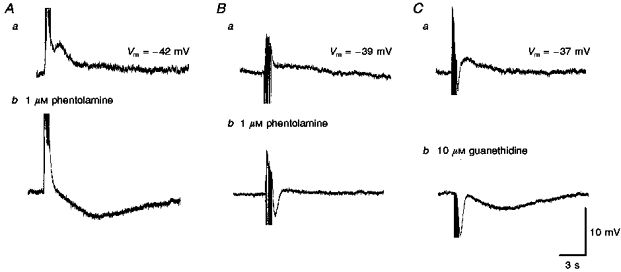
The slow depolarizations evoked by trains of stimuli in two different preparations (supramaximal voltage, 50 μs, 10 Hz, 1 s; Aa and Ba) were abolished by phentolamine (Ab and Bb). In both preparations, the initial purinergic responses persisted. In one of the preparations a slow hyperpolarization was revealed (Ab); in the other a rapid IJP was detected (Bb). In the third preparation both the purinergic and slow depolarization evoked by a train of stimuli (supramaximal voltage, 50 μs, 50 Hz, 1 s, Ca) were abolished by guanethidine to reveal a slow hyperpolarization and an augmented IJP (Cb). A, B and C were recorded from 3 different cells. The scale bars on the right refer to all traces. Vm refers to resting membrane potential.
Table 1.
Time course of α-adrenergic slow depolarizations, cholinergic IJPs and slow hyperpolarizations in response to trains of stimuli
| A. α-Adrenergic EJPs (n = 16) | B. Cholinergic IJPs (n = 15) | C. Slow hyperpolarizations (n = 15) | |||||||
|---|---|---|---|---|---|---|---|---|---|
| Peak amplitude (mV) | Time to peak (s) | Half-width (s) | Peak amplitude (mV) | Time to peak (s) | Half-width (s) | Peak amplitude (mV) | Time to peak (s) | Half-width (s) | |
| 10 Hz | 3.7 ± 1.5 | 1.8 ± 0.4 | 1.1 ± 0.5 | 3.4 ± 1.3 | 1.4 ± 0.1 | 0.9 ± 0.1 | 3.2 ± 1.1 | 6.5 ± 2.2 | 6.9 ± 2.1 |
| 20 Hz | 5.4 ± 1.7 | 1.9 ± 0.5 | 1.2 ± 0.5 | 7.7 ± 3.4 | 1.3 ± 0.1 | 0.6 ± 0.2 | 3.6 ± 1.5 | 7.1 ± 1.8 | 8.6 ± 2.6 |
| 50 Hz | 7.9 ± 3.4 | 1.9 ± 0.5 | 1.8 ± 0.4 | 10.7 ± 4.1 | 1.3 ± 0.4 | 0.8 ± 0.2 | 6.8 ± 2.1 | 8.8 ± 1.4 | 11.1 ± 2.3 |
Transmural stimuli were delivered at supramaximal voltage for 50 μs at 10, 20 or 30 Hz over 1 s. α-Adrenergic slow depolarizations was measured in control solution. Cholinergic IJPs and slow hyperpolarizations were measured in the presence of 1 μ m phentolamine. Values are means ± s.d.; n = number of tissues. The amplitudes of each different type of potential increased as the stimulating frequency was increased but the time courses were little changed.
Only eighteen of the thirty-one preparations in which the effects of 1 μM phentolamine were examined revealed obvious IJPs (Fig. 5Bb). Phentolamine (1 μM) also potentiated the amplitude of the slow late hyperpolarization triggered by high-frequency perivascular nerve stimulation. (Fig. 5Ab). In nineteen preparations, where these responses were quantified, a train of stimuli (duration 1 s, stimulus frequency 50 Hz) initiated a slow hyperpolarization with a peak amplitude of 2.3 ± 1.3 mV. In the presence of phentolamine, the same trains of stimuli initiated an increased response with peak amplitude of 6.1 ± 2.8 mV (P < 0.05).
Properties of inhibitory junction potentials
The properties of IJPs evoked by perivascular nerve stimulation were examined in sixty preparations where α-adrenoceptors were blocked by 1 μM phentolamine. In most preparations (82 %) IJPs were detected within about 1 s of the onset of stimulation. As the frequency of stimulation was increased from 10 to 50 Hz, the amplitudes of the IJPs increased but there was little associated change in either their time to peak or half-width (Table 1B).
Atropine (1 μM, n = 55; Fig. 6Ab and Bc), hyoscine (1 μM, n = 5) and tetrodotoxin (1 μM, n = 10; Fig. 2Ab and Eb), but not guanethidine (10 μM, n = 12,Fig. 6Bb) each abolished the IJPs. These results indicate that these vessels receive an inhibitory innervation, which when stimulated, gives rise to IJPs resulting from the activation of muscarinic receptors.
Figure 6. The effects of atropine and guanethidine on rapid IJPs recorded from choroidal arterioles.
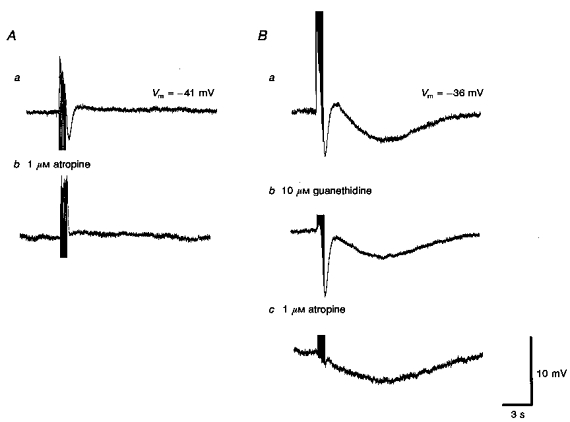
Trains of field stimulation (supramaximal voltage, 50 μs, 10 Hz, 1 s), in the presence of 1 μM phentolamine produced rapid IJPs which were abolished by atropine (1 μM; Ab). In another preparation, guanethidine (10 μM; Bb) applied before atropine (1 μM, Bc) abolished the purinergic response but did not affect the initial IJP. Bc, subsequently atropine abolished the initial IJP. Although guanethidine reduced the late slow hyperpolarization (Bb), atropine was without further effect on this component (Bc). A and B were recorded from 2 different cells. Aa and Ba are respective control responses. The scale bars on the right refer to all traces. Vm refers to resting membrane potential.
Properties of slow hyperpolarizations
These were routinely examined in the presence of 1 μM phentolamine. Under these conditions, stimulation of the nerves by a train of pulses (duration 1 s, delivered at 10 Hz) evoked slow hyperpolarizations in 15/80 preparations examined. When the frequency of stimulation was increased to 20 Hz and then to 50 Hz, slow hyperpolarizations were recorded in 29/80 preparations and 69/80 preparations, respectively. The properties of the slow hyperpolarizations are summarized in Table 1C.
L-Nitroarginine (LNA, 10 μM) reduced the peak amplitude of the slow hyperpolarizations by 93.2 ± 9.3 % without changing the membrane potential (-37.9 ± 3.8 mV, n = 14,P > 0.05). In five preparations 100 μM LNA abolished the slow hyperpolarization but this was associated with a membrane depolarization (-33.7 ± 1.1 mV, n = 5). After washing out of LNA (10 μM), 1 mM L-arginine restored the slow hyperpolarization to 83.7 ± 24.9 % of its control value (n = 7). Two separate experiments are shown in Fig. 7. When recordings were made in the absence of phentolamine, the purinergic EJPs and cholinergic IJPs were followed by a slow hyperpolarization (Fig. 7Aa). LNA (10 μM) abolished this hyperpolarization and unmasked a slow α-adrenoceptor-mediated depolarization without affecting either the purinergic EJPs or the cholinergic IJPs (Fig. 7Ab). In another experiment, where the responses to vasoconstrictor nerve stimulation had been abolished by guanethidine, a cholinergic IJP was followed by a slow hyperpolarization (Fig. 7Ba). Only the slow hyperpolarization was abolished by LNA (10 μM, Fig. 7Bb) and this effect was reversed by L-arginine (1 mM, Fig. 7Bc). Therefore, the slow hyperpolarization resulted entirely from the release of NO.
Figure 7. The effects of L-nitroarginine and L-arginine on the slow hyperpolarization recorded from choroidal arterioles.
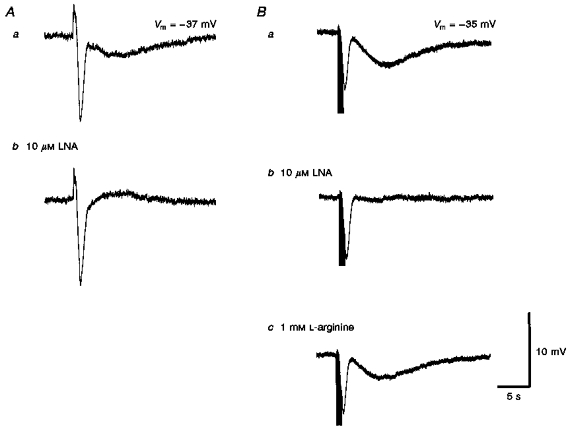
L-Nitroarginine (LNA, 10 μM; Ab) selectively abolished the slow hyperpolarization compared with controls (Aa) in response to a high-frequency train of stimuli (supramaximal voltage, 50 μs, 50 Hz, 1 s). In another preparation where recordings were made in the presence of 10 μM guanethidine (Ba), again 10 μM LNA selectively abolished the slow hyperpolarization (Bb) and the effect of LNA was partially reversed by L-arginine (1 mM; Bc). The scale bars on the right refer to all traces. Vm refers to resting membrane potential.
Slow hyperpolarizations were abolished by 1 μM tetrodotoxin, but were unaffected by 1 μM atropine (see Fig. 6). They were also reduced in amplitude to 58.5 ± 13.6 % of control (n = 10,P < 0.05) by 10 μM guanethidine (Figs 6Bb and 8Bb). Propranolol produced a similar inhibition to that produced by guanethidine, reducing the responses to 65 ± 9.8 % of control (n = 8,P < 0.05; Fig. 8Ab). Together these observations suggest that during high-frequency stimulation, adrenergic nerves release sufficient noradrenaline to activate β-adrenoceptors which stimulate NO release.
Figure 8. The individual effects of propranolol, guanethidine and capsaicin on slow hyperpolarizations recorded from choroidal arterioles.
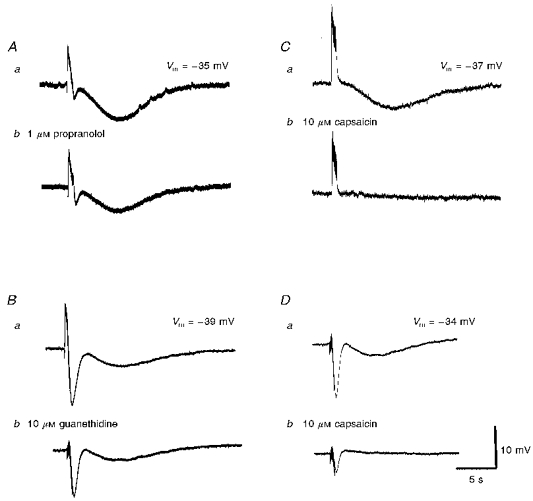
A series of membrane potential changes, initiated in the presence of phentolamine (1 μM) by trains of high-frequency nerve stimuli (supramaximal voltage, 50 μs, 50 Hz, 1 s) are shown. The slow hyperpolarization was reduced in amplitude by each of propranolol (1 μM; Ab) and guanethidine (10 μM; Bb) and abolished by capsaicin (10 μM; Cb). The traces shown in D were recorded in the presence of guanethidine (10 μM); Db, the guanethidine-resistant component was virtually abolished by capsaicin. A, B, C and D were recorded from 4 different cells. Aa, Ba, Ca and Da are respective control responses. The scale bars on the right refer to all traces. Vm refers to resting membrane potential.
The slow hyperpolarizations were reduced in amplitude by 10 μM capsaicin (Fig. 8Cb and Db), suggesting the involvement of peptide-containing sensory nerves in these responses (Holzer, 1992). However, capsaicin also reduced both the amplitude of cholinergic IJPs (Fig. 8Db) and vasoconstrictor responses (not shown). This latter observation suggests that capsaicin might be unselective in this tissue. Attempts to confirm the involvement of peptides in the late responses using antagonists for three peptides were unsuccessful. Neither the substance P antagonist, [D-Arg1,D-Trp7,9,Leu11]-substance P (spantide) (amplitude of hyperpolarizations in 0.1 μM spantide was 97.5 ± 3.7 % of control, n = 4), nor the CGRP antagonist, calcitonin gene-related peptide (Human, fragment 8-37, 0.1 μM), reduced the amplitude of responses (97.2 ± 4.4 % of control, n = 5). Similarly, the VIP antagonist vasoactive intestinal peptide fragment 6-28 (0.1 μM) failed to block the slow hyperpolarizations (97.5 ± 9.3 % of control, n = 5).
Effects of K+ channel blockers on muscarinic IJPs and slow hyperpolarizations
As well as being able to distinguish between muscarinic IJPs and slow hyperpolarizations with either atropine (Fig. 6) or LNA (Fig. 7), the two responses could be distinguished on the basis of the ion channels activated during their occurrence. Glibenclamide (10 μM) reduced the amplitude of the slow hyperpolarization to 7.7 ± 6.9 % of control (n = 8,P < 0.05; Fig. 9Bb) with an associated membrane depolarization (3.7 ± 0.6 mV, n = 4), suggesting that the slow hyperpolarization is produced by opening of ATP-sensitive K+ channels. Conversely glibenclamide had no effect on the muscarinic IJP (n = 4).
Figure 9. The effects of apamin, charybdotoxin and glibenclamide on two distinct hyperpolarizations recorded from choroidal arterioles.
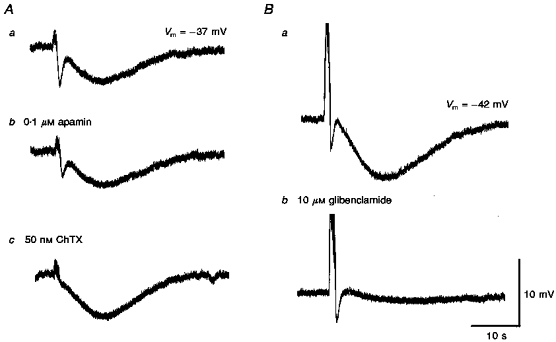
A comparison of the effects of apamin (0.1 μM) alone (Ab) and with charybdotoxin (ChTX, 50 nM; Ac) each in the presence of guanethidine (10 μM) and of glibenclamide (Glib, 10 μM) in the presence of phentolamine (1 μM) on the responses of guinea-pig choroidal arterioles to trains of field stimulation (supramaximal voltage, 50 μs, 50 Hz, 1 s). A and B were recorded from 2 different cells. Respective controls Aa and Ba were in the presence of guanethidine and phentolamine. Ab, cholinergic IJP but not slow hyperpolarization was inhibited by apamin. Ac, subsequent addition of ChTX abolished the residual IJP and enhanced the amplitude of the slow hyperpolarization. Bb, glibenclamide almost completely inhibited the slow hyperpolarization without affecting IJP. The scale bar on the right refers to all traces. Vm refers to resting membrane potential.
Apamin (0.1 μM) reduced the muscarinic IJP to approximately 49 ± 8.5 % of its control value (n = 11,P < 0.05; Fig. 9Ab), with no significant effect on the membrane potential. The residual response was abolished by charybdotoxin (ChTX, 50 nM; Fig. 9Ac). Conversely, 50 nM ChTX reduced the muscarinic IJP to 77 ± 14.7 % of control (n = 7,P < 0.05), with an associated depolarization of the membrane (4.2 ± 1 mV, n = 7). The residual response was again abolished by 0.1 μM apamin (not shown). These results suggest that two sets of Ca2+-activated K+ channels underlie the muscarinic IJP. In contrast, apamin had no effect on the slow hyperpolarization (amplitude of response in apamin was 101 ± 7.4 % of control response, n = 5), while ChTX increased the amplitude of the slow hyperpolarization to 148.4 ± 24.4 % of control (n = 5,P < 0.05; see Fig. 9A).
Neurochemical content and distribution of nerves associated with choroidal arteries
Preparations for immunohistochemical analysis treated with protein gene product 9.5 (PGP9.5, an antibody which is a marker for all nerve fibres) showed that numerous nerve fibres surrounded the choroidal arterioles. Both varicose and non-varicose fibres were identified alongside arterioles, and formed a plexus around the posterior ciliary arteries (Fig. 10A). A number of nerve fibres also run between the arterioles throughout the choroidal sheet.
Figure 10. Immunoreactivity of nerve fibres innervating choroidal arterioles in the guinea-pig to αPGP9.5, αTH, αVIP, αNOS and αSP.
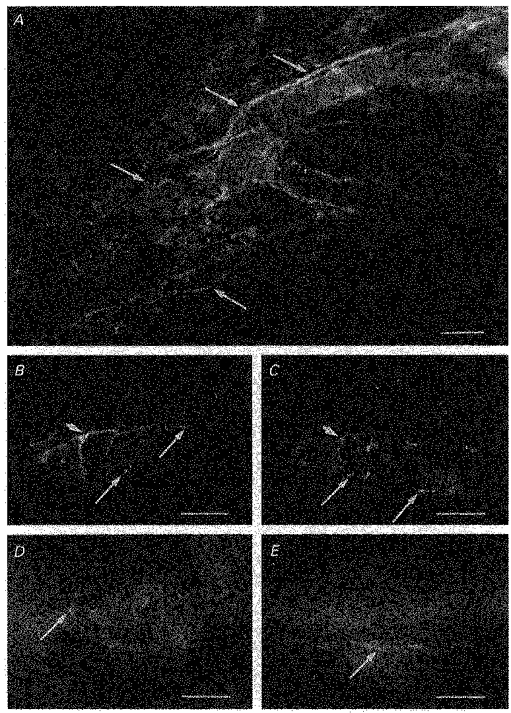
A, a preparation treated with αPGP9.5, a marker used to identify all neuronal elements. Numerous, dense nerve fibres immunoreactive to αPGP9.5 were identified surrounding guinea-pig choroidal arterioles (arrows). B and C, same preparation double labelled with αTH (B) and αVIP (C). Choroidal arterioles were densely innervated with αTH immunoreactive fibres, which often formed a plexus around the arterioles (B). Choroidal arterioles were also innervated by nerve fibres immunoreactive to αVIP (C). In preparations double labelled with both αTH and αVIP, nerve fibres immunoreactive to αTH formed a separate population from those fibres which expressed immunoreactivity to αVIP (longer arrows in B indicate fibres immunoreactive to αTH but not to αVIP and longer arrows in C indicate those fibres expressing immunoreactivity to αVIP only). However, even though nerve fibres immunoreactive to αTH were separate from those immunoreactive to αVIP, they were often found running alongside one another, possibly in the same nerve bundle (arrowed in B and C). Choroidal arterioles were also innervated by numerous αNOS-containing nerve fibres, which appeared to be varicose (arrow, D). In separate preparations, varicose nerve fibres expressing immunoreactivity to αSP were also identified (arrow, E), although innervation by αSP immunoreactive fibres were sparse. Scale bars: A, 100 μm; B-E, 50 μm.
Adrenergic nerve fibres were identified using an antibody against tyrosine hydroxylase (TH). Numerous TH immunoreactive (TH-IR) nerve fibres surrounded both the larger and smaller arterioles forming a perivascular plexus around them (Fig. 10B). The presence and distribution of cholinergic nerve fibres was examined using an antibody against vasoactive intestinal polypeptide (VIP). VIP is co-localized within cholinergic nerves in a number of tissues (Morris et al. 1995), including the uveal vascular beds (Albert, 1992). In the present study, VIP-IR nerve fibres surrounding choroidal arterioles were identified. These were fewer in number than the TH-IR nerve fibres; however, like TH-IR nerve fibres, VIP-IR nerve fibres often formed a perivascular plexus around the arterioles (Fig. 10C). Double labelling for VIP and TH on the same preparation showed that immunoreactivity to TH and VIP was located in separate populations of nerve fibres (compare Fig. 10B and C), indicating that VIP is not co-localized within adrenergic nerve fibres.
The presence of nitric oxide and substance P within nerve fibres innervating choroidal arterioles was also investigated using antibodies against nitric oxide synthase (NOS) and substance P (SP). Choroidal arterioles were found to be densely innervated with fibres immunoreactive to NOS (Fig. 10D) running alongside and forming a perivascular plexus around the arterioles. In separate preparations, a few varicose and non-varicose fibres immunoreactive for SP were identified running alongside the choroidal arterioles, but innervation by SP immunoreactive (SP-IR) fibres was sparse (Fig. 10E).
These results show that choroidal arterioles were densely innervated by adrenergic nerve fibres. Additionally, a separate population of nerve fibres containing VIP, a proportion of which are likely to be cholinergic, was also identified associated with the choroidal arterioles. Numerous nerve fibres were also found to contain NOS and presumably NO. Furthermore, in separate preparations, a small population of nerve fibres innervating the arterioles were reactive to SP.
DISCUSSION
In contrast to most arterial and arteriolar smooth muscles, which have resting membrane potentials between −60 and −75 mV (Hirst & Edwards, 1989), choroidal arterioles have membrane potentials of about −38 mV. The only other arterioles with such low membrane potentials are those in distal regions of the cerebral circulation and in immature cerebral arteries (Hirst & Edwards, 1989). In each of these vascular beds, the low membrane potentials appear to result from a closure of inward rectifier K+ channels in normal [K+]o (Fig. 3 and Hirst & Edwards, 1989). In the choroidal bed, the arterioles receive a dense adrenergic innervation (Fig. 10), and this differs from the observations made previously where a low resting membrane potential was correlated with a lack of adrenergic innervation (Clarke, Edwards, Hirst & Silverberg, 1991). Clearly low membrane potentials do not only simply reflect a lack of innervation.
The low membrane potentials of choroidal arterioles suggest that, even in unstimulated conditions, they maintain a higher resting tone than other arterioles, perhaps from an ongoing influx of Ca2+ through voltage-dependent Ca2+ channels. However, unlike cerebral arterioles in which spontaneous constrictions are associated with membrane potential changes (Edwards et al. 1988), spontaneous constrictions of choroidal arterioles were not associated with changes in membrane potential. Moreover, as nifedipine failed to prevent those spontaneous constrictions, they may be due to the pulsatile release of Ca2+ from an intracellular store. Alternatively a steady Ca2+ influx via nifedipine-insensitive Ca2+ channels may trigger the cyclical release of Ca2+ from an intracellular store.
EJPs recorded from choroidal arterioles are inhibited by guanethidine and also by desensitizing the purinoceptors with α,β-methylene-ATP. In other tissues this has been interpreted to mean that ATP is co-released with noradrenaline from sympathetic nerves (Sneddon et al. 1996). EJPs had similar time courses and pharmacological sensitivities to those recorded from other arteries and arterioles (Hirst & Edwards, 1989). After blockade of α-adrenoceptors, a train of stimuli continued to initiate a constriction. Thus EJPs themselves may trigger contraction in choroidal arterioles, as reported in the rabbit ear artery (Suzuki & Kou, 1983). Although the purinergic responses in the present study did not trigger action potentials like those detected in some other arterioles (see Hirst & Edwards, 1989), the residual constriction was reduced but not abolished by the further addition of nifedipine; this suggests that some Ca2+ entry via nifedipine-sensitive channels occurs and that EJPs themselves allow Ca2+ entry.
With trains of stimuli, α-adrenergic slow depolarizations had slower time courses and smaller amplitudes than did the summed purinergic responses. The α-adrenoceptor-mediated component of the response to nerve stimulation only partly contributed to arteriolar constriction: α-adrenoceptor blockade reduced but did not abolish arteriolar constriction. However, blockade of α-adrenoceptors invariably increased the amplitude of responses linked either to muscarinic receptor activation or to the release of NO. This suggests that, in this bed, adrenergic nerve activity might well inhibit the release of vasodilator transmitters by a pre-junctional mechanism.
The novel finding of this study is that these vessels receive two independent vasodilator innervations. One, when stimulated, gave rise to IJPs that were sensitive to atropine but persisted in the presence of guanethidine or nitroarginine. This could occur if a set of fibres, presumably those containing VIP (Fig. 10; Albert, 1992; Morris et al. 1995), released ACh which activated a muscarinic receptor on the smooth muscle cells and directly caused inhibition. Cholinergic IJPs whose occurrence does not involve the release of endothelial factors have been described in the lingual artery (Brayden & Large, 1986).
Alternatively, the neurally released ACh could cause a membrane hyperpolarization, indirectly, by releasing EDHFs from the endothelium. In most vascular beds, ACh causes inhibition by triggering the release of several endothelium-derived substances including EDHFs (Suzuki, Yamamoto & Hashitani, 1996); conversely ACh excites most vascular smooth muscle in the absence of the endothelium (Bolton, Lang & Takewaki, 1984; Kalsner, 1989). Support for this possibility comes from the findings that cholinergic IJPs and EDHFs activate identical channels in guinea-pig arterioles. Thus cholinergic IJPs recorded from choroidal arterioles result from the activation of both of ChTX- and apamin-sensitive Ca2+-activated K+ channels. In submucosal arterioles where neurally released ACh causes membrane hyperpolarizations (Kotecha & Neild, 1995), EDHFs also cause membrane hyperpolarizations, again by activating ChTX- and apamin-sensitive Ca2+-activated K+ channels (Hashitani & Suzuki, 1997).
The slow hyperpolarizations, unlike the cholinergic IJPs, clearly involve the release of NO, since they are abolished by LNA. The simplest explanation is that NO is released from the NOS-containing nerves which form a plexus around these arterioles (Fig. 10). If so, either propranolol or guanethidine must exert their inhibitory effects on the slow hyperpolarizations in an indirect way. For example, many autonomic varicosities have β-adrenoceptors on their membranes. Such receptors facilitate the release of transmitter and are perhaps activated by adrenergic nerve stimulation (Vanhoutte, Verbeuren & Webb, 1981). Blockade of either noradrenaline release or β-adrenoceptor activation would then decrease NO release. However, either drug could be acting non-selectively in a way that did not involve adrenoceptors or catecholamine release. Capsaicin, which also strongly inhibited this component, must also be acting non-specifically on these nerve fibres. Evidence for a lack of selectivity of capsaicin in these preparations came from the observation that capsaicin reduced the amplitude of cholinergic IJPs along with neurally mediated constrictions.
Alternatively the slow hyperpolarizations could result from the release of NO from the endothelium. On this basis, noradrenaline, released from adrenergic nerves, might activate β-adrenoceptors on the endothelium to trigger NO release. If so, there must be neurally released substances which contribute to the response remaining after blocking of the β-adrenergic response. Clearly ACh is not involved in the slow hyperpolarization, since atropine was without effect. The slow and prolonged time course of these hyperpolarizations, their occurrence only with high frequencies of stimulation and their capsaicin sensitivity are characteristics generally associated with the release of peptides from sensory nerves (Holzer, 1992; Morris et al. 1995). However, the antagonists used, both for substance P and CGRP which are contained in sensory nerves of the choroid (Albert, 1992), failed to inhibit the slow hyperpolarizations, so we could not confirm which peptides were involved.
Whichever is the case, it is clear that the slow hyperpolarization involves not only a separate chemical intermediary from that involved in the generation of cholinergic IJPs, but also the activation of quite different ion channels in the membranes of the arterioles. The slow hyperpolarization involved not Ca2+-activated K+ channels, but ATP-sensitive K+ channels, which like the NO-mediated hyperpolarization described in rabbit mesenteric artery are sensitive to glibenclamide (Murphy & Brayden, 1995). These hyperpolarizing responses would be expected to oppose the vasoconstrictor responses arising from adrenergic nerve stimulation and as such contribute to the regulation of the intraocular circulation.
In summary, the present study has shown that choroidal arterioles receive an adrenergic vasoconstrictor innervation which causes vasoconstriction by activating purinoceptors and α-adrenoceptors. The vessels also receive two distinct vasodilator innervations. One of these involves the activation of muscarinic receptors which may be directly linked to sets of Ca2+-activated K+ channels or may cause hyperpolarizations after releasing EDHFs. The other vasodilator innervation involves the release of NO but it is not clear whether this originates from NOS-containing nerves or from the endothelium. However, it is clear that this innervation triggers a membrane hyperpolarization by activating different channels to those involved in the production of cholinergic IJPs.
Acknowledgments
The authors are grateful to Professor G. D. S. Hirst for helpful comments on the manuscript.
References
- Albert A. Ocular circulation. In: Hart WM Jr, editor. Adler's Physiology of the Eye. 9. St Louis, MO, USA: Mosby-Year Book, Inc.; 1992. pp. 198–227. [Google Scholar]
- Bolton TB, Lang RJ, Takewaki T. Mechanisms of action of noradrenaline and carbachol on smooth muscle of guinea- pig anterior mesenteric artery. The Journal of Physiology. 1984;351:549–572. doi: 10.1113/jphysiol.1984.sp015262. [DOI] [PMC free article] [PubMed] [Google Scholar]
- Bolton TB, Large WA. Are junction potentials essential? Dual mechanism of smooth muscle cell activation by transmitter released from autonomic nerves. Quarterly Journal of Experimental Physiology. 1986;89:163–171. doi: 10.1113/expphysiol.1986.sp002960. [DOI] [PubMed] [Google Scholar]
- Brayden JE, Large WA. Electrophysiological analysis of neurogenic vasodilatation in the isolated lingual artery of the rabbit. British Journal of Pharmacology. 1986;89:163–171. doi: 10.1111/j.1476-5381.1986.tb11132.x. [DOI] [PMC free article] [PubMed] [Google Scholar]
- Clarke A, Edwards FR, Hirst GDS, Silverberg GD. Developmental changes in the resting membrane potential of rat cerebral arteries. In: Mulvany MJ, Aalkjaer C, Heagerty AM, Nyborg NCB, Strandgaard S, editors. Resistance Arteries, Structure and Function. Amsterdam: Excerpta Medica; 1991. pp. 147–151. [Google Scholar]
- Costa M, Buffa R, Furness JB, Solcia E. Immunohistochemical localisation of polypeptides in peripheral autonomic nerves using whole mount preparations. Histochemistry. 1980;65:157–165. doi: 10.1007/BF00493164. [DOI] [PubMed] [Google Scholar]
- Edwards FR, Hirst GDS, Silverberg GD. Inward rectification in rat cerebral arterioles; involvement of potassium ions in autoregulation. The Journal of Physiology. 1988;404:455–466. doi: 10.1113/jphysiol.1988.sp017299. [DOI] [PMC free article] [PubMed] [Google Scholar]
- Gould DJ, Hill CE. α-Adrenoceptor activation of a chloride conductance in rat iris arterioles. American Journal of Physiology. 1996;271:H2469–2476. doi: 10.1152/ajpheart.1996.271.6.H2469. [DOI] [PubMed] [Google Scholar]
- Hashitani H, Suzuki H. K+ channels which contribute to the acetylcholine-induced hyperpolarization in smooth muscle of the guinea-pig submucosal arteriole. The Journal of Physiology. 1997;501:319–329. doi: 10.1111/j.1469-7793.1997.319bn.x. [DOI] [PMC free article] [PubMed] [Google Scholar]
- Hirst GDS, Edwards FR. Sympathetic neuroeffector transmission in arteries and arterioles. Physiological Reviews. 1989;69:546–604. doi: 10.1152/physrev.1989.69.2.546. [DOI] [PubMed] [Google Scholar]
- Holzer P. Peptidergic sensory neurons in the control of vascular functions: mechanisms and significance in the cutaneous and splenetic vascular beds. Reviews of Physiology, Biochemistry and Pharmacology. 1992;121:49–146. doi: 10.1007/BFb0033194. [DOI] [PubMed] [Google Scholar]
- Kalsner S. Cholinergic constriction in the general circulation and its role in coronary artery spasm. Circulation Research. 1989;65:237–257. doi: 10.1161/01.res.65.2.237. [DOI] [PubMed] [Google Scholar]
- Komori K, Chen G, Suzuki H. Mechanisms of inhibitory noradrenergic transmission in the rabbit facial vein. Pflügers Archiv. 1989;413:359–364. doi: 10.1007/BF00584484. [DOI] [PubMed] [Google Scholar]
- Kotecha N, Neild TO. Vasodilatation and smooth muscle membrane potential changes in arterioles from the guinea-pig small intestine. The Journal of Physiology. 1995;482:661–667. doi: 10.1113/jphysiol.1995.sp020548. [DOI] [PMC free article] [PubMed] [Google Scholar]
- Meehan AG, Hottenstein OD, Kreulen DL. Capsaicin-sensitive nerves mediate inhibitory junction potentials and dilatation in guinea-pig mesenteric artery. The Journal of Physiology. 1991;443:161–174. doi: 10.1113/jphysiol.1991.sp018828. [DOI] [PMC free article] [PubMed] [Google Scholar]
- Morris JL, Gibbins IL, Kadowitz PJ, Herzog H, Kreulen DL, Toda N, Claling A. Role of peptides and other substances in cotransmission from vascular autonomic and sensory neurons. Canadian. The Journal of Physiology and Pharmacology. 1995;73:521–532. doi: 10.1139/y95-067. [DOI] [PubMed] [Google Scholar]
- Murphy ME, Brayden JE. Nitric oxide hyperpolarizes rabbit mesenteric arteries via ATP-sensitive potassium channels. The Journal of Physiology. 1995;486:47–58. doi: 10.1113/jphysiol.1995.sp020789. [DOI] [PMC free article] [PubMed] [Google Scholar]
- Prehn JL, Bevan JA. Facial vein of the rabbit. Intracellularly recorded hyperpolarisation of smooth muscle cells induced by beta-adrenergic receptor stimulation. Circulation Research. 1983;52:465–470. doi: 10.1161/01.res.52.4.465. [DOI] [PubMed] [Google Scholar]
- Sneddon P, Burnstock G. ATP as a cotransmitter of noradrenaline in rat tail artery. European Journal of Pharmacology. 1984;106:149–152. doi: 10.1016/0014-2999(84)90688-5. [DOI] [PubMed] [Google Scholar]
- Sneddon P, McLaren GJ, Kennedy C. Purinergic cotransmission: sympathetic nerves. Seminars in Neurosciences. 1996;8:201–205. [Google Scholar]
- Suzuki H. Effects of endogenous and exogenous noradrenaline on smooth muscle of guinea-pig mesenteric vein. The Journal of Physiology. 1981;321:495–512. doi: 10.1113/jphysiol.1981.sp013999. [DOI] [PMC free article] [PubMed] [Google Scholar]
- Suzuki H, Fujiwara S. Neurogenic electrical responses of single smooth muscle cells of the dog middle cerebral artery. Circulation Research. 1982;51:751–759. doi: 10.1161/01.res.51.6.751. [DOI] [PubMed] [Google Scholar]
- Suzuki H, Kou K. Electrical components contributing to the nerve-mediated contractions in smooth muscles of the rabbit ear artery. Japanese The Journal of Physiology. 1983;33:743–756. doi: 10.2170/jjphysiol.33.743. [DOI] [PubMed] [Google Scholar]
- Suzuki H, Mishima S, Miyahara H. Effects of reserpine on electrical responses evoked by perivascular nerves stimulation in the rabbit ear artery. Biomedical Research. 1984;5:259–266. [Google Scholar]
- Suzuki H, Yamamoto Y, Hashitani H. Vasodilatation induced by endothelium-derived hyperpolarizing factor. In: Bolton TB, Tomita T, editors. Smooth Muscle Excitation. London: Academic Press; 1996. pp. 507–514. [Google Scholar]
- Toda N, Okamura T. Regulation by nitroxergic nerve of arterial tone. News in Physiological Sciences. 1992;7:148–153. [Google Scholar]
- Vanhoutte PM, Verbeuren TJ, Webb RC. Local modulation of adrenergic neuroeffector interaction in the blood vessel wall. Physiological Reviews. 1981;61:151–247. doi: 10.1152/physrev.1981.61.1.151. [DOI] [PubMed] [Google Scholar]


