

Abstract
In the hippocampal formation in vivo, brief periods of γ-frequency activity follow population bursts called sharp waves. The ≈200 Hz activity of the sharp wave itself may serve to enhance synaptic connections and the ≈40 Hz γ activity has been offered as a mechanism for solving the ‘binding’ problem. We describe epochs of γ-frequency activity which follow population spikes evoked by low frequency repetitive extracellular stimuli in retrohippocampal neurons of horizontal rat brain slices.
γ-Frequency activity recorded intracellularly from deep layer neurons of entorhinal cortex, presubiculum and parasubiculum consisted of one action potential correlated with each of the three to five γ cycles recorded with a proximate field potential electrode. A minority of cells exhibited only sub-threshold γ-frequency membrane potential oscillations (ranging from 5 to 10 mV). No cells fired more than one spike per γ cycle under any conditions.
The range of synchrony varied from individual cells which showed γ-frequency firing without corresponding oscillations in close field recordings to field potential recordings of oscillations which were well correlated across regions. The lead or lag between any two retrohippocampal regions was in the direction of the conduction delay for the primary population spike, but typically was less, and approached zero milliseconds for some cycles in most cells. The level of synchrony was stable for particular stimulating conditions (intensity, stimulation rate, stimulus location).
The duration of the period of γ activity had the duration of a slow depolarizing potential which was mediated by NMDA receptor activation. NMDA receptor antagonists or low concentrations of AMPA receptor antagonists reduced the duration of, or completely abolished the slow potential, thereby eliminating the γ portion of the evoked response.
γ-Frequency firing was eliminated by the GABAA receptor antagonist picrotoxin but small (< 5 mV) membrane potential oscillations remained after focal picrotoxin applications, and these exhibited the voltage dependence of EPSPs. Bath application of thiopental lowered the frequency of γ oscillations, confirming the involvement of GABAA receptors.
The GABAB receptor antagonist 2-hydroxy-saclofen appeared to enhance the γ activity by increasing the duration of the γ epoch and increasing the amplitude of individual γ cycles in field potential recordings. These saclofen-induced cycles were, however, less well synchronized across regions.
We show that synchronous γ (40–100 Hz) activity follows population bursts by deep layer retrohippocampal neurons in undrugged slices from rat brain. Responses from medial entorhinal, parasubicular or presubicular cells were not distinguishable. These events can be initiated by a propagating population spike. We suggest that an NMDA receptor mediated depolarization enables the network of deep layer retrohippocampal neurons to oscillate by providing a sustained excitation, the duration of which determines the duration of the γ episode. γ-Frequency firing is primarily the result of GABAA receptor dependent inhibition during this period of sustained depolarization. Recurrent excitation appears to be inconsequential for principal cell firing, but may contribute to interneuron firing.
The retrohippocampal cortices, which include the six-layered presubiculum, parasubiculum and entorhinal cortex and the three-layered subiculum, are ‘transitional’ between the neocortex and the hippocampus (reviewed in Witter, Groenewegen, Lopes da Silva & Lohman, 1989; Lopes da Silva, Witter, Boejinga & Lohman, 1990). They are considered transitional cortices for two reasons. First, they are located between the neocortex and the hippocampus. Their structures reflect this position by varying from being more similar to the six-layered structure of neocortex (e.g. entorhinal cortex) to being more similar to the three-layered structure of the hippocampus (e.g. subiculum). Second, the retrohippocampal cortices are functionally transitional, acting as a relay for activity between neocortex and hippocampus.
Within the hippocampal formation (i.e. the combination of the hippocampus and the retrohippocampal cortices), excitatory connections join principal neurons from many, or a few, of the subregions into circuits (Witter et al. 1989; Lopes da Silva et al. 1990).
The neuronal circuits of the hippocampal formation contribute to a variety of spontaneously occurring electroencephalographic rhythms and events which reflect synchronous activity patterns. Among these are the 4-10 Hz θ-rhythm (e.g. Brankack, Stewart & Fox, 1993), the 30-100 Hz γ-rhythm (e.g. Traub, Whittington, Colling, Buzsáki & Jefferys, 1996), and population events such as the sharp wave (e.g. Buzsáki, Horváth, Urioste, Hetke & Wise, 1992) and epileptiform spikes (e.g. Traub & Wong, 1982).
Numerous studies have explored the cellular bases for these phenomena, the mechanisms by which synchronization is achieved, the circuit elements which modulate the basic connections, the factors that trigger or gate the activity and their functional significance. The local inhibitory circuitry has been shown to contribute to each of these synchronous activity patterns (reviewed in Freund & Buzsáki, 1996). Beyond the consideration usually given to the excitatory interconnections and local inhibitory connections, longer range inhibitory projections between hippocampal formation regions have also been demonstrated anatomically (Germroth, Scherdtfeger & Buhl, 1989; Ceranik, Bender, Geiger, Monyer, Jones, Frotscher & Lübke, 1997), but these have not had functional roles identified for synchronizing principal cell activity. As an exception to this statement, the inhibitory inputs from subcortical areas (see Freund & Buzsáki, 1996) have been studied in some detail, particularly with regard to their role in the generation of the hippocampal θ-rhythm.
The role of local interneurons for the production of γ-frequency activity (30-100 Hz) in the hippocampus was recently demonstrated in brain slices. Spontaneous subthreshold and suprathreshold γ-frequency activity was produced in hippocampal neurons in vitro by pharmacologically depressing GABAB receptor-mediated inhibition and enhancing cellular excitability via metabotropic glutamate receptor activation (Whittington, Traub & Jefferys, 1995; Traub, Whittington, Stanford & Jefferys, 1996). γ-Frequency oscillations were also shown to occur in response to particular extracellular stimulation protocols (Traub et al. 1996; Stanford, Traub, Colling & Jefferys, 1997). Whereas these in vitro recordings of γ activity were dependent upon interneuron activity, the γ activity of neocortical cells capable of intrinsic membrane potential oscillations in the γ-frequency range (Llinás, Grace & Yarom, 1991) may not depend on interneuron activity.
γ-Frequency oscillations have received particular attention because of suggestions that this activity may play an important role in the synchronization of widely separated cortical neurons as a solution to the ‘binding problem’ (Llinás et al. 1991; Gray, 1994; Singer & Gray, 1995; Traub, et al. 1996). In freely moving and urethane-anesthetized rats, spontaneous γ-frequency oscillations occur in the hippocampus together with the EEG θ-rhythm (Freund & Buzsáki, 1996). A ‘tail’ of γ-frequency oscillations has been shown to follow the population burst in sharp waves recorded in hippocampus of freely moving rats (Traub et al. 1996).
The sharp wave may be a neural event with profound consequences. Not only is it associated with a transient period of γ-frequency activity, the sharp wave itself is a short period of very high frequency activity (∼200 Hz) in the population of principal cells (Buzsáki et al. 1992; Ylinen et al. 1995). This 200 Hz ‘ripple’ has been suggested to be a natural stimulus for enhancing synaptic efficacy. In spite of their amplitude (they rival epileptiform bursts as the largest spontaneous electroencephalographic events), studies of the functional role of the sharp wave have been hampered by the fact that they occur so rarely in freely moving animals.
Previously, we demonstrated large population bursts in deep layers of the retrohippocampal regions in vitro. Remarkably, these events had a cellular distribution which was identical to that seen for retrohippocampal cells participating in the sharp wave in vivo. Specifically, deep layer neurons of presubiculum, parasubiculum and entorhinal cortex were all found to fire during sharp waves in vivo (Chrobak & Buzsáki, 1994, 1996) or population bursts in vitro (Funahashi & Stewart, 1997b) while superficial layer cells in the same regions often failed to show any responses or they showed greatly reduced responses. Many superficial layer retrohippocampal cells fired in strict relation to the EEG θ-rhythm (e.g. Alonso & García-Austt, 1987; Stewart, Quirk, Barry & Fox, 1992; Chrobak & Buzsáki, 1994, 1996).
In this paper, we characterize what we refer to as an in vitro ‘sharp wave’ in the retrohippocampal regions. These evoked population events consist of an early brief population spike which reflects the ∼200 Hz ‘ripple’ firing by single deep layer retrohippocampal cells, followed by a period of 30-100 Hz oscillatory activity which depends on glutamatergic and GABAergic synaptic transmission. Using intracellular and field potential recordings, we identify degrees to which the γ-frequency activity can by synchronous. These range from a very small number of cells (γ present in an intracellular recording, but absent from a nearby field electrode) to the entire region (γ present at near zero phase lag on electrodes separated by > 1 mm). As these events can be reliably produced without compromising synaptic activity, we conclude that this model may be a powerful tool for examining the functional role of sharp wave components (e.g. the 200 Hz and γ-frequency activities) in vitro.
METHODS
The methods were similar to those described previously (Funahashi & Stewart, 1997a, b). They are briefly described here.
Tissue preparation
Slices were prepared from male Sprague-Dawley albino rats (150-250 g). After halothane anaesthesia and decapitation, the brain was removed from the skull an placed in ice-cold artificial cerebrospinal fluid (see below). Horizontal 400 μm slices were cut from larger pieces using a Vibroslice section system. Slices were maintained in a holding chamber at room temperature (20-22°C). Recordings were taken from single slices in an interface chamber maintained at 35°C. Our artificial cerebrospinal fluid contained the following (mM): NaCl, 124; KCl, 5; CaCl2, 2; MgCl2, 1.6; NaHCO3, 26; and glucose 10 (pH held at 7.4 when exposed to 95 % O2-5 % CO2).
Recording techniques
Extracellular recording electrodes were stainless steel (acute conical tips; Roboz Microprobe, Rockville, MD, USA) with tip impedances (at 1 kHz) of 0.9-1.1 MΩ. Signals, referred to the bath, were amplified (Model 1800, A-M Systems, Inc., Everett, WA, USA), filtered (0.1 Hz to 10 kHz, -6 dB octave−1), and digitized (Digidata 1200, Axon Instruments, Foster City, CA, USA) for off-line analysis. Intracellular recording electrodes were pulled from 1 mm diameter filament-containing glass capillary tubes and filled with 3 M potassium acetate (tip resistances 75-100 MΩ). Intracellularly recorded signals were amplified by a high input impedance amplifier with facilities for current injection using a bridge circuit and capacitance compensation (Neurodata IR-283, New York, NY). Extracellular stimulating electrodes were parallel bipolar (150 μm diameter stainless steel, 0.5 mm tip exposure, 0.2 mm tip separation; FHC, Brunswick, ME, USA). Stimulating pulses were put through constant-current isolation units (Isolator-10, Axon Instruments) at our standard rate of 1 per 10 s. Other stimulating rates are indicated in the text where appropriate.
All electrodes were placed under direct visual guidance with the dissecting microscope. Cell locations of unlabelled cells were based on measurements from observable landmarks (e.g. pial surface, angular bundle, alveus). Regional specification of deep layer cells was based on radial extension of superficial layer boundaries down through the deep layers.
Previously, we showed that stellate and pyramidal cell types in the superficial or deep layers of presubiculum and parasubiculum were nearly indistinguishable on the basis of passive properties, firing properties or simple evoked responses (Funahashi & Stewart, 1997a). In fact, superficial layer cells of one morphology more closely resembled (electrophysiologically) other superficial layer cells with different shapes than they resembled deep layer cells with the same shape. Likewise, deep layer cells were an electrophysiologically uniform group. Whether in superficial or deep cell layers, pyramidal cells represented approximately 70 % of Neurobiotin-labelled cells (Funahashi & Stewart, 1997a). As such, we expect that the cells reported herein include stellate and pyramidal cell shapes. No cells in this data set exhibited the electrophysiological properties of interneurons.
Pharmacological and microsurgical manipulations
In some experiments CNQX (6-cyano-7-nitroquinoxaline-2,3-dione; 10 μM) and CPP (3-(2-carboxypiperazin-4-yl)-propyl-1-phosphonic acid; 10 μM) were added to the bathing medium to antagonize, respectively, AMPA (α-amino-3-hydroxy-5-methyl-4-isoxazole propionate) and NMDA receptor-mediated glutamatergic transmission. Picrotoxin (10-100 μM) was used to antagonize GABAA-mediated inhibitory transmission and 2-hydroxy-saclofen (R,S-3-amino-2-(4-chlorophenyl)-2-hydroxy propyl sulphonic acid; 200 μM) was used to antagonize GABAB receptors. CPP, CNQX and saclofen were obtained from Tocris Cookson. All other chemicals were obtained from Sigma.
An acute wedge-shaped microsurgical knife was used to make cuts in slices by plunging it vertically downward with a micromanipulator. Long cuts were made with multiple stabs. Field electrodes were left in place in some instances where cuts were remote. Cuts made very close to field electrodes or, more commonly, between field electrodes, required removal of at least one electrode from the slice to make the cut. Electrodes were withdrawn vertically to allow accurate replacement. Cuts were confirmed to be complete by: (1) plunging the knife through the slice; (2) visually inspecting the space left after the knife was removed; and (3) in some instances, removing the unneeded tissue by suction.
For local application of drugs, pressure ejection of drug-containing solutions were made using a Picospritzer (General Valve, Inc., Fairfield, NJ, USA). Micropipettes were pulled, as described above for intracellular recordings, and broken back for tip diameters of 1-2 μm. Electrodes were filled in the normal way and inserted into sealed holders (WPI, Sarasota, FL, USA) which were fitted with a 2 mm (o.d.) port for connection to the Picospritzer. Drug concentrations used in the pipettes were five to ten times the normal bath concentration and are specified in Results. Individual pressure pulses had an amplitude of 1.38 × 10⁵ Pa (20 p.s.i.) and durations ranging from 5 to 200 ms.
RESULTS
Intracellular and/or field potential recordings were taken from a total of 250 horizontal slices. One or more field potential electrodes were present in every slice. The sample of eighty-eight intracellularly recorded cells included cells from the following locations: layer V medial entorhinal cortex, layer V parasubiculum and layer V presubiculum. Retrohippocampal neurons had resting membrane potentials in the range of -61 to −74 mV, input resistances in the range 30-82 MΩ and overshooting action potentials. Comparisons of the basic membrane properties of presubicular, parasubicular entorhinal neurons from similarly oriented slices have been published (Funahashi & Stewart, 1997a,b).
Basic properties of evoked bursts
Deep layer neurons of the retrohippocampal areas participate in large population events which can be triggered by low frequency repetitive extracellular stimulation (Funahashi & Stewart, 1997b). In our original description, recordings which showed, or failed to show participation by individual retrohippocampal cells were used to explore the connectivity of these regions. One of the most striking results was the finding that these population bursts were limited to the deep layer neurons. Superficial layer cells exhibited no response, or responses which were dramatically reduced compared with the deep layer cell responses. Another finding, confirming results in previous reports (Jones & Heinemann, 1988; Funahashi & Stewart, 1997a), was that the vast majority of individual deep layer neurons did not exhibit intrinsic bursting properties.
In this paper, we examine the deep layer retrohippocampal population events in more detail. Figure 1A illustrates the horizontal slice preparation that we have used and an example of the population burst event triggered by an individual extracellular stimulus pulse from a low frequency (0.1 Hz) train of pulses. Two distinct firing patterns are clear (Fig. 1B). There is an initial brief period of high frequency (∼200 Hz) firing which is followed by a variable duration period of lower frequency firing (30-100 Hz; ‘γ’-frequency). A period of sustained depolarization typically appears between the high and γ-frequency portions of the event. In our undrugged slices, at low stimulation rates, the entire event typically lasts between 200-400 ms.
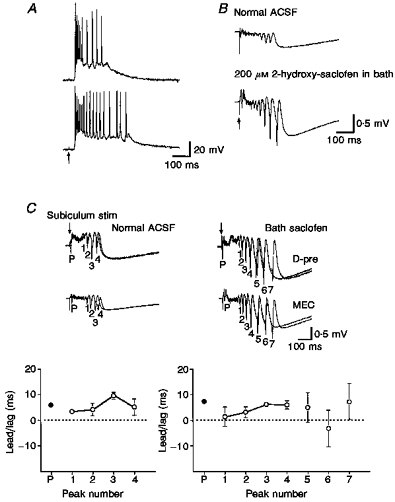
Figure 1. γ-Frequency oscillations follow population bursts in retrohippocampal neurons.
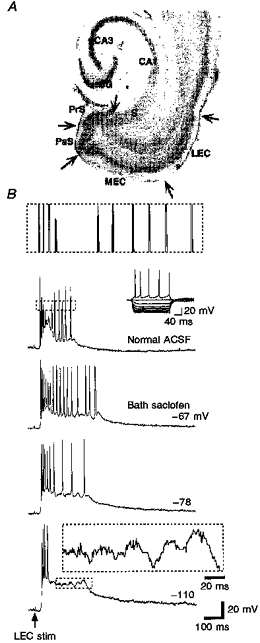
A, horizontal slice preparation used throughout with landmarks labelled. Retrohippocampal neurons include those in the 6-layered presubiculum (PrS), parasubiculum (PaS), medial and lateral entorhinal cortices (MEC and LEC, respectively), and the 3-layered subiculum (S). B, responses evoked in a layer V parasubicular neuron by deep layer lateral entorhinal stimulation (stim) (50 μs, 0.15 mA, 0.1 Hz). Top trace, control response consisting of high frequency firing followed by γ-frequency firing (≈50 Hz). The enlargement shown above helps to display the two firing frequencies. Here and in subsequent figures boxed enlargements correspond to boxed portions of the trace. Individual deep layer neurons fired repetitive single spikes, and never bursts, in response to current injection (Inset: -0.9 to +0.15 nA, 0.15 nA steps, 200 ms). Bath application of 2-hydroxy-saclofen (200 μM) prolonged the γ-frequency activity and the underlying slow potential. Hyperpolarization of the cell revealed subthreshold γ-frequency waves.
In response to current injection, deep layer retrohippocampal neurons fire repetitive single spikes at frequencies that approach 50 Hz (Funahashi & Stewart, 1997a). At high levels of depolarizing current injection, the firing of deep layer stellate and pyramidal cells adapts after only a few pulses. The firing seen during the prolonged depolarization of the evoked bursts resembles the firing induced by current injection, but at least a portion of, the γ-frequency activity in the evoked event is synaptically mediated. Figure 1 shows that with progressive hyperpolarization of the recorded neuron, a γ-frequency membrane potential oscillation was revealed when action potentials were blocked by hyperpolarizing current injection. In most recordings, it was not possible to pass enough current with the high impedance electrodes to block the spiking. It was never possible to block the appearance of the slow depolarization by injection of hyperpolarizing current.
The high frequency portion of the response was contained within a single large population spike in extracellular recordings. Every intracellularly recorded neuron and every field potential recording that exhibited γ-frequency activity also showed the population spike. We refer to this population spike as the ‘primary’ population spike throughout the text. The duration of the γ-frequency portion of the event was found to vary spontaneously and without corresponding changes in the amplitude or duration of the primary population spike in a small number of slices (n = 3; e.g. Fig. 2). In slices within which the γ durations do not vary, it was possible to directly manipulate the γ duration pharmacologically. Bath application of the GABAB receptor antagonist 2-hydroxy-saclofen (200 μM), as an example, prolonged the period of γ activity (Fig. 1B). This and other pharmacological manipulations are discussed in more detail below.
Figure 2. Variations in the duration of the period of γ-frequency activity.
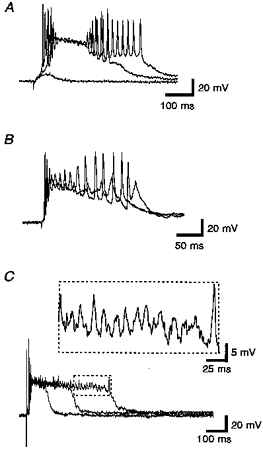
A, responses by a layer V presubicular neuron to subicular stimulation (50 μs, 0.43 mA, 0.5 Hz). The period of γ-frequency firing was variable. Note that the amplitude of the underlying slow depolarization was less during the period of firing than the amplitude during the time between the periods of high frequency and γ-frequency firing. Also note that the increase in duration was a jump of nearly 100 ms. The duration of the γ activity was not dependent upon either the high frequency firing or the amplitude of the slow depolarization. B, when the amplitude of the slow depolarization was high enough, γ-frequency action potentials were blocked. Whereas the amplitude of the slow depolarization determines the amount of voltage dependent block in the cell, it does not correlate with the duration of the γ activity. Layer V medial entorhinal neuron, deep pre/parasubicular stimulation (50 μs, 0.25 mA, 0.1 Hz) C, in this layer V entorhinal neuron, the amplitude of the slow depolarization remained high. The γ-frequency activity was entirely subthreshold (a portion of the longest sweep is enlarged above). The duration of the period of γ-frequency activity varied between the three periods shown. Stimuli (layer V entorhinal cortex): 50 μs, 0.19 mA, 0.1 Hz.
In three cells in which development of γ-frequency activity was examined by recording responses to every stimulus applied to previously unstimulated slices, γ activity was the last feature of the burst event to develop, appearing between the 40th and 75th stimulus pulses to the slices (Fig. 3). The first appearance of the burst event is typically seen between the 10th and 60th stimulus pulses (Funahashi & Stewart, 1997b). The amplitude of the underlying slow depolarization in the presence of γ activity was less than that observed when γ activity had not yet developed.
Figure 3. Development of γ-frequency activity.
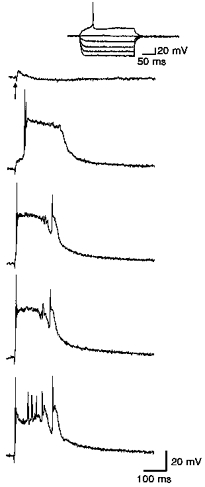
Of the components of the response, the early high frequency firing, the underlying slow depolarization and the γ-frequency activity, the γ activity was the most clearly separate. In this recording from a layer V medial entorhinal neuron, the responses to particular stimuli (from top to bottom: stimulus pulses 1, 21, 33, 40 and 45) from the low frequency train used to induce the population bursts are shown (50 μs, 0.12 mA, 0.05 Hz). Note the earliest response is a simple EPSP. The first response to include an action potential by the recorded cell is an event which consists of the brief period of high frequency firing and a large slow depolarizing potential. The responses to successive stimuli do not change in total duration, but in the complexity of the event. γ-Frequency firing appears by the 45th stimulus (bottom trace). Here and in subsequent figures arrows indicate when stimuli were applied.
One possible explanation for the combination of γ-frequency firing and a smaller sustained depolarization is that the cell's membrane potential was initially too depolarized to permit voltage-dependent spiking. As described above, the firing of deep layer neurons to sustained depolarizing current injection rapidly adapts (Funahashi & Stewart, 1997a). In that report, the maximal firing frequency before spike failure was approximately 50 Hz (e.g. Fig. 5, Funahashi & Stewart, 1997a). If adaptation contributes to the lack of firing early in the development of the full population event, the appearance of γ-frequency firing late in the development indicates either a decreased level of excitation of the cells or an increased level of inhibition. Data taken during picrotoxin exposure suggest that the appearance of γ-frequency firing reflects an increase in the level of inhibitory input to the deep layer cells (see below).
Figure 5. ‘Cellular synchrony’ and elimination of γ activity with low dose CNQX.
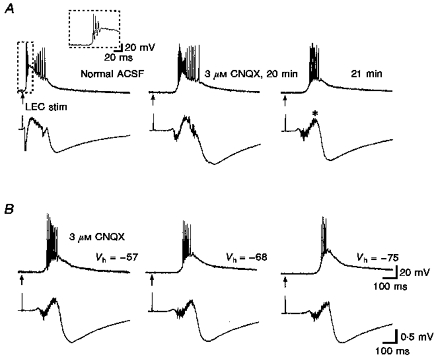
A, responses by a layer V medial entorhinal neuron to lateral entorhinal stimulation (50 μs, 0.13 mA, 0.1 Hz). Field potential recordings are shown below intracellular recordings. Left, normal burst response with γ-frequency firing (≈65 Hz) at the end of the response. Inset shows detail of high frequency firing (≈180 Hz) at the beginning of the response. Whereas γ-frequency activity was clear in the intracellular response, synchronous oscillations were not present in the field recording (contrast this with the recording pair shown in Fig. 6). Bath application of 3 μM CNQX was used to partially antagonize AMPA receptor-mediated synaptic transmission. At 20 min, γ-frequency activity was still present and the initial firing was of a lower frequency (≈150 Hz). These changes in the early portion are reflected in the smaller, but broader negative field recording peak. At 21 min, the γ-frequency activity was eliminated and the total duration of the response was less. Note the virtual absence of field activity after the asterisk in the last trace in A. B, with the high frequency activity spread out by the CNQX, the membrane potential of the cell was varied to show higher firing rates during depolarizing current injection and subthreshold oscillations during hyperpolarizing current injection.
One point deserves special emphasis in our opinion. In the data set for this paper and in two previous data sets (e.g. Fig. 6 of Funahashi & Stewart, 1997a; Figs 1 and 7 of Funahashi & Stewart, 1997b), the firing by deep layer neurons of presubiculum, parasubiculum, medial entorhinal cortex and lateral entorhinal cortex was always a single spike on each γ cycle. In no case where it was attempted (n = 16) was it possible to increase the number of spikes per γ cycle with depolarizing current injection. The only change in firing pattern induced by increased depolarization was spike failure due to adaptation. Spike failure could also be produced by hyperpolarizing current injection (Fig. 1). It was never possible to produce γ-frequency membrane potential oscillations by injection depolarizing or hyperpolarizing current, i.e. we saw no evidence that the γ activity was an intrinsic property of the cells.
Figure 6. Effects of CNQX on synchronous activity.
Recording pair in which synchronous γ-frequency activity was apparent in the field recording. Bath application of 3 μM CNQX preferentially eliminated the γ activity at the end of the response. The initial field potential peak was broadened as the firing frequency during the early part of the response decreased. Layer V lateral entorhinal stimulation (50 μs, 0.1 mA, 0.1 Hz).
Figure 7. ‘Long-range synchrony’ of γ activity and variations due to stimulation site.
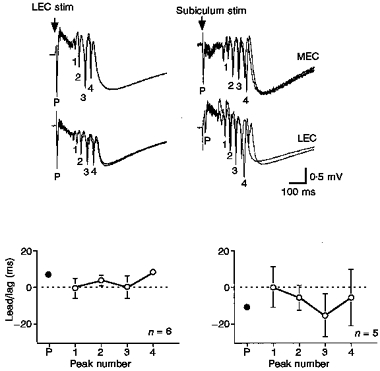
Long-range synchrony depended on the triggering afferent. Simultaneous field potential recordings taken from layer V of medial entorhinal cortex (upper traces) and lateral entorhinal cortex (lower traces). Stimuli were applied to either the layer V lateral entorhinal cortex (50 μs, 0.08 mA, 0.1 Hz; left column) or the cell layer of subiculum (50 μs, 0.08 mA, 0.1 Hz; right column). Individual γ cycles are numbered and the lead or lag in milliseconds is plotted below each pair. Positive values mean that the medial entorhinal recording leads the lateral entorhinal recording. Note that the lateral entorhinal stimulation site produces the same number of cycles, but the lead/lag is less and the variation in the lead/lag is less than that seen in response to subicular stimuli. In this example, for lateral entorhinal stimulation, medial entorhinal cells lag lateral entorhinal cells for the initial population spike, but medial entorhinal cortex leads for the γ cycles. The opposite configuration was obtained for subicular stimulation, indicating that any conduction of γ activity does not follow the conduction pathway for the initial propagating event.
The deep layer events can be triggered by stimulation of any of the functional afferents (Funahashi & Stewart, 1997b). The event itself showed little change dependent upon the site of activation. Later, we show that the degree of synchrony did depend upon the triggering afferent, but the overall appearance of the event did not. Further, it was not possible to grade the response by stimulating a particular afferent with different intensities (n = 115 slices) or, as shown in Fig. 4, by varying the position of stimulation within an afferent system (n = 15 slices). Figure 4 shows that superficial or deep layer stimuli delivered at different locations lateral to the recording electrode all elicited similar responses until the stimulator failed to trigger anything at all.
Figure 4. Response variations due to different stimulation locations.
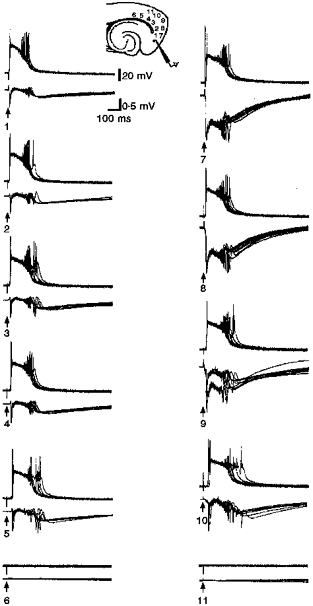
Responses by a layer V medial entorhinal neuron and a closely positioned field electrode evoked by different deep and superficial layer stimulation sites. Here and in subsequent figures where paired sets of traces occur the upper and lower traces are intracellular and field recordings, respectively. Left column: stimulation location is moved progressively ‘lateral’ in the deep cell layers from within medial entorhinal cortex, through lateral entorhinal cortex, and perirhinal cortex (locations 1-6; 50 μs, 0.23 mA, 0.1 Hz). Note that the evoked response is similar at each stimulation site until it fails completely (location 6). In the right column, responses to superficial stimulation sites (locations 7-11; 50 μs, 0.29 mA, 0.1 Hz) are shown again from medial (top) to lateral (bottom). The field potential responses at positions 7 and 8 are affected by the stimulus pulse. The orientation of the stimulator poles (cathode ‘deep’ to the anode) to the field electrode (all three nearly on a line) was such that there was a significant stimulus artifact.
Degrees of synchrony
Based upon the intracellular and/or extracellular recordings, we have distinguished three degrees of synchrony during the γ-frequency activity of the population event. Our first category is ‘local’ or ‘cellular’ synchrony, which is characterized by γ-frequency firing in an intracellular recording without significant corresponding activity in nearby field potential recordings (e.g. Fig. 5). The second category can be ‘regional’ synchrony, which is characterized by clear γ-frequency activity intracellularly and extracellularly in one region (e.g. Fig. 6) and weak or absent γ activity in another region. The difference in the field potential can be seen by comparing recordings of Fig. 5 with those of Fig. 6. Finally, we identified the final category as ‘long range’ or ‘cross-regional’ synchrony, which is characterized by clear γ activity on each of two separated field potential electrodes where the electrodes are in different brain regions (e.g. Fig. 7).
In addition to illustrating two forms of synchrony, Figs 5 and 6 show the effects of a low concentration (3 μM) of the AMPA receptor antagonist CNQX applied to the bath. Before discussing the actions of CNQX, we want to point out that these two cells are examples of two categories of synchrony (before drug application), which were defined above. The cell shown in Fig. 5 illustrates the high and γ-frequency components, as described previously. A simultaneous field potential recording ∼200 μm away from the intracellular electrode showed an early population spike (the ‘primary’ spike) coincident with the brief period of high frequency firing, followed by a single small population response whose peak was coincident with the penultimate spike in the γ-frequency firing period. We contrast this pattern of intracellular/extracellular behaviour with that shown for a similarly recorded cell in Fig. 6. Notice, in Fig. 6, that the field response exhibited much greater synchrony during the γ-activity as evidenced by clear population spikes, each coincident with an intracellular spike.
As shown in Fig. 5, the effect of the low concentration of CNQX was to diminish the amplitude of the slow potential underlying the entire response and caused a significant decrease in the cell's firing during the primary spike with a minimal effect on the γ-frequency activity (Fig. 5A, middle). This resulted in a broadening of the primary population spike without a significant change in the overall duration of the field response (5/5 cells). Note too, the shift in the latency of the response. Figure 5A (right) shows a recording just after the γ portion of the response has dropped out. Notice in the field potential recording that the primary population spike is broader still, but now there is little or no activity after the peak of the positivity (indicated by asterisk). The firing of cells under these pharmacological conditions was examined at different holding potentials (Fig. 5B). The number of action potentials associated with the EPSP varied with the holding potential, and at the most negative potentials tested, wavelets could be seen atop the EPSP (Fig. 5B, right). This suggests that the high frequency firing which occurs during the primary population spike reflects local excitatory, and possibly inhibitory, synaptic inputs.
The effect of the low concentration of CNQX was less on the cell from the preparation which exhibited greater synchrony (Fig. 6). The partial AMPA receptor blockade was sufficient to suppress the γ-frequency activity, but it had less of an overall effect on the underlying slow potential. The duration of the population EPSP was reduced, but its amplitude was minimally affected. The effect on firing during the primary population spike was the same as that for recordings showing only local synchrony. The number of action potentials was increased and their interspike intervals were also increased. This is reflected in the increases in amplitude and duration of the population response recorded with the field electrode.
Figure 7 presents an example of ‘cross-regional’ synchrony. The region within which the recordings for this paper were taken includes the presubiculum, parasubiculum and entorhinal cortex. The subiculum lies at one end of the network adjacent to the presubiculum. At the other end is the lateral entorhinal cortex. Stimulating electrodes were placed in the subiculum and lateral entorhinal cortex to explore differences which might be due to activation of the network from one side or the other. Stimulation at either end elicited events which included three to five γ cycles (n = 10 slices). In Fig. 7 the latency difference between corresponding components (the primary population spike, P, or individual γ cycles) on each of the two recording electrodes is expressed as a lead or lag (lead/lag) in milliseconds. From the graphical display of these values, several points are notable (Fig. 7, bottom). First, regardless of the stimulus location, the timing of the primary population spike had the least variability (the error bars are covered by the plotted point. That is to say, that the time between the peak of the primary spike on one electrode and the primary peak on the other electrode was nearly constant. The lead/lag of each γ cycle was in the same direction as the lead/lag for the primary population spike, but the value of the latency difference for individual γ cycles was typically less than that for the primary spike. In comparing the responses evoked from the different stimulus locations, the lead/lag values for every γ cycle were less when layer V lateral entorhinal cortex was stimulated than when subiculum was stimulated. In addition to being closer to zero lag, the variability in the latency difference across different events was uniformly less when lateral entorhinal cortex was stimulated. Interestingly, in the example used for the illustration, the amplitudes of the γ waves tended to be larger in responses evoked by subicular stimuli.
In five slices we sought to disrupt cross-regional synchrony between deep layer neurons by focal application of glutamate antagonists (CPP, 100 μM; CNQX, 100 μM) to the deep cell layers between a pair of field potential electrodes. In each case, the electrode configuration consisted of a pair of field potential electrodes which were both within layer V and separated by 0.5-1 mm, and a stimulating electrode which was also in the deep layers and located to the outside of one or the other of the recording electrodes. The ejection pipette was positioned to apply drugs to the tissue between the two recording electrodes. The drug pipette was a minimum of 200 μm from the nearest recording electrode. Based on the volumes calculated from droplet sizes after injections made in air and the different responses by equidistant recording electrodes, we are confident that the ejected drugs did not reach either recording electrode in concentrations sufficient to act in the direct vicinity of either electrode. Deep layer application of CNQX-CPP eliminated the late activity from the distal recording electrode in every slice tested (Fig. 8). Only the primary population spike remained (similar to the events shown in Fig. 5). We detected no significant changes in its amplitude, duration or the amount of high frequency activity associated with it. In all but one case, there was an increase in the latency to the peak of the primary population spike, but the latency to the onset of the EPSP was unchanged. When multiple ejections were made, forming a radially oriented stripe between layers V and II, everything but a small EPSP was eliminated at the distal recording site (Fig. 8).
Figure 8. γ Activity depends upon deep layer connections.
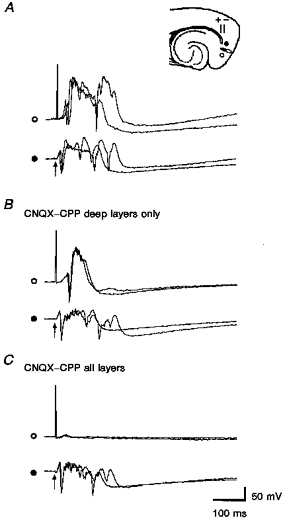
A, simultaneously recorded evoked responses to lateral entorhinal stimulation (50 μs, 0.2 mA, 1 Hz). γ-Frequency activity was more pronounced on the proximal (•) recording electrode. B, a mixture of CNQX (100 μM) and CPP (100 μM) was applied to layer V between two field recording electrodes. This abolished the late portion of the evoked response at the distal recording site. The latency of the initial spike was delayed by < 5 ms. The onset of the field EPSP was not delayed. C, application to the superficial layers as well was required to block the initial evoked spike, leaving a sub-threshold EPSP.
GABA receptor involvement
γ-Frequency oscillations have been analysed in hippocampal slices and shown to depend upon inhibitory synaptic potentials (Whittington et al. 1995; Traub et al. 1996). To facilitate comparison of retrohippocampal γ oscillations with hippocampal γ oscillations, we tested the effects of GABA receptor antagonists and a barbiturate on the γ tails of the evoked population events.
As described briefly earlier, the GABAB receptor antagonist 2-hydroxy-saclofen increased the duration of the period of γ activity (Fig. 9A and B). To assess its affect on the synchrony of γ activity, we used subicular stimulation (as this produced less synchrony in tests comparing it with lateral entorhinal stimulation) to elicit events before and after saclofen addition to the bathing medium (0.2 mM). While saclofen increased the number and amplitude of γ cycles, the additional cycles tended to show greater variability and different lead/lag relations than the original γ cycles (Fig. 9C). Interestingly, the original γ cycles showed little, if any, effect of the saclofen. On the basis of the intracellular data, these added late γ cycles appeared identical to the early cycles, but their larger size in field potential recordings suggested a difference in the degree of local synchrony that may affect the ability of the network to synchronize on a larger scale.
Figure 9. Prolongation of γ-frequency activity by GABAB receptor blockade.
Intracellular (A, layer V parasubiculum) and field potential responses (B) before and after bath application of 200 μM saclofen. Deep lateral entorhinal stimulation (in A): 50 μs, 0.15 mA, 0.1 Hz; subicular stimulation (in B): 50 μs, 0.08 mA, 0.1 Hz. The period of γ-frequency activity appears prolonged. C, effects of saclofen on synchrony between two recording locations. Note that the four γ cycles (pre-saclofen) all show a positive lead/lag value with small variations (layer V presubiculum (D-pre) leads layer V medial entorhinal cortex). The first four peaks after exposure saclofen exhibit similar lead/lag values, but the additional peaks exhibit considerable variation and even reverse their relative positions. Whereas synchrony appears to be enhanced because the spikes are larger, the synchronization between recording locations is more variable. These late events may be more similar to afterdischarges (e.g. Fig 11). All stimuli for part C were applied to subiculum (50 μs, 0.08 mA, 0.1 Hz).
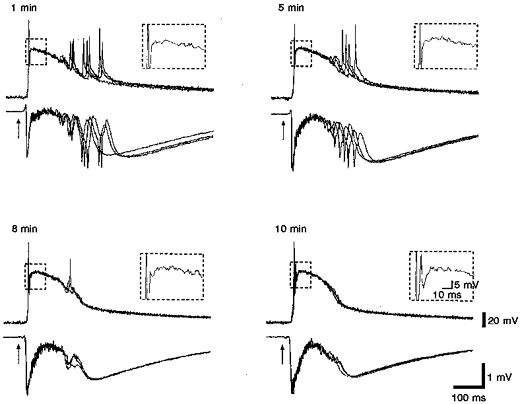
Picrotoxin, applied focally or in the bath, suppressed γ-frequency firing in all cells. Focal applications were within about 200 μm of the recording electrode. Figure 10 shows a population event and the effect of 2-hydroxy-saclofen which was to enhance the γ activity. Picrotoxin eliminated the γ-frequency firing by the cell, but this effect may have been entirely the result of an enhanced depolarization block (compare the membrane potential level pre- and post-picrotoxin in Fig. 10). The apparent absence of γ-frequency membrane potential oscillations during the sustained depolarization may have resulted from either a decreased EPSP driving force or the local blockade of GABAA receptor mediated IPSPs. A small subthreshold membrane potential oscillation was apparent (enlargement in Fig. 10). Attempts to enhance the oscillation by hyperpolarizing current injection failed to show a voltage dependence expected for a phasic excitatory component (data not shown). It is, however, likely that this reflects a failure of our high impedance electrodes to pass enough current. We were unable to overcome the depolarization block by current injection.
Figure 10. Comparison of GABAA and GABAB receptor blockade.
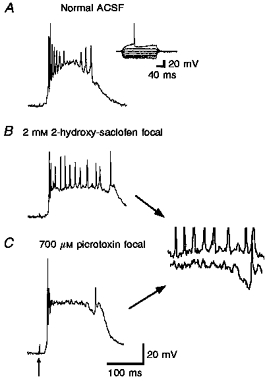
Responses evoked in a layer V parasubicular neuron during focal application of saclofen (2 mM, 30 p.s.i., 90 ms) or focal application of picrotoxin (700 μM, 30 p.s.i., 90 ms). Stimuli: 50 μs, 0.2 mA, 0.1 Hz. A, evoked intracellular response in normal ACSF. Inset shows response to direct current injection. B, enhancement of γ-frequency activity by focal saclofen application. C, focal picrotoxin eliminates the γ-frequency firing. Small γ-frequency membrane potential oscillations are apparent in the enlargements to the right.
Repeated focal applications of picrotoxin elicited afterdischarges (Fig. 11). In intracellular recordings, afterdischarges were distinct from γ-frequency firing. In field potential recordings, the distinction was less clear. They were larger than γ-frequency spikes and always occurred at a time that was after the time when γ oscillations occurred. Afterdischarges were seen in a minority of recordings taken in control media. Their prevalence was increased with prolonged or high frequency stimulation, or by the addition of convulsant drugs applied focally or in the bath.
Figure 11. γ Oscillations are not afterdischarges.
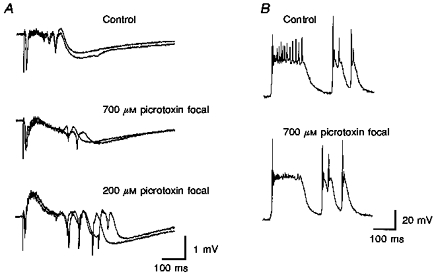
A, control field potential recording shows several γ cycles. Field potential responses evoked in layer V of medial entorhinal cortex by deep layer lateral entorhinal stimulation (50 μs, 0.2 mA, 0.1 Hz) during focal picrotoxin application. First application (700 μM, 30 p.s.i., 90 ms) eliminated the γ-frequency activity. Second application (200 μM) enhanced the afterdischarges. B, spontaneous intracellular recordings (layer V parasubicular neuron) show γ activity during the initial event which is followed by two afterdischarges, prior to picrotoxin application. Focal picrotoxin application (700 μM, 30 p.s.i., 90 ms) eliminates the γ-frequency firing.
In three cells, the effects of bath-applied thiopental (20 μM) were examined. The γ frequency was lower in all cases, slowing by 27 ± 6 % (P < 0.01, Student's t test). This is comparable with the effect reported for γ oscillations in hippocampus (Traub et al. 1996).
NMDA receptor involvement
γ Activity was favoured by stimulation rates of 1 Hz as compared with 0.1 Hz. As shown in Fig. 12, the total duration of the response at each stimulation rate was similar for the two stimulation rates, but the higher rate caused γ-frequency activity in the field recordings. When CNQX was applied at one of the electrode locations (proximal to the stimulator in the example shown in Fig. 12), the field potential showed only a long slow positive potential that lasted for the duration of the response elicited without drug present. Based on the recording electrode location (deep in layer V) and the presence of negative going spikes prior to drug application, the positivity could reflect a local inhibitory response (i.e. near the electrode) or a distal excitatory (non-AMPA) response. Based on the results of the previous section, we favoured the latter possibility.
Figure 12. Effects of stimulation rate on γ activity.
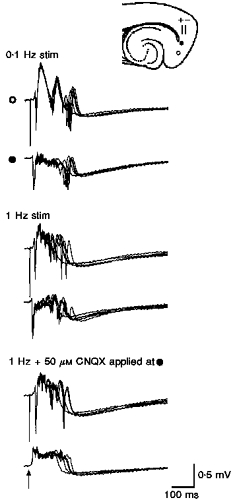
Comparison of γ activity evoked during stimulation at rates of 0.1 Hz (top) and 1 Hz (middle). Deep lateral entorhinal stimulation (50 μs, 0.12 mA). γ Activity is more pronounced at the higher stimulation rate. Focal application of CNQX to the proximal electrode abolishes γ oscillations there, but leaves a slow potential with a duration equivalent to the pre-drug duration. Note γ oscillations remain at the distal (○) recording site.
The NMDA receptor antagonist CPP was applied to test the involvement of NMDA receptor activity in the production of the deep layer events. Bath application of CPP (10 μM) reduced the field response first from γ activity to the lower-frequency activity found during very low stimulation rates, and then to a much shorter duration response overall (Fig. 13).
Figure 13. NMDA receptor antagonists reduce the duration of the evoked response.
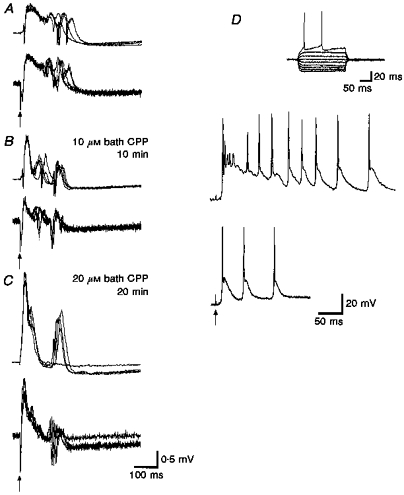
Upper traces are from layer V parasubiculum; lower traces are from layer V medial entorhinal cortex (for parts A, B and C). Lateral entorhinal stimulation (50 μs, 0.2 mA, 0.1 Hz). A, simultaneous evoked responses in normal ACSF. B, ten minutes after bath application of 10 μM CPP to antagonize NMDA receptor-mediated responses. C, responses taken 20 min after an additional 10 μM (total 20 μM) CPP in the bath. D, effects of 10 μM CPP on saclofen-enhanced γ activity recorded from a layer V parasubicular neuron. Lateral entorhinal stimulation (50 μs, 0.15 mA, 0.1 Hz). Note the slow depolarizing potential is reduced in duration in the field and intracellular responses. One or more spikes occur after the primary evoked response.
As a different approach, responses were evoked as the concentration of magnesium in the artificial cerebrospinal fluid (ACSF) was varied from zero to 5 mM (Traub, Jefferys & Whittington, 1994). Figure 14 shows that the results fell into one of three response types. At concentrations below our standard 1.6 mM, the total duration of activity following individual stimuli was markedly prolonged. The pattern of activity was epileptiform. At 0 mM, spiking lasted for seconds after each stimulus. At concentrations of 1.6 or 2 mM, response durations were similar to durations seen in all other slices. In addition, the pattern of activity resembled the pattern described throughout, i.e. an initial population spike followed by a series of several γ cycles. At 5 mM, synaptic activity was compromised and responses were abolished.
Figure 14. Effects of extracellular magnesium concentration on evoked responses.
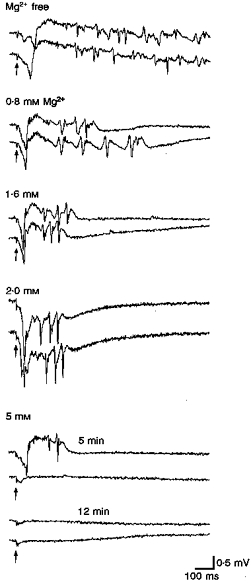
In magnesium-free medium, evoked responses consisted of very prolonged periods of spiking with many spontaneous events. Recordings taken from layer V presubiculum; stimuli to subiculum (50 μs, 0.32 mA, 0.5 Hz). At higher concentrations of magnesium, the period during which spiking was seen became progressively shorter. At 1.6 and 2.0 mM magnesium, the spikes which follow the initial population spike numbered 3-4 and were not followed by apparent afterdischarges. At the highest concentration tested (5 mM), synaptic activity was significantly depressed.
DISCUSSION
γ-Frequency oscillations have been proposed as a solution to the problem of associating afferent inputs from widely separated regions (reviewed in Gray, 1994; Singer & Gray, 1995). In vivo, brief periods of γ activity have been described as a ‘tail’ of activity following population events called sharp waves (Freund & Buzsáki, 1996; Traub et al. 1996). We describe in this paper, an in vitro model of the sharp wave in retrohippocampal areas. Our model consists of a propagating population spike triggered from any of a variety of afferent systems to the deep layer cells of the entorhinal cortex, presubiculum or parasubiculum. Responses by individual medial entorhinal, parasubicular or presubicular cells are not distinguished. Associated with the primary population spike is a large slow depolarizing potential which lasts about 300 ms. This NMDA receptor-dependent depolarizing potential supports a period of γ-frequency firing by individual deep layer neurons. The level of depolarization is balanced and shaped by GABAA receptor-dependent synaptic inputs. These inhibitory inputs also appear critical for synchronizing the activity of deep layer cells, although at least some role may be played by excitatory interconnections among deep layer cells.
Our model sharp wave has a cellular distribution identical to that reported for retrohippocampal sharp waves in vitro (Chrobak & Buzsáki, 1994; 1996). Whereas the primary population spike is recorded in different regions as expected from conduction delays, γ cycles can exhibit latency differences of zero milliseconds. The model's power lies in two features. First, the in vitro sharp wave is stable and produced by repetitive single pulses. This permits analysis of the event without stimulus artifacts during trains of high frequency stimuli, and precise timing relations between the triggering spike and sharp-wave components can be measured without ambiguity. Second, the model is drug free. This permits the analysis of all synaptic components of the event and how these components interact to generate the event.
Mechanisms for production of γ-frequency activity
The γ-frequency firing and membrane potential oscillations which followed the initial high-frequency burst in retrohippocampal recordings exhibited the same dependence on GABAA receptor-mediated events as γ oscillations produced in vitro and in computer simulations of hippocampal neuron networks (Whittington et al. 1995; Traub et al. 1996). The γ tail was enhanced by bath (200 μM) or focal application of 2-hydroxy-saclofen, a GABAB receptor antagonist. Bath (100 μM) or focal application of picrotoxin, a GABAA receptor antagonist, eliminated the γ oscillations and, at higher concentrations, enhanced the occurrence and size of afterdischarges. Bath application of thiopental (20 μM) decreased the frequency of the γ activity similar to the effect seen in hippocampus (Traub et al. 1996).
The duration of the period of γ-frequency activity following the primary population spike was the same as the duration of an NMDA receptor-dependent slow depolarization. Bath application of NMDA receptor antagonists (10 μM CPP) or low concentrations of AMPA receptor antagonists (3 μM CNQX) eliminated both the γ-frequency oscillations and the underlying slow depolarization in retrohippocampal neurons. By blocking NMDA receptors, the excitatory drive to the entire network of deep layer neurons is eliminated. This eliminates the rest of the EPSPs and IPSPs (i.e. those after the synaptic events triggered by the afferent volley). While we suggest that the NMDA receptor-mediated slow depolarization forms the foundation for γ-frequency oscillations and firing in retrohippocampal deep layer neurons, enhancing the NMDA receptor component does not simply enhance the γ activity. Too much NMDA receptor activation (e.g. the low magnesium data; Traub et al. 1994) causes the system to run away. We suggest that the NMDA receptors must be synaptically activated to preserve a delicate balance of excitation and inhibition which is critical for the network to oscillate.
Given the pronounced adaptation by the deep layer cells (Funahashi & Stewart, 1997a), we suggest that the γ firing is completely controlled by the inhibitory input to the cells. In a study of inhibitory synaptic potentials in retrohippocampal neurons, fast IPSP durations were found to decrease from about 100 ms to about 50 ms as the stimulation rate was increased from 0.1 to 5 Hz (Funahashi & Stewart, 1998). It is unknown what the durations would be at 40 Hz stimulation rates, but clearly, the fast IPSP appears capable of phasic modulation of deep layer retrohippocampal cells at γ frequencies. As a minimum, GABA activity is critical for keeping the cells from depolarizing to the point where their firing shows adaptation. Whether or not it is essential for the GABAergic inputs to be rhythmic at the γ frequency, in this model system, has not been conclusively determined.
What role, if any is served by recurrent excitatory connections among deep layer retrohippocampal neurons? Given the high level of depolarization to start with, we suggest that synchronous EPSPs will contribute very little as a firing determinant. Much more significant will be IPSPs which will trigger firing on the ‘break’ of the IPSP. Interneurons might be driven by the synchronous AMPA receptor-mediated EPSPs or they may have a similar NMDA receptor-dependent sustained depolarization which gets modulated by inhibitory inputs from other interneurons. Only direct interneuron recordings will tell.
Functional significance of synchrony
γ-Frequency oscillations were synchronous over varying distances. We defined three degrees of synchrony. ‘Cellular’ synchrony was defined as γ-frequency activity apparent in intracellular records, but absent from a nearby field recording. As an incidental point, this condition suggests that ephaptic interactions among neurons (Snow & Dudek, 1984; Yim, Krnjevi´c & Dalkara, 1986) cannot be the origin of the γ-frequency firing. ‘Regional’ synchrony was defined as field potential oscillations which appeared to be independent across regions separated by > 400 μm. ‘Long-range’ synchrony was apparent as a shift toward zero phase lag between γ oscillations recorded from widely separated (> 1 mm) retrohippocampal regions. Because of the cortical folding within the slice (Fig. 1), straight-line distances between electrodes in widely separated regions were never more than 3 mm (typically 1-2 mm).
The degree of synchrony varied with the afferent system used to initiate the population event. Stimulation of the deep cell layers of lateral entorhinal cortex produced population spikes which propagated through the retrohippocampal regions leaving behind γ-frequency oscillations with the least phase separation. Based on field potential records, the smaller phase separation did not correlate with the degree of regional synchrony (indicated by the amplitude of γ waves). Two findings make us wonder about the functional significance of synchrony. First, we were impressed by the prominence of cell firing during the γ-activity portion of the evoked events. Nearly every deep layer retrohippocampal neuron exhibited firing during this period, and those that did not, appeared less responsive in general, as if they were cells recorded at the ‘fringe’ of the network. Second, this activity in individual cells did not depend upon synchrony in the population. Our smallest scale synchrony was clear γ-frequency firing in an intracellular recording with no evidence of synchrony in field potential recordings. Certainly, one possible interpretation of these findings is that the γ-frequency firing is the critical feature of the population event.
As mentioned earlier, it has been suggested that the ‘binding’ of activity in spatially separate afferents by a postsynaptic neuron may depend on large-scale neuronal synchrony such as that seen during γ-frequency oscillations (Singer & Gray, 1995). The binding occurs when neurons encoding aspects of the same object are synchronized. γ-Frequency oscillations have been found to be synchronous over wide areas and have been suggested to be the synchronizing force required for the binding. Put another way, one theory for the function of γ oscillations is that they serve to synchronize the cells which each code a different aspect of a particular object.
How does an emphasis on γ-related firing impact solutions to the binding problem? It permits binding different inputs at a set of postsynaptic cells without requiring the inputs themselves to be synchronized. The ability of a postsynaptic cell to associate particular inputs may simply be dependent on the coincidence of each input with γ-related firing in the postsynaptic cell. In models of synaptic plasticity, synchronous activity in presynaptic and postsynaptic neurons is a cornerstone (Hebb, 1949; Bliss & Collingridge, 1993; Nicoll & Malenka, 1995). Pairing EPSPs with γ-related action potentials (or the NMDA mediated postsynaptic event) might serve to strengthen even the smallest number of synapses. Given the 30-100 Hz frequency of the γ oscillations, only modest firing rates by input neurons would produce multiple pairings (depending on the duration of the γ tail), and burst discharges by afferent neurons would guarantee pairings. If the demand on the postsynaptic cell is ‘relaxed’ further and the salient postsynaptic component is simply an NMDA receptor-mediated event (which just happens to facilitate a period of γ-frequency firing), the timing restrictions for coincidence of presynaptic and postsynaptic activity are further reduced.
Different inputs could be associated, such that pairs or groups of such inputs would become capable of firing a postsynaptic cell, by each input getting strengthened during the γ tail. In this model, there is no requirement for the different inputs to be coincident with each other to be ‘bound’. We suggest that the binding occurs through enhancement of particular cellular inputs to a set of postsynaptic cells. Activity in a critical subset of the bound afferents produces firing in the postsynaptic cells. In the hippocampal formation, neurons which code ‘place’ and ‘head-direction’ have spike trains which are hundreds of milliseconds long. The firing of place cells and head direction cells are believed to define the environment within which the animal is located (Muller, Stead & Pach, 1996). A group of place and head-direction cells active in one part of the room and a group of cells active in another part of the room can each signal the same environment by producing exactly the same result in a set of postsynaptic cells.
We suggest that the degree of γ synchrony is what determines the size and specific members of the set of postsynaptic cells which will be similarly responsive (see Roelfsema, Engel, König & Singer, 1997). The final set of postsynaptic cells is perhaps that group of cells which exhibits γ activity and gets the appropriate afferent inputs. Excluded from this set would be: (a) cells exhibiting γ activity, but not receiving place and head-direction inputs; (b) cells receiving place and head-direction inputs, but not exhibiting γ activity; and (c) completely uninvolved cells.
We note that another type of potentiation related to γ oscillations has been recently described (Whittington et al. 1997). These authors describe potentiation of the excitatory recurrent connections among the principal cells which occurs during periods of γ activity and results in a switch to β-frequency activity in the population. We have not explored such changes in our retrohippocampal preparation. Our model, however, supposes that the connections among the deep layer retrohippocampal cells do not change significantly. Rather, plastic changes, we suggest, are restricted to the afferent systems.
We would summarize the generation of γ-frequency activity in the retrohippocampal region of the rat as follows: (1) a strong afferent volley to the deep layer cells of a retrohippocampal area causes an initial ‘burst’ of high frequency firing in the deep layer cells; (2) this is propagated to other deep layer retrohippocampal cells, perhaps through a relay in the superficial cell layers (Lorente de Nó, 1933; Köhler, 1986; Jones, 1990; Funahashi & Stewart, 1997b); (3) an NMDA receptor-mediated depolarization is triggered in the deep layer cells (Jones, 1987; Jones & Lambert, 1990; we propose that this event is triggered in superficial to deep cell connections); (4) firing by local deep layer interneurons keeps the deep layer principal cells from depolarizing out of firing range and is the most likely basis for synchronization across cells.
We suggest that the γ-frequency firing is the critical element for associating afferent inputs. The coincidence of even weak inputs with deep layer cell firing permits synaptic enhancement by Hebbian rules. Inputs that need to be associated only need to occur coincident with a period of firing (or NMDA receptor activation) in the target cell. That is, the inputs can be associated if each gets enhanced, and since the target cell is already active, the inputs do not need to be coincident themselves. If the sharp wave is the neural source for this critical period of γ activity, the rarity of these events suggests that inputs which are going to be associated are likely to be co-active. The firing rates of place cells (Muller, Kubie & Ranck, 1987; Quirk, Muller, Kubie & Ranck, 1992; Taube, 1995) and head direction cells (Ranck, 1985; Taube, Muller & Ranck, 1990), which are the likely inputs to be associated in the formation of ‘cognitive maps’ or ‘graphs’ (Muller et al. 1996) have adequately high firing rates to assure pairing EPSPs with γ-frequency spikes in the deep layer target cells. We suggest that the degree of synchrony reflects the grouping of cells for participation in some particular neural representation, such as a map of a particular environment. The size of the group may be determined by the degree of synchrony. We hope this model will provide additional insights into the general problem of how functional groups of neurons are formed and the specific problem of the neural basis for navigational behaviour.
Acknowledgments
M. S. is supported by National Institutes of Health grant NS33144.
References
- Alonso A, García-Austt E. Neuronal sources of theta rhythm in the entorhinal cortex of the rat. II. Phase relations between unit discharges and theta field potentials. Experimental Brain Research. 1987;67:502–509. doi: 10.1007/BF00247283. [DOI] [PubMed] [Google Scholar]
- Bliss TVP, Collingridge GL. A synaptic model of memory: long-term potentiation in the hippocampus. Nature. 1993;361:31–39. doi: 10.1038/361031a0. [DOI] [PubMed] [Google Scholar]
- Brankack J, Stewart M, Fox SE. Current source density analysis of the hippocampal theta rhythm: associated sustained potentials and candidate synaptic generators. Brain Research. 1993;615:310–327. doi: 10.1016/0006-8993(93)90043-m. [DOI] [PubMed] [Google Scholar]
- Buzsáki G, Horváth Z, Urioste R, Hetke J, Wise K. High-frequency network oscillation in the hippocampus. Science. 1992;256:1025–1027. doi: 10.1126/science.1589772. [DOI] [PubMed] [Google Scholar]
- Ceranik K, Bender R, Geiger JRP, Monyer H, Jonas P, Frotscher M, Lübke J. A novel type of GABAergic interneuron connecting the input and the output regions of the hippocampus. Journal of Neuroscience. 1997;17:5380–5394. doi: 10.1523/JNEUROSCI.17-14-05380.1997. [DOI] [PMC free article] [PubMed] [Google Scholar]
- Chrobak JJ, Buzsáki G. Selective activation of deep layer (V-VI) retrohippocampal cortical neurons during hippocampal sharp waves in the behaving rat. Journal of Neuroscience. 1994;14:6160–6170. doi: 10.1523/JNEUROSCI.14-10-06160.1994. [DOI] [PMC free article] [PubMed] [Google Scholar]
- Chrobak JJ, Buzsáki G. High-frequency oscillations in the output networks of the hippocampal-entorhinal axis of the freely behaving rat. Journal of Neuroscience. 1996;16:3056–3066. doi: 10.1523/JNEUROSCI.16-09-03056.1996. [DOI] [PMC free article] [PubMed] [Google Scholar]
- Funahashi M, Stewart M. Presubicular and parasubicular cortical neurons of the rat: electrophysiological and morphological properties. Hippocampus. 1997a;7:117–129. doi: 10.1002/(SICI)1098-1063(1997)7:2<117::AID-HIPO1>3.0.CO;2-K. 10.1002/(SICI)1098-1063(1997)7:2<117::AID-HIPO1>3.0.CO;2-K. [DOI] [PubMed] [Google Scholar]
- Funahashi M, Stewart M. Presubicular and parasubicular cortical neurons of the rat: functional separation of deep and superficial neurons in vitro. Journal of Physiology. 1997b;501:387–403. doi: 10.1111/j.1469-7793.1997.387bn.x. [DOI] [PMC free article] [PubMed] [Google Scholar]
- Funahashi M, Stewart M. GABA receptor-mediated postsynaptic potentials in the retrohippocampal cortices: regional, laminar and cellular comparisons. Brain Research. 1998;787:19–33. doi: 10.1016/s0006-8993(97)01384-x. 10.1016/S0006-8993(97)01384-X. [DOI] [PubMed] [Google Scholar]
- Freund TF, Buzsáki G. Interneurons of the hippocampus. Hippocampus. 1996;6:347–470. doi: 10.1002/(SICI)1098-1063(1996)6:4<347::AID-HIPO1>3.0.CO;2-I. 10.1002/(SICI)1098-1063(1996)6:4<347::AID-HIPO1>3.0.CO;2-I. [DOI] [PubMed] [Google Scholar]
- Germroth P, Schwerdtfeger WK, Buhl EH. GABAergic neurons in the entorhinal cortex project to the hippocampus. Brain Research. 1989;494:187–192. doi: 10.1016/0006-8993(89)90162-5. 10.1016/0006-8993(89)90162-5. [DOI] [PubMed] [Google Scholar]
- Gray CM. Synchronous oscillations in neuronal systems: mechanisms and functions. Journal of Computational Neuroscience. 1994;1:11–38. doi: 10.1007/BF00962716. [DOI] [PubMed] [Google Scholar]
- Hebb DO. The Organization of Behavior. New York: Wiley; 1949. [Google Scholar]
- Jones RSG. Complex synaptic responses of entorhinal cortical cells in the rat to subicular stimulation in vitro: demonstration of an NMDA receptor-mediated component. Neuroscience Letters. 1987;81:209–214. doi: 10.1016/0304-3940(87)90000-0. [DOI] [PubMed] [Google Scholar]
- Jones RSG. Synaptic transmission between layers V-VI and layer II of the rat medial entorhinal cortex in vitro. Journal of Physiology. 1990;429:47. P. [Google Scholar]
- Jones RSG, Heinemann U. Synaptic and intrinsic responses of medial entorhinal cortical cells in normal and magnesium-free medium in vitro. Journal of Neurophysiology. 1988;59:1476–1496. doi: 10.1152/jn.1988.59.5.1476. [DOI] [PubMed] [Google Scholar]
- Jones RSG, Lambert JDC. Synchronous discharges in the rat entorhinal cortex in vitro: site of initiation and the role of excitatory amino acid receptors. Neuroscience. 1990;34:657–670. doi: 10.1016/0306-4522(90)90172-z. 10.1016/0306-4522(90)90172-Z. [DOI] [PubMed] [Google Scholar]
- Köhler C. Intrinsic connections of the retrohippocampal region in the rat brain. II. The medial entorhinal area. Journal of Comparative Neurology. 1986;246:149–169. doi: 10.1002/cne.902460202. [DOI] [PubMed] [Google Scholar]
- Llinás RR, Grace AA, Yarom Y. In vitro neurons in mammalian cortical layer 4 exhibit intrinsic oscillatory activity in the 10- to 50-Hz frequency range. Proceedings of the National Academy of Sciences of the USA. 1991;88:897–901. doi: 10.1073/pnas.88.3.897. [DOI] [PMC free article] [PubMed] [Google Scholar]
- Lopes da Silva FH, Witter MP, Boejinga PH, Lohman AHM. Anatomic organization and physiology of the limbic cortex. Physiological Reviews. 1990;70:453–511. doi: 10.1152/physrev.1990.70.2.453. [DOI] [PubMed] [Google Scholar]
- Lorente de Nó R. Studies on the structure of the cerebral cortex. I. The area entorhinalis. Journal für Psychologie und Neurologie. 1933;45:381–438. [Google Scholar]
- Muller RU, Kubie JL, Ranck JB., Jr Spatial firing patterns of hippocampal complex-spike cells in a fixed environment. Journal of Neuroscience. 1987;7:1935–1950. doi: 10.1523/JNEUROSCI.07-07-01935.1987. [DOI] [PMC free article] [PubMed] [Google Scholar]
- Muller RU, Stead M, Pach J. The hippocampus as a cognitive graph. Journal of General Physiology. 1996;107:663–694. doi: 10.1085/jgp.107.6.663. [DOI] [PMC free article] [PubMed] [Google Scholar]
- Nicoll RA, Malenka RC. Contrasting properties of two forms of long-term potentiation in the hippocampus. Nature. 1995;377:115–118. doi: 10.1038/377115a0. [DOI] [PubMed] [Google Scholar]
- Quirk GJ, Muller RU, Kubie JL, Ranck JB., Jr The positional firing properties of medial entorhinal neurons: description and comparison with hippocampal place cells. Journal of Neuroscience. 1992;12:1945–1963. doi: 10.1523/JNEUROSCI.12-05-01945.1992. [DOI] [PMC free article] [PubMed] [Google Scholar]
- Ranck JB., Jr . Head direction cells in the deep cell layer of dorsal presubiculum in freely moving rats. In: Buzsáki G, Vanderwolf CH, editors. Electrical Activity of the Archicortex. Budapest, Hungary: Akadémiai Kiadó; 1985. pp. 217–220. [Google Scholar]
- Roelfsema PR, Engel AK, König P, Singer W. Visuomotor integration is associated with zero time-lag synchronization among cortical areas. Nature. 1997;385:157–161. doi: 10.1038/385157a0. [DOI] [PubMed] [Google Scholar]
- Singer W, Gray CM. Visual feature integration and the temporal correlation hypothesis. Annual Review of Neuroscience. 1995;18:555–586. doi: 10.1146/annurev.ne.18.030195.003011. [DOI] [PubMed] [Google Scholar]
- Snow RW, Dudek FE. Electrical fields directly contribute to action potential synchronization during convulsant-induced epileptiform bursts. Brain Research. 1984;323:114–118. doi: 10.1016/0006-8993(84)90271-3. [DOI] [PubMed] [Google Scholar]
- Stanford IM, Traub RD, Colling SB, Jefferys JGR. Synchronous γ oscillations in the subiculum. Society for Neuroscience Abstracts. 1997;23:488. [Google Scholar]
- Stewart M, Quirk GJ, Barry M, Fox SE. Firing relations of medial entorhinal neurons to the hippocampal theta rhythm in urethane anesthetized and walking rats. Experimental Brain Research. 1992;90:21–28. doi: 10.1007/BF00229252. [DOI] [PubMed] [Google Scholar]
- Taube JS. Place cells recorded in the parasubiculum of freely moving rats. Hippocampus. 1995;5:569–583. doi: 10.1002/hipo.450050608. [DOI] [PubMed] [Google Scholar]
- Taube JS, Muller RU, Ranck JB., Jr Head-direction cells recorded from the postsubiculum in freely moving rats. I. Description and quantitative analysis. Journal of Neuroscience. 1990;10:436–447. doi: 10.1523/JNEUROSCI.10-02-00420.1990. [DOI] [PMC free article] [PubMed] [Google Scholar]
- Traub RD, Jefferys JGR, Whittington MA. Enhanced NMDA conductance can account for epileptiform activity induced by low Mg2+ in the rat hippocampal slice. The Journal of Physiology. 1994;478:379–393. doi: 10.1113/jphysiol.1994.sp020259. [DOI] [PMC free article] [PubMed] [Google Scholar]
- Traub RD, Whittington MA, Colling SA, Buzsáki G, Jefferys JGR. Analysis of γ rhythms in the rat hippocampus in vitro and in vivo. Journal of Physiology. 1996;493:471–484. doi: 10.1113/jphysiol.1996.sp021397. [DOI] [PMC free article] [PubMed] [Google Scholar]
- Traub RD, Wong RKS. Cellular mechanism of neuronal synchronization in epilepsy. Science. 1982;216:745–747. doi: 10.1126/science.7079735. [DOI] [PubMed] [Google Scholar]
- Traub RD, Whittington MA, Stanford IM, Jefferys JGR. A mechanism for generation of long-range synchronous fast oscillations in the cortex. Nature. 1996;383:621–624. doi: 10.1038/383621a0. [DOI] [PubMed] [Google Scholar]
- Whittington MA, Traub RD, Faulkner HJ, Stanford IM, Jefferys JGR. Recurrent excitatory postsynaptic potentials induced by synchronized fast cortical oscillations. Proceedings of the National Academy of Sciences of the USA. 1997;94:12198–12203. doi: 10.1073/pnas.94.22.12198. [DOI] [PMC free article] [PubMed] [Google Scholar]
- Whittington MA, Traub RD, Jefferys JGR. Synchronized oscillations in interneuron networks driven by metabotropic glutamate receptor activation. Nature. 1995;373:612–615. doi: 10.1038/373612a0. [DOI] [PubMed] [Google Scholar]
- Witter MP, Groenewegen HJ, Lopes da Silva FH, Lohman AHM. Functional organization of the extrinsic and intrinsic circuitry of the parahippocampal region. Progress in Neurobiology. 1989;33:161–253. doi: 10.1016/0301-0082(89)90009-9. [DOI] [PubMed] [Google Scholar]
- Yim CC, Krnjevi´c K, Dalkara T. Ephaptically generated potentials in CA1 neurons of rat's hippocampus in situ. Journal of Neurophysiology. 1986;56:99–122. doi: 10.1152/jn.1986.56.1.99. [DOI] [PubMed] [Google Scholar]
- Ylinen A, Bragin A, Nádasdy Z, Jandó G, Szabó I, Sik A, Buzsáki G. Sharp wave-associated high-frequency oscillation (200 Hz) in the intact hippocampus: network and intracellular mechanisms. Journal of Neuroscience. 1995;15:30–46. doi: 10.1523/JNEUROSCI.15-01-00030.1995. [DOI] [PMC free article] [PubMed] [Google Scholar]