Abstract
We examined the relationship between calcineurin (protein phosphatase 2B (PP2B)) and voltage-operated Ca2+ channels (VOCCs) in NG108-15 cells. PP2B expression in NG108-15 cells was altered by transfection with plasmid constructs containing a full length cDNA of human PP2Bβ3 in sense (CN-15) and antisense (CN-21) orientation.
Confocal immunocytochemical localization showed that in wild-type cells, PP2B immunoreactivity is uniformly distributed in undifferentiated cells and located at the inner surface of soma membrane and neurites in differentiated cells.
To test the Ca2+ dependence of the VOCC, we used high-frequency stimulation (HFS). The L- and N-type VOCCs decreased by 37 and 52%, respectively, whereas the T-type current was only marginally sensitive to this procedure. FK-506 (2 μM), a specific blocker of PP2B, reduced the inhibition of L- and N-type VOCCs induced by HFS by 30 and 33%, respectively.
In CN-15-transfected cells overexpressing PP2B, total high-voltage-activated (HVA) VOCCs were suppressed by about 60% at a test potential of +20 mV. Intracellular addition of EGTA or FK-506 into CN-15-transfected cells induced an up to 5-fold increase of HVA VOCCs.
These findings indicate that PP2B activity does not influence the expression of HVA Ca2+ channels, but modulates their function by Ca2+-dependent dephosphorylation. Thus HVA VOCCs, in a phosphorylated state under control conditions, are downregulated by PP2B upon stimulation, with the major effect being on N-type VOCCs.
A rise in cytoplasmic Ca2+ concentration ([Ca2+]i) is one of the factors that triggers and promotes the process of run-down of high-threshold Ca2+ current in patch-clamp studies. However, little is known about the precise mechanism of action of Ca2+ in this process. Electrophysiological studies have already reported that one of the ways that voltage-operated Ca2+ channel (VOCC) downregulation can occur is by channel dephosphorylation. Several protein phosphatases have been implicated in this process. Thus, the participation of Ca2+-calmodulin-dependent protein phosphatase type 2B (calcineurin (PP2B)) (Chad & Eckert, 1986; Hosey, Borsotto & Lazdunski, 1986; Armstrong, 1989; Kostyuk & Lukyanetz, 1993) and protein phosphatases type 1 and 2A (Kameyama, Hescheler, Mieskes & Trautwein, 1986; Hescheler, Mieskes, Ruegg, Takai & Trautwein, 1988) in the downregulation of VOCCs has been proposed. Direct biochemical experiments have shown that all of these enzymes can dephosphorylate, with different selectivity, purified skeletal muscle VOCC α1 subunits (Lai, Peterson & Catterall, 1993). Similar data for brain VOCCs have not yet been obtained. Among the serine/ threonine phosphatases, only PP2B is a Ca2+-activated enzyme and as such may be solely responsible for the Ca2+-dependent component of channel dephosphorylation.
PP2B represents a major phosphatase of the central nervous system, where it is highly concentrated in the hippocampus (Yamasaki, Onodera, Adachi, Shozuhara & Kogure, 1992), Purkinje cells of the cerebellum and neocortical pyramidal cells (Usuda et al. 1996). It is regulated by Ca2+-calmodulin and is composed of two subunits: the A subunit contains the catalytic domain and interacts with calmodulin, and the regulatory B subunit, which has four calmodulin-like E-F hand structures that bind Ca2+. Myristoylation of the amino terminal glycine of the B subunit is one of the properties of this enzyme that may serve to localize PP2B to the plasma membrane. Such a localization would expedite PP2B-dependent dephosphorylation of membrane proteins including VOCCs, and in this way participate in Ca2+ homeostasis. While there is evidence for a role for PP2B in other cellular functions, an essential role for PP2B in regulating neuronal excitability and hormone release has been suggested (Armstrong, 1989; Yakel, 1997). Recent data indicate that long-term depression (Hodgkins & Kelly, 1995) and long-term potentiation (Lu, Hayashi, Moriwaki, Tomizawa & Matsui, 1996) in rat hippocampus involve calcineurin activity. PP2B is also involved in numerous brain pathophysiological conditions including cerebral ischaemia, where inhibition of the enzyme has been shown to be neuroprotective (Sharkey & Butcher, 1994). It was recently established that intracellular Ca2+ can block the cAMP-mediated positive modulation of VOCCs in molluscan neurons (Kostyuk, Lukyanetz & Doroshenko, 1992; Kostyuk & Lukyanetz, 1993). This blockade showed a biphasic nature and consisted of activation of two Ca2+-calmodulin-dependent enzymes, calcineurin (PP2B) being one of them. The aim of the present investigation was to establish if PP2B is involved in similar regulation of VOCC activity in mammalian neurons.
The NG108-15 neuroblastoma × glioma cell line is a monoclonal hybrid neuronal cell line formed by the fusion of two separate mammalian cell lines, a mouse neuroblastoma N18TG-2 and a rat glioma C6BU-1 (Klee & Nirenberg, 1973). Previously, it has been established that after differentiation, NG108-15 cells display electrophysiological properties very similar to those of sympathetic neurons. Voltage-operated sodium, potassium and calcium currents have been described previously in these cells (Docherty, Robbins & Brown, 1991). Furthermore, these cells have membrane receptors for many neurotransmitters that are pharmacologically similar to receptors in primary neurons (Buisson, Laflamme, Bottari, Gasparo, Gallo-Payet & Payet, 1992). A major advantage of this cell line is its ability of heterologous expression of foreign genetic material. We therefore used NG108-15 cells to overexpress PP2B and examine the resultant changes in activity of different types of VOCCs present in these cells.
Part of these findings have been reported in brief to The Physiological Society (Lukyanetz, Piper, Dolphin & Sihra, 1996).
METHODS
Tissue culture
NG108-15 cells
The culture medium was composed of 90% MEM (modified essential medium), 10% FCS (fetal calf serum), HAT (hypoxanthine aminopterin-thymidine) supplement and penicillin- streptomycin. The day before differentiation, the NG108-15 cells were transferred onto glass coverslips. The cells were differentiated using standard procedures described previously (Docherty et al. 1991) by treatment with 10 μM prostaglandin E1 (PGE) and 50 μM isobutylmethylxanthine (IBMX) 3–5 days before recording. PGE and IBMX were present only during the initial 48 h of differentiation. Subsequently medium was changed to MEM + 1% FCS + HAT supplement. In all electrophysiological experiments the pipette solution contained 0.1 mM IBMX to prevent Ca2+-dependent phosphodiesterase activity. The presence of IBMX does not therefore affect the interpretation of the data because both undifferentiated and differentiated, as well as wild-type and transfected cells, were treated with the inhibitor.
Immunoblot analysis
NG108-15 cells were washed twice with phosphate-buffered saline (PBS: 137 mM NaCl, 2.3 mM KCl, 10 mM sodium phosphate (pH 7.4)) and lysed in cold water. After protein determination (Biorad Bradford Reagent) samples were solubilized in SDS- 2-mercaptoethanol stop buffer (1% SDS, 6.25 mM Tris (pH 6.8), 5% 2-mercaptoethanol, 10% (v/v) glycerol and 0.001% (w/v) Bromophenol Blue) and boiled for 5 min. Proteins were resolved on 10% SDS-PAGE gels (Laemmli, 1970) and electrotransferred onto nitrocellulose (Towbin, Staehelin & Gordon, 1979). Blots were blocked with 3% BSA and 0.02% Tween-20 in Tris-buffered saline (TBS; composition: 500 mM NaCl, 10 mM Tris (pH 7.4)). Blocked blots were shaken overnight with 1/1000 dilution of primary anti-CN IgG (RB3006)) in TBS containing 3% BSA, 0.5% ovalbumin, 10% goat serum and 0.5% NP40. We raised RB3006 in rabbits against a bacterial fusion protein consisting of glutathione-S-transferase and the 253 amino acid COOH terminal of rabbit PP2Bα (cDNA BL5/1) (Da Cruz e Silva, Hughes, McDonald, Stark & Cohen, 1991). After incubation with primary antibody, blots were washed with TBS containing 0.5% NP40 and then shaken in a 1/500 dilution of horseradish peroxidase-conjugated goat anti-rabbit IgG (Sigma) for 2 h. Finally membranes were washed in TBS-0.5% NP40 and developed with 0.2 mg ml−1 peroxidase substrate, 3-amino-9-ethylcarbazole, in 50 mM sodium acetate (pH 5.2), 0.05% Tween-20 and 0.03% hydrogen peroxide.
Transfections
A full length cDNA of human PP2Bβ3 (HT6/6) (McPartlin, Barker & Cohen, 1991) was subcloned into pOPRSVI (Stratagene). The pOPRSVI-HT6/6 construct was amplified in E. coli and sense (CN-15) and antisense (CN-21; with cDNA inserted in reverse orientation) plasmid constructs were isolated. NG108-15 cells were transfected with 10 μg of plasmid DNA using a calcium phosphate precipitation protocol (Sambrook, Fritsch & Maniatis, 1989). Transfectants were selected with 200 μg ml−1 Geneticin (G418) and cultures expanded.
Immunocytochemistry
Calcineurin expression was monitored using the polyclonal anti-CN antibody, RB3006, used for immunoblotting experiments described above. Cells were washed with 154 mM NaCl, 40 mM Tris pH 7.4 (TBS2), fixed with 4% paraformaldehyde in TBS2 for 30 min at room temperature (18-22°C), and in all experiments, except where specially stated, cells were permeabilized with 0.02% Triton X-100 in TBS2 for 3 × 5 min. Cells were then washed (3 × 5 min) with TBS2 containing 20% goat serum, 4% bovine serum albumin and 0.1% dl-lysine, and incubated with a 1/1000 dilution of RB3006 in the same solution, overnight at 4°C. Cells were washed (4 × 5 min) and incubated with goat anti-rabbit IgG conjugated to biotin (1/200) dilution) for 2 h at 4°C, washed again (4 × 5 min) and incubated for a further 2 h at 4°C with streptavidin conjugated to fluorescein (FITC) (1/50 dilution; Extravidin, Sigma). After final washing (5 × 5 min), cells were mounted in antifade mountant and viewed with a confocal microscope. We used fluorescence analysis as described previously (Berrow, Campbell, Fitzgerald, Brickley & Dolphin, 1995). In brief, as laser exposure of stained preparations could induce their bleaching, in our experiments the cells were focused and alignment optimized before the image was exposed to the laser. Images were taken under conditions of constant illumination of the laser. Images were collected using Kalman filtering to reduce electronic noise and stored using Biorad MRC600 (Hemel Hempstead, UK) software. All laser and microscope settings (microscope gain, aperture, scanning steps, step number, calibration of intensity, offsets etc.) were controlled automatically by computer software and were equal for all images. We routinely determined the most intensively stained preparation in the sets being assessed (each set included a calibrating preparation to estimate the level of fluorescence intensity) to obtain the highest level of fluorescence. This value was then used to set the grey value range (1–255 pixels) for analysis of all the preparations. Stored images during data analysis were equally zoomed to increase the space point number so as to expand the grey value resolution. Using the image analysis facility, the average grey value intensity was obtained for each fluorescence image. This process was performed with all data acquisition parameters (aperture, gain, grey value ramp, black level) equivalently for all cells. We have used through-projection images (i.e. two-dimensional images derived from the image set). A standard merging (maximum) procedure was performed automatically off-line with stored files of fluorescence images of separate 2 μm confocal sections through the cell body, using commercial software (Biorad MRC600). Examples of single 2 μm confocal sections are also presented where indicated.
Electrophysiology
Standard patch-clamp methods were used to record VOCCs with an Axopatch-1D amplifier (Axon Instruments). Recordings were filtered at 1–2 kHz (4-pole Bessel filter) and digitized at 5–20 kHz using a Digidata A/D converter. We used different protocols depending on the experiment with the Nyquist factor ranging from 2 to 10: short 30–40 ms pulses (Fs = 10–20 kHz and Ff = 1–2 kHz) for capacitance estimation, 50 ms pulses (Fs = 10 kHz and Ff = 2 kHz) for I-V measurement protocols, 320 and 500 ms pulses (Fs = 2.5 kHz and Ff = 1 kHz) for ramp registrations, and 600 ms pulses (Fs = 2 kHz and Ff = 1 kHz) for kinetic studies (Fs and Ff denote frequencies of sampling and filter bandwidth, respectively). Acquisition and analysis of data were performed using pCLAMP 6 software (Axon Instruments). Linear leak and residual capacity currents were subtracted on-line using the P/6 subtraction protocol. Recordings of VOCCs were made using 1–4 MΩ micropipettes manufactured from borosilicate glass capillary tubes. Recordings were made from cells where the seal resistance was greater than 2 GΩ. Current density was calculated as a ratio of membrane current to membrane capacity. Averages are given as the mean ±s.d. of the number of experiments given in parentheses. A Student's paired t test was used for statistical analysis. The difference was considered significant when P < 0.05. The compositions of the solutions used in this study were as follows: external solution (mM): TEABr, 40; MgCl2, 2; CaCl2, 10; Hepes, 10; NaCl, 90; TTX, 0.001; pH 7.4; pipette solution (mM): CsCl, 130; Hepes, 10; MgCl2, 2; ATP, 4; GTP, 0.3; theophylline, 5; IBMX, 0.1; pH 7.4. The osmolarity of the solution was adjusted to 320 mosmol l−1 with sucrose. All drugs were applied by pressure ejection through a micropipette (10–15 μm tip diameter) placed 30–80 μm from the cell. In some experiments cells were pretreated for 5 min with ωCgTX GVIA in Ca2+-free solution immediately before recording. In some series of the experiments the protocol of high-frequency stimulation (HFS) was applied. During this procedure, 50 ms steps to depolarizing voltages that corresponded to the peak of the leak-subtracted I-V relationship (V(Imax)) with a 10 ms interpulse time were applied as a train of 200 prepulses from a holding voltage of −70 mV (see the inset in Fig. 3). Current density was calculated as the ratio of membrane current (ICa) to membrane capacity (Cm). Membrane capacity was calculated for every cell tested as follows:
Figure 3. Effects of high-frequency stimulation (HFS) on HVA VOCCs.
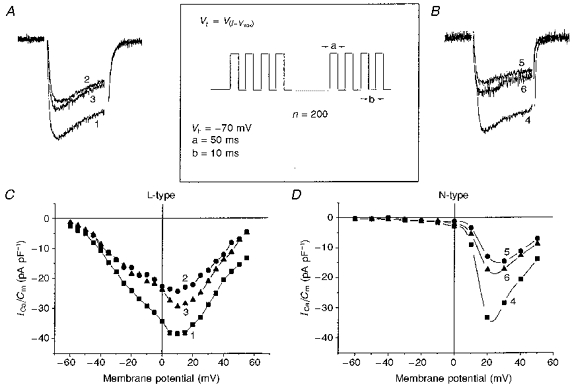
I-V recordings of pharmacologically separated L-type VOCCs with 1 μM ωCgTX GVIA in the presence of 0.1 mM Ni2+ in bath solution (A and C) and N-type VOCCs with 10 μM nifedipine (B and D) were obtained in control conditions (curves 1 and 4), immediately after HFS (curves 2 and 5) and 5 min after HFS (curves 3 and 6) in two different cells. Bath solution contained 0.1 mM Ni2+. Inset shows the HFS protocol for the experiment, where Vt is test potential corresponding to I-Vmax.
| (1) |
where Ic is the recorded capacity current, Ip is capacity current flowing through the wall of the micropipette, t 0 and t are times at the beginning and end of the depolarizing pulse, respectively, and Vt is the magnitude of test voltage pulse in the potential range where membrane current was not activated. Usually Vt = −10 mV at a holding potential (Vh) of −80 mV.
Materials
ωCgTX GVIA was supplied by Peninsula Laboratories, tissue culture supplies were obtained from Life Technologies (Paisley, UK), and all other compounds were from Sigma.
RESULTS
VOCCs in NG108-15 cells
The presence of several types of calcium channels has previously been reported in NG108-15 cells (Brown, Docherty & McFadzean, 1989; Kasai & Neher, 1992; Schmitt & Meves, 1995; Lukyanetz et al. 1996; Lukyanetz, 1998). To start our investigation of the involvement of PP2B in the regulation of activity of VOCCs, we first established the characteristics of the Ca2+ currents in control cells intended for later transfection work. NG108-15 cells were voltage clamped at −80 mV in the whole-cell configuration and 50 ms test pulses to target voltages were applied to measure VOCCs; 10 mM external Ca2+ was used as the charge carrier. VOCCs in undifferentiated cells were barely detectable and were low threshold. In differentiated cells without neurites, we observed a single current-voltage (I-V) peak of Ca2+ current with a multicomponent nature (Kasai & Neher, 1992) (Fig. 1A). In cells with neurites, we always observed two peaks in the I-V curve with the second peak mainly representing an N-type Ca2+ current (Fig. 1B) as defined by previously established criteria (Lukyanetz, 1998).
Figure 1. Current-voltage relationships of inward Ca2+ currents in NG108-15 cells.
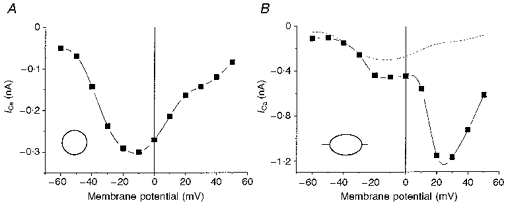
Currents were recorded in control conditions, without any blockers. Recordings were made from differentiated cells without (A) or with (B) neurites after 5 days of differentiation in control conditions. The dotted line in B shows the same I-V curve presented in A for comparison.
In subsequent experiments we tested only differentiated cells with neurites, except where otherwise stated. To separate the VOCC components in differentiated cells with neurites, we used well-established pharmacological tools. Figure 2A and B illustrates VOCC traces and current- voltage (I-V) relationships recorded in differentiated cells that were pretreated with 1 μM ωCgTX GVIA, a selective and irreversible blocker of N-type channels, and 200 μM Ni2+, a blocker of T-type channels in NG108-15 cells at this concentration (Docherty et al. 1991). The current resistant to these agents appeared at test potentials more positive than −50 mV and could be classified as the L-type VOCC current; its maximum was observed between 0 and 10 mV (Fig. 2A and B). To examine the properties of the VOCC component sensitive to ωCgTX GVIA, we measured the current in the presence of Ni2+ and 10 μM nifedipine (Fig. 2C and D). The activation and inactivation of the N-type VOCC was slower than the L-type at the peak of their I-V curves (see current traces in Fig. 2A and C).
Figure 2. High-voltage-activated VOCCs in differentiated NG108-15 cells.
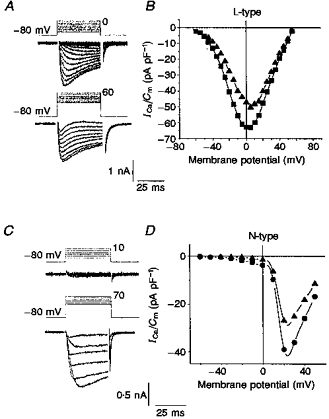
Recordings were made in Ca2+-Ni2+ containing bath solution (10 mM Ca2+, 0.1 mM Ni2+). Current responses on stepping from the holding potential (Vh = −80 mV) to different test potentials (A and C) are shown with corresponding I-V relationships (B and D) evoked by sequential 5 or 10 mV depolarizing steps from the holding potential (Vh = −80 mV (▪ in B, • in D) and −50 mV (▴)). The two HVA components, L-type (A and B) and N-type (C and D) were pharmacologically separated by 1 μM ωCgTX GVIA (A and B) or 10 μM nifedipine (C and D), respectively.
Sensitivity of low- (LVA) and high-voltage-activated (HVA) components to high-frequency stimulation
It has been shown that VOCC inactivation in NG108-15 cells is similar to that in other excitable cells, in being voltage and current dependent (Docherty, 1988). The Ca2+-sensitive component of current-dependent inactivation may be a consequence of Ca2+-mediated dephosphorylation of channels. Therefore, in the next series of experiments we explored the Ca2+-dependent inactivation of different VOCC components, using the pharmacological tools described above. To characterize the Ca2+ dependence, we applied a high-frequency stimulation (HFS) protocol to the differentiated NG108-15 cells (see Methods). During HFS, a sufficient amount of Ca2+ would be expected to enter the cell to induce a significant rise in [Ca2+]i, initially localized to the internal surface of plasma membrane, that could then activate membrane-associated PP2B and lead to dephosphorylation of ion channels. To avoid a depletion of phosphorylation processes and to diminish phosphodiesterase activity, we used a pipette solution containing 4 mM ATP as well as 100 μM IBMX and 5 mM theophylline to block phosphodiesterase activity. Importantly, no exogenous Ca2+ buffer was included in the pipette. I-V relationships and corresponding peak current traces recorded in control conditions and after HFS are plotted in Fig. 3. As can be seen, prepulses substantially reduced both L-type (Fig. 3A and C) and N-type (Fig. 3B and D) VOCC components. The L- and N-type current components were decreased, respectively, by 37 ± 6% (n = 8) and 52 ± 9% (n = 7). A slow recovery of the current amplitude after HFS was usually observed (Fig. 3A, trace 3, Fig. 3B, trace 6). These results indicate that both L- and N-type currents can be suppressed by elevation of [Ca2+]i in these cells and that the activity of both these currents may thus be regulated by PP2B.
It is evident from the experiment described in Fig. 3 that, like ωCgTX GVIA, HFS very effectively inhibited the N-type component. As can be seen from Fig. 4 showing a multicomponent current composed of T-, N-type and residual current, the N-type HVA current component (second peak of I-V) (Lukyanetz, 1998) was equally sensitive to both ωCgTX GVIA (Fig. 4A, curve 2) and HFS (Fig. 4B, curve 5). Notably, in contrast to HVA current types, the low-threshold VOCCs in the same cells were only slightly sensitive to HFS (see LVA peak Fig. 4B). The incomplete block of HVA current by ωCgTX GVIA and HFS (Fig. 4, curves 2 and 5) was due to underlying T- and the residual current components, the former being eliminated by Ni2+and a Vh of −50 mV (Fig. 4, curves 3 and 6). These observations imply that HFS can be used as a very useful and easily accessible tool to reduce the N-type component.
Figure 4. Similarity in the effects of ωCgTX GVIA and HFS on VOCCc composing T-, N- and residual types.
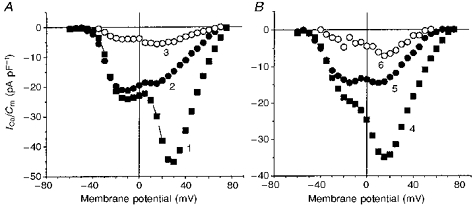
I-V recordings of VOCCs were made in two different cells in solution containing 10 μM nifedipine before (curves 1 and 4) and after 1 μM ωCgTX GVIA application in Ca2+-free application solution (A, curve 2) or HFS (B, curve 5), and in the presence of 0.1 mM Ni2+ at Vh = −50 mV (curves 3 and 6).
Effects of FK-506 on VOCCs in differentiated NG108-15 cells
If the main effect of HFS on HVA components involves the activation of PP2B by Ca2+, then the blockers of PP2B should abolish the inhibition induced by HFS. FK-506 and cyclosporin A are chemically different immunosuppressants that have been shown to act through specific intracellular receptors. The latter are small cytosolic proteins, termed immunophilins, which are well conserved throughout phylogeny and possess a cis-to-trans peptidyl-prolyl isomerization activity. Importantly, studies demonstrating the isolation of PP2B on immunosuppressant-immunophilin affinity columns have provided direct evidence that drug- isomerase complexes interfere with signal transduction events involving PP2B. Finally, demonstrations that immunosuppressants inhibit PP2B activity in vitro (in the presence of the cognate immunophilin), have confirmed FK-506 as a selective blocker of PP2B (Wiederrecht, Lam, Hung, Martin & Sigal, 1993). In the following experiments, we thus tested the effect of FK-506 on the modulation of Ca2+ currents by HFS to define the involvement of PP2B in this process.
Despite a small potentiating effect of FK-506 on the magnitude of L- and N-type VOCCs (not shown), the inhibitor effectively decreased HFS-mediated inhibition of these currents. We measured the I-V relationships for pharmacologically separated L- and N-type current components in the presence of the corresponding blockers before (Fig. 5, curves 1 and 3) and after (curves 2 and 4) HFS. In comparison with control conditions (Fig. 5E and F), in the presence of 2 μM FK-506, the reduction of L- and N-type components by HFS was much smaller (7 ± 2% (n = 5) and 19 ± 5% (n = 7), respectively (Fig. 5C and D)). The difference compared with control was significant for both L-type (P = 0.02) and N-type (P = 0.045).
Figure 5. Influences of FK-506 on HFS effects in differentiated NG108-15 cells.
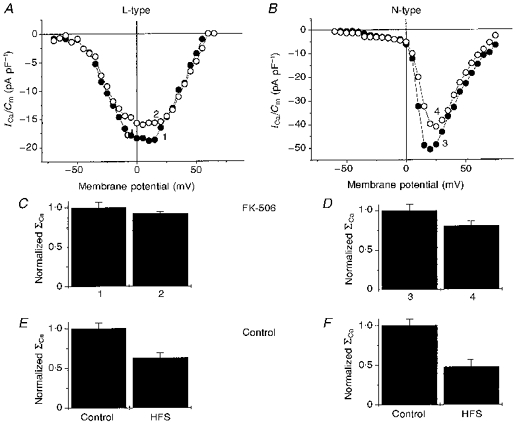
I-V recordings of pharmacologically separated L-type VOCCs by 1 μM ωCgTX GVIA (A) and N-type VOCCs by 10 μM nifedipine (B) were obtained in control conditions (curves 1 and 3) and immediately after HFS (curves 2 and 4) in cells which were patched with a pipette solution containing 2 μM FK-506. Amplitude histograms (means ±s.d.) for integral of the I-V relationships (ΣCa) in FK-506-containing solution (C and D) and similar histograms obtained in control conditions (E and F) are presented. Bath solutions contained 0.1 mM Ni2+.
Distribution of PP2B in NG108-15 cells
To investigate further the relationship between PP2B and activity of Ca2+ channels, the endogenous levels of calcineurin in NG108-15 cells were first examined. Calcineurin expression was monitored using anti-PP2B antibodies (RB3006). Immunoblot analysis (Fig. 6) demonstrated the specificity of the anti-PP2B antibody RB3006. A major band of about 58 kDa was detected (arrow), this corresponding to the shorter of two mammalian PP2B isoenzymes PP2B-A2 (Guerini & Klee, 1989). This analysis confirmed that, compared with mock-transfected cells, overexpression of PP2B occurred in cells transfected with the CN-15 sense construct, while transfection with the CN-21 antisense construct led to a diminution of PP2B. This relative difference was retained in NG108-15 cells following differentiation.
Figure 6. Immunoblot analysis of PP2B expression in mock, sense and antisense PP2B transfectants.
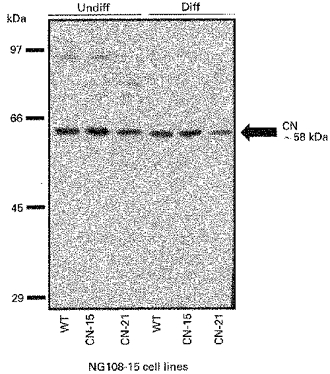
Undifferentiated (Undiff) and differentiated (Diff) NG108-15 cells (10 μg protein) were treated as described in the Methods. Anti-PP2B IgG was used at a dilution of 1/1000, as with immunocytochemical experiments. A major band of about 58 kDa was detected (arrow), corresponding to the shorter of two mammalian PP2B isoenzymes PP2B-A2. Mock-transfected cells (wild-type (WT)) were compared with cells transfected with sense (CN-15) or antisense (CN-21) constructs of PP2Bβ3 (HT6/6) cDNA. Higher molecular weight bands correspond to tightly bound PP2B-A and PP2B-B oligomers that are recalcitrant to dissociation under the solubilization conditions used.
Confocal immunocytochemical localization showed that, in wild-type undifferentiated cells, PP2B immunoreactivity was uniformly distributed in most cells (Fig. 7A), although in some cells, more immunolocalization near the plasma membrane was noted. NG108-15 cells were transfected with 10 μg of various plasmid DNAs as described in the Methods. We confirmed that after stable transfection, PP2B was overexpressed at the plasma membrane and in the cytosol of undifferentiated NG108-15 cells. As can be seen from Fig. 7B, in sense-transfected cells (CN-15), the level of immunoreactivity was significantly higher (about 6-fold) than in wild-type cells (Fig. 7A) or antisense transfectants (CN-21) (Fig. 7C). We observed no difference in the distribution of staining patterns in undifferentiated wild-type and antisense-transfected cells. To ensure the specificity of anti-CN binding to an intracellular target, we measured the immunoreactivity in sense-transfected cells that had not been permeabilized by Triton X-100. In contrast to permeabilized cells (Fig. 7D), we observed no immunoreactivity in non-permeabilized cells (Fig. 7E), confirming the intracellular localization of the observed immunoreactivity. The epitope specificity of anti-CN antibody was confirmed by the use of pre-immune serum, with which we observed no immunostaining in permeabilized cells (Fig. 7F).
Figure 7. Intracellular localization of PP2B immunoreactivity in NG108-15 cells.
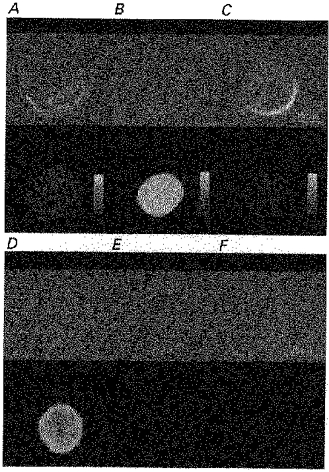
PP2B distribution in non-differentiated NG108-15 cells. Cells were incubated with anti-PP2B IgG (1/1000) and visualized by confocal immunofluorescence microscopy. Phase images of wild-type (A), sense (B) and antisense (C) transfectants are presented in the upper panels. Corresponding immunofluorescence images (lower panels) represent merged images. D, immunostaining with anti-PP2B IgG (1/1000) in permeabilized sense transfectants. Control experiments show the lack of staining in non-permeabilized transfectants (E) or in transfectants with immunostaining by pre-immune serum (1/1000) (F). Corresponding phase images are presented above. Each image represents ten merged 2 μm optical slices.
The distribution of immunostaining in differentiated NG108-15 cells was somewhat different and was similar to the staining in dorsal root ganglion (DRG) neurons (Lukyanetz, 1997b), being more intensive at the plasma membrane of somata and with significant amounts in neurites (Fig. 8A). Specific localization can be seen more clearly with an individual fluorescence image of a 2 μm confocal section through a cell across its middle (inset of Fig. 8A). Confocal localization of immunoreactivity in transfected differentiated NG108-15 cells also showed an overexpression of PP2B in sense-transfected cell neurites (Fig. 8B), and no change or a slight reduction in antisense-transfected cells (Fig. 8C).
Figure 8. PP2B distribution and VOCC activity in differentiated NG108-15 cells.
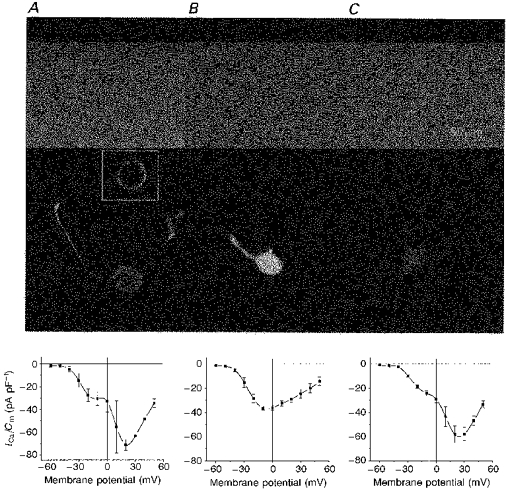
Cells were incubated with anti-PP2B IgG (1/1000) and visualized by confocal immunofluorescence microscopy. Phase images of wild-type (A), sense (B) and antisense (C) transfectants are presented in the upper panels and fluorescence images are represented in the middle panels. Corresponding I-V relationships of VOCCs were measured in control solutions without blockers (bottom panels). Each point represents the mean ±s.d. Each image represents ten merged 2 μm optical slices. Inset shows a fluorescence image of a single 2 μm optical slice through the cell middle (A).
Calcium currents in transfected NG108-15 cells
In the next series of experiments, VOCCs were examined in sense-transfected differentiated NG108-15 cells that overexpressed PP2B, and compared with VOCCs in control non-transfected (wild-type) and antisense-transfected cells (Fig. 8).
As can be seen from Fig. 8B (I-V relationships), transfection with PP2Bβ3 resulted in a dramatic depression of the HVA current component in sense-transfected NG108-15 cells in contrast to the other two groups of cells recorded in control conditions in the absence of any blockers (Fig. 8A and C). This indicates that PP2B overexpression depresses the development of HVA components of VOCCs without significantly affecting the LVA component. Thus, peak Ca2+ current values were 51.20 ± 4.05% (n = 9) and 81.7 ± 6.7% (n = 8) of control value in sense and in antisense transfectants, respectively. At the same time, the kinetics of the HVA components was not noticeably affected.
Our previous detailed analysis of Ca2+ channel type contribution in NG108-15 cells has shown that each current component has specific pharmacological as well as biophysical characteristics. The separate current components displayed distinct maxima in their mean I-V curves at potentials of −20, −15, 0 and +20 mV, these respectively corresponding to four pharmacologically separable Ca2+ current components: T-, Q-, L- and N-type (Lukyanetz, 1998). The peak location of the residual Ca2+ current I-V curve (non T-, Q-, L- and N-type) occurred at more negative potentials than L- and N-types (-10 mV), and was a relatively minor contributor to the total current. This observation, together with the pharmacological and biophysical separation of current components, thus provides the basis for our analysis of the effects of PP2B on VOCCs, without having to resort to the use of toxin cocktails to isolate currents. Under the aforementioned experimental conditions (Lukyanetz, 1998), we therefore sought to identify the HVA Ca2+ current components most susceptible to the regulation by PP2B. Figure 9 shows mean values of Ca2+ current magnitude obtained from the I-V curves for T-, Q-, L- and N-type currents obtained from wild-type (□), sense (▪)- and antisense ( )-transfected cells.
Figure 9. Sensitivity of different Ca2+ current components to PP2B overexpression in differentiated NG108-15 cells.
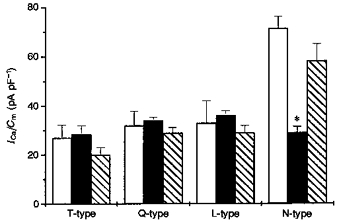
The mean ±s.d. peak amplitude of Ca2+ current evoked by test potentials from Vh = −80 mV to −20, −15, 0 and +20 mV corresponding to the peak of I-V curves of T-, Q-, L- and N-type channels for given experimental conditions (10 mM Ca2+in bath solution) without blockers are presented for wild-type (□), sense (▪)- and antisense ( )-transfected cells. Each histogram value represents the values calculated from data presented in Fig. 8. *P < 0·0002 with respect to control.
In control bath conditions the distribution of the VOCC components in wild-type cells at given potentials was 27.46 ± 5.38 pA pF−1 (n = 16), 32.12 ± 4.22 pA pF−1 (n = 16), 32.99 ± 9.11 pA pF−1 (n = 16) and 71.22 ± 4.79 pA pF−1 (n = 16) for T-, Q-, L- and N-type, respectively. The rank order of the magnitude of Ca2+ current components in wild-type cells was found to be N ≫ L = Q > T. This distribution was very similar for antisense cells, where the respective T-, Q-, L- and N-type current contribution was 18.67 ± 1.3 pA pF−1 (n = 8), 29.01 ± 1.06 pA pF−1 (n = 8) 28.94 ± 3.06 pA pF−1 (n = 8) and 58.17 ± 6.81 pA pF−1 (n = 8), a rank order of N ≫ L = Q > T. However, notably, in sense transfectants, the HVA N-type component was altered dramatically to 29.03 ± 2.6 pA pF−1 (n = 9), while T-, Q- and L-type of VOCC components were only slightly changed to 28.47 ± 3.6 pA pF−1 (n = 9), 35.22 ± 3.1 pA pF−1 (n = 9) and 36.1 ± 1.79 pA pF−1 (n = 9), respectively, corresponding to an alteration of the rank order of current magnitude to L = Q > T = N. This suggests that at the potentials at which the N-type component was most apparent, suppression by PP2B overexpression was about 58%, while at the potentials where the maximal L-, Q- and T-type currents occur, no noticeable attenuation was apparent (Fig. 9). While some effect was also observed in antisense transfectants (CN-21), all of the HVA components of Ca2+ current were equally affected in these cells and the suppression was small (less than 15%), compared with the rather more dramatic and specific effect on the N-type VOCC in sense-transfected cells (Figs 8 and 9).
HVA Ca2+ channels are a target for PP2B
In the following series of experiments, we used only sense (CN-15)-transfected differentiated cells with neurites. As can be seen from Fig. 10A, in CN-15 cells the HVA VOCCs (second peak of I-V curve) were markedly depressed in control conditions. Of six CN-15 cells examined with control pipette solution, none had a ramp HVA peak current greater than the LVA maximum. As PP2B is a Ca2+-regulated phosphatase and may therefore, in part, mediate the effects of Ca2+ signals during VOCC activation, we attempted to establish whether the HVA Ca2+ current components appeared in the sense transfectant when the rise in intracellular Ca2+ signal was inhibited. Figure 10B shows representative experiments where cells were ramp depolarized from −90 to +90 mV with 40 s intervals between each depolarization episode, using a pipette solution containing EGTA to chelate Ca2+. The presence of 10 mM EGTA in the pipette solution produced a sustained (> 5 min) and substantial increase in the peak HVA VOCC in 3 out of 4 sense-transfected cells, the mean increase being 487 ± 22% (n = 3). The kinetics of Ca2+ current inactivation was slowed ∼2-fold by EGTA (inset in Fig. 10B compared with inset in Fig. 10A). In the current studies, we used a simple single exponential time course analysis in order to estimate the phenomenon qualitatively. In reality, inactivation is undoubtedly a more complicated phenomenon (double exponential process) and warrants further detailed investigation. Finally, it was notable that in control experiments with an EGTA-free pipette solution, the HVA peak current tended to run down during the recordings (Fig. 10A), suggesting therefore that PP2B overexpression contributes to this process.
Figure 10. Expression of Ca2+ channels in differentiated sense NG108-15 transfectants (CN-15).
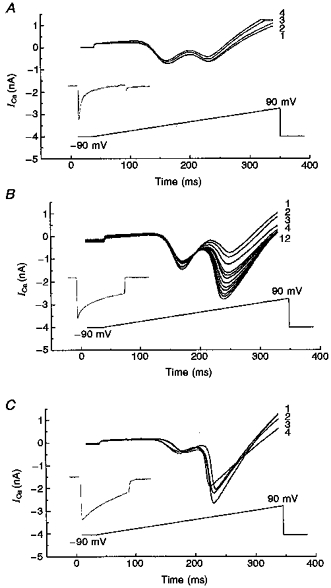
A, leak-subtracted membrane current recorded in control bath solutions in CN-15 transfectants in response to voltage ramps from holding potential of −90 mV to peak potential of +90 mV during 0.5 s steps in control conditions (a ramp rate of 0.36 V s−1). B, ramps recorded in the presence of 10 mM EGTA in pipette solution from CN-15 cells. C, ramp recordings obtained in the presence of 35 μM FK-506 from CN-15 cells. Numbers adjacent to the curves indicate the sequence of trace recordings with respect to time. Insets show the current traces normalized to their peaks that were induced by 500 ms pulses of depolarization corresponding to the peak (+20 mV) of the I-V curve.
To confirm that the HVA current suppression due to PP2B overexpression could be reversed pharmacologically, we tested the effect of FK-506 in the pipette (Fig. 10C). These experiments were carried out using a similar time protocol to that used for Fig. 10A and B (numbers near the curves correspond to similar times after patch pipette breakthrough as in Fig. 10A and B). FK-506 (35 μM), at a concentration found to be effective in PP2B overexpressing cells, caused a significant potentiation of the ramp HVA peak current in sense-transfected cells (Fig. 10C). The peak of this potentiation corresponded to the N-type current component (according to location of peak I-V for the N-type component; Figs 2D, 3B, 4 and 5B) and amounted to 2.5 nA, compared with 0.5 nA in sense-transfected (Fig. 10A) or 1.2 nA in wild-type cells (Fig. 1B), both under control conditions. The kinetics of Ca2+ current inactivation was even more significantly slowed (∼4-fold) by FK-506 (Fig. 10C, inset) than EGTA (Fig. 10B, inset). The ratios between HVA and LVA peaks were 0.86 ± 0.07 (n = 10), 4.87 ± 0.22 (n = 4) and 4.75 ± (0.83) (n = 3) for currents measured in control conditions, after addition of EGTA or after addition of FK-506, respectively. The observed faster effect of FK-506 compared with EGTA may be explained by the fact that FK-506 is membrane permeant and presumably begins to influence enzyme activity during the sealing procedure. This permeation may be accentuated during the several minutes taken to carry out capacity measurements on each cell before subsequent recording protocols (see Methods). The rapid fall of current amplitude in the FK-506 experiments is notable. In contrast to EGTA-loaded cells, when entering Ca2+ will be chelated, with the FK-506 protocol the significant amounts of Ca2+ entering will not be sequestered and may rapidly induce Ca2+-dependent inactivation (run-down) of the substantially increased current (∼3 nA) measured in the presence of the inhibitor.
Figure 11 shows the effect of HFS on VOCCs in sense-transfected cells (CN-15) in control conditions (Fig. 11A), in the presence of 10 mM EGTA (Fig. 11B) or 35 μM FK-506 (Fig. 11C) in the pipette solution. In the presence of either EGTA or FK-506, a selective and reversible block of the HVA current component was seen after HFS (Fig. 11B, curve 4 and Fig. 11C, trace 3).
Figure 11. Recovery of VOCC inhibition induced by HFS of transfected (CN-15) cells during suppression of PP2B activity.
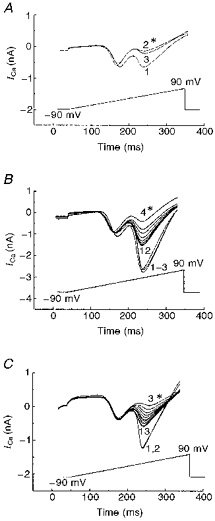
Leak-subtracted membrane current recorded in response to application of voltage ramps from holding potential of −90 mV to peak potential of +90 mV during 0.5 s steps in control condtions (A), in the presence of 10 mM EGTA (B) and 35 μM FK-506 (C) in the pipette solution are shown for transfected CN-15 cells, in control bath solution without any blockers. Numbers near the curves indicate sequence of trace recording in time and traces recorded immediately after HFS marked by asterisks with the exception of trace 3 in A, which corresponds to traces obtained at the same time after patching as traces 12 in B and C.
With EGTA-containing pipette solution, the HVA current component was inhibited by 78 ± 5% (n = 4) and restored after HFS to 54 ± 6% (n = 4) of the control value. With FK-506 solution in the pipette, similar inhibition was seen (76 ± 4%, n = 3) with recovery following HFS to 67% of the control magnitude of VOCC. Thus, although neither EGTA nor FK-506 completely prevented the action of increased [Ca2+]i on HVA channel activity, in comparison with the effect of HFS on transfected CN-15 cells recorded under control conditions (Fig. 11A, trace 2 and 3), these two treatments significantly facilitated the recovery of VOCC activity following HFS-mediated inhibition (Fig. 11B, traces 5–12 and Fig. 11C, traces 4–13). It is important to note that trace 3 in Fig. 11A was measured after the same time following sealing as traces 12 in Fig. 11B and C. These data suggest that while ωCgTX GVIA-sensitive channels are still expressed in CN-15-transfected cells, their activity is suppressed by increased dephosphorylation due to the high levels of PP2B activity.
DISCUSSION
It has previously been reported that NG108-15 cells express an LVA current and two types of HVA channels (L and N), the biophysical characteristics of which have been studied by several groups (Brown et al. 1989; Kasai & Neher, 1992; Schmitt & Meves, 1995). Our recent analysis of Ca2+ current components in differentiated NG108-15 cells with neurites showed the presence of four types of Ca2+ channels, viz. T-, L- and N-types as well as a residual Ca2+ current (a presumably Q-type current expressed by the α1A family of Ca2+ channel subunits) in the proportions 20, 17, 50 and 12%, respectively. (Lukyanetz et al. 1996; Lukyanetz, 1998). While in undifferentiated NG108-15 cells only a minor T-type component could be observed (Docherty et al. 1991; Buisson et al. 1992; Kasai & Neher, 1992; Lukyanetz, 1998), dramatic changes in amplitudes and composition of T-, L- and N-type Ca2+ channels during cell differentiation have been observed (Kasai & Neher, 1992; Lukyanetz, 1998). NG108-15 cells are neuronally derived and display a clear neuronal phenotype on differentiation, as is evident from the morphological observations seen previously (see Docherty et al. 1991) and from our own micrographs (Fig. 8). The development of neurites in differentiated cells correlates directly with the appearance of HVA components. This phenomenon is well known and has also been observed for Ca2+ channel activity during nerve cell maturation of primary DRG neurons (Fedulova, Kostyuk & Veselovsky, 1994), hippocampal neurons (Kortekaas & Wadman, 1997) as well as thalamic neurons (Tarasenko, Kostyuk, Eremin & Isaev, 1997). The difference in channel composition during cell maturation points to a functional difference of Ca2+ channel subtypes in NG108-15 cells; thus well-developed HVA components, especially N-type, were expressed mainly in cells with neurites (see above component proportions). Whereas previous studies have shown that LVA, L- and N-type Ca2+ channel components contribute about equally to the total Ca2+ currents in differentiated NG108-15 cells without neurites (Kasai & Neher, 1992), the N-type component was under-represented when compared with the current profile obtained with differentiated cells with neurites (Lukyanetz, 1998; and Fig. 1B).
In our experiments we established that N- as well as L-type Ca2+ channels (but to a lesser degree) were quite sensitive to HFS, which evokes a large Ca2+ entry into the cell, whereas the LVA component was insensitive to this procedure. Although voltage-dependent inactivation may also play a role in the modulation of Ca2+ channels induced by HFS, our experiments with EGTA evince a clear Ca2+ sensitivity of the modulation of HVA Ca2+ channels. Furthermore, it is worth noting that the experimental conditions of the cell being patched such as the level of the leak current (indicative of Ca2+ infiltration into the cell from external solution during patching), affected the expression of the second peak (N-type) in the I-V relationship in our experiments. Ca2+-dependent inactivation of HVA components in NG108-15 cells has also been observed by other authors (Kasai & Neher, 1992), but the L-type current component was found to be more sensitive to elevation of [Ca2+]i. These earlier studies differed from the present investigation in several respects. Firstly, only the current decay during stimulation was determined in experiments using Ba2+ rather than Ca2+ as the charge carrier. Secondly, the routine use of EGTA in the pipette solution in the previous work is also a point of difference from the current studies where the use of EGTA was limited to specific experiments. Finally, the use of cells without neurites would result in the observation of a single peak in the I-V relationship constituting multiple channels, or a single main peak and a very poorly developed second peak (under-representing N-type channel activity). These experimental differences may thus underlie the discordance between the conclusions from the aforementioned previous report and present studies, where we have characterized differentiated NG108-15 cells with neurites. In our experiments, despite a more pronounced current decay of the L-type component, with Ca2+ as the charge carrier, the N-type peak of the I-V curve proved to be more sensitive to HFS and hence to the increase of [Ca2+]i than L-type currents. If it is assumed that Ca2+ dependence of HVA channels is determined by phosphatase activity then the divergence of the Ca2+ dependency of HVA channel regulation may again reflect the status of cells at different stages of differentiation. It has been shown in several studies that the sensitivity of Ca2+ channel activity to cAMP-dependent (thus protein kinase A (PKA)) modulation dramatically changes during different stages of cell ontogenesis. Thus, cAMP-dependent regulation of L-type Ca2+ channels was observed only in early stages of postnatal development in DRG neurons (Fedulova et al. 1994), whereas, in cardiomyocytes, cAMP sensitivity of the same channels (L-type) appeared at later stages of cell development (S. V. Vyatchenko-Karpinsky, personal communication). Taken together with observations that PKA and calcineurin work as a functional conjugate (Raufman, Lin & Raffaniello, 1996), this may suggest that cAMP sensitivity is, in part, a function of PP2B activity. If this is the case, the developmental status of the NG108-15 cells is likely to be important for the expression of the effects of PP2B and hence Ca2+. In our experiments we observed that PP2B overexpression did not dramatically change the kinetics of inactivation of total Ca2+ current. However, EGTA and FK-506 dramatically slowed it. We did not study the kinetics in detail, as this question clearly warrants detailed separate investigation.
The modulation of HVA Ca2+ currents by different second messenger systems through phosphorylation is well established (Doroshenko, Kostyuk & Martynyuk, 1982; Hosey et al. 1986; Kostyuk et al. 1992; Yang & Tsien, 1993; Lukyanetz & Kostyuk, 1996). However, despite the existence of a series of publications about the possibility of protein phosphatases being involved in VOCC regulation (Chad & Eckert, 1986; Hescheler et al. 1988; Armstrong, 1989; Mironov & Lux, 1991; Kostyuk & Lukyanetz, 1993), the hypothesis that protein dephosphorylation is the major mechanism of current-dependent inactivation and ‘run-down’ of HVA VOCC is still subject to debate (Victor, Rusnak, Sikkink, Marban & O'Rourke, 1997). Previous investigations examining the mechanism of inactivation have largely been carried out using short protocols for stimulation and recording. The possibility of tonic up- and downregulation of VOCCs, by exposing the cells to functional influences over prolonged periods (days), has not been studied. In our experiments, we used NG108-15 cells as a model system to introduce cDNA encoding the catalytic subunit of human PP2B (PP2Bβ3 isoform; McPartlin et al. 1991) such that chronic PP2B overexpression was achieved. In such experiments, we could compare the effects of long-term changes in PP2B activity on HVA components of VOCC in transfected and wild-type cells.
Our data demonstrate that endogenous PP2B exists in NG108-15 cells and is localized predominantly near the inner surface of the cytoplasmic membrane and in the neurites in differentiated cells and is more diffusely distributed in undifferentiated cells. The distribution of PP2B immunoreactivity in NG108-15 cells was very similar to the membrane localization of PP2B as well as VOCC β-subunit in DRG neurons (Berrow et al. 1995; Lukyanetz, 1997b). This localized distribution may be relevant to PP2B functioning to dephosphorylate membrane-associated proteins such as HVA calcium channels. In favour of this hypothesis, our experiments with transfected cells showed that PP2B overexpression markedly depressed HVA VOCC activity (Fig. 8B). However, the question arises as to the molecular basis of this effect - does PP2B influence cell differentiation connected with the expression of VOCC protein or does it directly dephosphorylate the channel protein? Firstly, we observed that neurites were well developed in differentiated sense-transfected cells, yet the HVA Ca2+ current component was diminished in the same cells. Secondly, when we reduced intracellular Ca2+ signalling by using EGTA (Fig. 10B) or blocked PP2B activity by using a selective blocker FK-506 (Fig. 10C) in sense transfectants, we found that HVA Ca2+ current components appeared in the presence of these agents despite PP2B overexpression. This indicates the independence of HVA Ca2+ current expression and PP2B activity. Our findings of a higher sensitivity of N-type VOCCs to dephosphorylation by PP2B are somewhat surprising because, previously, L-type VOCCs have been shown to be the main targets for metabotropic regulation in other preparations. This apparent discrepancy may be resolved if the data are assessed in terms of the functional significance of VOCC types in different types of nerve cells. NG108-15 cells possess features of nerve cells in that they have a variety of VOCCs and they secrete acetylcholine, thus justifying their consideration as a model of the presynaptic terminal. In this light our findings agree well with the fact that in many mammalian synapses, transmitter release is blocked by ωCgTX GVIA but not by dihydropyridines (Hirning et al. 1988). Recently, the heterogeneous distribution of Ca2+ channel subtypes in the cell membrane of neurons has been demonstrated, with the predominant localization of N-type channels being presynaptic (Hirning et al. 1988; Lukyanetz, 1997a). Accordingly, the more pronounced expression of N-type channels and their more effective regulation by PP2B compared with the less expressed L-type Ca2+ current seen in NG108-15 cells may be related to the functional importance of N-type for the initiation/termination of synaptic transmission.
The mechanism of HVA VOCC regulation by PP2B in NG108-15 cells displays some similarity to the Ca2+-dependent regulation of HVA VOCCs by neurotransmitters in molluscan neurons (Kostyuk & Lukyanetz, 1993), synaptosomes isolated from rat cerebral cortex (Sihra, Nairn, Kloppenburg, Lin & Pouzat, 1995) and rat lactotrophs (Fomina & Levitan, 1997). Phosphatases other than PP2B may well be involved in the regulation of VOCCs. For instance, it has been shown in cardiac myocytes that L-type currents are inhibited, in part, by stimulation of protein phosphatase activity mediated by arachidonic acid (Petit-Jacques & Hartzell, 1996). Additionally, in some instances, Ca2+-dependent inactivation of L-type VOCCs may occur independently of protein dephosphorylation (Imredy & Yue, 1994; Victor et al. 1997). Notwithstanding these alternative mechanisms of regulation, the present study clearly shows that HVA VOCCs in NG108-15 cells are in dynamic equilibrium in terms of phosphorylation state, such that PP2B-protein kinase activity changes allow the cell to both increase or depress Ca2+ influx and, in this way, contribute to the regulation of synaptic plasticity.
Acknowledgments
We thank Professor A. C. Dolphin for providing laboratory space and funds for the electrophysiological and immunocytochemcial part of this study. We are indebted to Dr Patricia Cohen (University of Dundee) for providing cDNAs for PP2B. We would like to thank Dr V. Campbell-Jones for helpful advice on immunocytochemistry, Mr Ch. Thrasivoulou and Dr T. Cowen, Royal Free Hospital School of Medicine, for valuable advice on confocal microscopy and to J. R. Burley and Professor A. C. Dolphin for critically reading the manuscript. E. A. L. also wishes to thank Professor P. G. Kostyuk for helpful comments on the manuscript. This work was supported by grants to E. A. L. from The Physiological Society and Royal Society and a Wellcome Trust University Award to T. S. S.
References
- Armstrong DL. Calcium channel regulation by calcineurin, a Ca2+-activated phosphatase in mammalian brain. Trends in Neurosciences. 1989;12:117–122. doi: 10.1016/0166-2236(89)90168-9. 10.1016/0166-2236(89)90168-9. [DOI] [PubMed] [Google Scholar]
- Berrow NS, Campbell V, Fitzgerald EM, Brickley K, Dolphin AC. Antisense depletion of β-subunits modulates the biophysical and pharmacological properties of neuronal calcium channels. The Journal of Physiology. 1995;482:481–491. doi: 10.1113/jphysiol.1995.sp020534. [DOI] [PMC free article] [PubMed] [Google Scholar]
- Brown DA, Docherty RJ, McFadzean I. Calcium channels in vertebrate neurons. Experiments on neuroblastoma hybrid model. Annals of the New York Academy of Sciences. 1989;560:358–372. doi: 10.1111/j.1749-6632.1989.tb24115.x. [DOI] [PubMed] [Google Scholar]
- Buisson B, Laflamme L, Bottari SP, Gasparo M, Gallo-Payet N, Payet MA. G-protein is involved in the angiotensin AT2 receptor inhibition of the T-type calcium current in non-differentiated NG108-15 cells. Journal of Biological Chemistry. 1992;270:1670–1674. doi: 10.1074/jbc.270.4.1670. [DOI] [PubMed] [Google Scholar]
- Chad JE, Eckert R. An enzymatic mechanism for calcium current inactivation in dialysed Helix neurones. The Journal of Physiology. 1986;378:31–51. doi: 10.1113/jphysiol.1986.sp016206. [DOI] [PMC free article] [PubMed] [Google Scholar]
- Da Cruz e Silva EF, Hughes V, McDonald P, Stark MJ, Cohen PT. Protein phosphatase 2Bw and protein phosphatase Z are Saccharomyces cerevisiae enzymes. Biochimica et Biophysica Acta. 1991;1089:269–272. doi: 10.1016/0167-4781(91)90023-f. [DOI] [PubMed] [Google Scholar]
- Docherty RJ. Gadolinium selectively blocks a component of calcium current in rodent neuroblastoma × glioma hybrid (NG108-15) cells. The Journal of Physiology. 1988;398:33–47. doi: 10.1113/jphysiol.1988.sp017027. [DOI] [PMC free article] [PubMed] [Google Scholar]
- Docherty RJ, Robbins J, Brown DA. NG108-15 neuroblastoma × glioma hybrid cell line as a model neuronal system. In: Wheal H, Chad J, editors. Cellular Neurobiology: a Practical Approach. Oxford: IRL; 1991. pp. 74–95. [Google Scholar]
- Doroshenko PA, Kostyuk PG, Martynyuk AE. Intracellular methabolism of adenosine 3′,5′-cyclic monophosphate and calcium inward current in perfused neurones of Helixpomatia. Neuroscience. 1982;7:2125–2134. doi: 10.1016/0306-4522(82)90124-5. 10.1016/0306-4522(82)90124-5. [DOI] [PubMed] [Google Scholar]
- Fedulova SA, Kosyuk PG, Veselovsky NS. Comparative analysis of ionic currents in the somatic membrane of sensory neurons from embryonic and newborn rats. Neuroscience. 1994;58:341–346. doi: 10.1016/0306-4522(94)90040-x. 10.1016/0306-4522(94)90040-X. [DOI] [PubMed] [Google Scholar]
- Fomina AF, Levitan ES. Control of Ca2+ channel current and exocytosis in rat lactotrophs by basally active protein kinase C and calcineurin. Neuroscience. 1997;78:523–531. doi: 10.1016/s0306-4522(96)00571-4. 10.1016/S0306-4522(96)00571-4. [DOI] [PubMed] [Google Scholar]
- Guerini D, Klee CB. Cloning of human calcineurin A: evidence for two isozymes and identification of a polyproline structural domain. Proceedings of the National Academy of Sciences of the USA. 1989;86:9193–9197. doi: 10.1073/pnas.86.23.9183. [DOI] [PMC free article] [PubMed] [Google Scholar]
- Hescheler J, Mieskes G, Ruegg JC, Takai A, Trautwein W. Effects of protein phosphatase inhibitor, okadaic acid on membrane currents of isolated guinea-pig myocytes. Pflügers Archiv. 1988;412:248–252. doi: 10.1007/BF00582504. [DOI] [PubMed] [Google Scholar]
- Hirning LD, Fox AP, McCleskey EW, Olivera BM, Thayer SA, Miller RJ, Tsien RW. Dominant role of N-type Ca2+ channels in evoked release of norepinephrine from sympathetic neurons. Science. 1988;239:57–61. doi: 10.1126/science.2447647. [DOI] [PubMed] [Google Scholar]
- Hodgkins JP, Kelly JS. Only ‘de novo’ long-term depression (LTD) in the rat hippocampus in vitro is blocked by the same low concentration of FK506 that blocks LTD in the visual cortex. Brain Research. 1995;705:241–246. doi: 10.1016/0006-8993(95)01168-4. [DOI] [PubMed] [Google Scholar]
- Hosey MM, Borsotto M, Lazdunski M. Phosphorylation and dephosphorylation of dihydropyridine-sensitive voltage-dependent Ca2+ channel in skeletal muscle membranes by cAMP- and Ca2+-dependent processes. Proceedings of the National Academy of Sciences of the USA. 1986;83:3733–3737. doi: 10.1073/pnas.83.11.3733. [DOI] [PMC free article] [PubMed] [Google Scholar]
- Imredy JP, Yue DT. Mechanism of Ca2+-sensitive inactivation of L-type Ca2+ channels. Neuron. 1994;12:1301–1318. doi: 10.1016/0896-6273(94)90446-4. [DOI] [PubMed] [Google Scholar]
- Kameyama M, Hescheler J, Mieskes G, Trautwein W. The protein-specific phosphatase 1 antagonizes the β-adrenergic increase of the cardiac Ca2+ current. Pflügers Archiv. 1986;407:461–463. doi: 10.1007/BF00652635. [DOI] [PubMed] [Google Scholar]
- Kasai H, Neher E. Dihydropyridine-sensitive and ω-conotoxin-sensitive calcium channels in a mammalian neuroblastoma-glioma cell line. The Journal of Physiology. 1992;448:161–188. doi: 10.1113/jphysiol.1992.sp019035. [DOI] [PMC free article] [PubMed] [Google Scholar]
- Klee WA, Nirenberg M. A neuroblastoma × glioma hybrid cell line with morphine receptors. Proceedings of the National Academy of Sciences of the USA. 1973;71:3474–3477. doi: 10.1073/pnas.71.9.3474. [DOI] [PMC free article] [PubMed] [Google Scholar]
- Kortekaas P, Wadman WJ. Development of HVA and LVA calcium currents in pyramidal CA1 neurons in the hippocampus of the rat. Developmental Brain Research. 1997;101:139–147. doi: 10.1016/s0165-3806(97)00059-x. [DOI] [PubMed] [Google Scholar]
- Kostyuk PG, Lukyanetz EA. Mechanisms of antagonistic action of internal Ca2+ on serotonin-induced potentiation of calcium currents in Helix neurones. Pflügers Archiv. 1993;424:73–83. doi: 10.1007/BF00375104. [DOI] [PubMed] [Google Scholar]
- Kostyuk PG, Lukyanetz EA, Doroshenko PA. Effects of serotonin and cAMP on calcium current in different neurones of Helix pomatia. Pflügers Archiv. 1992;420:9–15. doi: 10.1007/BF00378635. [DOI] [PubMed] [Google Scholar]
- Lai Y, Peterson BZ, Catterall WA. Selective dephosphorylation of the subunits of skeletal muscle calcium channels by purified phosphoprotein phosphatases. Journal of Neurochemistry. 1993;61:1333–1339. doi: 10.1111/j.1471-4159.1993.tb13626.x. [DOI] [PubMed] [Google Scholar]
- Laemmli UK. Cleavage of structural proteins during the assembly of the head of bacteriophage T4. Nature. 1970;227:680–685. doi: 10.1038/227680a0. [DOI] [PubMed] [Google Scholar]
- Lu YF, Hayashi Y, Moriwaki A, Tomizawa K, Matsui H. FK-506 a Ca2+/calmodulin-dependent phosphatase inhibitor inhibits the induction of long-term potentiation in the rat hippocampus. Neuroscience Letters. 1996;205:103–106. doi: 10.1016/0304-3940(96)12384-3. [DOI] [PubMed] [Google Scholar]
- Lukyanetz EA. Development of view about the voltage-operated calcium channels of membrane. Neurophysiology (Kiev) 1997a;29:56–69. [Google Scholar]
- Lukyanetz EA. Evidence for colocalization of calcineurin and calcium channels in dorsal root ganglion neurones. Neuroscience. 1997b;78:625–628. doi: 10.1016/s0306-4522(97)00020-1. [DOI] [PubMed] [Google Scholar]
- Lukyanetz EA. Diversity and properties of Ca2+ channel types in NG108-15 cells. Neuroscience. 1998 doi: 10.1016/s0306-4522(98)00057-8. in the Press. [DOI] [PubMed] [Google Scholar]
- Lukyanetz EA, Kostyuk PG. Two distinct receptors operate the cAMP cascade to up-regulate L-type Ca2+ channels. Pflügers Archiv. 1996;432:174–181. doi: 10.1007/s004240050121. [DOI] [PubMed] [Google Scholar]
- Lukyanetz EA, Piper TP, Dolphin AC, Sihra TS. Interaction between calcium channels and calcineurin in NG108-15 cells. The Journal of Physiology. 1996;494.P:79–80P. [Google Scholar]
- McPartlin AE, Barker HM, Cohen PTW. Identification of a third alternatively spliced cDNA encoding the catalytic subunit of protein phosphatase 2Bβ. Biochimica et Biophysica Acta. 1991;1088:308–310. doi: 10.1016/0167-4781(91)90069-x. [DOI] [PubMed] [Google Scholar]
- Mironov SL, Lux HD. Calmodulin antagonists and protein phosphatase inhibitor okadaic acid fasten the ‘run-up’ of high-voltage activated calcium current in rat hippocampal neurones. Neuroscience Letters. 1991;133:175–178. doi: 10.1016/0304-3940(91)90563-9. [DOI] [PubMed] [Google Scholar]
- Petit-Jacques J, Hartzell C. Effect of arachidonic acid on the L-type calcium current in frog cardiac myocytes. The Journal of Physiology. 1996;493:67–81. doi: 10.1113/jphysiol.1996.sp021365. [DOI] [PMC free article] [PubMed] [Google Scholar]
- Raufman JP, Lin JY, Raffaniello RD. Calcineurin mediates calcium-induced potentiation of adenylyl cyclase activity in dispersed chief cells from guinea pig stomach - futher evidence for cross-talk between signal transduction pathways that regulate pepsinogen secretion. Journal of Biological Chemistry. 1996;271:19877–19882. doi: 10.1074/jbc.271.33.19877. [DOI] [PubMed] [Google Scholar]
- Sambrook J, Fritsch EF, Maniatis T. Molecular Cloning: A Laboratory Manual. 2. New York: Cold Spring Harbor Laboratory, Cold Spring Harbor; 1989. pp. 16.32–16.36. [Google Scholar]
- Schmitt H, Meves H. Model experiments on squid axons and NG108-15 mouse neuroblastoma × rat glioma hybrid cells. The Journal of Physiology (Paris) 1995;89:181–193. doi: 10.1016/0928-4257(96)83635-7. [DOI] [PubMed] [Google Scholar]
- Sharkey J, Butcher SP. Immunophilins mediate the neuroprotective effects of FK-506 in focal cerebral ishemia. Nature. 1994;371:336–339. doi: 10.1038/371336a0. [DOI] [PubMed] [Google Scholar]
- Sihra TS, Nairn AC, Kloppenburg P, Lin Z, Pouzat C. A role for calcineurin (protein phosphatase-2B) in the regulation of glutamate release. Biochemical and Biophysical Research Communications. 1995;212:609–616. doi: 10.1006/bbrc.1995.2013. [DOI] [PubMed] [Google Scholar]
- Tarasenko AN, Kostyuk PG, Eremin AV, Isaev DS. Two types of low-voltage activated Ca2+ channels in neurones of rat laterodorsal thalamic nucleus. The Journal of Physiology. 1997;499:77–86. doi: 10.1113/jphysiol.1997.sp021912. [DOI] [PMC free article] [PubMed] [Google Scholar]
- Towbin H, Staehelin T, Gordon J. Electrophoretic transfer of proteins from polyacrylamide gels to nitrocellulose sheets: procedure and some applications. Proceedings of the National Academy of Sciences of the USA. 1979;76:4350–4354. doi: 10.1073/pnas.76.9.4350. [DOI] [PMC free article] [PubMed] [Google Scholar]
- Usuda N, Arai H, Sasaki H, Hanai T, Nagata T, Muramatsu T, Kincaid RL, Higuchi S. Differential subcellular localization of neural isoforms of the catalytic subunit of calmodulin-dependent protein phosphatase (calcineurin) in central nervous system neurons: Immunohistochemistry on formalin-fixed paraffin sections employing antigen retrieval by microwave irradiation. Journal of Histochemistry and Cytochemistry. 1996;44:13–18. doi: 10.1177/44.1.8543776. [DOI] [PubMed] [Google Scholar]
- Victor RG, Rusnak F, Sikkink R, Marban E, O'Rourke B. Mechanism of Ca2+-dependent inactivation of L-type Ca2+ channels in GH3 cells: Direct evidence against dephosphorylation by calcineurin. Journal of Membrane Biology. 1997;156:53–61. doi: 10.1007/s002329900187. [DOI] [PubMed] [Google Scholar]
- Wiederrecht G, Lam E, Hung S, Martin M, Sigal N. The mechanism of action of FK-506 and Cyclosporin A. Annals of the New York Academy of Sciences. 1993;696:9–19. doi: 10.1111/j.1749-6632.1993.tb17137.x. [DOI] [PubMed] [Google Scholar]
- Yakel JL. Calcineurin regulation of synaptic function: from ion channels to transmitter release and gene transcription. Trends in Pharmacological Sciences. 1997;18:124–134. doi: 10.1016/s0165-6147(97)01046-8. [DOI] [PubMed] [Google Scholar]
- Yamasaki Y, Onodera H, Adachi K, Shozuhara H, Kogure K. Alteration in the immunoreactivity of the calcineurin subunits after ischemic hippocampal damage. Neuroscience. 1992;49:545–556. doi: 10.1016/0306-4522(92)90225-q. [DOI] [PubMed] [Google Scholar]
- Yang J, Tsien RW. Enhancement of N- and L-type calcium channel currents by protein kinase C in frog sympathetic neurons. Neuron. 1993;10:127–136. doi: 10.1016/0896-6273(93)90305-b. [DOI] [PubMed] [Google Scholar]


