

Abstract
The properties of GABAA receptor-mediated spontaneous IPSCs generated in hippocampal dentate granule neurones were analysed using whole-cell voltage-clamp techniques in order to explore the functional consequences of the low number (6–12) and close proximity of synaptic contacts made by single GABAergic interneurones.
Spontaneous IPSCs (sIPSCs) occurred with a frequency of 14.0 ± 9.1 Hz (n = 31) and revealed a multi-modal positively skewed amplitude distribution (39.0 ± 19.8 pA, median values).
The variance of 10–90 % rise times and decay kinetics between IPSCs decreased with increasing peak amplitude. Larger amplitude events had significantly faster rise times, consistent with their site of generation being proximal to the soma. The decay kinetics of sIPSCs did not significantly change with amplitude.
Large amplitude sIPSCs occurred singularly or in discrete bursts, repeated regularly at low frequency. The rising phase of such sIPSCs were multi-phasic, composed of clear step-like inflections that were not a product of noise. The variability between the rising phase of individual sIPSCs was quantified by calculating their standard deviation, which produced fast rising (0.22 ± 0.05 ms time to peak, n = 16) functions with half-widths of 0.38 ± 0.10 ms, which declined to plateaux.
Computer simulations demonstrated that IPSCs with properties similar to those recorded experimentally could be generated by the linear summation of groups of temporally dispersed component events. Standard deviation functions of the rising phase of simulated IPSCs accurately described distributions of the temporal dispersion of unitary components.
The GABA uptake inhibitor (R)-N-[4,4-bis(3-methyl-2-thienyl)but-3-enl-yl] nipecotic acid (tiagabine) (10 μM, n = 12) significantly prolonged the decay of mIPSCs (6.5 ± 0.8 to 8.7 ± 1.0 ms, median values) and sIPSCs (6.2 ± 0.4 to 7.3 ± 1.2 ms, median values), but failed to alter the frequency of occurrence, 10–90 % rise times or peak amplitude of events. The application of flurazepam (30 μM, n = 7; 50 μM, n = 4) prolonged the decay of sIPSCs regardless of their amplitude.
These data indicate that sIPSCs are formed by the summation of unitary components that occur asynchronously and that GABA released from multiple sites has independent postsynaptic actions.
γ-Aminobutyric acid (GABA) is the major inhibitory neurotransmitter in the CNS (Mody, De Koninck, Otis & Soltesz, 1994). In the dentate gyrus of the hippocampal archicortex, axon terminals of identified GABAergic interneurones target specific postsynaptic domains, for example, the axon initial segment (Halasy & Somogyi, 1993; Han, Buhl, Lörinczi & Somogyi, 1993; Buhl, Halasy & Somogyi, 1994; Freund & Buzsáki, 1996). A low number (6–12) of spatially distributed synaptic contacts are made by the axon of an interneurone onto a single postsynaptic principal cell (Buhl et al. 1994). The invasion of an axonal arbor by an action potential may thus result in the release of neurotransmitter from a defined number of release sites contacting a single postsynaptic neurone (Edwards, Konnerth & Sakmann, 1990). This arrangement therefore provides a preparation suitable for the study of the dynamics of neurotransmitter release.
Descriptions of the properties of synaptic transmission in the CNS have principally been based on a model of synaptic transmission proposed for the neuromuscular junction (NMJ). At this synapse motor nerve evoked postsynaptic potentials (PSPs) (multi-quantal or composite PSPs) are composed of integer multiples of the mean amplitude of spontaneously occurring PSPs (uni-quantal or unitary PSPs) (del Castillo & Katz, 1954a, b; Katz & Miledi, 1965c). At the NMJ the time course of transmitter release has been estimated using a number of mathematical approaches (Katz & Miledi, 1965a, b, c; Barrett & Stevens, 1972; Van der Kloot, 1988), and it has been concluded that the same stochastic process defines the content and timing of transmitter release. Recently, similar techniques have been employed for central excitatory synapses, but no estimate of the time course of neurotransmitter release has been made for inhibitory synapses. At central excitatory synapses, under conditions of reduced release, the time course of neurotransmitter release has been described by the trial to trial variation in the latency of excitatory postsynaptic currents (EPSCs) in response to electrical stimulation of an axon or between pairs of neurones (Isaacson & Walmsley, 1995; Geiger, Lübke, Roth, Frotscher & Jonas, 1997). The time course of transmitter release has also been estimated from a comparison of the kinetics of unitary and composite EPSCs in cultured neurones (Diamond & Jahr, 1995). Moreover, the component members of composite EPSCs have been revealed by manipulations of the extracellular environment (Isaacson & Walmsley, 1995). Taken together these data are consistent with the notion that at central excitatory synapses the timing of transmitter release is stochastic and is distributed over a submillisecond to millisecond time course. If individual release sites and postsynaptic processes operate independently, it follows that unitary and composite postsynaptic currents (PSCs) should be subject in a similar manner to alterations in parameters such as neurotransmitter clearance from the synaptic cleft (Barbour & Häusser, 1997). Moreover, pharmacological modulation should alter the properties of composite PSCs irrespective of the number of component unitary events. Yet, previous analyses of central GABAergic synapses have indicated that individual release sites may not have independent actions (Isaacson, Solis & Nicoll, 1993) and that pharmacological impairment of GABA transporters alters the kinetics of stimulus evoked composite inhibitory postsynaptic currents (IPSCs), but not those of miniature (unitary) IPSCs (mIPSCs) (Poncer, Durr, Gähwiler & Thompson, 1996).
Here we demonstrate that the asynchronous release of neurotransmitter on a submillisecond time scale determines the time course of spontaneous IPSCs (sIPSCs) in adult rat dentate granule neurones. By recording the composite make-up of sIPSCs at near physiological temperatures, we investigate how the kinetics of sIPSCs are formed and how modulatory agents influence sIPSCs of different amplitudes. Furthermore, we demonstrate that an inhibitor of GABA transport has an effect on the decay kinetics of composite and unitary IPSCs.
METHODS
Slicing and recording procedures
Adult rats (>60 days old, 300–400 g) were anaesthetized with sodium pentobarbitone (60 mg kg−1i.p.) and decapitated, and the brain removed and immersed in cold (<4°C) artificial cerebrospinal fluid (ACSF) of composition (mM): 126 NaCl, 2.5 KCl, 2 CaCl2, 2 MgCl2, 26 NaHCO3, 1.25 NaH2PO4 and 10 glucose (Otis & Mody, 1992). The tissue block was sectioned (Vibratome, Lancer Series 1000, Technical Products International Inc., St Louis, MO, USA) at a thickness of 450 μM in the coronal plane. Brain slices were sagitally hemisected and stored in warm (∼32°C) continuously aerated (95 % O2, 5 % CO2) ACSF. When required, slices were individually transferred to the recording chamber and immobilized between pieces of lens tissue weighted with small platinum bars. The bath was perfused with warm, aerated ACSF (34.5–36.5°C, unless otherwise stated; measured via a miniature thermocouple placed within 5 mm of the slice), which contained the broad spectrum ionotropic glutamate receptor antagonist kynurenic acid (2 mM).
Whole-cell recordings were obtained with patch electrodes pulled (Narishige, PP-38, Tokyo) from filamented borosilicate glass capillaries (KG-35, 1.5 mm o.d., Garner Glass, Claremont, CA, USA). Electrodes were filled with (mM): either 130 caesium gluconate or 130 caesium methylsulphate, 20 Hepes, 5 CsCl and 2 MgCl2. All solutions were titrated to a pH of 7.2–7.4 with CsOH and had total osmolarity of 285–315 mosmol l−1. Recordings were made with an Axopatch-1D amplifier (Axon Instruments). Series resistance and whole-cell capacitance were estimated by the nulling of fast current transients evoked at the onset and offset of brief (5–7 ms) 5 mV voltage-command steps. The estimated series resistance of the recordings reported here was 10.39 ± 2.37 MΩ (range 6–16 MΩ) with whole cell capacitance of 13.62 ± 2.36 pF. Series resistance compensation of 60–80 % was employed and the amplifier gain set to 5 mV pA−1 in the presence of lag values of 6–8 μs. Throughout the experiment apparent series resistance was repeatedly measured, and if an increase of more than 30 % occurred, the recording was discontinued. The outputs of the amplifier were filtered (DC-10 kHz, −3 dB down point, Bessel filter of the amplifier), digitized (44 kHz, Neurocorder, Cygnus Technology Inc., Delaware Water Gap, PA, USA) and stored in pulse-code modulated format on videotape. Dialysis of the recorded neurones with the intrapipette solutions detailed above resulted in the recording of outward spontaneous PSCs at holding potentials of 3 ± 4 mV (n = 40), and inward at holding potentials of −68 ± 3 mV (n = 6). These currents were blocked by the application of bicuculline methiodide (30 μM) and, therefore, represent spontaneous GABAA receptor-mediated IPSCs.
Data analysis
Off-line current recordings were low-pass filtered (8 pole Bessel; FLA-01, Cygnus Technology Inc. or 902, Frequency Devices, Haverhill, MA, USA) and digitized (DT-2821, Data Translation, Marlborough, MA, USA). The rate of digitization and filter −3 dB down settings were varied as: digitization 2–5 kHz, filter 1 kHz; digitization 10–20 kHz, filter 2–3 kHz and digitization 50 kHz, filter 10 kHz. Individual IPSCs were extracted from filtered continuous current records using an event detection program (CDR; Strathclyde Electrophysiology Software, J. Dempster, University of Strathclyde, Glasgow, UK) running on an IBM compatible personal computer. Event detection criteria were set as previously reported (Otis & Mody, 1992; Soltesz, Smetters & Mody, 1995). Detected events were always singularly inspected, and apparent spurious and multiple detections of large events were rejected. Detected events were analysed using the NSAN program (Y. De Koninck & I. Mody) and in-house software; in each neurone between 350 and 5500, typically ∼1500, events were used for analyses. For an analysis of peak amplitude, the mean value of three sample points centred on the detected maximal value was taken with relation to a mean baseline value preceding the event. Only events separated by >4 ms were considered, as this time interval both allowed a full evolution to peak of (estimated >98 %) currents and obviated the inaccurate amplitude measurement of closely separated events. Rise time (10–90 %) measurements were made from a time point just preceding a point set 3–10 ms following the onset of events; manual inspection of traces dictated the absolute value, and multiple events within these time windows were rejected.
The decay process of IPSCs was estimated from single and averaged traces. For these analyses events were selected solely by a lack of contamination of the decay phase by subsequent events. In the case of single traces, single exponential terms were routinely used to approximate the decay of each event; the use of more exponential terms appeared inappropriate as the signal to noise ratio of the smallest events was insufficient to allow a clear description of the decay process. In the case of averaged currents, however, we tested both mono- and biexponential approximations of the decay process as previously described (Otis & Mody, 1992; Soltesz & Mody, 1995), using non-linear least square methods with an equation of the form:
| (1) |
where I(t) is current as a function of time; A1 and A2 are scaling factors (pA) and τD1 and τD2 are the two decay time constants (ms).
The improvement of fit by the inclusion of a second exponential function was ascertained with F tests, conducted with a value of α of 0.01 to favour parsimony. Such improvement was further examined with the ratio of the sum of square errors (SSEs):
| (2) |
where SSE1 and SSE2 refer to SSEs of an approximation of the decay process with mono- or biexponential terms, respectively (Soltesz & Mody, 1995). With this method a 50 % decrease in SSE from SSE1 to SSE2 produces a value of 1.
A measure of the variability between the rising phase of events was described only for segments of continuous data that satisfied the following criteria: (i) instead of an exponential distribution of sIPSC interevent intervals, distribution approached a single or the sum of two Gaussian distributions, possibly indicating their origin from a point source with a regular or burst-like discharge pattern; and (ii) sIPSCs had peak amplitudes well isolated from other detected events (see Fig. 1). For sIPSCs sampled at high rates (50 kHz) variability was described by aligning each event, by eye, to the first sample point of the initial deviation from baseline and calculating, point by point, the mean and standard deviation of 20–250 individual events (Jack, Redman & Wong, 1981).
Figure 1. Patterns of spontaneous IPSC generation in dentate granule neurones.

A, large amplitude spontaneous IPSCs occur regularly at low frequency. A continuous trace (a) has been selected from a 3 min recording period illustrated graphically in b. Over this time period, the pattern of large amplitude sIPSC activity did not vary markedly (each IPSC is represented by a single open symbol); sIPSCs with amplitudes greater than a threshold value (dashed line) occurred regularly at a low frequency. The continuous line represents a four point running average showing a lack of burst structure. The random occurrence of all sIPSCs is demonstrated by the exponentially distributed interevent interval histogram (hatched bars), compiled by the log binning of interevent intervals (c) and drawn on a square root ordinate. The continuous line represents an exponential probability density function fitted to the distribution with a mean of 228 ms. The interevent intervals of suprathreshold sIPSCs approach a Gaussian distribution when linearly binned (50 ms per bin) (d). B, large amplitude sIPSCs can occur in discrete bursts repeated at low frequency. This cell was analysed as in A, but shows that large amplitude suprathreshold events (b, dashed line) occur in discrete bursts, that are reflected by the peaked nature of the four point running average of sIPSCs. The interevent intervals of all sIPSCs is exponentially distributed with a mean of 49.9 ms (c), whilst the interevent intervals of suprathreshold sIPSCs demonstrate two discrete distributions fitted with the sum of two Gaussian functions with means of 38.4 and 800 ms, corresponding to interevent intervals within and between bursts, respectively (d). All IPSCs were filtered at 3 kHz and digitized at 20 kHz.
A mathematical comparison of the effects of a modulatory agent on the waveform of spontaneous IPSCs (sIPSCs) of different amplitudes was implemented using a Fourier transformation method (Van der Kloot, 1988; Diamond & Jahr, 1995). A release rate function was constructed by the point by point division of discrete Fourier transforms (FTs) of either averaged events or fitted schemes to averaged data of sIPSCs of relatively small and large amplitudes (Fig. 11). The resultant Fourier transform (Fres) was returned to the time domain by taking the inverse FT to yield IFres (Van der Kloot, 1988; Diamond & Jahr, 1995). For the graphical indication of the release period imaginary components of IFres were removed. A comparison of sIPSCs drawn from different experimental conditions was made by convolving this IFres with the FT of small sIPSCs subjected to the modulatory agent. This product was then returned to the time domain by inverse Fourier transformation (Van der Kloot, 1988; Isaacson & Walmsley, 1996). The waveform was then compared with that of large amplitude sIPSCs recorded from the period of exposure to the modulatory agent. These analyses were implemented in Mathematica (Wolfram Research, Champaign, IL, USA).
Figure 11. The benzodiazepine flurazepam slows the decay kinetics of sIPSCs irrespective of their amplitude.

A, amplitude distributions of sIPSCs collected under control conditions (^) and in the presence of flurazepam (30 μM) drawn on a percentage probability ordinate. The hatched areas represent the amplitude regions selected for further analysis, and describe amplitudes of less than 50 pA and greater than 500 pA. B, averaged traces drawn form the indicated areas of the amplitude distribution, following peak scaling of the relatively smaller averages, under control (Ba) and flurazepam (Bb). The insets represent release rate functions derived from Fourier analysis of the averaged traces; note the sharp rise and slower decay of these functions. C, the waveform of the convolution product of the release rate function under control conditions with the Fourier transform of the average of small amplitude sIPSCs collected in flurazepam matches well the time course of the average of the large amplitude sIPSCs recorded in flurazepam. Waveforms have been peak scaled and aligned at peak amplitude. Spontaneous IPSCs were low pass filtered at 3 kHz and sampled at 20 kHz.
Statistical analyses included a Student's paired t test; one-way analysis of variance using Dunnett's multiple comparison test; or a Kruskal-Wallis test if equal variance conditions were not satisfied with Bartlett's test. The level of significance was set to P = 0.05. All numerical values are given as means ±s.d., unless otherwise stated.
Simulation of individual and compound synaptic currents
Miniature IPSCs were simulated as previously described in detail (De Koninck & Mody, 1994), using a simple three state model (C ⇌ O ⇌ C). We selected rate constants that produced bursts of single channel activity that led to ensemble simulated mIPSCs with kinetics similar to those observed experimentally. Channel amplitude was set to 1.5 pA, and pseudorandom noise (0.1–0.5 pA) was added to individual traces. Each simulated mIPSC was constructed by the addition of forty traces aligned with exponentially distributed first latencies. The time interval for simulations was either 0.05 or 0.02 ms. To simulate the asynchronous summation of mIPSCs we produced a pseudorandom series of numbers with boundary conditions representing a single to a variable maximum of sample points. Each member of this series was then used to offset an individual simulated mIPSC in time, which had been selected, pseudorandomly, from a series of simulated mIPSCs. The summation of groups of mIPSCs (n = 2–10) with reference to the first occurring mIPSC of each group, therefore, produced composite events composed of the asynchronous addition of individual components.
Anatomical techniques
Measurements were made from biocytin filled axons of a light and electron microscopically identified axo-axonic and basket cell of the dentate gyrus, obtained from animals of a similar age to those used for electrophysiological studies. The morphological details and methods used for the recording and processing of these cells have been previously described in detail (Han et al. 1993 (basket cell, 120694) and Buhl et al. 1994 (axo-axonic cell, 210992)). The identity of both cells had been ascertained with random electron microscopic sampling of their postsynaptic target elements (Halasy & Somogyi, 1993; Buhl et al. 1994). The specimens were re-evaluated by making camera lucida reconstructions (× 1500) of several bouton-containing terminal axons, which were oriented radially in tissue sections (to minimize errors in the z-plane). Interbouton distances (from the centre of each bouton) were measured from camera lucida reconstructions using MacStereology software.
Solutions and drugs
Before each experiment Flurazepam and (R)-N-[4,4-bis(3-methyl-2-thienyl)but-3-enl-yl] nipecotic acid (tiagabine; J. Lambert, University of Aarhus, Aarhus, Denmark and Novo Nordisk, Bagvaerd, Denmark) were diluted from stock solutions of 3 and 0.2 mM, respectively. The stock solutions were protected from light and the tiagabine stock discarded weekly. Tetrodotoxin (TTX) was obtained from Calbiochem, and kynurenic acid and bicuculline methiodide from Sigma; all salts were obtained from Fluka Chemie. All drugs were added to the perfusion medium at known concentrations.
RESULTS
Whole-cell voltage-clamp recordings revealed a great cell to cell diversity in the amplitude distribution, frequency and pattern of occurrence of sIPSCs (Fig. 1). In each cell these parameters varied over time; however, in a given time epoch (1–10 min) that we have used for analysis these parameters appeared stable (Fig. 1A and B). The frequency of occurrence of sIPSCs recorded at positive holding potentials (3 ± 4 mV) was 14.0 ± 9.1 Hz; events demonstrated a median peak amplitude of 39.0 ± 19.8 pA, with a lower quartile of 26.5 ± 10.6 and an upper quartile of 75.6 ± 65.4; values for 10–90 % rise time and estimated decay time constants are given in Table 1 and Fig. 9. The amplitude distribution of sIPSCs appeared to be multi-modal (Fig. 2A). In order to compare the kinetic properties of IPSCs generated in different cells (cf. Table 1 and Figs 8 and 9) we have divided the events into discrete amplitude bins, the size of which depended upon the holding potential and experimental condition: sIPSCs recorded at positive holding potentials were divided into 75 pA bins, whilst those recorded at negative holding potentials (−68 ± 3 mV) were divided into 40 pA bins and miniature IPSCs, recorded at positive holding potentials, into 25 pA bins (dashed lines in the graphs of Fig. 2).
Table 1.
Properties of averaged IPSCs decay processes
| Amplitude (pA) | τsingle (ms) | τfasta (ms) | τslowa (ms) | SSE ratioa, b | Fraction fasta, c | Biexponential decaysa (% of cells) | |
|---|---|---|---|---|---|---|---|
| Spontaneous IPSCs, positive holding potentials | |||||||
| 0-75 | All | 6.4 ± 1.2 | 2.2 ± 1.9 | 6.7 ± 1.8 | 6.4 ± 8.2 | 0.26 ± 0.16 | 20 |
| Fastd | 5.3 ± 1.0 | 1.3 ± 1.4 | 6.8 ± 1.6 | 4.7 ± 7.9 | 0.19 ± 0.11 | 60 | |
| 75-150 | All | 6.5 ± 1.3 | 2.5 ± 1.7 | 9.3 ± 5.6 | 7.6 ± 7.9 | 0.32 ± 0.21 | 71 |
| Fast | 6.3 ± 1.3 | 1.9 ± 1.1 | 7.4 ± 1.6 | 6.8 ± 8.0 | 0.22 ± 0.12 | 85 | |
| 150-225 | All | 6.4 ± 1.1 | 2.5 ± 1.5 | 8.2 ± 2.5 | 4.6 ± 18.7 | 0.32 ± 0.17 | 100 |
| Fast | 6.4 ± 1.2 | 2.5 ± 1.5 | 8.5 ± 4.2 | 16.2 ± 18.6 | 0.32 ± 0.21 | 94 | |
| 225-300 | All | 6.8 ± 1.5 | 2.7 ± 1.6 | 10.1 ± 5.7 | 27.0 ± 25.8 | 0.39 ± 0.25 | 100 |
| Fast | 6.7 ± 1.6 | 2.6 ± 1.5 | 9.1 ± 5.2 | 30.6 ± 33.5 | 0.38 ± 0.21 | 100 | |
| 300-375 | All | 7.3 ± 1.9 | 3.0 ± 1.9 | 12.3 ± 5.9 | 40.3 ± 26.3 | 0.45 ± 0.26 | 88 |
| Fast | 7.2 ± 2.0 | 2.5 ± 1.8 | 9.8 ± 3.8 | 41.9 ± 34.9 | 0.37 ± 0.24 | 100 | |
| 375-450 | All | 7.4 ± 2.0 | 2.9 ± 1.3 | 10.1 ± 2.9 | 36.1 ± 51.7 | 0.40 ± 0.13 | 100 |
| Fast | 7.2 ± 2.0 | 2.9 ± 1.4 | 10.0 ± 3.1 | 40.8 ± 54.3 | 0.42 ± 0.12 | 100 | |
| Miniature IPSCs, positive holding potentials | |||||||
| 9-34 | All | 7.1 ± 1.0 | 0.5 ± 1.9 | 6.6 ± 0.9 | 1.9 ± 1.5 | 0.18 ± 0.04 | 36 |
| Fast | 6.6 ± 1.0 | 0.5 ± 1.4 | 6.8 ± 1.1 | 1.9 ± 1.8 | 0.17 ± 0.08 | 72 | |
| 34-59 | All | 7.4 ± 0.9 | 1.5 ± 1.7 | 8.5 ± 1.2 | 2.7 ± 1.7 | 0.23 ± 0.12 | 100 |
| Fast | 7.3 ± 0.9 | 1.1 ± 1.1 | 8.2 ± 1.3 | 2.7 ± 1.6 | 0.21 ± 0.09 | 90 | |
| 59-84 | All | 7.3 ± 1.3 | 2.6 ± 1.7 | 8.8 ± 1.8 | 1.1 ± 0.4 | 0.32 ± 0.15 | 100 |
| Fast | 7.5 ± 1.4 | 2.6 ± 1.1 | 8.6 ± 2.1 | 1.0 ± 0.5 | 0.28 ± 0.10 | 83 | |
| Spontaneous IPSCs, negative holdingpotentials | |||||||
| 0-40 | All | 3.4 ± 0.4 | 1.6 ± 0.6 | 4.2 ± 0.5 | 1.3 ± 0.8 | 0.37 ± 0.27 | 83 |
| Fast | 3.2 ± 0.4 | 0.9 ± 0.4 | 3.5 ± 0.4 | 1.4 ± 0.7 | 0.23 ± 0.09 | 83 | |
| 40-80 | All | 3.7 ± 1.1 | 2.2 ± 0.3 | 5.5 ± 0.9 | 3.4 ± 3.3 | 0.57 ± 0.28 | 80 |
| Fast | 3.7 ± 1.1 | 2.0 ± 0.3 | 5.0 ± 0.9 | 12.8 ± 20.9 | 0.46 ± 0.27 | 100 | |
| 80-120 | All | 3.6 ± 0.8 | 2.6 ± 0.7 | 7.7 ± 3.5 | 4.2 ± 3.6 | 0.71 ± 0.22 | 100 |
| Fast | 3.5 ± 0.8 | 2.6 ± 0.8 | 7.2 ± 3.4 | 4.3 ± 4.7 | 0.71 ± 0.20 | 100 | |
Numerical values are means ±s.d.
Events in which the fit was significantly improved by the addition of a second exponential function (F test, P < 0.01).
SSE ratio = (SSEsingle - SSEdouble)/SSEdouble.
Amplitude fraction of first exponential function.
10–90 % rise time of less than 1.0 ms. τsingle, time constant obtained from monoexponential fits; τfast and τslow, the two time constants of biexponential fits.
Figure 9. A dissociation between the rise and decay kinetics of spontaneous and miniature IPSCs with amplitude.

Aa, the decay process of sIPSCs from different cells has been approximated with monoexponential terms, each point representing the mean decay time constant relative to the mean amplitude for events within the amplitude bins shown in Ab. The vertical lines represent the standard deviation of decay time constants. For all but one cell, points calculated for different amplitude bins are joined with dashed lines. The points joined by a continuous line represent the only neurone demonstrating an increase in mean decay time constant with event amplitude. Note that the standard deviation of decay time constants associated with smaller amplitude events is greater than those for relatively larger events. Ab, the mean values of decay time constants were calculated and expressed as a fraction (hatched bars +s.d.) of the decay time constant of events drawn from the smallest amplitude bin. The pooled source data were subjected to ANOVA; significant difference between the smallest amplitude group and greater amplitude bins is shown; *P < 0.05. Ba, a similar analysis has been conducted for the rise times of these sIPSCs. Note the initial decrease and then gradual increase in these values with increasing amplitude. Bb, this effect is shown more clearly with pooled data where a significant (***P < 0.001; **P < 0.01) acceleration of rise times is demonstrated for three amplitude bins relative to the smallest sIPSCs. The rise times of events in the two largest amplitude bins were, however, not different from those in the smallest amplitude bin. Ca and b, a similar analysis for mIPSCs recorded in the presence of tetrodotoxin (1 μM) demonstrates no relationship between decay time constant and amplitude. Da and b, a strong inverse relationship was, however, demonstrated between rise time and amplitude, so that for pooled data, events in relatively larger amplitude bins had significantly faster rise times (**P < 0.01) than those of the smallest mIPSCs.
Figure 2. Amplitude distribution of spontaneous and miniature IPSCs.
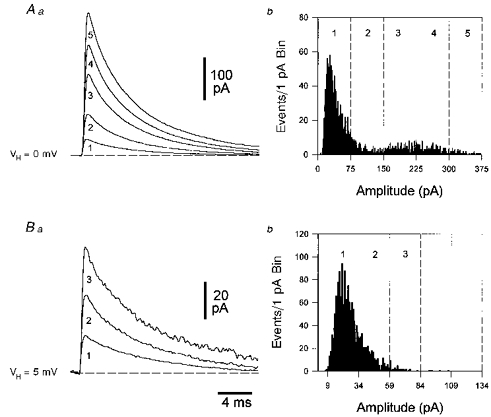
A, the amplitude distribution of sIPSCs is multi-modal. To facilitate comparison of sIPSC properties between and within neurones, detected sIPSCs were divided into amplitude bins of 75 pA increments (dashed lines in b). The averaged sIPSCs, selected by a lack of contamination of decay phases, for each amplitude bin are illustrated in a. The histogram (b) demonstrates the wide and multi-modal distribution; note, the numerically prevalent peak occurs within the lowest amplitude bin (1). B, the amplitude distribution of miniature IPSCs is unimodal. In a different neurone, IPSCs recorded in the presence of tetrodotoxin (1 μM) had a relatively narrow amplitude distribution that shows a positive skew. Events have been divided into 25 pA amplitude bins, incremented from 9 pA. All IPSCs were filtered at 3 kHz and digitized at 20 kHz.
Figure 8. The decay kinetics of sIPSCs of different amplitudes.

A, average traces obtained from the amplitude bins shown by dashed lines in B illustrate the waveform of sIPSCs with increasing amplitude. B, the scatter plot demonstrates the relationship between the approximated monoexponential decay time constant of individual sIPSCs and amplitude; note the bell shaped relationship. Those events with 10–90 % rise times of greater than 1.0 ms are represented with open symbols. In the same graph a cumulative relative probability plot reveals that the vast majority of events have a decay time constant < 10 ms. C, average traces obtained from the time bins described, but made from traces with 10–90 % rise time of less than 1.0 ms and scaled to the peak of the largest average event; the thicker lines represent fits to the decays of these events with mono- or biexponential terms. D, peak-scaled averaged traces obtained from the smallest and largest amplitude bins of C. The similarity of the time course of averaged events of different amplitude is more clearly shown in the semi-logarithmic plot shown as an inset, where averaged events are shown peak scaled and peak aligned. All sIPSCs were low pass filtered at 3 kHz and sampled at 20 kHz.
The most frequent component of each sIPSC amplitude distribution was found to be similar to the amplitude distribution of miniature IPSCs recorded in the presence of TTX (1 μM) (compare the first peak of Fig. 2A with that the distribution in Fig. 2B). The amplitude distribution of mIPSCs, recorded in the presence of TTX, was found to be relatively narrow and uni-modal, but positively skewed (Fig. 2B). The frequency of occurrence of mIPSCs was 11.4 ± 6.0 Hz, with an average median peak amplitude of 22.8 ± 2.3 pA, a lower quartile of 17.7 ± 1.6 pA, and an upper quartile of 30.6 ± 3.8 pA (n = 14); values for 10–90 % rise time and estimated decay time constants are given in Fig. 9 and Table 1.
Asynchronous summation of sIPSCs
In several cells sIPSCs of large amplitude occurred individually (Fig. 1A) or in discrete bursts (Fig. 1B) repeated at low frequency. Detailed examination of these isolated events revealed marked step-like inflections in their rising phase (Fig. 3Aa), indicating the composite nature of these sIPSCs. Individual sIPSCs sampled at a high frequency (50 kHz) were inspected by eye when displayed at high temporal resolution (Fig. 3Ab), and inflections were marked on hard-copy print outs. Step-like inflections, (Fig. 3Ab), were found to occur close to integer divisions of the peak amplitude of sIPSCs, suggesting that composite sIPSCs may be formed by the summation of integer numbers of unitary IPSCs. We therefore divided the amplitude of sIPSCs into evenly spaced divisions chosen across consecutive sIPSCs to lie close to obvious inflection points; we refer to each division as a transition level (dotted lines in Fig. 3Aa). The number of clear inflection points in the rising phase of composite sIPSCs was counted (Katz & Miledi, 1965c; Isaacson & Walmsley, 1995). In most cases inflections were found to occur close to each transition level. Occasionally we failed to observe an inflection point at each amplitude division, but rather the waveform crossed two such transitions before a clear inflection was observed. Rarely this occurred for three or more transitions (Fig. 3Ba). Next we plotted the number of transitions crossed between inflection points to produce a smoothed (2 adjacent points) three dimensional relationship. According to this plot each single transition is typically followed by a single, or less commonly more, transition crossing(s) irrespective of order in the composite event. Such distributions were found to be broadly symmetrical and indicated that transitions between levels were not grouped in a particular pattern, for example double to double transition crossings (Fig. 3Bb).
Figure 3. Direct observation of the component content of spontaneous IPSCs.
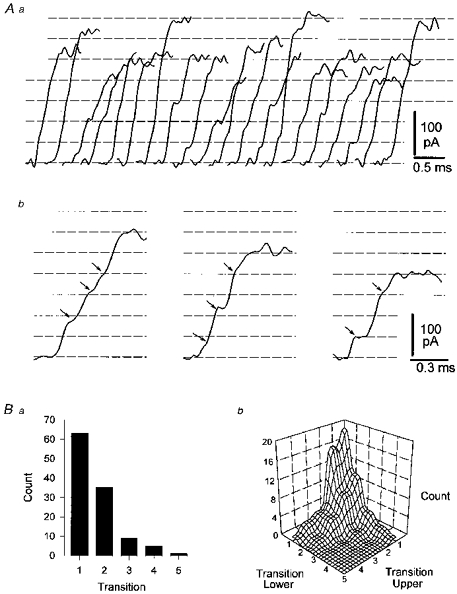
A, the rising phase of consecutively occurring spontaneous IPSCs selected by amplitude and pattern of occurrence (see text for details). These events probably arise from the activity of a single interneurone (Aa). The inflection points in the rising phase of individual sIPSCs are shown more clearly at a faster time base (Ab), where each apparent inflection point is marked with an arrow. Across events, these inflection points occur at amplitudes that fall close to equally spaced dashed horizontal lines determined by eye. Each horizontal line has been defined as a transition level. The number of transition levels crossed by the rising phase of an individual event before another clear inflection point was apparent in the waveform was counted and plotted in Ba. From the base of each sIPSC, the transition levels crossed between clear inflection points were counted. In this analysis lower and upper transition levels are, for example from the base of an event, the first (lower) to second (upper), second (lower) to third (upper) transition levels (Bb). Note, that single transition crossing components are in the majority (Bb). All IPSCs were low pass filtered at 10 kHz and sampled at 50 kHz.
Because the rising phase of sIPSCs is clearly subject to contamination by noise, we investigated the waveform that would result from superimposing noise taken at times just preceding recorded sIPSCs onto smooth exponential rising functions, with time constants (τrise = 0.1–0.5 ms) similar to those of sIPSCs (Fig. 4C). In sequential trials a pattern of inflections similar to those observed experimentally could not be produced by the simple addition of noise to growth functions. That is not to say that inflections cannot be produced by this procedure, indeed this was observed in particular near the peak of slowly rising responses (Fig. 4C), but the waveforms of events produced in this way were clearly different form those recorded experimentally (compare Figs 3Aa and B and 4C).
Figure 4. Simulated synaptic currents describe the component nature of spontaneous IPSCs.

A, the asynchronous linear summation of simulated mIPSCs approximates the waveform of recorded composite sIPSCs. Groups of simulated mIPSCs (Aa), which have been dispersed over time, pseudo-randomly, to a maximum of 0.4 ms are linearly summed to produce a series of sIPSCs (half-tone lines) that differ in the kinetics of their rising phases around a mean value (full tone line) (Ab). The interval between the horizontal dashed lines corresponds to the mean amplitude of simulated mIPSCs. B, clear inflection points can be produced with these procedures in the rising phase of simulated composite IPSCs (maximal degree of temporal dispersion, 0.7 ms), note that inflection points lie close to, but do not exactly match, the mean amplitude of unitary events (dashed horizontal lines). C, noise alone cannot reproduce the pattern of inflection points similar to those revealed experimentally. Smooth exponential growth functions (half-tone lines with τrise = 0.5 ms) were generated and experimentally recorded noise was added to them. Note, that inflection points do not occur during the rising phase of the events but only at the peak. This noise near the peak of the events does not resemble the inflections recorded experimentally. Simulated synaptic currents were constructed as described in the text, using a time step of 0.02 ms.
The component nature of sIPSCs was further investigated by computer simulation. Simulated mIPSCs were produced by the summation of stochastic channel activity embedded in noise (Fig. 4Aa) (De Koninck & Mody, 1994). The absolute time of occurrence of each mIPSC was dispersed by less than 0.4 ms using a pseudo-random time series (Fig. 4Aa) and then groups of between two and ten mIPSCs were linearly summed to yield composite simulated IPSCs that varied in their absolute rise times around a mean value (Fig. 4Ab). If the maximal time dispersion between the occurrence of simulated mIPSCs was relatively long (>0.3 ms), clear inflection points could be observed in the rising phase of each event (Fig. 4B). Yet, the amplitude spacing of these inflection points lay close to, but rarely corresponded exactly with, the mean amplitude of simulated unitary mIPSCs, despite the use of a high probability of opening (Po) of the channels composing each simulated mIPSC (Po = 0.90–0.95).
The distribution of the timing of individual simulated mIPSCs used for the composition of simulated sIPSCs was approximated by calculating, point by point, the standard deviation of amplitude across many (40-120) simulated composite events. These standard deviation functions (SDFs) evolved with time rapidly to a peak and then declined to reach a plateau, the value of which was dependent upon Po (Fig. 5). Furthermore, the absolute magnitude of this function was found to be related to the number of unitary IPSCs that were summated to produce simulated sIPSCs (Fig. 5C). The half-width of these functions was found to be a good approximation of the maximal time offset of simulated unitary mIPSCs (Fig. 5D). This method, therefore, provides a simple means of estimating the temporal dispersion of events that form composite sIPSCs.
Figure 5. The temporal dispersion of simulated unitary events may be obtained from the variability between the rising phase of individual composite events.

A, the mean rising phase of averaged simulated composite events (40 traces) made up of groups of 8 unitary events with a high Po, dispersed over time, to a maximum of (from left to right) 0.0, 0.2, 0.3, 0.4, 0.5, 0.8 and 1.0 ms. The variability between individual events is described by the initial component of the waveform of standard deviation functions. B, standard deviation functions with similar kinetics can be revealed using the same procedures, but with a Po of channel opening set to 0.6. C, the amplitudes of the standard deviation functions increase, but kinetics of the initial component remain stationary for composite events composed of groups of 2, 4, 6, 8 and 10 unitary events with a maximum time dispersion of 0.3 ms. D, measurement of the half-width of the initial component of standard deviation functions revealed a time course close to that expected from the absolute maximal values of temporal dispersion used to form groups of simulated composite events regardless of the channel opening Po (Po = 0.6, ^ and Po = 0.95, •). Simulated synaptic currents were constructed as described in the text, using a time step of 0.02 ms.
Experimentally recorded sIPSCs, selected by the criteria outlined above and in Methods, were subjected to SDF analysis. Standard deviation analysis of selected sIPSCs, aligned at the first sample point during the event onset, yielded functions marked by an isolated initial peak, followed by a plateau component (Fig. 6). The initial component rose in 0.22 ± 0.05 ms and decayed more slowly, so that the half-width was 0.38 ± 0.10 ms (n = 16 neurones) (Fig. 6D). The properties of SDFs were different from cell to cell and clearly reflected the degree of variation between the rising phase of individual sIPSCs (compare Fig. 6A and B). In common with simulation, the absolute magnitude, but not the shape, of the SDF was found to be dependent upon the absolute amplitude of sIPSCs (Fig. 6C). This method, therefore, provides an adequate description of the asynchrony of the rising phase of sIPSCs, and by comparison with simulation suggests that the initial phase of these functions represents the time course of the release process.
Figure 6. Quantification of the variability between the rising phase of individual sIPSCs.

Alignment at the first sample point following event onset revealed the variability between the rising phase of consecutive sIPSCs from selected amplitude bins that varied around a mean value (white line). A, the point by point calculation of the mean (Aa) and standard deviation (Ab) revealed the asynchronous nature of transmitter release. B, in a different neurone, the variability between the rising phase of selected sIPSCs is, relatively, greater (Ba and b). C, the initial stages of the standard deviation function have similar kinetics regardless of the amplitude of sIPSCs in a given neurone. Individual traces from two adjacent amplitude bins (full and half-tone lines) have standard deviation functions with similar kinetics. D, lack of correlation between the mean peak amplitude of sIPSCs and the half-width (•) or the time to peak from the onset (▵) of the initial stage of standard deviation functions. Spontaneous IPSCs were low pass filtered at 10 kHz and digitized at 50 kHz.
The step-like inflections in the rising phase of individual sIPSCs may be formed as a consequence of the structure of the terminal axons of interneurones. In unitary inhibitory connections the synaptic boutons originating from a single presynaptic axonal arbor may either arise from several preterminal axon collaterals which converge onto the postsynaptic cell or, alternatively, may be provided by a single terminal branch (Buhl et al. 1994). In the first instance, any temporal asynchrony of release is likely to be affected by the separation of terminal boutons from the next mutual axonal branch point, whereas for the second scenario a temporal delay of release would be largely determined by conduction velocity and the average distance between neighbouring boutons on a single string of a terminal axon. To examine the latter possibility we have measured the distances between successive individual boutons from camera lucida reconstructions of biocytin filled terminal axons of an axo-axonic and basket cell (detailed graphical reconstructions were published in Halasy & Somogyi, 1993; Han et al. 1993; Buhl et al. 1994). Mean interbouton distances were found to be 4.62 ± 2.90 μm (n = 100 boutons) for the axo-axonic cell, and 4.89 ± 2.92 μm (n = 100 boutons) for the basket cell. We have calculated that an axonal conduction velocity of less than 0.25 m s−1 would be required, for these short interbouton distances, to produce step-like inflections that could be detected in ∼50 % of cases (3 sample points of 20 μs) with our electrophysiological methods. SDFs, however, indicate that component events are temporally dispersed on average by more than 0.2 ms; therefore, conduction velocities of less than 0.05 m s−1 would be required to produce these effects.
The effect of synchrony of summation on the decay kinetics of sIPSCs
In the light of our findings demonstrating the composite nature of sIPSCs we have compared the kinetics of the decay process of sIPSCs of different amplitudes and those of mIPSCs. The decay phase of sIPSCs, in the majority of cells, was well described with biexponential terms (Figs 7 and 8, and Table 1). We have chosen to fit to the averaged sIPSC waveform (Fig. 7 and Table 1), as noise was found to preclude an accurate analysis of the decay process for single sIPSCs across all amplitude ranges. To avoid inaccuracy inherent in the alignment of individual sIPSCs at base during ensemble averaging, we have also described the decay of the fastest rising sIPSCs in each neurone (10–90 % rise times of less than 1.0 ms; see Table 1 and semi-logarithmic plots in Fig. 7). As described previously (Otis & Mody, 1992), the decay process of sIPSCs was voltage dependent, with kinetics slowing upon membrane depolarization (Fig. 7 and Table 1). In the majority of cases at all membrane potentials investigated sIPSCs were significantly more accurately described with biexponential terms. The improvement of fit made with bi- over monoexponential terms increased with peak amplitude, accompanied by an increase in the fractional amplitude contribution made by the fast exponential function (Table 1). It is not clear if this represents a true increased tendency for biexponentiality or an increase in the fidelity of the fitting program, as the fitting of noisy functions using least mean squared methods is extremely vulnerable at low signal to noise ratios. A similar analysis revealed the decay process of mIPSCs to be well approximated with biexponential terms (Fig. 7C and Table 1), providing no grounds for a division of unitary and composite IPSCs by the exponential nature of their decay processes.
Figure 7. The average decay kinetics of spontaneous and miniature IPSCs are independent of amplitude.

Aa, spontaneous IPSCs recorded at a holding potential of −2 mV, selected solely by a lack of contamination of their decay phase, were divided into three amplitude ranges (0-75, 75–150, 150–225 pA); each trace represents the average of sIPSCs contained within each of these amplitude bins. Ab, spontaneous IPSCs taken from the smallest and largest amplitude bins were further divided by rate of rise, so that only events with a 10–90 % rise time of less than 1.0 ms were included and scaled. The semi-logarithmic plots demonstrate that biexponential decay functions accurately approximate the decay phase of these averaged sIPSCs following peak scaling and alignment. Ba and b, a similar analysis for sIPSCs recorded at a negative holding potential (-72 mV) revealed a more accurate approximation of sIPSC decay kinetics with biexponential terms. Traces have been inverted for clarity. Ca and b, miniature IPSCs recorded in the presence of tetrodotoxin (1 μM), and analysed in the same manner as described above, demonstrate the decay process of these events to be also independent of amplitude and accurately approximated with biexponential terms. Numerical values at the side of semi-logarithmic plots are time constants (ms) and fractional amplitude contribution of the fast decay time constant (τfast). IPSCs were low pass filtered at 3 kHz and digitized at 20 kHz.
We turned to computer simulation to learn if the temporal asynchrony of linearly summed unitary IPSCs would influence the decay of composite events. Simulations demonstrated that in absolute terms the decay kinetics of composite IPSCs formed by the grouping of unitary component IPSCs were similar to those of the underlying events despite a large variation in the number of unitary events (2–10) and the temporal dispersion (0–2.0 ms) used to form composite IPSCs (not illustrated). We did observe, however, a redistribution of the relative fraction and absolute value of fast and slow decay time constants with increasing composite IPSC amplitude in a manner similar to that observed experimentally, whilst an approximation of the decay processes with monoexponential terms remained steady. These data indicate that, although the absolute time course of the decay process is unaltered, approximations of the decay process are more consistent when made with monoexponential terms. Furthermore, these data highlight the caution that should be used when interpreting results obtained with parameter estimation using iterative methods. We have, therefore, approximated the decay kinetics of recorded sIPSCs in two ways, (i) by the fitting of individual sIPSCs with monoexponential terms and (ii) by fitting of averaged waveforms with mono- and biexponential terms, as described above, to raw and peak-scaled data (Table 1).
Experimentally we found the decay kinetics of the smallest amplitude sIPSCs to be more variable than those of larger sIPSCs (Figs 8 and 9). In an individual neurone the relationship between an approximation of sIPSC decay kinetics and peak amplitude was bell shaped (Fig. 8). The construction of ensemble averages of sIPSC waveforms or the calculation of mean values from decay time constant distributions for each amplitude bin, however, revealed in the vast majority of neurones that the average decay kinetics of sIPSC remained stable with amplitude (Fig. 9 and Table 1). In only one recorded neurone did the decay kinetics of sIPSCs consistently slow with increasing amplitude. In all other cells, this pattern was found to be stable across neurones, where no relationship was found between mean decay kinetics and sIPSC amplitude (Fig. 9A). Thus, the summation of unitary IPSCs does not lead to a prolongation of the decay process of sIPSCs. The low variance of the decay process of large amplitude sIPSCs, however, is consistent with the generation of these events from a relatively small number of synapses (see Discussion).
In a manner similar to the decay process of sIPSCs, the rise times of the smallest amplitude sIPSCs were found to be more variable than those of larger events (Fig. 9B). In contrast, we observed that across neurones the value of sIPSC rise times first decreased and then increased with increasing event amplitude (Fig. 9B). If large amplitude sIPSCs are made up of unitary sIPSCs, then these unitary events must be some of the fastest rising small amplitude events. Furthermore, we subjected mIPSCs to a similar analysis and found no relationship between approximated decay time constant and amplitude, but observed that the rise time of mIPSCs tended to decrease as amplitude increased (Fig. 9C and D) (Soltesz et al. 1995). Therefore, if any mIPSCs represent unitary components of composite sIPSCs, they will be some of the fastest rising and largest amplitude mIPSCs.
Transmitter uptake influences the kinetics of unitary and composite IPSCs
We compared the action of a GABA uptake inhibitor, tiagabine (10 μM), on the properties of spontaneous and miniature IPSCs (Fig. 10). Tiagabine produced a consistent and statistically significant (P < 0.05, Student's t test) prolongation of the decay process of both sIPSCs (6.2 ± 0.4 to 7.3 ± 1.1 ms, median values of distributions) and mIPSCs (6.5 ± 0.8 to 8.7 ± 1.0 ms, median values of distributions), when estimated from the distributions of decay kinetics or following fits to averaged records (Table 2 and Fig. 10). This prolongation of decay was not accompanied by significant changes in median 10–90 % rise time, median, lower or upper quartile of peak amplitude distributions, or mean frequency of occurrence (Table 2), indicating that unitary and composite events are modulated in a similar manner by pharmacological reduction of GABA clearance from the synaptic cleft.
Figure 10. A GABA uptake inhibitor prolongs the decay phase of spontaneous and miniature IPSCs.

A, average of sIPSCs obtained during the control period (Aa) and following the application of tiagabine (Ab), compiled over the amplitude bins detailed in the text. The thicker lines represent fits made with biexponential terms to the decay phase of the sIPSCs. B, cumulative relative probability plots showing the distribution of sIPSC decays as approximated with monoexponential terms under control (thin line) and following the application of tiagabine (thick line). C, the relative increase in the median time constant produced by tiagabine is shown for each cell, as is the average relative increase (hatched bar, control; open bar, tiagabine); the dashed line represents the cell illustrated. D, average of mIPSCs obtained during the control period (Da) and following the exposure to tiagabine (Db), compiled over the amplitude bins described in the text. The relatively thicker lines represent fits made with biexponential terms to the decay phase of the mIPSCs. E, cumulative relative probability plots showing the distribution of mIPSC decays as approximated with monoexponential terms under control (thin line) and following the tiagabine application (thick line). F, the relative increase in the median time constant produced by tiagabine is shown for each cell, as is the average relative increase (hatched bar, control; open bar, tiagabine); the dashed line represents the cell illustrated. All IPSCs were low pass filtered at 3 kHz and sampled at 20 kHz.
Table 2.
A GABA uptake inhibitor selectively prolongs the decay of IPSCs
| Peak amplitude (pA) | Rise timea (ms) | Interevent frequency (Hz) | All events τdecayb (ms) | Fast events τdecayb, c (ms) | ||
|---|---|---|---|---|---|---|
| Spontaneous IPSCs | Control | 27.5 ± 2.4 | 0.9 ± 0.2 | 11.3 ± 6.0 | 6.5 ± 0.6 | 6.2 ± 0.7 |
| (n = 8 cells) | Tiagabine | 27.7 ± 4.4 | 0.8 ± 0.2 | 7.6 ± 1.8 | 8.3 ± 1.7 * | 8.0 ± 1.7 * |
| Miniature IPSCs | Control | 21.5 ± 2.4 | 0.7 ± 0.4 | 9.5 ± 3.6 | 6.9 ± 0.6 | 6.7 ± 0.8 |
| (n = 4 cells) | Tiagabine | 22.2 ± 1.8 | 0.8 ± 0.5 | 8.4 ± 3.4 | 8.3 ± 1.3 * | 8.2 ± 1.2 * |
Numerical values are expressed as means ±s.d.
Median 10–90 % rise time.
Monoexponential decay time constant estimated from fits to averaged records.
Events with 10–90 % rise times < 1.0 ms.
Significant difference from control at P < 0.05 (Student's t test).
Modulation of sIPSCs properties by a benzodiazepine
The benzodiazepine flurazepam (FRZ) in common with similar agents (Mody et al. 1994) has been shown to prolong the decay process, but not alter the amplitude, of mIPSCs in dentate granule neurones (Poisbeau, Williams & Mody, 1997). We investigated the actions of FRZ (30 or 50 μM) on sIPSCs, in order to compare its action upon the decay kinetics of sIPSCs across the amplitude distribution of events (Fig. 11). At recording temperatures of 34.5–36.5°C, bath application of FRZ (30 μM) increased the estimated decay time constant of sIPSCs from 7.0 ± 0.7 to 10.3 ± 1.1 ms (n = 7, median values, P < 0.01), but failed to change their peak amplitudes (31.3 ± 6.1 to 31.6 ± 4.7, median values; 23.3 ± 4.3 to 24.3 ± 3.7 pA, lower quartile; 45.7 ± 11.5 to 44.2 ± 7.2, upper quartile) or 10–90 % rise times (0.60 ± 0.25 to 0.80 ± 0.37 ms, median values) (Fig. 11). A similar action of FRZ (50 μM, n = 4) was noted for sIPSCs recorded at temperatures of 28–29°C. The prolongation of decays (estimated by fits to averages) of sIPSCs across amplitude bins was found to be 28 % (of both the 0–75 pA, n = 11 and 75–150 pA bins, n = 11) and 19 % (150–225 pA, n = 5); in two neurones it was possible to follow this relationship to an amplitude bin of 675–750 where the percentage prolongation was 22 %. Indeed, across all amplitude bins the maximal prolongation of the decay was 33 %.
We constructed release rate functions (see Methods) from small and large amplitude sIPSCs under the control period (Fig. 11, hatched bars). These functions were then convolved with the FT of small amplitude sIPSCs (taken over the same amplitude range as control) to produce a waveform that represents an unbiased estimate of the waveform of large amplitude events present during the FRZ perfusion (Fig. 11). The decay processes of the averaged waveform of large amplitude events were found to be remarkably similar to those produced by this transformation (n = 5), indicating a parallel modulation by FRZ across amplitude ranges.
DISCUSSION
The main conclusions of the present study are (i) large amplitude sIPSCs are summed, asynchronously generated unitary events; (ii) the variability between the time course in the rising phase of individual composite IPSCs, which result from the activity of a single presynaptic neurone, revealed the time course of transmitter release to be complete in under a millisecond at near physiological temperatures; and (iii) an independence of action at each release site is consistent with the effects of a GABA uptake inhibitor and a GABAA receptor modulator on the decay process of IPSCs in a manner unrelated to their amplitude.
Sites of sIPSCs origin
GABAergic interneurones of the hippocampus have been divided into several groups according to the postsynaptic domain they innervate, amongst them those contacting principal cells at dendritic regions and those classes that make contacts at peri-somatic sites (Han et al. 1993; Buhl et al. 1994; Freund & Buzsáki, 1996). If subsynaptic kinetics of IPSCs produced by activation of such spatially segregated synapses were the same, then cable filtering of IPSCs would aid in the identification of the locations of synapses (Soltesz et al. 1995). In the present study, we have demonstrated the rise times of large amplitude composite sIPSCs to be on average faster than, or as fast as, those of unitary amplitude sIPSCs and mIPSCs and to have considerably less variance than those of relatively small sIPSCs. These data suggest that large amplitude events may be generated at defined sites relatively proximal to the soma. Additional evidence in favour of this notion is that (i) removal of the majority of the dendrites of dentate granule neurones, in neuro-protective media, does not alter the amplitude distribution of either mIPSCs or sIPSCs (Soltesz et al. 1995; Soltesz & Mody, 1995; I. Soltesz & I. Mody, unpublished observations); (ii) recordings in CA3 pyramidal cells have indicated that the majority of sIPSPs stem from interneurones that make contacts at proximal sites (Miles, Toth, Gulyás, Hájos & Freund, 1996); and (iii) minimal stimulation of dentritically projecting axons has been shown to evoke IPSCs with kinetics slower than those evoked by activation of peri-somatic axons in dentate granule neurones (Soltesz et al. 1995). It should be noted, however, that a trend but not a clear correlation has been demonstrated between PSC kinetics and the location of synapses on dendrites (Bekkers & Stevens, 1996), possibly as a consequence of a heterogeneity of subsynaptic receptors at different release sites (Isaacson & Walmsely, 1996; Auger & Marty, 1997). Taken together, however, the present data are consistent with the notion that large amplitude sIPSCs most probably stem from activity in interneurones contacting postsynaptic structures proximal to the somata of dentate granule neurones and so in all likelihood these events represent activities of basket and/or axo-axonic cells (Freund & Buzsáki, 1996).
Origin of the asynchrony between component IPSCs
We have demonstrated the composite nature of sIPSCs that probably arise from excitation of single interneurones. We suggest that the unitary components of composite events arise by the release of neurotransmitter from different sites, as summation of unitary IPSCs over a submillisecond time scale, i.e. times of the same magnitude as the rise time of unitary IPSCs, may only occur following multiple release processes from a single site if postsynaptic receptor occupancy is low at the peak of unitary PSCs (Hartzell, Kuffler & Yoshikami, 1975). Conversely, if receptor occupancy is high at the peak of unitary IPSCs, summation will not occur over this time frame unless release occurs at different sites (Tang, Margulis, Shi & Fielding, 1994; Auger & Marty, 1997). A high degree of receptor occupancy at the peak of mIPSCs has been inferred from (i) the pharmacological modulation of mIPSCs (Otis & Mody, 1992; De Koninck & Mody, 1994; Mody et al. 1994; Poisbeau et al. 1997); (ii) the relationship between the variance and mean amplitude of mIPSCs (De Koninck & Mody, 1994); (iii) the existence of quantal peaks, with low variance, in amplitude distributions of IPSCs (Edwards et al. 1990) generated in dentate granule neurones; and (iv) in the present study a failure of a GABA uptake inhibitor to increase the amplitude of spontaneous or miniature IPSCs. Taken together, evidence favours the notion of a high degree of receptor occupancy at the peak of small unitary IPSCs and indicates that composite IPSCs are generated from multiple release sites.
These arguments relate directly to the factors that generate the trial to trial variability in the rise time of sIPSCs. Such variability may be explained by presynaptic mechanisms: (i) variability in the timing of action potential, or wave of excitation, invasion of terminal axonal structures and/or (ii) variability in the timing of transmitter release at each site. Invasion of terminal arbors probably reflects an active propagation of action potentials (Katz & Mieldi, 1965a; Luscher & Shiner, 1990). Accordingly trial to trial variability will be a reflection of the cable structure and conditions of the axonal terminal. Descriptions of the axons of peri-somatically projecting interneurones, those most likely to be responsible for large amplitude sIPSCs (see above), indicate complex anatomical structures, with many terminal branches arising from >10th order axonal branch points. Moreover, these interneurones have been suggested to innervate up to 1000 neurones separated by more than 1 mm over the longitudinal axis of the hippocampus (Freund & Buzsáki, 1996). Axo-axonic cells have been demonstrated to produce terminal arbors characterized by candlestick-like terminal structures that establish several en passant synaptic junctions along the axonal initial segment of principal cells (Halasy & Somogyi, 1993; Buhl et al. 1994; Freund & Buzsáki, 1996). Basket cells innervate the proximal dendrites and/or the somata of postsynaptic target neurones. Terminal boutons from a single presynaptic GABAergic neurone contacting an individual principal cell may originate from either a single string of closely spaced en passant boutons or by synaptic junctions established by several converging presynaptic axonal branches (Buhl et al. 1994; Freund & Buzsáki, 1996; Miles et al. 1996). Despite this complex arrangement paired recordings have revealed the virtual absence of failures of transmission following the generation of a presynaptic action potential in cortical interneurones (Miles, 1990; Buhl et al. 1994; Tamás, Buhl & Somogyi, 1997). These data indicate a high safety factor of conduction and suggest in the light of modelling studies that trial to trial variability of the electrical invasion of release sites should be minimal (Goldstein & Rall, 1974; Jack et al. 1981; Luscher & Shiner, 1990). Our findings demonstrate that for these axons detectable levels of asynchronous release are apparent, as step-like inflections in the rising phase of individual large amplitude sIPSCs and from the structure of SDFs. The origin of this behaviour cannot, therefore, be easily explained by trial to trial variability in the timing of electrical invasion of release sites even if release occurs from synapses made by several terminal axon branches as may be the case for hippocampal basket and axo-axonic cells. For the case of all boutons arising from a single terminal branch we have calculated from the distribution of axo-axonic and basket cell interbouton distances that terminal axon conduction velocities in the order of the unlikely value of 0.05 m s−1 would have to be apparent, accompanied by a high degree of variability in conduction from trial to trial so that conduction velocity varies within a range of ∼0.01–0.05 m s−1. Clearly, the longer conduction times produced by the innervation of a single granule cell by more than one terminal branch of a single interneurone would provide more realistic support for the suggestion that conduction variability influences the time course of transmitter release at these synapses. Our data do not directly address this issue, and we therefore cannot discount the possibility that some long inflection points are a product of interterminal conduction delays. This would not have a pronounced impact upon the shape of SDFs, however, as these elements would contribute only at later times. We stress, however, that highly variable conduction velocity would have to exist in these terminal branches to produce the temporal dispersion of transmitter release revealed with our techniques.
Studies made at the NMJ have revealed that the time interval between action potential invasion of the nerve terminal and the appearance of extracellularly recorded excitatory junction potentials was variable under conditions of reduced neurotransmitter release (Katz & Miledi, 1965b; Barrett & Stevens, 1972; Van der Kloot, 1988). Such experiments led to the conclusion that the probabilistic nature of quantal neurotransmitter release and the timing of release were reflections of the same stochastic process (Katz & Mieldi, 1965b). At a central synapse it has been possible to demonstrate a similar process (Cope & Mendell, 1982a, b); moreover, it has been demonstrated that such a release function may be convolved with the average waveform of unitary events to yield the waveform of composite events (Isaacson & Walmsley, 1995). Following paired recording of a granule cell to basket cell connection in the young rat dentate gyrus the time course of transmitter release from dentate granule neurones has been estimated using these techniques under low and normal transmitter release probabilities (Geiger et al. 1997). As we did not detect any electrical sign of terminal activation preceding sIPSCs we have utilized the variability between composite events to yield an estimate of the time course of transmitter release by computing the variability between the rising phase of individual sIPSCs. This analysis revealed a function with a shape and kinetics similar to those demonstrated with first latency analysis made at near physiological temperatures (Isaacson & Walmsley, 1995; Geiger et al. 1997). The kinetics of the initial portion of the standard deviation function, revealed in the present study, can be considered to be a conservative estimate of the time course of transmitter release at a single site, for the following reasons: (i) sIPSCs were aligned at their initial deflection from baseline, and (ii) the probabilistic distribution for the latency of occurrence of release at each site will sum to produce a function that underestimates the probabilistic occurrence at short and long latencies (Cope & Mendell, 1982b). This technique, however, allows an accurate description of the kinetics of release across sites of release at a set of distributed synapses. The validity of this technique was suggested by a comparison with mathematically computed release rate histograms (Van der Kloot, 1988; Diamond & Jahr, 1995). We therefore suggest that most of the variability in the rise of sIPSCs may be caused by the stochastic nature of transmitter release and this process evolves over a submillisecond time scale.
Uptake influences the time course of IPSCs
Tiagabine, a blocker of Na+-dependent GABA transporters (Draguhn & Heinemann, 1996; Poncer et al. 1996), increased the time course of the decay process of both composite sIPSCs and unitary mIPSCs, whilst not altering the amplitude of mIPSCs. These data indicate that the time course of mIPSCs is influenced by the duration of transmitter in the synaptic cleft and by analogy with the effect of increasing the time course of acetylcholine in the cleft at the NMJ (Hartzell et al. 1975) may be taken as evidence for a high degree of postsynaptic receptor occupancy. The pharmacological profile of this transport blocker may be better suited for a study of the clearance of GABA at these mature synapses than other agents, i.e. nipecotic acid (Otis & Mody, 1992; Draguhn & Heinemann, 1996). Previous observations of a high degree of temperature dependence of the decay process of IPSCs (Otis & Mody, 1992) may be taken as evidence in favour of active uptake of GABA as the Q10 of this reaction was considerably greater than that expected by diffusion (Titmus, Korn & Faber, 1996). This contrasts with other observations made from the CA3 area of cultured preparations (Poncer et al. 1996), that unitary and composite events of dentate gyrus granule cells are equally affected by impairment of GABA uptake. Thus, no difference in cleft concentration or dynamics of transmitter release need be considered for sIPSCs of different amplitudes (Draguhn & Heinemann, 1996) or mIPSCs. Furthermore, we find no evidence of ‘spill-over’ from synapse to synapse as (i) the decay kinetics of IPSCs were not related to their amplitudes, (ii) tiagabine prolonged mIPSCs and sIPSCs irrespective of amplitude in a roughly parallel manner, (iii) a benzodiazepine prolonged the decay of sIPSCs to a similar degree irrespective of amplitude, and (iv) in the present study the defined distance between release sites may be too great to allow significant intersite diffusion. It may be argued that the increase in affinity of the GABAA receptor produced by benzodiazepine should lead to a proportionally greater influence on the kinetics and amplitude of large amplitude composite IPSCs if ‘spill-over’ were present at these synapses. These data, in direct contrast to other inhibitory synapses (Isaacson et al. 1993; Titmus et al. 1996), indicate that active clearance limits the duration of miniature and spontaneous IPSCs and that there is no ‘spill-over’ between closely separated synapses (Barbour & Häusser, 1997).
The exponential nature of IPSC decay
Previous analysis using the sum of a rising and a decaying exponential function to describe the whole time course of IPSCs has indicated that in adult dentate granule neurones the decay phase of the majority of spontaneous and mIPSCs was well described by a monoexponential decay process (Otis & Mody, 1992; De Koninck & Mody, 1994; Soltesz & Mody, 1995). However, in younger animals it has been demonstrated that the decay phases of IPSCs are more accurately approximated with biexponential terms (Edwards et al. 1990). Recently it has been shown that the decay phase of IPSCs evoked in dentate granule neurones by action potential generation in identified basket cells is well fitted with a biexponential process (Geiger et al. 1997). In the present study, exponential functions were fitted only to decay phases of both miniature and sIPSCs following plotting of their time course on a logarithmic scale. In most cells and most events, the decay was best fitted with a biexponential function. Fitting of exponential functions to the decay of individual PSCs is always uncertain, but an increase in the fidelity of fits using biexponential functions in the present study may reflect the care taken in the selection and precise alignment of the detected events. Other factors may also play a role in shaping the decay of IPSCs. Even in whole time course fitting it has been shown that some IPSCs decay biexponentially (Otis & Mody, 1992) and the process of decay may be influenced by the metabolic state of the neurone, for example in terms of intracellular Ca2+ homeostasis (Soltesz & Mody, 1995) and/or the phosphorylation-dephosphorylation state of synaptic GABAA receptors (P. Poisbeau & I. Mody, unpublished observations).
Consequences for the generation of compound inhibitory postsynaptic potentials
The amplitude and duration of sIPSPs will be influenced by the amplitude and time course of generating sIPSCs. Relatively small increases in IPSC decay will increase the decay and amplitude of IPSPs (Poncer et al. 1996). Moreover, the patterning of the activation of individual sites making up sIPSCs will influence the time course of IPSPs, depending, for example, in en passant synapses on the sequence of activation of more proximal and distal components. The fast time course and presumed proximal location of large amplitude sIPSCs reported here will undoubtedly lead to the formation of fast rising sIPSPs; the absolute time for the decay process of such events will, however, be controlled by the membrane time constant of dentate granule neurones. The low variability in the kinetics of sIPSCs may be critical for the generation of accurate timing signals that form coherent oscillatory activity in the archicortex (Freund & Buzsáki, 1996) and other brain regions. In contrast, smaller sIPSCs have more variable kinetics and may function to produce a tonic mode of inhibition that could modulate phasic activity by alterations of membrane time and length constants (Bernander, Douglas, Martin & Koch, 1991).
Acknowledgments
We would like to thank Dr P. Somogyi for critical comments on the manuscript, B. Oyama and M. Kim for technical assistance, Dr J. Lambert and Novo Nordisk for the gift of tiagabine, Dr J. Dempster for providing the Strathclyde Electrophysiology Software and Dr E. J. Cooper for commenting on an earlier draft of this manuscript. S.R. W. was supported by a postdoctoral fellowship from the American Epilepsy Foundation, and the work presented here was supported by a grant from the NIH/NINDS (NS-30549) to I.M.
References
- Auger C, Marty A. Heterogeneity of functional synaptic parameters among single release sites. Neuron. 1997;19:139–150. doi: 10.1016/s0896-6273(00)80354-2. 10.1016/S0896-6273(00)80354-2. [DOI] [PubMed] [Google Scholar]
- Barbour B, Häusser M. Intersynaptic diffusion of neurotransmitter. Trends in Neurosciences. 1997;20:377–384. doi: 10.1016/s0166-2236(96)20050-5. 10.1016/S0166-2236(96)20050-5. [DOI] [PubMed] [Google Scholar]
- Barrett EF, Stevens CF. The kinetics of transmitter release at the frog neuromuscular junction. The Journal of Physiology. 1972;227:691–708. doi: 10.1113/jphysiol.1972.sp010054. [DOI] [PMC free article] [PubMed] [Google Scholar]
- Bekkers JM, Stevens CF. Cable analysis of cultured hippocampal neurons determined from sucrose-evoked miniature EPSCs. Journal of Neurophysiology. 1996;75:1250–1255. doi: 10.1152/jn.1996.75.3.1250. [DOI] [PubMed] [Google Scholar]
- Bernander O, Douglas RJ, Martin KAC, Koch C. Synaptic background activity influences spatiotemporal integration in single pyramidal cells. Proceedings of the National Academy of Sciences of the USA. 1991;88:11569–11573. doi: 10.1073/pnas.88.24.11569. [DOI] [PMC free article] [PubMed] [Google Scholar]
- Buhl EH, Halasy K, Somogyi P. Diverse sources of hippocampal unitary inhibitory postsynaptic potentials and the number of synaptic release sites. Nature. 1994;368:823–828. doi: 10.1038/368823a0. [DOI] [PubMed] [Google Scholar]
- Cope TC, Mendell LM. Parallel fluctuations in EPSP amplitude and rise time with latency at single Ia-fiber-motoneuron connections in the cat. Journal of Neurophysiology. 1982a;47:455–468. doi: 10.1152/jn.1982.47.3.455. [DOI] [PubMed] [Google Scholar]
- Cope TC, Mendell LM. Distributions of EPSP latency at different group Ia-fiber-α-motoneuron connections. Journal of Neurophysiology. 1982b;47:469–478. doi: 10.1152/jn.1982.47.3.469. [DOI] [PubMed] [Google Scholar]
- De Koninck Y, Mody I. Noise analysis of miniature IPSCs in adult rat brain slices: properties and modulation of synaptic GABAA receptor channels. Journal of Neurophysiology. 1994;71:1318–1335. doi: 10.1152/jn.1994.71.4.1318. [DOI] [PubMed] [Google Scholar]
- Del Castillo J, Katz B. Quantal components of the end-plate potential. The Journal of Physiology. 1954a;124:560–573. doi: 10.1113/jphysiol.1954.sp005129. [DOI] [PMC free article] [PubMed] [Google Scholar]
- Del Castillo J, Katz B. Statistical factors involved in neuromuscular facilitation and depression. The Journal of Physiology. 1954b;124:574–585. doi: 10.1113/jphysiol.1954.sp005130. [DOI] [PMC free article] [PubMed] [Google Scholar]
- Diamond JS, Jahr CE. Asynchronous release of synaptic vesicles determines the time course of the AMPA receptor-mediated EPSC. Neuron. 1995;15:1097–1107. doi: 10.1016/0896-6273(95)90098-5. 10.1016/0896-6273(95)90098-5. [DOI] [PubMed] [Google Scholar]
- Draguhn A, Heinemann U. Different mechanisms regulate IPSC kinetics in early postnatal and juvenile hippocampal granule cells. Journal of Neurophysiology. 1996;76:3983–3993. doi: 10.1152/jn.1996.76.6.3983. [DOI] [PubMed] [Google Scholar]
- Edwards FA, Konnerth A, Sakmann B. Quantal analysis of inhibitory synaptic transmission in the dentate gyrus of rat hippocampal slices: a patch-clamp study. The Journal of Physiology. 1990;430:213–249. doi: 10.1113/jphysiol.1990.sp018289. [DOI] [PMC free article] [PubMed] [Google Scholar]
- Freund TF, Buzsáki G. Interneurons of the hippocampus. Hippocampus. 1996;6:347–470. doi: 10.1002/(SICI)1098-1063(1996)6:4<347::AID-HIPO1>3.0.CO;2-I. 10.1002/(SICI)1098-1063(1996)6:4<347::AID-HIPO1>3.0.CO;2-I. [DOI] [PubMed] [Google Scholar]
- Geiger JRP, Lübke J, Roth A, Frotscher M, Jonas P. Submillisecond AMPA receptor-mediated signaling at a principal neuron-interneuron synapse. Neuron. 1997;18:1009–1023. doi: 10.1016/s0896-6273(00)80339-6. 10.1016/S0896-6273(00)80339-6. [DOI] [PubMed] [Google Scholar]
- Goldstein SS, Rall W. Changes of action potential shape and velocity for changing core conductor geometry. Biophysical Journal. 1974;14:731–757. doi: 10.1016/S0006-3495(74)85947-3. [DOI] [PMC free article] [PubMed] [Google Scholar]
- Halasy K, Somogyi P. Subdivisions in the multiple GABAergic innervation of granule cells in the dentate gyrus of the rat hippocampus. European Journal of Neuroscience. 1993;5:411–429. doi: 10.1111/j.1460-9568.1993.tb00508.x. [DOI] [PubMed] [Google Scholar]
- Han Z-S, Buhl EH, Lörinczi Z, Somogyi P. A high degree of spatial selectivity in the axonal and dendritic domains of physiologically identified local-circuit neurons in the dentate gyrus of the rat hippocampus. European Journal of Neuroscience. 1993;5:395–410. doi: 10.1111/j.1460-9568.1993.tb00507.x. [DOI] [PubMed] [Google Scholar]
- Hartzell HC, Kuffler SW, Yoshikami D. Post-synaptic potentiation: interaction between quanta of acetylcholine at the skeletal neuromuscular junction. The Journal of Physiology. 1975;251:427–463. doi: 10.1113/jphysiol.1975.sp011102. [DOI] [PMC free article] [PubMed] [Google Scholar]
- Isaacson JS, Solis JM, Nicoll R. Local and diffuse synaptic actions of GABA in the hippocampus. Neuron. 1993;10:165–175. doi: 10.1016/0896-6273(93)90308-e. 10.1016/0896-6273(93)90308-E. [DOI] [PubMed] [Google Scholar]
- Isaacson JS, Walmsley B. Counting quanta: direct measurements of transmitter release at a central synapse. Neuron. 1995;15:875–884. doi: 10.1016/0896-6273(95)90178-7. 10.1016/0896-6273(95)90178-7. [DOI] [PubMed] [Google Scholar]
- Isaacson JS, Walmsley B. Amplitude and time course of spontaneous and evoked excitatory postsynaptic currents in bushy cells of the anteroventral cochlear nucleus. Journal of Neurophysiology. 1996;76:1566–1571. doi: 10.1152/jn.1996.76.3.1566. [DOI] [PubMed] [Google Scholar]
- Jack JJB, Redman SJ, Wong K. The components of synaptic potentials evoked in cat spinal motoneurones by impulses in single group Ia afferents. The Journal of Physiology. 1981;321:65–96. doi: 10.1113/jphysiol.1981.sp013972. [DOI] [PMC free article] [PubMed] [Google Scholar]
- Katz B, Miledi R. Propagation of electric activity in motor-nerve terminals. Proceedings of the Royal Society. 1965a;B 161:453–482. doi: 10.1098/rspb.1965.0015. [DOI] [PubMed] [Google Scholar]
- Katz B, Miledi R. The measurement of synaptic delay, and the time course of acetylcholine release at the neuromuscular junction. Proceedings of the Royal Society. 1965b;B 161:483–495. doi: 10.1098/rspb.1965.0016. [DOI] [PubMed] [Google Scholar]
- Katz B, Miledi R. The effect of temperature on the synaptic delay at the neuromuscular junction. The Journal of Physiology. 1965c;181:656–670. doi: 10.1113/jphysiol.1965.sp007790. [DOI] [PMC free article] [PubMed] [Google Scholar]
- Luscher H-R, Shiner JS. Simulation of action potential propagation in complex terminal arborizations. Biophysical Journal. 1990;58:1389–1399. doi: 10.1016/S0006-3495(90)82485-1. [DOI] [PMC free article] [PubMed] [Google Scholar]
- Miles R. Variations in the strength of inhibitory synapses in the CA3 region of guinea-pig hippocampus in vitro. The Journal of Physiology. 1990;431:659–676. doi: 10.1113/jphysiol.1990.sp018353. [DOI] [PMC free article] [PubMed] [Google Scholar]
- Miles R, Toth K, Gulyás AI, Hájos N, Freund TF. Differences between somatic and dendritic inhibition in the hippocampus. Neuron. 1996;16:815–823. doi: 10.1016/s0896-6273(00)80101-4. 10.1016/S0896-6273(00)80101-4. [DOI] [PubMed] [Google Scholar]
- Mody I, De Koninck Y, Otis TS, Soltesz I. Bridging the cleft at GABA synapses in the brain. Trends in Neurosciences. 1994;17:517–525. doi: 10.1016/0166-2236(94)90155-4. 10.1016/0166-2236(94)90155-4. [DOI] [PubMed] [Google Scholar]
- Otis TS, Mody I. Modulation of decay kinetics and frequency of GABAA receptor-mediated spontaneous inhibitory postsynaptic currents in hippocampal neurons. Neuroscience. 1992;49:13–32. doi: 10.1016/0306-4522(92)90073-b. 10.1016/0306-4522(92)90073-B. [DOI] [PubMed] [Google Scholar]
- Poisbeau P, Williams SR, Mody I. Silent GABAA synapses during flurazepam withdrawal are region-specific in the hippocampal formation. Journal of Neuroscience. 1997;17:3467–3475. doi: 10.1523/JNEUROSCI.17-10-03467.1997. [DOI] [PMC free article] [PubMed] [Google Scholar]
- Poncer J-C, Durr R, Gähwiler BH, Thompson SM. Modulation of synaptic GABAA receptor function by benzodiazepines in area CA3 of rat hippocampal slice cultures. Neuropharmacology. 1996;35:1169–1179. doi: 10.1016/s0028-3908(96)00055-x. 10.1016/S0028-3908(96)00055-X. [DOI] [PubMed] [Google Scholar]
- Soltesz I, Mody I. Ca2+-dependent plasticity of miniature inhibitory currents after amputation of dendrites in central neurons. Journal of Neurophysiology. 1995;73:1763–1773. doi: 10.1152/jn.1995.73.5.1763. [DOI] [PubMed] [Google Scholar]
- Soltesz I, Smetters DK, Mody I. Tonic inhibition originates from synapses close to the soma. Neuron. 1995;14:1273–1283. doi: 10.1016/0896-6273(95)90274-0. 10.1016/0896-6273(95)90274-0. [DOI] [PubMed] [Google Scholar]
- Tamás G, Buhl EH, Somogyi P. Fast IPSPs elicited via multiple synaptic release sites by different types of GABAergic neurone in the cat visual cortex. The Journal of Physiology. 1997;500:715–738. doi: 10.1113/jphysiol.1997.sp022054. [DOI] [PMC free article] [PubMed] [Google Scholar]
- Tang C-M, Margulis M, Shi Q-Y, Fielding A. Saturation of postsynaptic glutamate receptors after quantal release of transmitter. Neuron. 1994;13:1385–1393. doi: 10.1016/0896-6273(94)90423-5. 10.1016/0896-6273(94)90423-5. [DOI] [PubMed] [Google Scholar]
- Titmus MJ, Korn H, Faber DS. Diffusion, not uptake, limits glycine concentration in the synaptic cleft. Journal of Neurophysiology. 1996;75:1738–1752. doi: 10.1152/jn.1996.75.4.1738. [DOI] [PubMed] [Google Scholar]
- Van Der Kloot W. Estimating the timing of quantal release during end-plate currents at the frog neuromuscular junction. The Journal of Physiology. 1988;402:595–603. doi: 10.1113/jphysiol.1988.sp017224. [DOI] [PMC free article] [PubMed] [Google Scholar]