

Abstract
Extracellular nucleotides modulate ionic transport mechanisms in various epithelia. In the present study, we investigated the effects of extracellular ATP on the intracellular free Ca2+ concentration ([Ca2+]i) and electrophysiological properties of Necturus maculosus proximal convoluted tubule (PCT).
ATP raised [Ca2+]i in microdissected fura-2-loaded PCTs (half-maximal effect, ≈15 μmol l−1 ATP). The initial ATP-induced changes in [Ca2+]i were not blunted by the removal of external Ca2+ nor by the presence of Ca2+ channel blockers, but were abolished by thapsigargin and suramin. The sequence for the potency of various agonists on [Ca2+]i was 2-methylthioATP (2MeSATP) = ADP = ATP ≫ UTP, 2′,3′-O-(4-benzoilbenzoil) ATP (BzATP), α,β-methylene ATP (AMPCPP), adenosine.
In vivo electrophysiological measurements showed that 100 μmol l−1 peritubular ATP added to a Ringer solution reduced the basolateral cell membrane potential (Vm) and increased the cell membrane input conductance. In a low Cl− solution, this ATP-induced depolarization was enhanced. These effects were inhibited by 1 mmol l−1SITS, consistent with the activation of a basolateral Cl− conductance.
The ATP-induced change in Vm was reproduced by ADP but not by UTP or adenosine, and was prevented by suramin.
The ATP-induced membrane depolarization was not influenced by thapsigargin, BAPTA AM, or staurosporin and was not reproduced by manoeuvres increasing [Ca2+]i or intracellular cAMP content.
We conclude that, in Necturus PCT, a P2y receptor mobilizes Ca2+ mainly from intracellular pools and increases a basolateral Cl− conductance, GCl. The activation of GCl occurs by a mechanism which is not related either to an increase in [Ca2+]i or cAMP content, or to PKC activation.
Extracellular ATP concentration is known to be low compared with its intracellular level, but it may reach higher values locally since this nucleotide can be extruded from the cytosol by various mechanisms (Dubyak & El-Moatassim, 1993) and may thus act as a paracrine factor. There is growing evidence that extracellular ATP modulates ion transport systems in various cells, including epithelial cells. Most of these effects have been related to the binding of ATP to P2-type receptors or of its catabolite, adenosine, to P1 (also called A)-type receptors. In the case of ATP binding to P2 receptors, the modulation of ionic transport systems is either subsequent to the activation of a signal transduction system (ATP binds to a P2 receptor coupled to a G protein) or direct (ATP binds to a channel-receptor), as detailed in the review by Dubyak & El-Moatassim (1993). In both cases, an increase in intracellular calcium concentration ([Ca2+]i) is usually observed. Recently, it has been pointed out that extracellular ATP could activate Cl− conductances in various secretory epithelia (Chan, Zhou & Wang, 1995; Hwang, Schwiebert & Guggino, 1996). In most cases, the transductional system underlying this response was identified, but in a few cases (Stutts, Chinet, Mason, Fullton, Clarke & Boucher, 1992; Stutts, Fitz & Paradiso, 1994; Guo, Merlin, Harvey, Laboisse & Hopfer, 1995), the effect of extracellular ATP on Cl− conductance could not be related to any investigated signal transduction pathway, raising the possibility of a direct effect of the nucleotide on Cl− channels, or of the involvement of some unknown transduction system. In reabsorbing epithelia, it has also been observed that extracellular ATP modulates Cl− transport in the distal part of the nephron (Middleton, Mangel, Basavappa & Fitz, 1993). In contrast, little is known concerning the effects of extracellular ATP on [Ca2+]i or on ionic transport in the proximal tubule of the nephron, the tubular segment of which reabsorbs about 60 % of the filtered NaCl load. This relative lack of information might be due in part to the difficulty of applying Ca2+ measurement techniques in the intact proximal tubule (McCarthy & O'Neil, 1990). Thus, most studies focusing on the effects of extracellular ATP in proximal tubular cells have been performed on cell cultures: ATP increases [Ca2+]i in a primary culture of proximal cells (Cejka, Bidet, Tauc & Poujeol, 1993; Cejka, Le Maout, Bidet, Tauc & Poujeol, 1994) and in LLC-PK1, a cell line which shares common features with proximal tubular cells (Weinberg, Davis, Shayman & Knight, 1989). A recent study demonstrated that in isolated rabbit proximal tubule, extracellular ATP also increases [Ca2+]i via basolateral P2y receptors (Yamada, Seki, Taniguchi, Uwatoko, Suzuki & Kurokawa, 1996), without significant effect on the electrophysiological properties of the cell membrane.
We investigated the effects of extracellular ATP on [Ca2+]i and basolateral membrane potential (Vm) in the proximal convoluted tubule (PCT) of the amphibian nephron. Our results are consistent with the presence of a P2y-type receptor and with the activation by extracellular ATP of a basolateral Cl− conductance, GCl. However, GCl activation does not seem to be related to the [Ca2+]i increase or to the other investigated signal transduction systems.
METHODS
Biological material
Fluorimetric measurements were performed on microdissected PCTs from male Necturus maculosus kidneys (Nasco, WI, USA). Electrophysiological experiments were performed in vivo on PCTs of the same species. Animals were kept in tap water and fed twice a week with live Chironoma. Before experiments, the animals were anaesthetized by immersion in a 0.07 % (w/v) solution of tricaine methane sulphonate. After the experiments, they were overanaesthetized in a 0.7 % (w/v) solution of tricaine methane sulphonate, then decapitated.
Microdissection of PCTs
In order to prepare PCTs for microdissection, the abdominal cavity was exposed and the thoracic aorta cannulated to deliver 20 ml Ringer solution (see below) to rinse the blood from the kidneys. Iliac and mesenteric vessels were then ligatured, and the caudal vein was cannulated to deliver 10 ml Ringer solution supplemented with 220 U ml−1 collagenase (Type 1A; Sigma). After removing and slicing the kidneys, enzymatic digestion of connective tissue was achieved by a 1 h incubation (at 26°C) of kidney portions in a Ringer solution supplemented with 2200 U ml−1 collagenase. Microdissection of PCTs was carried out at 4°C in the Ringer solution. The viability of microdissected PCTs was attested by Trypan Blue extrusion.
In vivo experiments
Anaesthesia was obtained as described above and maintained throughout the experiment by immersion of the branchiae in a 1/5th dilution of the anaesthetic solution. Dissection of the animal and exposure and superfusion of the kidneys with a Ringer solution during the experiment have been described elsewhere (Planelles, Kurkdjian & Anagnostopoulos, 1984).
Measurement of [Ca2+]i in microdissected PCTs
Microdissected PCTs were loaded with the Ca2+-sensitive fluorescent probe fura-2 by a 45 min incubation in Ringer solution containing 10 μmol l−1 fura-2 AM and 0.5 % (v/v) Pluronic F-127, then rinsed in a large volume of Ringer solution for at least 15 min. One fura-2-loaded PCT was deposited onto a glass coverslip glued with silicone grease to a microperfusion chamber fixed to the stage of a microscope (Diaphot TMD; Nikon). The PCT adhered to the coverslip and was continuously superfused by one of six solutions delivered by gravimetry at a rate of ∼350 μl min−1, as detailed elsewhere (Paulais, Baudouin-Legros & Teulon, 1995).
Fura-2 fluorescence was monitored in ratio mode using a microfluorometer (Filterscan RF-F3010; Photon Technology International, South Brunswick, NJ, USA) as previously described (Paulais et al. 1995). Briefly, the light of a xenon arc lamp was alternately directed towards 340.8 nm (10.3 nm bandwidth) and 380 nm (9.5 nm bandwidth) interference filters (Oriel, Stratford, NJ, USA) then towards the specimen via a × 40, 0.85 NA objective lens (CF Fluor; Nikon) coupled to a DM 400 dichroic mirror (Nikon). The light emitted at 510 nm (8.2 nm bandwith) was detected by a photomultiplier tube, after restriction of its field of view to a ∼250 μm2 rectangular area covering part of the tubule image. When long periods separated two consecutive measurements on the same preparation (see Results), unnecessary specimen illumination was cut in order to avoid fura-2 photobleaching. Fluorescence signals were collected for 8.5 ms at each excitation wavelength and integrated over 2 s periods. Data were stored on the hard disk of a personal computer (Brett Computers, France). All experiments were performed at room temperature (∼20°C). At the end of each experiment, the tubule was superfused with a Ca2+-free (no CaCl2 added) Ringer solution supplemented with 5 mmol l−1 MnCl2 and 5 μmol l−1 ionomycin. This manoeuvre quenches intracellular fura-2 fluorescence, so that background noise can be measured and subtracted from all fluorescence signals.
We calibrated fura-2 fluorescence in situ (Grynkiewicz, Poenie & Tsien, 1985) on twenty fura-2-loaded PCTs superfused with 1 μmol l−1 ionomycin in Ca2+-containing (5 mmol l−1) Ringer solution, then in Ca2+-free solution (no Ca2+ added, plus 5 mmol l−1 EGTA). Experimental 340/380 fluorescence ratios (R) were converted to [Ca2+]i according to the equation (Grynkiewicz et al. 1985):
where Kd, the dissociation constant of fura-2 for Ca2+, was 224 nmol l−1 (Grynkiewicz et al. 1985), Rmax and Rmin are the R values at saturating and Ca2+-free conditions, respectively, and Sf380 and Ss380 are the signals emitted by the Ca2+-free (f) and Ca2+-saturated (s) forms of fura-2, respectively, when illuminated at 380 nm. We obtained successful calibration in nine tubules, yielding a resting [Ca2+]i of 167 ± 25 nmol l−1. Difficulty with in situ calibration of fura-2 has been reported by other groups on various tissues, including PCTs (McCarthy & O'Neil, 1990), and is sometimes circumvented by measuring calibration parameters from the fluorescence properties of fura-2 in solutions mimicking the intracellular ionic composition. We routinely used this latter procedure but obtained an unusually high mean [Ca2+]i value of 306 ± 22 nmol l−1 (n = 140). Thus, although the accuracy of extracellular calibration of fura-2 was established in mammalian renal tubules (Taniguchi, Marchetti & Morel, 1989; Nitschke, Fröbe & Greger, 1991), we did not extend it to Necturus PCTs, and reported our results as 340/380 ratios.
Electrophysiological measurements on PCT in vivo
Microperfusions
All experiments were performed at room temperature. Peritubular microperfusions were achieved by inserting a double- (or triple)-barrelled micropipette into a peritubular vessel with a micromanipulator (Leitz, Germany). Each barrel of the micropipette was connected to a catheter filled with an artificial solution. The solutions differed one from another by a single parameter. A gravimetric system allowed alternate delivery of the solutions.
Some experiments were performed in luminal oil-blocked tubules, in which the luminal compartment was virtually eliminated by injecting coloured castor oil via a single micropipette inserted in the glomerulus.
Measurement of basolateral membrane potential
Basolateral membrane potential, Vm (or transepithelial potential difference, Vte) was measured by means of a microelectrode inserted into a cell (or into the lumen) of a PCT located in the microperfused area. Microelectrodes were pulled from capillary glass (o.d. 2 mm, i.d. 1.6 mm; Clarke, Pangbourne, UK) on a vertical puller (PE 2; Narishige, Japan) and filled with 1 mol l−1 KCl. Resistance of the microelectrodes was 40–60 MΩ. The microelectrode was placed on a micromanipulator (MM1; Narishige) and was connected via a Ag/AgCl pellet holder to the input of an electrometer (FD 223; WPI, USA). The output of the electrometer was connected to a multipen chart recorder (Servofram; Sefram, France). A 1 mol l−1 KCl-Ag/AgCl macroelectrode placed in the peritoneal cavity closed the electrical circuit.
Measurement of cell membrane input conductance
Cell membrane input conductance was assessed by inserting two microelectrodes into the cellular layer of a single PCT. One microelectrode was connected to a current generator/electrometer delivering constant current pulses (intensity, 30 to 80 nA; time duration, 1 s; interval between two consecutive pulses, 4 s). The second microelectrode recorded Vm and the superimposed electrotonic potentials, dVm, induced by the injected current pulses. In this experimental configuration, dVm results from current distribution along the cellular cable and is a function of the cell membrane conductance and the distance between the recording microelectrode and the source of stimulation. dVm was measured under control conditions (ctrl), then in the experimental condition (exptl). Since the experiments were performed in paired fashion (so that the distance between the two electrodes was constant), the ratio dVm,exptl/dVm,ctrl can be taken as a qualitative index of the change of cell membrane input conductance (Teulon, Planelles & Anagnostopoulos, 1978), a value of dVm,exptl/dVm,ctrl < 1 indicating an increase in cell membrane input conductance, and conversely. By locating both microelectrodes in the tubular lumen and by recording Vte and dVte, the change in transepithelial input conductance was estimated by the ratio dVte,exptl/dVte,ctrl.
Measurement of the voltage divider ratio
The ratio of the cell membrane resistances was estimated by inserting the punctual current source (a microelectrode connected to the current generator delivering rectangular pulses as described above, with a current intensity of 100–160 nA) into the lumen of a PCT. The recording microelectrode, sequentially inserted at the same location into the cell then advanced into the lumen, as previously described (Anagnostopoulos, Teulon & Edelman, 1981), sequentially measured the induced dVm and dVte. In this configuration, dVm results from current flow out of the lumen across the transcellular route. Thus, the voltage divider ratio, VDR (dVm/dVte) is an index of the ratio of the basolateral over the apical membrane resistances. For a single PCT, VDR was obtained in paired fashion, first during peritubular Ringer perfusion, then in the presence of ATP: a decrease in VDR indicates a decrease in the fractional resistance of the basolateral membrane, and conversely.
Solutions
The composition of the amphibian Ringer solution was (mmol l−1): 100 NaCl, 3 KCl, 1 MgCl2, 1.8 CaCl2, buffered at pH 7.6 with 5 Tes-NaOH. For the low Cl− solution, 100 mmol l−1 sodium gluconate was substituted for NaCl, and CaCl2 was increased to 5.6 mmol l−1 to compensate for Ca2+ chelation by gluconate−.
Chemicals
ATP, ADP, 2′,3′-O-(4-benzoilbenzoil) ATP (BzATP), α,β-methylene ATP (AMPCPP), uridine 5′-triphosphate (UTP), adenosine, staurosporin, 8–4-chlorophenylthio-cAMP (8-4-CPT cAMP) and Reactive Blue 2 (RB2) were obtained from Sigma, pyridoxalphosphate-6-azophenyl-2′,4′-disulphonic acid (PPADS) and 2-methylthioATP (2MeSATP) from RBI. Suramin and thapsigargin (TG) were from Calbiochem and Alexis Corp. (San Diego, CA, USA), respectively. Fura-2, fura-2 AM, Pluronic acid F127 and BAPTA AM were from Molecular Probes. Diphenylamine 2-carboxylic acid (DPC) was purchased from Merck and SITS from Aldrich or Research Organic, Inc. (Cleveland, OH, USA). Calix-4-arene was obtained from Acros Organics (Pittsburg, PA, USA) and 5-nitro-2-(3-phenylpropylamino) benzoic acid (NPPB) was a generous gift from Dr H. J. Lang (Hoechst Laboratory). In solutions containing one of the following compounds: ATP, ADP, BzATP, AMPCPP, UTP, adenosine and 2MeSATP, total CaCl2 and MgCl2 concentrations were calculated according to Fabiato (1981) to obtain 1.8 and 1 mmol l−1, respectively, of free salts.
Data analysis
Unless stated in the text, results are expressed as means ±s.e.m., with n the number of observations, and statistical significance was assessed by Student's paired t test.
RESULTS
Effects of external ATP on [Ca2+]i in Necturus PCT
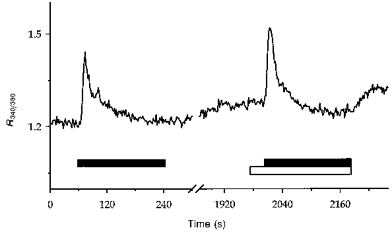
The effects of ATP addition to the superfusate on the 340/380 fluorescence ratio, R, in fura-2-loaded PCTs are illustrated in Fig. 1A. ATP (100 μmol l−1) systematically induced a rapid increase in [Ca2+]i, followed by a slower decline. In this experimental series, the mean basal R value was 3.3 ± 0.3 (n = 28). The maximal amplitude of the change in R, ΔR, induced by 100 μmol l−1 ATP varied from tubule to tubule, the mean ΔR being 1.8 ± 0.2 (n = 28). When ATP exposure was limited to 1 min (n = 20), [Ca2+]i in most tubules was clearly still declining (n = 12), whereas it appeared to stabilize for eight tubules. In all twenty of these tubules, [Ca2+]i slowly recovered its resting level upon ATP withdrawal. To test whether [Ca2+]i could recover its basal level in the continuous presence of ATP, eight tubules were exposed to ATP over 3 min (Fig. 1A). Under this experimental condition, a transient initial increase in [Ca2+]i was observed, then [Ca2+]i reached a level not statistically different (P = 0.4, n = 8) from the resting level, and ATP withdrawal induced no further change in [Ca2+]i.
Figure 1. ATP increases cytosolic free calcium concentration in isolated fura-2-loaded Necturus PCT.
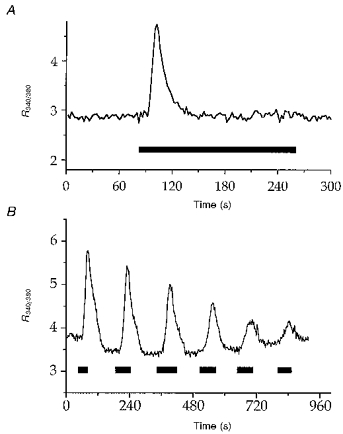
Fura-2 fluorescence was monitored and converted to R340/380 values as described in Methods. A a PCT was continuously superfused with Ringer medium and exposed to 100 μmol l−1 ATP for the period indicated by the horizontal bar. B effects of repeated exposures to ATP on [Ca2+]i of Necturus PCT. A fura-2-loaded PCT bathed in Ringer medium was exposed to 100 μmol l−1 ATP for the periods indicated by the horizontal bars. The trace shown is representative of 4 similar experiments.
As shown in Fig. 1B, repeated short (∼1 min) exposures of PCTs to 100 μmol l−1 ATP caused a progressive reduction in the amplitude of the [Ca2+]i response, until it almost vanished. We determined that under this experimental condition a washing-out period of at least 10 min with Ringer solution between two consecutive short ATP exposures was necessary to overcome this phenomenon (not shown). When appropriate, longer ATP exposures were separated by a washing-out period of at least 25 min.
The effects of ATP on [Ca2+]i were concentration dependent. In a separate series of experiments (n = 27), responses to various ATP concentrations (ranging from 500 nmol l−1 to 2 mmol l−1) were observed and quantified by measuring ΔR. Figure 2 summarizes these results. For each ATP concentration inducing [Ca2+]i changes, the response was characterized by a transient peak, the amplitude of which increased with ATP concentration. From these results, the ATP concentration inducing a half-maximal response was about 15 μmol l−1 (see legend to Fig. 2).
Figure 2. Relationship between extracellular ATP concentration and changes in R340/380 in Necturus PCT.
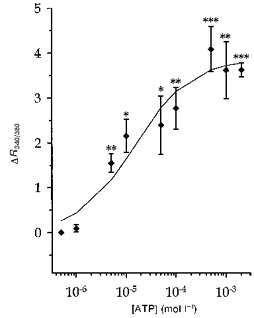
Experimental procedures were as described for Fig. 1. ΔR340/380 represents the maximal change in R340/380 above baseline induced by each ATP concentration. Results are shown as means, and s.e.m. are represented by vertical bars (n ≥ 3 for all conditions). Data were fitted by the equation ΔR = ΔRmax/(1 + ([ATP]/K)n), where ΔRmax (the maximum ΔR) was 3.9 ± 0.4, K(the ATP concentration yielding the half-maximal effect) was 15 ± 8 μmol l−1 and n (the Hill coefficient) was 0.8 ± 0.2 (mean ±s.d.). Average resting R340/380 was 3.38 ± 0.2 for this series of experiments. *P < 0.05; **P < 0.01; ***P < 0.001vs. resting level.
Changes in [Ca2+]i upon PCT exposure to various ATP analogues and effects of antagonists
The above results suggested that extracellular ATP raised [Ca2+]i through its binding to a membrane receptor. To establish its pharmacological profile, the effects of various nucleotides and adenosine on [Ca2+]i were studied. Due to the variability of the ATP-induced transient [Ca2+]i peak from tubule to tubule (see above), the effect of 100 μmol l−1 of each compound was compared with that of 100 μmol l−1 ATP on the same tubule in paired fashion. Results are summarized in Fig. 3. ADP (an agonist of P2x, P2y and P2t receptors) and 2MeSATP (a P2y receptor agonist) elicited transient [Ca2+]i responses qualitatively similar to those obtained with ATP. The maxima of the ADP effect (ΔR = 2.3 ± 0.6, n = 8) or the 2MeSATP effect (ΔR = 2.9 ± 0.4, n = 7) were not statistically different from the paired changes under ATP (P = 0.5 and P = 0.2, respectively). By contrast, as shown in Fig. 3, UTP (a P2u receptor agonist) and BzATP (a P2z receptor agonist) elicited much smaller transients in [Ca2+]i as compared with the paired ATP effect (ΔR = 0.2 ± 0.1 vs. 1.4 ± 0.4 for UTP vs. ATP, n = 5, and ΔR = 0.6 ± 0.2 vs. 3.5 ± 0.7 for BzATP vs. ATP, n = 6). Figure 3 also shows the lack of effect of AMPCPP (a P2x receptor agonist) and adenosine (a P1 receptor agonist) on [Ca2+]i, yielding the following potency sequence: 2MeSATP = ADP = ATP ≫ UTP, BzATP, AMPCPP, adenosine.
Figure 3. Relative potency of various nucleotides and adenosine on [Ca2+]i.
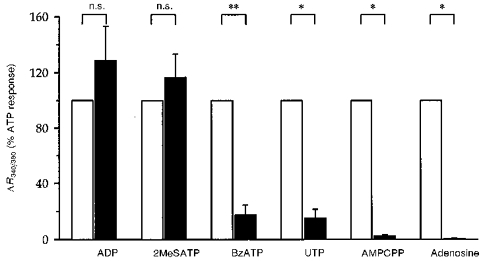
Experimental procedures were as described for Fig. 1. The maximal change in R340/380 above baseline (ΔR340/380) induced by 100 μmol l−1 of the indicated compound was normalized to that of 100 μmol l−1 ATP (open bars) on the same tubule. Results are given as means and s.e.m. are represented by vertical bars (n ≥ 5 for all conditions). n.s., not significantly different from ATP. *P < 0.05 and **P < 0.01vs. ATP.
Next, we investigated the effect of various P2 receptor antagonists on the ATP-induced [Ca2+]i response; as in the previous series, experiments were conducted in a paired fashion. As shown in Fig. 4, the response to 100 μmol l−1 ATP was dramatically reduced by 300 μmol l−1 suramin, a non-specific P2 receptor antagonist (ΔR = 0.2 ± 0.1 vs.ΔR = 1.2 ± 0.2, P < 0.01, n = 8). By contrast, neither 10 μmol l−1 RB2, nor up to 100 μmol l−1 PPADS had an inhibitory action on the ATP-induced [Ca2+]i effect.
Figure 4. Effects of various P2 receptor antagonists on the response to ATP.
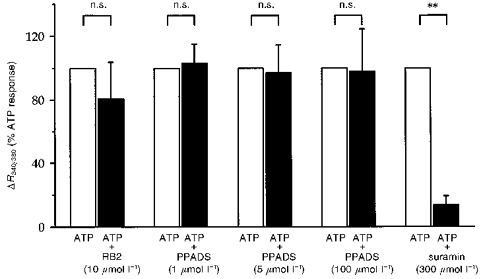
The effect of each indicated compound on the response to 100 μmol l−1 ATP was observed and quantified as for Fig. 3. Results are given as means and s.e.m. are represented by vertical bars (n ≥ 4 for all conditions). n.s., not significantly different from ATP. **P < 0.01vs. ATP.
Origin of the increase in [Ca2+]i on PCT exposure to extracellular ATP
The binding of ATP to the P2y-type receptor generally leads to a [Ca2+]i increase due to mobilization of Ca2+ contained in intracellular stores. We therefore investigated whether thapsigargin (TG), an inhibitor of the non-mitochondrial Ca2+-ATPase which causes depletion of intracellular Ca2+ stores, could influence the response to ATP. Addition of 2 μmol l−1 TG to the superfusate for 10 min induced a slow increase in R from 4.7 ± 0.4 to 7.4 ± 1.3. After this treatment, addition of 100 μmol l−1 ATP had no significant effect on [Ca2+]i (R = 7.9± 1.6, P = 0.3, n = 5). These results suggest that Ca2+ mobilization from intracellular pools is a major component of the ATP-induced response.
Next, we investigated whether extracellular Ca2+ also participates in the ATP-induced [Ca2+]i transient. We observed that the presence of the Ca2+ channel blockers La3+ (50 μmol l−1), nifedipine (50 μmol l−1) and verapamil (100 μmol l−1) did not affect the ATP-induced [Ca2+]i changes (Table 1). Then we measured the ATP-induced [Ca2+]i transients upon adding ATP to a Ca2+-free medium. We exposed five PCTs simultaneously to 1 mmol l−1 ATP (a concentration which gave near-maximal changes in [Ca2+]i, see Fig. 2) and to a Ca2+-free medium supplemented with 100 μmol l−1 EGTA. When compared with the effect of 1 mmol l−1 ATP in Ca2+-containing medium, we did not observe any quantitative or qualitative modification of the [Ca2+]i changes (not shown). Then, we measured in paired fashion and in a random sequence the changes in [Ca2+]i upon adding ATP to a Ca2+-containing medium or in a Ca2+-free medium (no CaCl2 added plus 100 μmol l−1 EGTA). PCTs were exposed for 3 min successively to 100 μmol l−1 ATP; a 25 min period of washing separated the two ATP challenges. In a first series (n = 7), preincubation in Ca2+-free medium was limited to 30 s before adding ATP, to prevent possible depletion of Ca2+ stores (Yamada et al. 1996). For four out of the seven PCTs, the withdrawal of extracellular Ca2+ decreased basal [Ca2+]i, but this fall did not reach statistical significance (ΔR = −0.2 ± 0.1, n = 4, P = 0.1), and in the three other PCTs, this manoeuvre had no visible effect on [Ca2+]i; thus removal of external Ca2+ for 30 s had no significant effect on basal [Ca2+]i (R = 3.4± 0.7 vs. 3.3 ± 0.7, n = 7, P = 0.2). Addition of ATP to the Ca2+-free medium led to a transient increase in [Ca2+]i similar to that obtained in the presence of external Ca2+ (ΔR = 1.63 ± 0.45 vs. 1.25 ± 0.25, n = 7, P = 0.4). However, it can be observed from the representative tracing from this series shown in Fig. 5 that the readmission of external Ca2+ induced an increase in [Ca2+]i; this observation prompted us to lengthen the preincubation in Ca2+-free medium before checking the effect of ATP addition. Thus, in a second paired experimental series (n = 14), we measured the ATP-induced [Ca2+]i change in the presence of external Ca2+, or after 5 or 10 min (n = 6 and 8, respectively) exposure to the Ca2+-free solution. In all but one tubule, ATP still induced a transient change in [Ca2+]i. Table 1 shows that after this long Ca2+-free exposure, the maximal ATP-induced [Ca2+]i increase was unchanged; however, when measured at the mid-time of ATP exposure, ΔR was significantly lower than the paired value measured in the presence of external Ca2+ (P < 0.05, n = 14). Taken together, these results suggest that Ca2+ entry from extracellular medium may transiently participate in the ATP-induced [Ca2+]i changes.
Table 1.
Changes in [Ca2+]i (ΔR) during ATP exposure
| ATP (100 μmol l−1) | ||||
|---|---|---|---|---|
| Superfusate | n | ΔR, peak | ΔR, 1 min 30 s | ΔR, 3 min |
| Control | 3 | 1.09 ± 0.23 | 0.12 ± 0.07 | 0.02 ± 0.01 |
| La3+ (50 μmol l−1) | 0.95 ± 0.21 n.s. | 0.06 ± 0.08 n.s. | -0.04 ± 0.04 n.s. | |
| Control | 5 | 1.49 ± 0.29 | 0.19 ± 0.10 | -0.09 ± 0.05 |
| Verapamil (100 μmol l−1) | 1.01 ± 0.29 n.s. | -0.19 ± 0.13 n.s. | 0.01 ± 0.03 n.s. | |
| Control | 6 | 1.24 ± 0.30 | 0.13 ± 0.04 | 0.01 ± 0.02 |
| Nifedipine (50 μmol l−1) | 1.12 ± 0.41 n.s. | 0.14 ± 0.05 n.s. | 0.05 ± 0.01 n.s. | |
| Control | 14 | 1.13 ± 0.01 | 0.31 ± 0.05 | 0.09 ± 0.03 |
| Ca2+-free + EGTA | 1.18 ± 0.15 n.s. | 0.20 ± 0.03 * | 0.03 ± 0.01 n.s. | |
Changes in [Ca2+]i (expressed as the variation in the R340/380 ratio compared with its basal value (ΔR) induced by adding 100 μmol l−1 ATP in a Ringer superfusate (control) or in a modified superfusate (Ca2+-free or supplemented with a Ca2+ channel blocker). ΔR was measured at its maximal change (‘peak’), then after 1 min 30 s or 3 min of ATP exposure.
P < 0.05; n.s., not significant.
Figure 5. Effect of ATP in the presence and absence of extracellular Ca2+.
Experimental procedures were as described for Fig. 1. A PCT was exposed to 100 μmol l−1 ATP for the periods indicated by the horizontal filled bars successively in the presence (1.8 mmol l−1 CaCl2) and absence (100 μmol l−1 EGTA, open bar) of external Ca2+. The break in the trace represents a 25 min period of superfusion with Ringer solution.
Effects of extracellular ATP on cell membrane potential and conductance
As indicated in Table 2, addition of ATP (100 μmol l−1) to the peritubular Ringer perfusate significantly changed Vm by +9.3 ± 0.8 mV (n = 16, P < 0.001). During ATP exposure, this depolarization was either sustained (as shown in Fig. 6) or followed by a partial recovery; Vm change was usually reversible upon ATP withdrawal. As also shown in Table 2, 50 μmol l−1 ATP induced a smaller change in Vm (transient spike depolarization), while 1 mmol l−1 ATP induced a larger membrane depolarization (sustained and poorly reversible upon ATP withdrawal).
Table 2.
Effect of ATP on basolateral membrane potential
| Experimental series | n | Vm (Ringer) | Vm (Ringer + ATP) | (ΔVm) |
|---|---|---|---|---|
| ATP (50 μmol l−1) | 3 | -71.7 ± 4.2 | -65.0 ± 4.3 * | (6.6 ± 1.6) |
| ATP (100 μmol l−1) | 16 | -63.4 ± 2.5 | -54.7 ± 2.4 *** | (9.3 ± 0.8) |
| ATP (1 mmol l−1) | 8 | -54.1 ± 3.7 | -39.7 ± 4.0 *** | (14.6 ± 1.1) |
Basolateral membrane potential values (Vm, mV) measured in proximal tubular cells during a peritubular Ringer perfusion and upon addition of extracellular ATP at various concentrations, as indicated by the experimental series. The amplitudes of changes in Vm (ΔVm) induced by the presence of ATP are indicated in parentheses.
P < 0.05
P < 0.001.
Figure 6. Effect on basolateral membrane potential of ATP (100 μmol l−1), added to a basolateral Ringer perfusion.
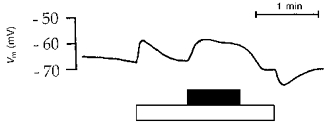
Tracing obtained with an intracellular microelectrode. Timing of perfusion with experimental solutions is indicated by horizontal bars below the graph: filled bar, 100 μmol l−1 ATP; open bar, Ringer solution. Before and after these experimental solutions, perfusion was with blood from normal circulation. In this experiment, ATP induced a sustained membrane depolarization.
Addition of 100 μmol l−1 ATP to the peritubular Ringer solution had no influence on Vte or dVte (P > 0.9, n = 6). In contrast, this experimental manoeuvre induced, concomitantly with the above-mentioned Vm change, a biphasic change in the cell membrane input conductance: dVm,ATP/dVm,Ringer immediately decreased to 0.74 ± 0.03 (n = 13, P < 0.001), then rapidly rose to 1.29 ± 0.11, a value significantly higher than the resting level (P < 0.01); this secondary rise dissipated slowly upon ATP removal.
To better ascertain whether these changes reflected changes in cell membrane properties, VDR measurements were performed. The initial effect of adding 100 μmol l−1 ATP to the basolateral Ringer perfusate was a significant decrease in VDR, from 0.41 ± 0.01 to 0.28 ± 0.03 (n = 8, P < 0.001). During ATP exposure, VDR stabilized (n = 3), or returned (partly, n = 3 or fully, n = 2) towards its initial value; a VDR increase over the control level was not observed.
Basolateral membrane mechanism underlying the electrophysiological effects of ATP
We used a K+ conductance inhibitor to depolarize the basolateral membrane: BaCl2 (2 mmol l−1) was added both to the control and the ATP-containing solutions. Under this condition, 100 μmol l−1 ATP induced a transient membrane hyperpolarization (Table 3), associated with a large increase in the cell membrane input conductance (dVm,ATP/dVm,Ba = 0.42 ± 0.08, n = 6, P < 0.001). During ATP exposure, the initial membrane hyperpolarization was followed by its repolarization (Table 3), and dVm returned towards its control value (0.91 ± 0.04, P = 0.2).
Table 3.
Effect of ATP on basolateral membrane potential in the presence of various inhibitors
| +ATP (100 μmol l−1) | ||||||
|---|---|---|---|---|---|---|
| Initial effect | Final effect | |||||
| Experimental series | n | Control Vm | Vm | (ΔVm) | Vm | (ΔVm) |
| Ba2+ (2 mmol l−1) | 9 | -29.9 ± 1.6 | -36.7 ± 1.1*** | (-7.4 ± 0.7) | -30.0 ± 1.8 n.s. | (0.5 ± 1.3) |
| DPC (500 μmol l−1) | 6 | -59.5 ± 3.8 | -52.0 ± 4.2** | (7.5 ± 1.8) | -53.5 ± 4.1 * | (6.0 ± 1.8) |
| SITS (1 mmol l−1) | 16 | -67.5 ± 2.6 | -66.0 ± 2.7 *** | (1.4 ± 0.3) | -68.4 ± 2.6 *** | (0.9 ± 0.2) |
Basolateral membrane potential values (Vm, mV) of proximal tubular cells measured in a control condition (peritubular Ringer solution perfusate, supplemented with an inhibitor as indicated by the experimental series) and in the presence of ATP (100 μmol l−1) added to the control solution. The changes in Vm (ΔVm) induced by the presence of ATP are in parentheses.
P < 0.05
P < 0.01
P < 0.001; n.s., not significant, compared with control Vm values.
Next, we examined the effect of ATP on Vm in the presence of SITS and DPC, these inhibitors of anionic transport systems being added both to the Ringer and to the ATP-containing solutions. Table 3 shows the Vm response on adding 100 μmol l−1 ATP in the presence of these compounds: 500 μmol l−1 DPC did not significantly modify (P = 0.3, Student's unpaired t test) the amplitude of the previously reported ATP-induced depolarization (9.3 ± 0.8 mV, n = 16), whereas in the presence of 1 mmol l−1 SITS, ATP induced only a slight membrane depolarization (1.4 ± 0.3 mV, n = 16), significantly smaller than that observed in the absence of inhibitor (P < 0.001, unpaired t test). In the presence of SITS, this tiny Vm change was not accompanied by an initial change in the dVm value (dVm,ATP/dVm,SITS = 0.95 ± 0.03, n = 8, P = 0.14), whereas its secondary increase was still observed (dVm,ATP/dVm,SITS = 1.17 ± 0.06, n = 8, P < 0.05).
These observations raise the possibility that the early effect of ATP is an increase in the basolateral Cl− conductance, GCl. To ascertain this point, a different protocol of peritubular perfusion was introduced: a triple-barrelled micropipette allowed alternative delivery of a Ringer solution, a low Cl− solution, or a low Cl− solution supplemented with 100 μmol l−1 ATP. This protocol allowed an evaluation of GCl in the control condition and in the presence of ATP. Table 4 shows the hyperpolarizing effect of a low Cl− solution and the large Vm change (+17.4 ± 1.7 mV, n = 14) induced by the addition of ATP to this solution. These results are consistent with a low basal GCl, largely increased by ATP. A typical experiment from this series is illustrated by Fig. 7. It can also be noticed from this figure that ATP withdrawal did not totally repolarize the membrane to the previous Vm value, suggesting that GCl did not immediately return to its basal state. Similar results were obtained in luminal oil-blocked tubules: adding 100 μmol l−1 ATP to the low Cl− solution depolarized the basolateral membrane by 22.8 ± 2.9 mV (n = 6), a value not different from that obtained in free-flow conditions (P = 0.12, unpaired t test). This latter observation confirmed that ATP acts on the basolateral cell membrane.
Table 4.
Effect of various inhibitors on the ATP-induced change in basolateral membrane potential
| +ATP (100 μmol l−1) | |||||
|---|---|---|---|---|---|
| Low Cl− condition | |||||
| Experimental series | n | Control Vm | Vm | Vm | (ΔVm) |
| No inhibitor | 14 | -67.5 ± 1.9 | -74.3 ± 2.1 | -57.3 ± 3.0 *** | (17.4 ± 1.7) |
| DPC (500 μmol l−1) | 11 | -59.1 ± 2.3 | -63.8 ± 3.5 | -48.4 ± 3.8 ** | (12.7 ± 2.1) |
| Niflumic acid (100 μmol l−1) | 4 | -62.5 ± 3.4 | -70.0 ± 3.8 | -46.5 ± 3.3 ** | (21.0 ± 4.1) |
| NPPB (100 μmol l−1) | 5 | -57.8 ± 2.5 | -61.8 ± 3.1 | -44.2 ± 3.4 *** | (17.2 ± 1.1) |
| Calix-4-arene (100 nmol l−1) | 4 | -63.7 ± 3.8 | -70.7 ± 3.4 | -42.5 ± 2.6 ** | (26.5 ± 4.1) |
| SITS (1 mmol l−1) | 7 | -70.7 ± 3.0 | -79.3 ± 3.4 | -79.0 ± 3.3 n.s. | (-0.3 ± 0.5) |
Basolateral membrane potential values (Vm, mV) of proximal tubular cells measured in a control condition (peritubular perfusate with normal Cl− concentration), in a low Cl− condition (peritubular perfusate in which sodium gluconate replaces NaCl) and in the low Cl− condition supplemented with 100 μmol l−1 ATP. The changes in Vm (ΔVm) induced by the presence of ATP to the low Cl− solution are indicated in parentheses. The experimental series indicates when an inhibitor was present in the perfusates.
P < 0.01
P < 0.001; n.s., not significant compared with the low Cl− condition.
Figure 7. Effect on basolateral membrane potential of ATP (100 μmol l−1) added to a basolateral low Cl− perfusion.
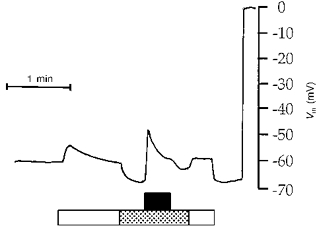
Tracing obtained with an intracellular microelectrode. Timing of perfusion with experimental solutions is indicated by the horizontal bars: filled bar, 100 μmol l−1 ATP; open bar, Ringer solution; stippled bar, low Cl− solution. Before adding ATP, the effect of reducing basolateral Cl− content was tested. Before and after these experimental solutions, perfusion was with blood from normal circulation.
Using a peritubular triple-barrelled micropipette, we investigated the effects of several Cl− conductance inhibitors on the ATP-induced Vm depolarization. Inhibitors were added to the Ringer, the low Cl− and the ATP-containing low Cl− solutions. Results are summarized in Table 4. In the presence of 1 mmol l−1 SITS, the ATP-containing low Cl− solution did not affect the Vm value observed with the low Cl− perfusate. In contrast, 500 μmol l−1 DPC, 100 μmol l−1 NPPB, 100 μmol l−1 niflumic acid and 100 nmol l−1 calix-4-arene did not prevent the ATP membrane effect.
The Cl− conductance activation is related to the purinergic receptor, but not to the [Ca2+]i increase
We next investigated a possible link between P2y receptor activation and GCl increase. We first observed that repeated exposures to 100 μmol l−1 ATP caused a progressive reduction of the ATP-induced membrane hyperpolarization in the presence of BaCl2 and a progressive reduction of the ATP-induced membrane depolarization in a low Cl− medium (Fig. 8). Second, adding 100 μmol l−1 ADP to the Ringer perfusate elicited a Vm change similar to that observed with 100 μmol l−1 ATP (9.0 ± 0.7 mV, n = 7vs. 9.3 ± 0.8 mV, n = 16, P = 0.8, unpaired t test), while Vm was stable upon adding 100 μmol l−1 adenosine (-62.5 ± 2.5 vs.−62.6 ± 2.7 mV, n = 11), as well as on adding 100 μmol l−1 UTP (-61.5 ± 2.6 vs.−61.9 ± 2.9 mV, n = 8). Third, we performed an experimental series (n = 9) in the continuous presence of 300 μmol l−1 suramin: measured Vm values were −65.5 ± 2.5 and −72.4 ± 2.5 mV during Ringer and low Cl− perfusion, respectively, and the 100 μmol l−1 ATP-containing low Cl− solution induced an insignificant 2.5 ± 1.2 mV change in Vm (P = 0.06). These observations suggest that the activation of GCl and the activation of P2y receptor were linked.
Figure 8. Effect on basolateral membrane potential of repeated ATP (100 μmol l−1) exposure.
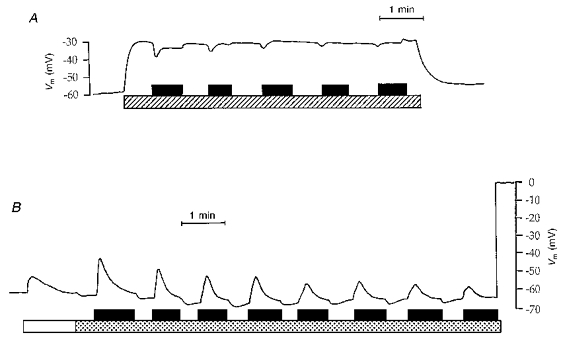
Tracings obtained with intracellular microelectrodes. Timing of perfusion with experimental solutions is indicated by the horizontal bars. In A, ATP was added to a BaCl2-containing Ringer solution. Hatched bar, Ringer solution + 2 mmol l−1 BaCl2; filled bar, 100 μmol l−1 ATP. In B, ATP was added to a low Cl− solution. Open bar, Ringer solution; stippled bar, low Cl− solution; filled bar, 100 μmol l−1 ATP. Before and after these experimental solutions, perfusion was with blood from normal circulation.
We then looked for a relationship between the rise in [Ca2+]i and the increase of GCl. Adding 1 mmol l−1 ATP to a peritubular Ca2+-free Ringer solution induced a membrane depolarization which was not different to that measured in the presence of external Ca2+ (13.4 ± 2.0 mV, n = 5vs. 14.6 ± 1.1 mV, n = 8, P = 0.6, unpaired t test). We also tested whether an increase in [Ca2+]i could increase GCl. [Ca2+]i increase was achieved by using 2.5 μmol l−1 ionomycin-supplemented peritubular perfusates (a condition which increased [Ca2+]i in less than 1 min, n = 2, data not shown), while monitoring Vm. Under this experimental condition, switching from Ringer to low Cl− solution changed Vm from −56.7 ± 2.4 to −62.3 ± 2.5 mV (n = 9), whereas a membrane depolarization would be expected if the induced rise in [Ca2+]i had an activating effect on GCl. We also performed peritubular perfusion of six PCTs with thapsigargin (2 μmol l−1)-supplemented solutions for up to 30 min (which totally inhibited the ATP-induced [Ca2+]i transients): measured Vm values were −59.3 ± 2.7 mV under Ringer solution perfusion and −63.3 ± 3.7 mV upon switching to the low Cl− solution; the addition of 100 μmol l−1 ATP to the low Cl− solution still induced a large membrane depolarization (ΔVm = 28.1 ± 2.6 mV, P < 0.001). Similarly, basolateral addition of 20 μmol l−1 of BAPTA AM in the perfusate for up to 30 min (a condition preventing the [Ca2+]i transients elicited by 100 μmol l−1 ATP, n = 4, data not shown), did not reduce the Vm change induced by adding ATP to the low Cl− solution (ΔVm = 27.0 ± 3.5 mV, n = 4, P < 0.001).
Finally, we investigated whether protein kinase C (PKC) or intracellular cAMP may induce an increase of basolateral Cl− conductance in PCT, thus being the link between a G protein-coupled P2 receptor and the GCl activation. Possible PKC activation was prevented by the basolateral perfusion (for up to 30 min) of a Ringer solution containing 1 μmol l−1 staurosporin; in the continuous presence of staurosporin, a low Cl− and an ATP-containing low Cl− solution were then substituted. Under this experimental condition (n = 4), Vm was −58.5 ± 3.1 and −63.5 ± 3.0 mV during Ringer and low Cl− perfusion, respectively. Addition of 100 μmol l−1 ATP to the low Cl− solution still changed Vm by +26.2 ± 3.1 mV (P < 0.001). Next, to test whether an increase in intracellular cAMP may activate GCl, 50 μmol l−1 of the membrane permeant cAMP analogue 8–4 CPT-cAMP was added to a standard Ringer and to a low Cl− solution. Upon adding 8–4 CPT-cAMP to the Ringer perfusate, Vm significantly increased from −59.0 ± 3.9 to −65.7 ± 2.7 mV, n = 8, P < 0.001). In the presence of 8–4 CPT-cAMP, the low Cl− solution induced a tiny membrane depolarization in two out of eight tubules (+1 and +4 mV), whereas in the six other PCTs, it hyperpolarized the membrane in a way similar to that observed in cAMP-free low Cl− condition (P = 0.12, unpaired t test).
DISCUSSION
Extracellular ATP raises [Ca2+]i through P2y receptor activation
Exposure of isolated fura-2-loaded Necturus PCTs to ATP led to a concentration-dependent increase in [Ca2+]i with an apparent half-maximal effect at about 15 μmol l−1 ATP. Comparison of the effects of ATP with the effects of other nucleotides and adenosine yielded the sequence 2MeSATP = ADP = ATP ≫ UTP, BzATP, AMPCPP, adenosine, which corresponds to conventional P2y-type receptor pharmacology (Dubyak & El-Moatassim, 1993). One may question the exact validity of such a sequence, since it was established in the absence of ectonucleotidase inhibitors, a condition which did not prevent a possible breakdown of unstable compounds and could alter their potency (Kennedy & Leff, 1995). In particular, the relative effectiveness of 2 MeSATP and AMPCPP can be notably changed by ectonucleotidase inhibition (Kennedy & Leff, 1995), hampering discrimination between P2x and P2y receptors. However, AMPCPP had no significant effect on [Ca2+]i (ΔR = 0.1 ± 0.1, n = 5), whereas at least a moderate Δ[Ca2+]i would be expected in the presence of a P2x receptor. In addition, the P2x receptor antagonist PPADS (Zinganshin et al. 1994) had no inhibitory effect on the ATP-induced [Ca2+]i transients. Furthermore, the P2x receptor functionally acts as a ligand-gated ion channel, leading to Ca2+ influx, while the P2y receptors essentially mobilize Ca2+ contained in intracellular stores (Dubyak & El-Moatassim, 1993). Our results demonstrating that the latter mechanism accounts for the ATP-induced [Ca2+]i transients further support the hypothesis that ATP acts via a P2y receptor in Necturus PCTs, and are consistent with results in PCTs of other species (Cejka et al. 1994; Yamada et al. 1996).
As reported in rabbit PCT (Yamada et al. 1996), ATP binding to a P2y receptor induced a transient increase in [Ca2+]i in Necturus PCT and no secondary sustained phase in [Ca2+]i rise. Experiments performed in the presence of thapsigargin showed that the ATP-induced [Ca2+]i transients in rabbit (Yamada et al. 1996) and Necturus (this study) PCTs were dependent on the release of Ca2+ from intracellular stores. Our results did not show clearly an ATP-induced Ca2+ influx through Ca2+ channels in Necturus PCTs. On the one hand, part of the results argue against the participation of extracellular Ca2+ in the ATP-induced [Ca2+]i change: the removal of extracellular Ca2+ for 30 s, as well as the addition of verapamil and nifedipine, known to be dihydropyridine-sensitive Ca2+ channel inhibitors (Speeding & Paoletti, 1992) or of La3+, had no detectable effect on the response to ATP. On the other hand, the effects of long-term removal of external Ca2+ argue for the participation of extracellular Ca2+ in ATP-induced [Ca2+]i change: this experimental manoeuvre totally abolished the ATP-induced response in one out of fourteen tested tubules and slightly decreased the response when measured after 1.5 min of nucleotide exposure. From these results, it is safe to conclude that the ATP-induced [Ca2+]i increase is mainly due to Ca2+ release from intracellular pools, although we emphasize that we do not exclude the participation of transient influx of extracellular Ca2+. Obviously, our results contrast with those obtained in rabbit proximal tubular cells in primary culture (Cejka et al. 1993, 1994), where an ATP-induced sustained secondary increase in [Ca2+]i was abolished by removal of extracellular Ca2+ and blocked by verapamil and La3+. They also contrast with observations on rabbit PCTs (Yamada et al. 1996): in this tissue, the ATP binding to a basolateral P2y receptor induced [Ca2+]i transients which were markedly blunted by the removal of external Ca2+ over 30 s and vanished after a 3 min incubation with the Ca2+-free solution. It should also be emphasized that the membrane localization (apical vs. basolateral) of the P2y receptor inducing [Ca2+]i rise in Necturus PCT cannot be firmly established from our [Ca2+]i measurements, which were performed on superfused tubules.
An early effect of extracellular ATP is the activation of a basolateral Cl− conductance
In a recent study performed on isolated rabbit PCTs (Yamada et al. 1996) it was reported that peritubular ATP induced an occasional basolateral membrane depolarization (< 4 mV up to 100 μmol l−1 ATP, and from 4 to 6 mV with 300 μmol l−1 ATP), but its origin was not clarified inasmuch as statistical significance was not reached. In experiments on Necturus PCTs in vivo, addition of ATP (from 50 μmol l−1 to 1 mmol l−1) to a peritubular Ringer perfusate consistently induced membrane depolarization. To better understand the discrepancies between these studies, we performed a few experiments on isolated Necturus PCTs under experimental conditions similar to those in the fura experiments. We observed (results not shown) that 100 μmol l−1 ATP added to a Ringer solution induced a constant but slight membrane depolarization (4.0 ± 0.7 mV, n = 6, P < 0.01), whereas in vivo a larger ΔVm was measured (see Results). Thus, it could be that species differences explain the differences between the results of Yamada et al. (1996) and us, but it could also be the case that the in vitro condition impairs electrophysiological results, as recently reported by Müller-Berger, Coppola, Samarzija, Seki & Frömter (1997).
The ATP-induced membrane depolarization is consistent with either inhibition of a K+ conductance or with activation of other conductances, such as those of Cl− or Na+. However, since the membrane depolarization was associated with an initial drop in VDR, one can exclude the former hypothesis as a major effect of ATP and conclude that the early effect of extracellular ATP is the activation of a basolateral rheogenic pathway.
Several arguments prompted us to test the hypothesis of an increase in the basolateral Cl− conductance. In the presence of BaCl2, a condition used to depolarize Vm (Planelles, Teulon & Anagnostopoulos, 1981), the addition of ATP hyperpolarized the basolateral membrane. Thus, the equilibrium potential of the ionic species whose conductance is increased by the presence of ATP is less negative than the basal Vm value (measured during a peritubular Ringer perfusion), but more negative than the Vm value measured in the presence of BaCl2. In the case of the activation of a diffusive pathway (the simplest hypothesis), transported ions might be Cl−: in Necturus PCT cells, across the basolateral membrane the Cl− equilibrium potential is near to −36 mV (Edelman, Bouthier & Anagnostopoulos, 1981), whereas the Ca2+ equilibrium potential is highly positive, the equilibrium potential for non-selective cation channels is nil, and the Na+ equilibrium potential, calculated from our previous measurements (Planelles, Thomas & Anagnostopoulos, 1993), is +56 mV. Moreover, SITS, an inhibitor of anionic pathways (Aronson, 1989), prevented the ATP-induced changes in Vm and cell membrane input conductance. Taken together, the results strongly suggested that extracellular ATP activated basolateral GCl, which was previously shown to be low in Necturus PCT (Anagnostopoulos & Planelles, 1979). Indeed, the sudden reduction of peritubular Cl− concentration (a manoeuvre displacing the Cl− equilibrium potential towards more positive values) induced a slight apparent hyperpolarization (related to the gluconate− liquid junction potential), confirming that under control conditions, GCl is low. The large Vm depolarization observed upon adding 100 μmol l−1 ATP to the low Cl− solution is consistent with a GCl increase. Again we checked this protocol on microdissected tubules (results not shown); we observed that in the in vitro condition, adding 100 μmol l−1 ATP to a low Cl− solution induced a membrane depolarization of 8.8 ± 1.3 mV (n = 11, P < 0.001), consistent with GCl activation. Another possibility could be that ATP activates the Na+-(HCO3−)n symport, which is present on the basolateral membrane of PCT cells and is sensitive to SITS (Boron & Boulpaep, 1983), leading to a SITS-sensitive membrane depolarization and an increase in cell conductance. However, this latter hypothesis is neither supported by our experimental protocol (nominally CO2/HCO3− free) nor by results obtained with ATP-containing low Cl− solutions: due to the Cl− independence of the Na+-(HCO3−)n symport (Boron & Boulpaep, 1983) the perfusion of a low Cl− solution would not enhance the ATP-induced membrane depolarization compared with that observed with ATP-containing Ringer solution. We conclude that in the presence of extracellular ATP a basolateral electrogenic, Cl−-dependent, SITS-sensitive pathway is activated; unless some yet unknown transport system is involved, our results are consistent with GCl activation.
Secondary effects of ATP on electrophysiological parameters were not investigated in detail, but several observations can be discussed. During ATP exposure and after its removal, the initial increase in cell membrane input conductance was followed by a secondary decrease. This secondary rise in dVm overwhelmed the control cell membrane input conductance value, except in the presence of BaCl2. On the other hand, VDR first decreased, then tended to return towards its control value; this latter observation is consistent with a transient activation of GCl and/or with a sustained activation of GCl counterbalanced with the delayed inhibition of another membrane conductance. In fact, a transient activation of GCl was not supported by the delayed return of the Vm value upon ATP withdrawal (see Fig. 7), consistent with a sustained activation of GCl. Recalling that with an intracellular current source, dVm results from current flow along the epithelial cable, and that with an intraluminal current source, dVm arises from current flow along the transcellular route, the ratio dVm,exptl/dVm,ctrl estimates the change in cell conductance and cable core conductance (including junctional conductance), whereas the voltage divider ratio dVm/dVte (both values being recorded at the same distance from the source) estimates the ratio of the membrane resistances. As a consequence, the above results suggest that, as a secondary effect, ATP induces a slight inhibition of membrane conductance (probably a Ba2+-sensitive K+ conductance; Tsuchiya, Wang, Giebisch & Welling, 1992), and an increase in cell-to-cell coupling junctional resistance (possibly induced by [Ca2+]i changes; Jojov, Lewis, Crowe, Berg & Wills, 1994). Further experiments, including cable analysis, would be needed to support this interpretation.
Further characterization of the activated Cl− conductance
It has been shown in various epithelia that P2 receptors may activate different Cl− channels (Guo et al. 1995; Nilius, Sehrer, Heinke & Droogmans, 1995; Hwang et al. 1996; Yamaya, Sekizawa, Kakuta, Ohrui, Sawai & Sasaki, 1996). We attempted to better define the channel(s) underlying the macroscopic GCl activated in the presence of ATP by using several Cl− channel inhibitors and by searching for the intracellular signal leading to GCl activation.
We observed that SITS had a powerful inhibitory effect on the ATP-induced activated GCl, consistent with the inhibition of an outwardly rectifying Cl− channel (ORCC) (Hwang et al. 1996) or of a Ca2+-activated Cl− channel. The hypothesis of ORCC activation was contradicted by the lack of effect of calix-4-arene to reduce the ATP-induced membrane depolarization, since a calix-4-arene derivative is a very potent inhibitor of ORCC in epithelial airway cells (Schwiebert, Flotte, Cutting & Guggino, 1994). Thus, we turned to the hypothesis that ATP activates a Ca2+-activated Cl− channel, inasmuch as ATP induces a [Ca2+]i increase: from this hypothesis, it follows that a [Ca2+]i increase would reproduce the ATP membrane effect, and that preventing ATP-induced [Ca2+]i increase would suppress it. To induce a rise in basal [Ca2+]i, a kidney region was perfused with ionomycin-supplemented solutions, but no significant increase in basolateral GCl was observed. We also observed that TG raised basal [Ca2+]i, but in its presence the reduction of extracellular Cl− concentration induced a Vm change similar to that observed under control conditions; moreover, ATP still induced a large membrane depolarization, whereas Ca2+ release from intracellular stocks was expected to be inhibited. In addition, ATP was introduced in a low Cl− solution in the continuous presence of BAPTA AM, a cell-permeant Ca2+ chelator; under this experimental condition, ATP-containing low Cl− solution induced a large membrane depolarization, comparable to that observed in the absence of BAPTA AM. A final argument suggesting that we were not dealing with a Ca2+-activated GCl was the lack of inhibitory effect of niflumic acid, considered an inhibitor of Ca2+-activated Cl− channels (Pacaud, Loirand, Lavie, Mironneau & Mironneau, 1989). Another possibility would be that ATP binding to a P2y receptor induced a rise in cAMPi, leading to the activation of a SITS-sensitive Cl− channel. It should be noted that the inhibition of ATP-induced Vm changes by this stilbene derivative, as well as the lack of inhibitory effect of DPC and NPPB, did not support the hypothesis of the activation of the cystic fibrosis transmembrane regulator (CFTR) (Hwang et al. 1996), although a Cl− channel presenting CFTR properties has been described on the basolateral membrane of amphibian PCT cells (Segal & Boulpaep, 1992). In the presence of a permeant cAMP compound, the inconstant and tiny membrane depolarization observed upon reduction of bath Cl− content might reflect activation of GCl by cAMPi, but the amplitude of this Vm change was certainly not comparable with the large ATP-induced membrane depolarization. Moreover, the main effect of adding 8–4 CPT-cAMP to a Ringer solution was a basolateral membrane hyperpolarization, clearly showing that the major effect of increasing cAMP content is not a GCl activation. The last hypothesis investigated in this study was that PKC may be involved in the ATP-induced GCl activation, but when preventing PKC activation by staurosporin, the effect of extracellular ATP on Vm was unchanged.
In summary, our results indicate that amphibian PCT cells are endowed with P2y receptors. ATP binding to these receptors induces (i) an increase in [Ca2+]i and (ii) an increase in basolateral GCl which does not seem to be related to PKC activation nor to [Ca2+]i or cAMPi increases. Molecular identification of the Cl− channel(s) underlying the ATP-induced macroscopic GCl, as well as the complete exploration of the signal transduction system possibly involved in GCl activation, require further investigation. The activation of a basolateral GCl may have a physiological role in Cl− reabsorption by the proximal tubule. In this tubular segment, transepithelial Cl− reabsorption is considered to be mostly paracellular. However, part of it seems to be transcellular: since Cl− uptake by apical membrane transport systems has been reported in various species, including amphibians (Seifter & Aronson, 1984; Wang, Giebisch & Aronson, 1992), a basolateral GCl activated under certain circumstances would represent a basolateral step for transcellular Cl− reabsorption by proximal tubules.
Acknowledgments
The authors are indebted to J. Teulon for continuous encouragment and advice during the course of this study and to M. Imbert-Teboul for stimulating discussions on fura calibration procedures, and thank S. R. Thomas for his critical reading of the manuscript. They would also like to thank Mireille Blonde for expert technical assistance. P. B. is supported by an ARC fellowship.
References
- Anagnostopoulos T, Planelles G. Organic anion permeation at the proximal tubule of Necturus: an electrophysiological study of the peritubular membrane. Pflügers Archiv. 1979;381:231–239. doi: 10.1007/BF00583254. [DOI] [PubMed] [Google Scholar]
- Anagnostopoulos T, Teulon J, Edelman E. Conductive properties of the proximal tubule in Necturus kidney. Journal of General Physiology. 1981;75:553–587. doi: 10.1085/jgp.75.5.553. [DOI] [PMC free article] [PubMed] [Google Scholar]
- Aronson PS. The renal proximal tubule: a model for diversity of anion exchangers and stilbene-sensitive anion transporters. Annual Review of Physiology. 1989;51:419–441. doi: 10.1146/annurev.ph.51.030189.002223. [DOI] [PubMed] [Google Scholar]
- Boron WB, Boulpaep EL. Intracellular pH regulation in the renal proximal tubule of the salamander. Basolateral HCO3− transport. Journal of General Physiology. 1983;81:53–94. doi: 10.1085/jgp.81.1.53. [DOI] [PMC free article] [PubMed] [Google Scholar]
- Cejka JC, Bidet M, Tauc M, Poujeol P. Nucleotides mobilize intracellular calcium stores of renal proximal cells in primary culture: existence of a suramin-sensitive mechanism. Biochimica et Biophysica Acta. 1993;1176:7–12. doi: 10.1016/0167-4889(93)90170-t. [DOI] [PubMed] [Google Scholar]
- Cejka JC, Le Maout S, Bidet M, Tauc M, Poujeol P. Activation of calcium influx by ATP and store depletion in primary cultures of renal proximal cells. Pflügers Archiv. 1994;427:33–41. doi: 10.1007/BF00585939. [DOI] [PubMed] [Google Scholar]
- Chan HC, Zhou WL, Wang PDY. Extracellular ATP activates both Ca2+- and cAMP-dependent Cl− conductances in rat epididymal cells. Journal of Membrane Biology. 1995;147:185–193. doi: 10.1007/BF00233546. [DOI] [PubMed] [Google Scholar]
- Dubyak GR, El-Moatassim C. Signal transduction via P2-purinergic receptors for extracellular ATP and other nucleotides. American Journal of Physiology. 1993;265:C577–606. doi: 10.1152/ajpcell.1993.265.3.C577. [DOI] [PubMed] [Google Scholar]
- Edelman A, Bouthier M, Anagnostopoulos T. Chloride distribution in the proximal convoluted tubule of Necturus kidney. Journal of Membrane Biology. 1981;62:7–17. doi: 10.1007/BF01870195. [DOI] [PubMed] [Google Scholar]
- Fabiato A. Myoplasmic free calcium concentration reached during the twitch of an intact isolated cardiac cell and during calcium-induced release of calcium from the sarcoplasmic reticulum of a skinned cardiac cell from the adult rat or rabbit ventricle. Journal of General Physiology. 1981;78:457–497. doi: 10.1085/jgp.78.5.457. [DOI] [PMC free article] [PubMed] [Google Scholar]
- Grynkiewicz G, Poenie M, Tsien RY. A new generation of Ca2+ indicators with greatly improved fluorescence properties. Journal of Biological Chemistry. 1985;260:3440–3450. [PubMed] [Google Scholar]
- Guo X, Merlin D, Harvey RD, Laboisse C, Hopfer U. Stimulation of Cl− secretion by extracellular ATP does not depend on increased Ca2+ in HT-29.cl16E. American Journal of Physiology. 1995;269:C1457–1463. doi: 10.1152/ajpcell.1995.269.6.C1457. [DOI] [PubMed] [Google Scholar]
- Hwang TH, Schwiebert EM, Guggino WB. Apical and basolateral ATP stimulates tracheal epithelial chloride secretion via multiple purinergic receptors. American Journal of Physiology. 1996;270:C1611–1623. doi: 10.1152/ajpcell.1996.270.6.C1611. [DOI] [PubMed] [Google Scholar]
- Jojov B, Lewis SA, Crowe WE, Berg JR, Wills NK. Role of intracellular Ca2+ in modulation of tight junction resistance in A6 cells. American Journal of Physiology. 1994;266:F775–784. doi: 10.1152/ajprenal.1994.266.5.F775. [DOI] [PubMed] [Google Scholar]
- Kennedy C, Leff P. How should purinoreceptors be classified pharmacologically. Trends in Pharmacological Sciences. 1995;16:168–174. doi: 10.1016/s0165-6147(00)89010-0. [DOI] [PubMed] [Google Scholar]
- McCarthy NA, O'Neil RG. Dihydropyridine-sensitive cell volume regulation in proximal tubule: the calcium window. American Journal of Physiology. 1990;259:F950–960. doi: 10.1152/ajprenal.1990.259.6.F950. [DOI] [PubMed] [Google Scholar]
- Middleton JP, Mangel AW, Basavappa S, Fitz JG. Nucleotide receptors regulate membrane ion transport in renal epithelial cells. American Journal of Physiology. 1993;263:C348–356. doi: 10.1152/ajprenal.1993.264.5.F867. [DOI] [PubMed] [Google Scholar]
- Müller-Berger S, Coppola S, Samarzija I, Seki G, Frömter E. Partial recovery of in vivo function by improved incubation conditions of isolated renal proximal tubule. I. Change of amiloride-inhibitable K+ conductance. Pflügers Archiv. 1997;434:373–382. doi: 10.1007/s004240050410. [DOI] [PubMed] [Google Scholar]
- Nilius B, Sehrer J, Heinke S, Droogmans G. Ca2+ release and activation of K+ and Cl− currents by extracellular ATP in distal nephron epithelial cells. American Journal of Physiology. 1995;269:C376–384. doi: 10.1152/ajpcell.1995.269.2.C376. [DOI] [PubMed] [Google Scholar]
- Nischke R, Fröbe U, Greger R. Antidiuretic hormone acts via V1 receptors on intracellular calcium in the isolated perfused rabbit cortical thick ascending limb. Pflügers Archiv. 1991;417:622–632. doi: 10.1007/BF00372961. [DOI] [PubMed] [Google Scholar]
- Pacaud P, Loirand G, Lavie JL, Mironneau C, Mironneau J. Calcium-activated chloride current in rat vascular smooth muscle cells in short-term primary culture. Pflügers Archiv. 1989;413:629–636. doi: 10.1007/BF00581813. [DOI] [PubMed] [Google Scholar]
- Paulais M, Baudouin-Legros M, Teulon J. Extracellular ATP and UTP trigger calcium entry in mouse cortical thick ascending limbs. American Journal of Physiology. 1995;268:F496–502. doi: 10.1152/ajprenal.1995.268.3.F496. [DOI] [PubMed] [Google Scholar]
- Planelles G, Kurkdjian A, Anagnostopoulos T. Cell and luminal pH in the proximal tubule of Necturus kidney. American Journal of Physiology. 1984;247:F932–938. doi: 10.1152/ajprenal.1984.247.6.F932. [DOI] [PubMed] [Google Scholar]
- Planelles G, Teulon J, Anagnostopoulos T. The effects of barium on the electrical properties of the basolateral membrane in proximal tubule. Naunyn-Schmiedeberg's Archives of Pharmacology. 1981;318:135–141. doi: 10.1007/BF00508838. [DOI] [PubMed] [Google Scholar]
- Planelles G, Thomas SR, Anagnostopoulos T. Change of apparent stoichiometry of proximal tubule Na+-HCO3− cotransport upon experimental reversal of its orientation. Proceedings of the National Academy of Sciences of the USA. 1993;90:7406–7410. doi: 10.1073/pnas.90.15.7406. [DOI] [PMC free article] [PubMed] [Google Scholar]
- Schwiebert EM, Flotte T, Cutting GR, Guggino WB. Both CFTR and outwardly rectifying chloride channels contribute to cAMP-stimulated whole cell chloride currents. American Journal of Physiology. 1994;266:C1464–1477. doi: 10.1152/ajpcell.1994.266.5.C1464. [DOI] [PubMed] [Google Scholar]
- Segal AS, Boulpaep EL. cAMP activated chloride channels on the basolateral membrane of renal proximal tubule. Journal of the American Society of Nephrology. 1992;3:819. [Google Scholar]
- Seifter JL, Aronson PS. Cl− transport via anion exchange in Necturus renal microvillus membranes. American Journal of Physiology. 1984;247:F888–895. doi: 10.1152/ajprenal.1984.247.6.F888. [DOI] [PubMed] [Google Scholar]
- Speeding M, Paoletti R. Classification of calcium channels and the sites of action of drugs modifying channel function. Pharmacological Review. 1992;44:363–376. [PubMed] [Google Scholar]
- Stutts MJ, Chinet TC, Mason SJ, Fullton JM, Clarke LL, Boucher RC. Regulation of Cl− channels in normal and cystic fibrosis airway epithelial cells by extracellular ATP. Proceedings of the National Academy of Sciences of the USA. 1992;89:1621–1625. doi: 10.1073/pnas.89.5.1621. [DOI] [PMC free article] [PubMed] [Google Scholar]
- Stutts MJ, Fitz JG, Paradiso AM. Multiple modes of regulation of airway epithelial chloride secretion by extracellular ATP. American Journal of Physiology. 1994;267:C1442–1451. doi: 10.1152/ajpcell.1994.267.5.C1442. [DOI] [PubMed] [Google Scholar]
- Taniguchi S, Marchetti J, Morel F. Cytosolic free calcium in single microdissected rat cortical collecting tubules. Pflügers Archiv. 1989;414:125–133. doi: 10.1007/BF00580953. [DOI] [PubMed] [Google Scholar]
- Teulon J, Planelles G, Anagnostopoulos T. Electrical responses of peritubular membrane to cationic substitutions in Necturus. Renal Physiology. 1978;1:211–218. [Google Scholar]
- Tsuchiya K, Wang W, Giebisch G, Welling PA. ATP is a coupling modulator of parallel Na,K-ATPase-K-channel activity in the renal proximal tubule. Proceedings of the National Academy of Sciences of the USA. 1992;89:6418–6422. doi: 10.1073/pnas.89.14.6418. [DOI] [PMC free article] [PubMed] [Google Scholar]
- Wang T, Giebisch G, Aronson PS. Effects of formate and oxalate on volume absorption in rat proximal tubule. American Journal of Physiology. 1992;263:F37–42. doi: 10.1152/ajprenal.1992.263.1.F37. [DOI] [PubMed] [Google Scholar]
- Weinberg JM, Davis JA, Shayman JA, Knight PR. Alterations of cytosolic calcium in LLC-PK1 cells induced by vasopressin and exogenous purines. American Journal of Physiology. 1989;256:C967–976. doi: 10.1152/ajpcell.1989.256.5.C967. [DOI] [PubMed] [Google Scholar]
- Yamada H, Seki G, Taniguchi S, Uwatoko S, Suzuki K, Kurokawa K. Mechanism of [Ca2+]i increase by extracellular ATP in isolated rabbit renal proximal tubules. American Journal of Physiology. 1996;270:C1096–1104. doi: 10.1152/ajpcell.1996.270.4.C1096. [DOI] [PubMed] [Google Scholar]
- Yamaya M, Sekizawa K, Kakuta Y, Ohrui T, Sawai T, Sasaki H. P2u-purinoreceptor regulation of chloride secretion in cultured human tracheal submucosal glands. American Journal of Physiology. 1996;270:L979–984. doi: 10.1152/ajplung.1996.270.6.L979. [DOI] [PubMed] [Google Scholar]
- Zinganshin AU, Hoyle CHV, Bo X, Lambrecht G, Mutschler E, Bäumert HG, Burnstock G. Selective antagonism by PPADS at P2x-purinoreceptors in rabbit isolated blood vessels. British Journal of Pharmacology. 1994;111:923–929. doi: 10.1111/j.1476-5381.1994.tb14827.x. [DOI] [PMC free article] [PubMed] [Google Scholar]