



Abstract
High voltage activated (HVA) Ca2+ channels are composed of a pore-forming α1 subunit and the accessory β and α2–δ subunits. However, the subunit composition of low voltage activated (LVA), or T-type, Ca2+ channels has yet to be elucidated. We have examined whether native calcium channels in NG108-15 mouse neuroblastoma × rat glioma hybrid cells, which express predominantly LVA currents when undifferentiated, are modulated by overexpression of accessory calcium channel subunits.
Endogenous α1A, B, C, D and E, and low levels of β and α2–δ subunit protein were demonstrated in undifferentiated NG108-15 cells.
The α2–δ, β2a or β1b accessory subunits were overexpressed by transfection of the cDNAs into these cells, and the effect examined on the endogenous Ca2+ channel currents. Heterologous expression, particularly of α2–δ but also of β2a subunits clearly affected the profile of these currents. Both subunits induced a sustained component in the currents evoked by depolarizing voltages above −30 mV, and α2–δ additionally caused a depolarization in the voltage dependence of current activation, suggesting that it also affected the native T-type currents. In contrast, β1b overexpression had no effect on the endogenous Ca2+ currents, despite immunocytochemical evidence for its expression in the transfected cells.
These results suggest that in NG108-15 cells, overexpression of the Ca2+ channel accessory subunits α2–δ and β2a induce a sustained component of HVA current, and α2–δ also influences the voltage dependence of activation of the LVA current. It is possible that native T-type α1 subunits are not associated with β subunits.
Voltage-dependent Ca2+ channels (VDCCs) form a group of hetero-oligomeric membrane-spanning proteins (for review see Dolphin, 1995). Biophysical and pharmacological techniques have enabled native Ca2+ channel currents in many cell types to be subdivided into two major categories depending upon their kinetics and voltage-dependent properties: high voltage activated (HVA) and low voltage activated (LVA) or T-type currents (Carbone & Lux, 1984; Fedulova, Kostyuk & Veselovsky, 1985).
From the initial purification studies, and the subsequent cloning of the cDNA for the constituent proteins, it became clear that calcium channels are generated by hetero-oligomers consisting of a pore-forming α1 subunit and two auxiliary subunits termed α2–δ and β. The cDNAs for seven α1 subunits have been cloned and functionally expressed: α1A, B, C, D, E, G and S (Perez-Reyes et al. 1998; see Perez-Reyes & Schneider, 1994, for review), and there are four genes for β subunits (Perez-Reyes & Schneider, 1994). Of the known α1 subunits, only α1G (Perez-Reyes et al. 1998) gives rise to a current with the properties of a rapidly inactivating T-type current, although the α1E subunit also shows certain of the requisite characteristics of LVA currents (Bourinet et al. 1996; Stephens, Page, Burley, Berrow & Dolphin, 1997). In a recent study from this laboratory we have observed that expression of three calcium channel α1 subunits (α1B, C and E) can give rise to small conductance channels with striking similarities to native T-type single channels, as well as the large conductance channels previously observed (Meir & Dolphin, 1998). Furthermore, the small conductance channels, particularly those of α1B and α1C, may be observed in isolation at low depolarizations, and in the absence of accessory subunits (Meir & Dolphin, 1998).
It has been demonstrated that Ca2+ channel β subunits play a significant role in the modulation of the currents generated by individual HVA α1 subunits. In general, co-expression of β subunits with α1 subunits results in an increase in calcium current amplitude, by increasing expression at the plasma membrane (Chien et al. 1995; Brice et al. 1997), and can affect both voltage-dependent and kinetic properties (Neely, Wei, Olcese, Birnbaumer & Stefani, 1993; De Waard & Campbell, 1995). Co-expression of the α2–δ subunit with α1 subunits also causes a potentiation in current, particularly when β is also present (Williams et al. 1992; Gurnett, De Waard & Campbell, 1996). However, the role of auxiliary subunits in the modulation of LVA currents is less clear. It has been observed that expression of β subunits will slow the inactivation of endogenous oocyte T-type current (Lacerda, Perez-Reyes, Wei, Castellano & Brown, 1994), but in contrast it has recently been established that the antisense depletion of β subunits in nodose ganglion neurons has no effect on the endogenous T-type currents (Lambert et al. 1997). Furthermore the recently cloned α1G subunit showed the properties of T-type currents when expressed in the absence of accessory subunits, and has no consensus β binding site in the I-II loop (Perez-Reyes et al. 1998).
In this study we have investigated the identity of the Ca2+ channel subunits present in undifferentiated NG108-15 cells using reverse transcriptase-polymerase chain reaction (RT-PCR) and immunocytochemistry, to determine which calcium channel subunits are present in this cell line that expresses predominantly T-type currents when undifferentiated. Furthermore, we have examined the effects of overexpressing the α2–δ subunit, and also two β subunits, β1b and β2a, which have differing effects on inactivation of HVA currents (Olcese et al. 1994; De Waard & Campbell, 1995), on the endogenous Ca2+ channel currents in these cells.
METHODS
Cell culture and transfection
NG108-15 cells (passage 33–46) were cultured in a medium consisting of modified Eagle's medium (Gibco) supplemented with 10 % fetal calf serum and 2 % HAT supplement (Gibco) at 37°C in a 5 % CO2 atmosphere. Cultures were grown to 80 % confluence, then either split 1: 3 or transfected with cDNA. Undifferentiated NG108-15 cells were removed from flasks by gentle agitation, and centrifuged (300 g) to a pellet in 6 ml phosphate-buffered saline (PBS, Sigma). The pellet of cells was resuspended in 0.5 ml PBS and added to an electroporation cuvette (Invitrogen, Leek, The Netherlands) containing 2 μg Mut3-Green Fluorescent Protein (GFP) cDNA and either 20 μg Ca2+ channel subunit cDNA or 20 μg blank plasmid cDNA. The cuvette was placed on ice for 10 min before exposure to a single electrical pulse by an Electroporator II (Invitrogen), power supply settings: 330 V, 25 mA, 25 W, Electroporator II settings: 500 μF, ∞ MΩ. The cells were then placed on ice for a further 10 min before being resuspended in 15 ml culture medium and plated out onto 35 mm Petri dishes. Cells were then used for electrophysiological recording 48–72 h later. Cells for immunocytochemistry were plated onto 22 mm2 poly-D-lysine (Sigma)-coated glass coverslips and fixed and stained 48–72 h later.
cDNAs used
The rat β1b (X61394) cDNA was provided by Dr T. Snutch (University of British Columbia, Vancouver, Canada). Rat β2a (M80545) was provided by Dr E. Perez-Reyes (Loyola University Chicago, IL, USA). The full-length rat α2–δ (neuronal splice variant, M86621) was provided by Dr H. Chin (NIH, Washington, DC, USA). The S65T mutant of GFP was a gift from Dr S. Moss, UCL, UK. All DNAs were sub-cloned, using standard techniques, into the pRK5 expression vector.
RT-PCR
RNA was isolated from a 75 cm2 flask of undifferentiated NG108-15 cells and from homogenized mouse brain using the RNeasy miniprep kit (Qiagen, Crawley, UK). Reverse transcription (RT) was carried out using M-MLV reverse transcriptase (Promega, Southampton, UK) in the presence of RNasin (Promega) and random hexamer primers (Promega) at 37°C for 60 min. The following primers were used for the polymerase chain reaction (PCR): α1A, CAG CAT CAC AGA CAT CCT CG and AGA CAC GCA CGT ACT CAT CC; α1B, CGA AAT GAC CTC ATC CAT GCA G and TTC TGG AGC CTT AGC TGA CTG G; α1C, GGA GTT GGA CAA GGC TAT GAA GGA and GAC CTA GAG AGG CAG AGC GAA GGA; α1D, TTA GTG ACG CCT GGA ACA CG and GTG GTG TTC TTC GCA GGG TA; α1E, GAA GTC CAT CAT GAA GGC CA and AGC AAG CAT GAC TTC CTC TG; β1b, CCT ATG ACG TGG TGC CTT CC and CTT CCA GTA GGC TTC CAA GT; β2, AGA AGA CAG AGC ACA CTC CTC C and GGC TCA GAG GTA AAG TTG AGG T; β3, CTC TAG CCA AGC AGA AGC AA and AGG CAT CTG CAT AGT CCT CC; β4, ATC AAT GCG TCC TGT GGT GT and CAA GCG GTT CCT ACT CTT GC; α2–δ, GAA CTC AAC TGG ACA AGT GCC T and GCC ATC CAC TGA ATA GGT CCT C. PCR was carried out using BIOTAQ Polymerase (Bioline, London, UK) at 95°C for 5 min, followed by thirty cycles of 95°C for 30 s, 60°C for 30 s, 72°C for 1 min and one cycle of 72°C for 5 min.
Immunocytochemistry
Transfected NG108-15 cells attached to coverslips were washed with Tris-buffered saline (TBS, 150 mM NaCl, 40 mM Tris, pH 7.4), then fixed with 4 % paraformaldehyde in TBS for 15 min at room temperature (20-24°C). Permeabilization of the cells, when required, was achieved by 3 × 5 min washes in 0.02 % (v/v) Triton X-100 in TBS. For α1A and α1D, in some experiments the antigenic epitope was exposed by depolarization in 0 Ca2+, 50 mM K+ medium before fixation, and the cells were not permeabilized (Brice et al. 1997; Wyatt et al. 1997). Cells were then washed (3 × 5 min) with TBS containing 20 % goat serum, 4 % bovine serum albumin and 0.1 % dl-lysine to block non-specific binding sites (TBS serum), and incubated with a 1: 500 dilution of the following Ca2+ channel antisera: α1A (Brice et al. 1997), α1B (Stephens, Brice, Berrow & Dolphin, 1998), α1C (Wyatt et al. 1997), α1D (Wyatt et al. 1997), β subunit (Berrow, Campbell, Fitzgerald, Brickley & Dolphin, 1995), α2–δ (Brickley et al. 1995) or with 0.1 μg ml−1 of α1E affinity-purified polyclonal antibody (Day et al. 1996) in TBS serum overnight at 4°C. The cells were then washed in TBS serum (4 × 5 min) and incubated with goat anti-rabbit IgG conjugated to biotin (1: 200 dilution, Sigma) for 2 h at 4°C before being washed again (4 × 5 min) with TBS serum and incubated in the dark for 1 h at room temperature with 10 μg ml−1 streptavidin-Texas Red conjugate (Molecular Probes). Cells were finally washed (5 × 5 min) in TBS and mounted in antifade mountant (Citifluor, City University, London, UK) before being viewed with a confocal scanning microscope (MRC-1024, Bio-Rad, Hemel Hempstead, UK). All images are 1 μm sections midway through the cells in the vertical plane.
Electrophysiology
Successfully transfected cells were located by the presence of GFP using fluorescence microscopy. Only spherical cells with no morphological signs of differentiation were used. Once identified, the calcium channel currents were recorded using the whole cell configuration of the patch clamp technique (Hamill, Marty, Neher, Sakmann & Sigworth, 1981). Calcium current recordings were made with a patch pipette solution containing (mM): caesium aspartate, 140; EGTA, 5.0; MgCl2, 2.0; CaCl2, 0.1; K2ATP, 2.0; GTP, 0.1; Hepes, 10; pH 7.2, adjusted to 310 mosmol l−1 with sucrose. The extracellular solution contained (mM): TEA-Br, 160; KCl, 3.0; NaHCO3, 1.0; MgCl2, 1.0; Hepes, 10; glucose, 4.0; BaCl2, 5.0; tetrodotoxin (TTX), 0.0005; pH 7.4, adjusted to 320 mosmol l−1 with sucrose. In some experiments the presence of TTX-resistant Na+ currents was examined using a patch pipette solution containing (mM): CsCl, 120; NaCl, 10; EGTA, 5.0; MgCl2, 2.5; KCl, 5; K2ATP, 0.5; Hepes, 5; pH 7.2, adjusted to 300 mosmol l−1 with sucrose. The corresponding extracellular solution contained (mM): NaCl, 100; TEA-Cl, 40; KCl, 5.0; Na2HPO4, 2.0; MgCl2, 2.5; Hepes, 5; glucose, 10; CaCl2, 0.01; tetrodotoxin (TTX), 0.0005; pH 7.4, adjusted to 320 mosmol l−1 with sucrose. Patch pipettes (2–5 MΩ) were made from borosilicate glass, fire polished and coated with Sigmacote (Sigma). The liquid junction potential between the internal and external solutions used was 10 mV, and all voltages have been corrected for this. Inward currents were evoked from a holding potential of −110 mV by stepping to voltages between −80 and 40 mV in 10 mV steps for 200 ms at 0.1 Hz. An Axopatch-1D amplifier (Axon Instruments) was used; recordings were filtered at 1–2 kHz (4-pole low-pass Bessel filter) and digitized at 10 kHz using a Digidata 1200 A/D converter. Currents were analysed using pCLAMP 6.02 software (Axon Instruments) and leak subtracted using a P/4 or P/8 protocol. The holding current at −110 mV was usually less than 10 pA; series resistance was normally less than 10 MΩ and was routinely compensated by at least 60 %. All experiments were carried out at room temperature (20–24°C).
Peak current was measured by taking an average over 2 ms at the peak of each current evoked at each potential; sustained current was measured by taking an average over 10 ms at the end of the 200 ms pulse; current values were then converted to current densities by correcting for cell capacitance. All data presented are means ±s.e.m., and statistical significance was determined using Student's t test. S-(-)-Bay K 8644 was obtained from RBI, Natick, MA, USA.
RESULTS
Calcium channel mRNA species present in undifferentiated NG108-15 cells
RT-PCR showed that calcium channel α1A, α1B, α1C, α1E, α2–δ, β1b, β2, β3 and β4 subunit mRNA could be detected in undifferentiated NG108-15 cells (Fig. 1). The primers for all subunits were designed to prime on both rat and mouse sequences. Where the mouse sequences were not available, primers were designed in regions conserved between other species. All primer pairs gave a positive result when used for RT-PCR on mouse brain tissue (results not shown).
Figure 1. RT-PCR detection of calcium channel α1A, α1B, α1C, α1E, α2–δ, β1b, β2, β3 and β4 subunit mRNA in undifferentiated NG108-15 cells.
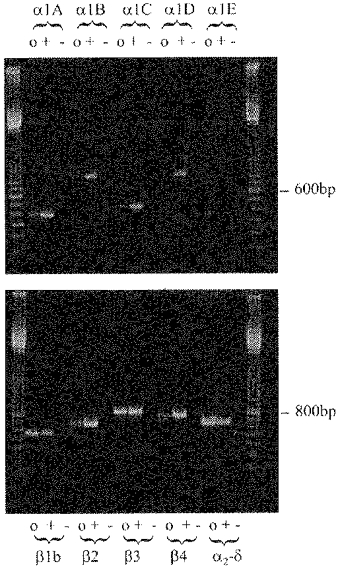
Primer sequences are given in Methods. For each primer pair, a mix was made up and divided into the following: o, NG108-15 reverse-transcribed aliquot; +, rat brain cDNA (10 pg) (positive control); -, water (negative control). DNA markers are 100 bp ladder. All mRNAs were detected except that of α1D.
Calcium channel protein species present in undifferentiated NG108-15 cells
Immunostaining in undifferentiated NG108-15 cells was observed for α1A (Fig. 2A and B), α1B (Fig. 2C), α1C (Fig. 2D), α1D (Fig. 2E and F) and α1E (Fig. 2G). In the case of α1B, α1C and α1E, the antigenic epitopes were intracellular, on the II-III loop. The α1E antibody was raised against a fusion protein of the human α1E II-III loop (Volsen et al. 1995), but cross-reacts with rat and mouse α1E (S. Volsen, Eli Lilly Research, UK, personal communication), and the α1B and α1C antipeptide antibodies were raised against epitopes common to rat and mouse sequences (Wyatt et al. 1997; Stephens et al. 1998). Whereas the α1B staining was particularly strong, and appeared to be membrane associated (Fig. 2C), that for α1C was very weak, with very little membrane association (Fig. 2D) and the α1E immunostaining was diffuse, with a small amount of apparent membrane association (Fig. 2G). For α1A and α1D, the antigenic epitopes are exofacial, being adjacent to the pore region, and we have previously shown that they can be exposed by depolarization before fixation, without permeabilization of the cell membrane (Brice et al. 1997; Wyatt et al. 1997). Under these conditions, immunostaining was seen in non-permeabilized NG108-15 cells for both α1A (Fig. 2B) and α1D (Fig. 2F), indicating that both α1 subunits are inserted in the plasma membrane.
Figure 2. Immunostaining for endogenous calcium channel α1, α2–δ and β subunits in undifferentiated NG108-15 cells.
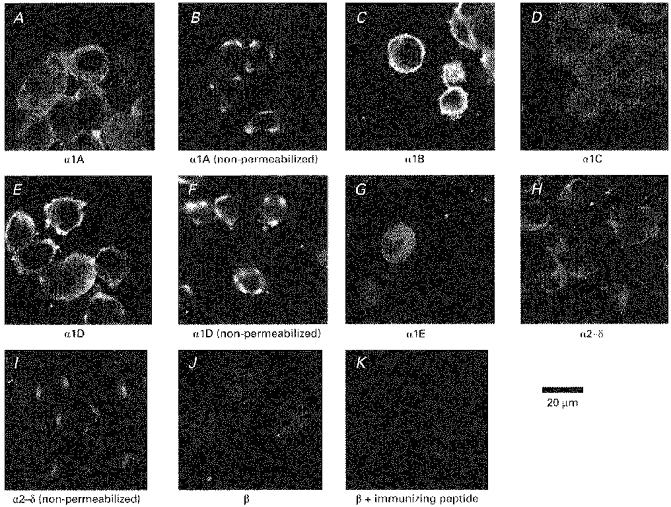
Undifferentiated NG108-15 cells were fixed and stained for the α1, α2–δ and β subunits as described in Methods. Cells were permeabilized, where stated, to enable the primary antibody to reach its intracellular epitope. A, α1A (permeabilized); B, α1A (non-permeabilized, depolarized); C, α1B (permeabilized); D, α1C (permeabilized); E, α1D (permeabilized); F, α1D (non-permeabilized, depolarized); G, α1E (permeabilized); H, α2–δ (permeabilized); I, α2–δ (non-permeabilized); J, β (permeabilized); K, control (β subunit antibody preincubated with immunizing peptide). Where stated, cells were depolarized before fixation, as described in Methods, to expose an exofacial epitope on α1A or α1D.
A low level of intracellular immunostaining was observed for α2–δ in permeabilized undifferentiated NG108-15 cells (Fig. 2H), but less staining was observed in non-permeabilized cells (Fig. 2I), indicating that there is little α2–δ correctly inserted into the membrane, with the α2 subunit oriented exofacially (Brickley et al. 1995). Of interest, this membrane staining for α2 was generally restricted to one or two foci in the cells. Very low and diffuse intracellular immunostaining was observed for β subunits (Fig. 2J), using an anti-peptide polyclonal antibody that we have shown recognizes all β subunit isoforms (Berrow et al. 1995). This staining was, however, specific, as it was blocked by preincubation of the antibody with the immunizing peptide (Fig. 2K) (Berrow, Campbell, Fitzgerald, Brickley & Dolphin, 1995). No immunostaining was observed with preimmune serum (results not shown).
Evidence for the overexpression of calcium channel accessory subunits
Following transfection with α2–δ, β2a or β1b, immunocytochemical evidence was obtained for overexpression of these subunits at the plasma membrane in GFP-positive cells (Fig. 3).
Figure 3. Immunostaining for overexpressed calcium channel subunits in NG108-15 cells transfected with α2–δ, β2a and β1b.
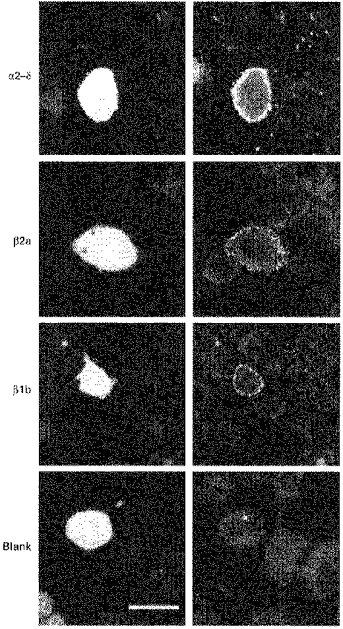
Undifferentiated NG108-15 cells were transfected with α2–δ, β2a, β1b and blank plasmid, together with GFP, fixed 48 h after transfection, and stained for the transfected subunit as described in Methods, except ‘Blank’ which was stained for β subunit. The left panel shows the cell in the field that was GFP positive and the right panel shows immunostaining for the respective subunit. No staining was observed using preimmune serum as a control (not shown). Scale bar, 15 μm.
Properties of Ca2+ currents in NG108-15 cells
T-type calcium channel currents were present in all undifferentiated NG108-15 cells, recorded with either 5 mM Ca2+ (Fig. 4A and B) or 5 mM Ba2+ (Fig. 4C–F) as charge carrier. They started to activate at about −60 mV in both conditions, and the peak current was observed at −20 mV. The currents showed rapid voltage-dependent inactivation, with a time constant of inactivation (τinact) of between 70 and 25 ms, depending on the voltage. The proportion of current remaining at the end of the 200 ms steps used here was about 6 % at −30 mV (Fig. 4D and F). Application of 1 μM S-(-)-Bay K 8644, which markedly enhances L-type current, caused an increase in the peak barium current (IBa) at voltages of −30 mV and above (Fig. 4D and E), and a substantial elevation of the sustained current component at large depolarizations (Fig. 4E and F), indicating the presence of L-type channels in the membrane, which in the absence of the calcium channel agonist show very little activity.
Figure 4. Effect of the L-channel agonist Bay K 8644 on T-type calcium currents in undifferentiated NG108-15 cells.
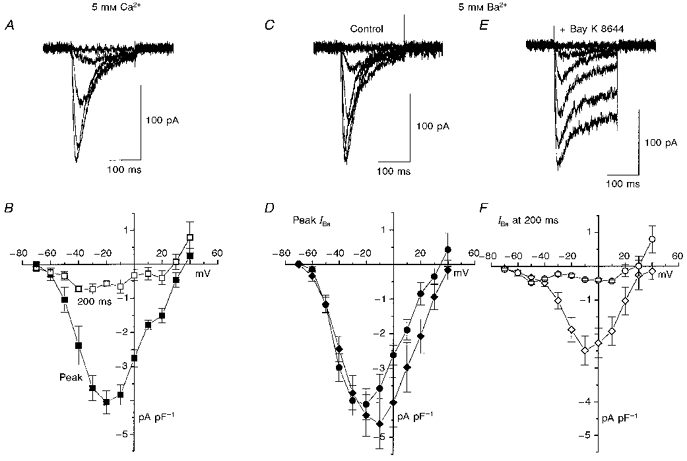
A, examples of current traces from undifferentiated NG108-15 cells recorded with 5 mM Ca2+ (200 ms voltage steps to test potentials from −70 to −30 mV in 10 mV steps). B, mean (±s.e.m.) current-voltage relationships for peak calcium current (ICa; ▪) and ICa at end of 200 ms step (□, n = 7). C and E, examples of current traces from undifferentiated NG108-15 cells recorded with 5 mM Ba2+ (-60 to −20 mV test potentials), under control conditions (C) and in the presence of 1 μM S-(-)-Bay K 8644 (E). D, mean (±s.e.m.) current-voltage relationships for peak barium current (IBa) in control conditions (•, n = 5) and in the presence of Bay K 8644 (♦, n = 8). F, mean (±s.e.m.) current-voltage relationships for IBa at end of 200 ms step in control conditions (^) and in the presence of Bay K 8644 (⋄).
If TTX-resistant Na+ channels are present together with T-type currents, it is difficult to record the latter in isolation (Bossu & Feltz, 1984; Ikeda & Schofield, 1987). However, as TTX-resistant Na+ currents may be recorded uncontaminated from T-currents by using Na+ as the charge carrier in the presence of 10 μM Ca2+ to block Na+ flux through Ca2+ channels (Ikeda & Schofield, 1987), we therefore examined whether TTX-resistant Na+ currents were present in NG108-15 cells. No evidence was found for TTX-resistant Na+ currents (results not shown), indicating that recorded Ca2+ channel currents are not contaminated by Ca2+ entry through Na+ channels.
Effect of overexpression of calcium channel α2–δ subunits on the biophysical properties of the Ca2+ channel currents in undifferentiated NG108-15 cells
Overexpression of α2–δ significantly shifted the voltage dependence of activation of the peak T-type current (Table 1), so that the maximum current appeared at −10 rather than −20 mV (Fig. 5A). It also induced the appearance of a large sustained current component at depolarizations above −30 mV (Fig. 5B). A comparison of the current profiles in the absence and presence of overexpressed α2–δ shows little effect on the rapidly inactivating T-type current component at low depolarizations (-60 to −40 mV, Fig. 6A), whereas the subtracted currents demonstrate the emergence of the sustained component at larger depolarizations (Fig. 6B). The rate and voltage dependence of inactivation of the currents was not affected by α2–δ (Fig. 7A), but the proportion of the plateau current determined from a single exponential fit was markedly increased (Fig. 7B), for example from about 15 % to 50 % at 0 mV.
Table 1.
Effect of overexpression of α2–δ and β subunits on biophysical parameters of Ca2+ channel current-voltage relationships in undifferentiated NG108-15 cells
| n | Capacitance (pF) | Gmax (nS pF−1) | Vrev (mV) | V½ (mV) | k (mV) | |
|---|---|---|---|---|---|---|
| Blank | 20 | 32.9 ± 3.0 | 0.11 ± 0.01 | 32.4 ± 2.2 | -43.9 ± 1.2 | 7.4 ± 0.3 |
| α2–δ | 8 | 37.0 ± 3.8 | 0.12 ± 0.01 | 39.9 ± 4.8 | -36.2 ± 4.1* | 10.4 ± 0.7 ** |
| β2a | 12 | 35.1 ± 2.4 | 0.11 ± 0.01 | 36.7 ± 2.3 | -42.2 ± 1.5 | 9.9 ± 1.4 * |
| β1b | 7 | 27.8 ± 1.7 | 0.12 ± 0.01 | 32.0 ± 2.9 | -40.5 ± 1.6 | 7.2 ± 0.3 |
 |
P < 0.05
P < 0.001.
Figure 5. Effect of overexpression of α2–δ on T-type calcium currents in undifferentiated NG108-15 cells.
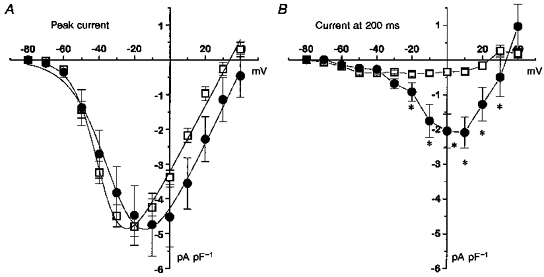
Cells were transfected with α2–δ or blank vector, and Ca2+ channel currents were recorded 48–72 h later. A, I-V relationships for peak current (means ±s.e.m., n as in Table 1) in α2–δ- (•) and blank- (□) transfected cells. The peak I-V relationships are fitted by a Boltzmann equation as in the legend to Table 1, where Gmax is 0.095 nS pF−1 for control and 0.11 nS pF−1 for α2–δ, Vrev is +33.9 mV for control and +43.0 mV for α2–δ, k is 7.2 mV for control and 10.9 mV for α2–δ, and V½ is −45.7 mV for control and −40.5 mV for α2–δ. B, I-V relationships for α2–δ- (•) and blank- (□) transfected cells for current at 200 ms. *P < 0.01 for current amplitude in α2–δ compared with blank-transfected cells.
Figure 6. Calcium currents in undifferentiated NG108-15 cells in the presence of overexpressed α2–δ, compared with normalized controls.
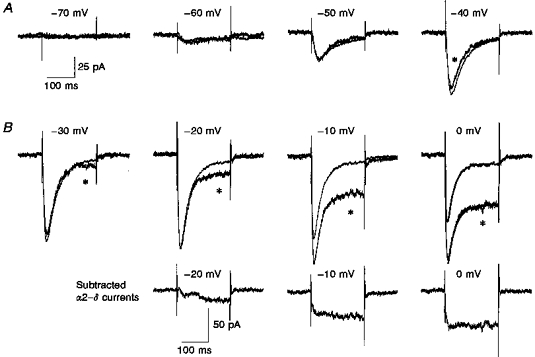
A, calcium channel currents between −70 and 0 mV were averaged for 9 cells (overexpressed α2–δ, traces marked with *) and 21 cells (control). The control values were then normalized to the peak amplitude at −20 mV to compare inactivation properties between the two conditions. The amplitude scale bar refers to the α2–δ traces. Examples of the fits to a single exponential of the current inactivation phase are shown for the 0 mV traces (continuous curves). The τinact was 26.8 and 30.5 ms for the currents in the control and α2–δ-overexpressing cells, respectively. B, the averaged currents in the presence of overexpressed α2–δ were subtracted from the control currents for −20, −10 and 0 mV to show the additional slowly activating current component appearing at large depolarizations.
Figure 7. The effect of overexpression of β2a, β1b and α2–δ on the time constant of inactivation of Ca2+ channel currents, and the proportion of steady state current in undifferentiated NG108-15 cells.
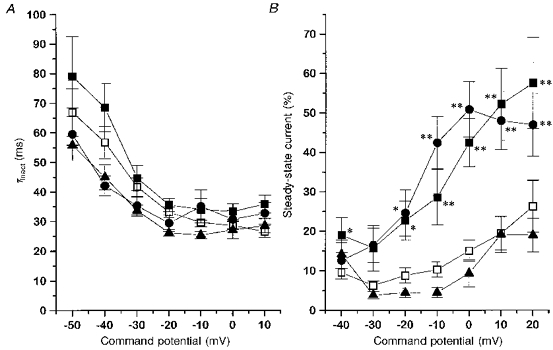
A, the time constant of inactivation (τinact) was determined for individual Ca2+ channel currents recorded from β2a- (▪), β1b- (▴), α2–δ- (•) and blank- (□) transfected cells, by fitting a single exponential curve to the decaying phase of the current. B, the percentage steady-state current was calculated from the exponential fits, and the same symbols are used as in A. *P < 0.05, **P < 0.01 compared with blank-transfected cells.
Effect of overexpression of calcium channel β subunits on the biophysical properties of the currents in undifferentiated NG108-15 cells
In order to determine whether overexpression of calcium channel β subunits had any effect on these currents, we first examined the effect of β2a, a subunit known to slow the entry into the inactivated state of expressed α1 subunits (Olcese et al. 1994; De Waard & Campbell, 1995). β2a did not affect the maximum amplitude of the peak current at −20 mV, but reduced the steepness of dependence of activation on voltage (Fig. 8A and Table 1). The most marked effect of β2a overexpression was the appearance of an additional component of current at depolarizations to −30 mV and above (Fig. 8B). Whereas from a comparison of the current profiles in the absence and presence of overexpressed β2a, there was little effect on the rapidly inactivating T-type component at low depolarizations (-60 to −40 mV, Fig. 9A), subtraction of the currents in control cells from those in β2a-overexpressing cells shows the appearance of the slowly activating sustained component present at larger depolarizations (Fig. 9B). The rate and voltage dependence of inactivation of the inactivating component of the current was not affected by β2a (Fig. 7A), but the proportion of the steady-state (non-inactivating) current, determined from a single exponential fit, was markedly increased at all potentials measured (Fig. 7B), for example from about 15 % to 42 % at 0 mV.
Figure 8. Effect of overexpression of β2a on T-type calcium currents in undifferentiated NG108-15 cells.
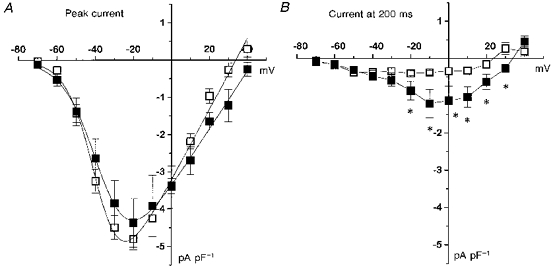
Cells were transfected with β2a or blank vector, and Ca2+ channel currents were recorded 48–72 h later. A, current-voltage (I-V) relationships for peak current (means ±s.e.m., n as in Table 1) in β2a- (▪) and blank- (□) transfected cells. The I-V relationships for the peak current are fitted by a Boltzmann equation, as in the legend to Table 1, where Gmax is 0.095 nS pF−1 for control and 0.078 nS pF−1 for β2a, Vrev is +33.9 mV for control and +43.7 mV for β2a, k is 7.2 mV for control and 8.9 mV for β2a, and V½ is −45.7 mV for control and −45.4 mV for β2a. B, I-V relationships for β2a- (▪) and blank- (□) transfected cells for current at 200 ms. *P < 0.05 for current amplitude in β2a- compared with blank-transfected cells.
Figure 9. Ca2+ channel currents in undifferentiated NG108-15 cells in the presence of overexpressed β2a, compared with normalized controls.
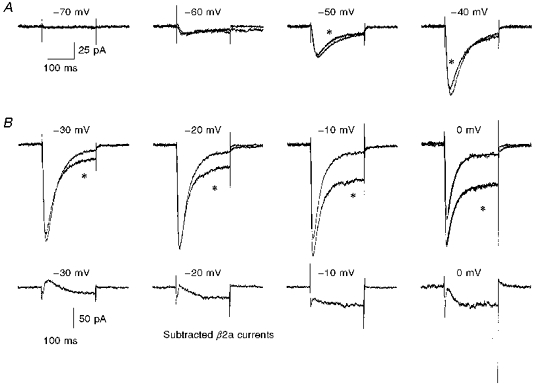
A, calcium channel currents between −70 and 0 mV were averaged for 11 cells (overexpressed β2a, traces marked with *) and 21 cells (control, blank transfected). The control values were then normalized to the peak amplitude at −20 mV to compare inactivation properties between the two conditions. The amplitude scale bar refers to the β2a traces. Examples of the fits to a single exponential of the current inactivation phase are shown for the 0 mV traces (continuous curves). The τinact was 26.8 and 29.3 ms for the currents in the control and β2a-overexpressing cells, respectively. B, the averaged currents in the presence of overexpressed β2a were subtracted from the control currents at −30, −20, −10 and 0 mV to show the additional slowly activating current component appearing at large depolarizations.
In contrast, overexpression of β1b had no effect on the peak amplitude or inactivation kinetics of the NG108-15 T-type currents (Figs 7 and 10A and B), and had no significant effect on the voltage dependence of current activation (Fig. 10 and Table 1).
Figure 10. Effect of overexpression of β1b on T-type calcium currents in undifferentiated NG108-15 cells.
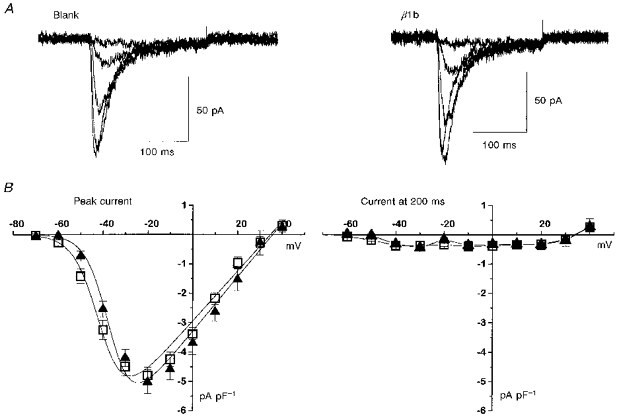
Cells were transfected with β1b or blank vector, and Ca2+ channel currents were recorded 48–72 h later. A, examples of current traces for blank- (left) and β1b- (right) transfected cells; 200 ms voltage steps were applied in 10 mV intervals to between −50 and −10 mV (blank-transfected cell) and −60 and −20 mV (β1b-transfected cell). B, current-voltage (I-V) relationships (means ±s.e.m., n as in Table 1) for β1b- (▴) and blank- (□) transfected cells for peak current (left) and current at 200 ms (right). The peak I-V relationships are fitted by a Boltzmann equation as in the legend to Table 1, where Gmax is 0.085 nS pF−1 for control and 0.09 nS pF−1 for β1b, Vrev is +34.7 mV for control and +35.7 mV for β1b, k is 5.7 mV for control and 5.2 mV for β1b, and V½ is −46.5 mV for control and −41.7 mV for β1b.
DISCUSSION
In this study we have examined the endogenous Ca2+ channel currents in undifferentiated NG108-15 cells, to assess whether auxiliary Ca2+ channel subunits are capable of functional interaction with LVA Ca2+ channels. It is well established that undifferentiated NG108-15 cells, like a number of other undifferentiated cell lines (Chen & Hess, 1990; Kobrinsky, Pearson & Dolphin, 1994), possess predominantly a low voltage activated, rapidly inactivating T-type Ca2+ channel current and possibly a small HVA component (Brown, Docherty & McFadzean, 1989; Chen & Hess, 1990; Randall & Tsien, 1997). We have confirmed by single channel analysis that these cells exhibit T-type single channels, but only very rarely show large conductance HVA channels when undifferentiated (Meir & Dolphin, 1998; and A. Meir, C. N. Wyatt and A. C. Dolphin, unpublished observations). A novel α1 subunit (α1G) has recently been cloned, with the properties of a rapidly inactivating T-type current (Perez-Reyes et al. 1998). However, the subunit composition of T-type channels has not yet been defined. In particular, it remains unclear whether they are composed of α1 subunits alone or α1 subunits associated with either an α2–δ or a β subunit. In the present study we have shown by RT-PCR, using primers that recognize both rat and mouse transcripts, that the mRNAs for all known HVA calcium channel subunits except α1D are present in these cells. The mRNA for α2–δ, together with all β subunit mRNAs are also present. Furthermore, immunocytochemical evidence indicates that all α1 subunits tested are present in these cells. It is unclear why α1D protein, but not mRNA is observed, but this may indicate the presence of a novel splice variant of α1D. A very low level of diffuse β subunit immunostaining was also observed, and a small amount of membrane-associated α2–δ. A similar diversity of calcium channel subunits has also been found in another undifferentiated neuroblastoma cell line (Lievano, Bolden & Horn, 1994).
The recently cloned α1G subunit has clearly been shown to express the properties of a rapidly inactivating T-type current (Perez-Reyes et al. 1998). Several studies have suggested that the α1E Ca2+ channel subunit also possesses some of the properties of LVA currents (Soong, Stea, Hodson, Dubel, Vincent & Snutch, 1993; Bourinet et al. 1996; Stephens et al. 1997), although this view is not universally held (Randall & Tsien, 1997). Using an α1E antisense approach, LVA currents have been attenuated in habenular and dorsal thalamic neurons (Brink, Guthrie, Nelson, Kovesdi & Snutch, 1997), and in atrial myocytes (Piedras-Renteria, Chen & Best, 1997), whereas, using antisense directed against the α1G subfamily, the T-type current in nodose ganglion neurons was abolished (Lambert, Maulet, Cribbs, Perez-Reyes & Feltz, 1998). It is therefore entirely possible that some of a heterogeneous population of LVA currents may arise from expression of other α1 subunits in addition to α1G (Perez-Reyes et al. 1998). It has previously been suggested that neuronal LVA calcium currents consist of a mixture of rapidly and more slowly inactivating currents (Chen & Hess, 1990). Of relevance to this, we have shown that α1B, α1C and α1E, expressed in COS-7 cells, can each give rise to a small (5–7 pS), as well as a larger conductance channel. The small channels have the biophysical properties of T-type channels, including lower voltage for activation than the large conductance channels (particularly for α1B and α1C), and rapid inactivation rates (Meir & Dolphin, 1998). However, it remains unclear whether native T-type currents can be influenced by interaction with auxiliary subunits. For example, Lambert et al. (1997) have used an antisense strategy to show that depletion of the cytoplasmic β subunits in cranial sensory neurons has no effect on the LVA currents present in these cells, whilst it significantly attenuates HVA current.
We have taken the approach of overexpressing auxiliary subunits in NG108-15 cells, since when undifferentiated, they exhibit predominantly T-type currents. Overexpression of the α2–δ subunit (which is present endogenously only at a low level in the membrane of undifferentiated cells) resulted in a significant depolarizing shift in the voltage dependence of activation of T-type currents, indicating an influence of this auxiliary subunit on T-type current activation over the whole voltage range. Similar effects have been shown previously for the interaction of α2–δ with HVA α1 subunits (De Waard & Campbell, 1995). Furthermore, α2–δ overexpression in NG108-15 cells also induced the appearance of a sustained component of current at depolarizations of −30 mV and above. β2a, which markedly attenuates inactivation of HVA α1 subunits (De Waard & Campbell, 1995), also induced a small sustained component of current at high depolarizations, whereas β1b had little effect on the properties of T-type current in these cells over the whole voltage range. It is striking that the effect of α2–δ, to induce the appearance of a large sustained high threshold component, as well as a reduction of the steepness of voltage dependence of activation of the current, is very similar to, although more marked than the effect of β2a.
There are several possible explanations for these findings. Firstly, the α2–δ and β2a accessory subunits may stabilize nascent HVA α1 subunits, whose transcripts exist in these cells, and allow their trafficking and appearance as functional HVA channels in the membrane, independently of the T-type channels. An argument against this hypothesis is that β1b had very little effect on the amplitude of the calcium currents, whereas we have shown it to be able to traffic α1 subunits to the membrane, in a similar manner to the other β subunits, and to have marked effects on the amplitude of α1E and α1A currents (Brice et al. 1997; Stephens et al. 1997). Furthermore, we have shown previously that α2–δ did not affect the trafficking of HVA α1 subunits (Brice et al. 1997; Stephens et al. 1997). However, in expression studies in Xenopus oocytes, which have an endogenous β subunit, α2–δ does increase membrane expression of α1 subunits (Shistik, Ivanina, Puri, Hosey & Dascal, 1995), possibly by synergizing with native β subunits (De Waard & Campbell, 1995). Therefore heterologous expression of α2–δ may interact with NG108-15 α1 subunits to have its effects on sustained current expression by acting in synergy with the low level of endogenous β subunits.
An alternative hypothesis is that T-type channels may be formed from LVA α1G subunits that are not associated with the α2–δ accessory subunit. Thus, on overexpression, when α2–δ is supplied in excess, an association may result with the T-type calcium channels. Regarding interaction with β subunits, the I-II loop of α1G does not contain a consensus β binding site, as defined in the HVA α1 subunits, but the lack of association has not yet been demonstrated directly. β1b produces fairly rapid inactivation of HVA α1 currents (Stephens et al. 1997), and therefore the finding that overexpressed β1b had no effect on T-type current inactivation cannot be used as a definitive argument concerning whether T-type channels consist of an α1 subunit not associated with a β subunit. Although α1E also shows several of the properties of T-type currents (Soong et al. 1993; Bourinet et al. 1996; Stephens et al. 1997), the inactivation kinetics of whole cell α1E current are slower than the inactivation time constant (τinact) of about 30 ms for the peak T-type current observed here. However, the τinact of α1E is slower with β1b but more rapid with α2–δ than in the absence of accessory subunits, (τinact of 164 and 59 ms, respectively, compared with 86 ms for α1E alone, at −10 mV) (Stephens et al. 1997). This would indicate that the T-type current in these cells is probably of the α1G subfamily, which shows very rapid inactivation (τinact about 10 ms at −20 mV, Perez-Reyes et al. 1998), or a combination of α1G with α1E.
The effect of β2a in the present experiments, to induce the appearance of a sustained calcium current component at high depolarizations, could be explained either by its association with a lone T-channel α1 subunit, by displacement from this α1 of a β subunit whose effect on inactivation kinetics was more marked, or by association with an HVA α1 subunit that is already in the plasma membrane, but shows little functional activity in the absence of β2a. It is of interest that β2a has been shown to have a second interaction site on the C-terminal tail of HVA α1 subunits (Walker, Bichet, Campbell & De Waard, 1998), and is also palmitoylated (Chien, Carr, Shirokov, Rios & Hosey, 1996), whereas β1b only interacts with the I-II loop (Walker et al. 1998). It is unclear whether this second interaction site on the C-terminal tail exists for the α1G subfamily. We show here from immunocytochemical evidence that several HVA α1 subunits are clearly present in the plasma membrane of undifferentiated NG108-15 cells, even in the absence of overexpressed accessory subunits. The finding that Bay K 8644 markedly increased the small sustained HVA current in these cells further suggests that functional L-type α1 subunits are present in the membrane, but have a very low open probability in the absence of the calcium channel agonist.
In conclusion, the results of this study suggest that the channels underlying T-type currents in NG108-15 cells may interact with α2–δ, which affects the voltage dependence of activation of the T-type currents. Both α2–δ and β2a induced the appearance of a sustained current component at high thresholds, which may be a separate effect from the modulation of the T-type current. These findings also suggest that the channels underlying the LVA current do not normally associate with β subunits.
Acknowledgments
This work was supported by The Wellcome Trust and MRC. The authors would like to thank the following for kind gifts of cDNA: T. Snutch (Vancouver, Canada), β1b; E. Perez-Reyes (Loyola, USA), β2a; H. Chin (NIH, USA), α2–δ; and T. Hughes (New Haven, CT, USA), Mut3-GFP. We thank S. Volsen of Eli Lilly Research (UK) for the kind gift of polyclonal α1E antibody. We also thank the MRC Laboratory for Molecular and Cellular Biology, UCL (UK) for the use of the confocal microscope. This work benefited from the use of the Seqnet facility (Daresbury, UK). We also thank Dr M. Usowicz, Bristol University (UK) who participated in the initial studies on RT-PCR in NG108-15 cells. We acknowledge the technical assistance of I. Tedder, A. Odunlami and M. Li.
References
- Berrow NS, Campbell V, Fitzgerald EG, Brickley K, Dolphin AC. Antisense depletion of β-subunits modulates the biophysical and pharmacological properties of neuronal calcium channels. The Journal of Physiology. 1995;482:481–491. doi: 10.1113/jphysiol.1995.sp020534. [DOI] [PMC free article] [PubMed] [Google Scholar]
- Bossu J-L, Feltz A. Patch-clamp study of the tetrodotoxin-resistant sodium current in group C sensory neurones. Neuroscience Letters. 1984;51:241–246. doi: 10.1016/0304-3940(84)90558-5. [DOI] [PubMed] [Google Scholar]
- Bourinet E, Zamponi GW, Stea A, Soong TW, Lewis BA, Jones LP, Yue DT, Snutch TP. The α1E calcium channel exhibits permeation properties similar to low-voltage-activated calcium channels. Journal of Neuroscience. 1996;16:4983–4993. doi: 10.1523/JNEUROSCI.16-16-04983.1996. [DOI] [PMC free article] [PubMed] [Google Scholar]
- Brice NL, Berrow NS, Campbell V, Page KM, Brickley K, Tedder I, Dolphin AC. Importance of the different β subunits in the membrane expression of the α1A and α2 calcium channel subunits: studies using a depolarisation-sensitive α1A antibody. European Journal of Neuroscience. 1997;9:749–759. doi: 10.1111/j.1460-9568.1997.tb01423.x. [DOI] [PubMed] [Google Scholar]
- Brickley K, Campbell V, Berrow N, Leach R, Norman RI, Wray D, Dolphin AC, Baldwin S. Use of site-directed antibodies to probe the topography of the α2 subunit of voltage-gated Ca2+ channels. FEBS Letters. 1995;364:129–133. doi: 10.1016/0014-5793(95)00371-f. [DOI] [PubMed] [Google Scholar]
- Brink D, Guthrie H, Nelson D, Kovesdi I, Snutch TP. Analysis of T type currents in CNS neurons using an adenovirus based antisense strategy. Society for Neuroscience Abstracts. 1997;23:784.11. [Google Scholar]
- Brown DA, Docherty RJ, McFadzean I. Calcium channels in vertebrate neurons: experiments on a neuroblastoma hybrid model. Annals of the New York Academy of Sciences. 1989;560:358–372. doi: 10.1111/j.1749-6632.1989.tb24115.x. [DOI] [PubMed] [Google Scholar]
- Carbone E, Lux HD. A low voltage-activated fully inactivating Ca channel in vertebrate sensory neurones. Nature. 1984;310:501–502. doi: 10.1038/310501a0. [DOI] [PubMed] [Google Scholar]
- Chen C, Hess P. Mechanism of gating of T-type calcium channels. Journal of General Physiology. 1990;96:603–630. doi: 10.1085/jgp.96.3.603. [DOI] [PMC free article] [PubMed] [Google Scholar]
- Chien AJ, Carr KM, Shirokov RE, Rios E, Hosey MM. Identification of palmitoylation sites within the L type calcium channel β2a subunit, and effects on channel function. Journal of Biological Chemistry. 1996;271:26465–26469. doi: 10.1074/jbc.271.43.26465. [DOI] [PubMed] [Google Scholar]
- Chien AJ, Zhao XL, Shirokov RE, Puri TS, Chang CF, Sun D, Rios E, Hosey MM. Roles of a membrane-localized β subunit in the formation and targeting of functional L-type Ca2+ channels. Journal of Biological Chemistry. 1995;270:30036–30044. doi: 10.1074/jbc.270.50.30036. 10.1074/jbc.270.50.30036. [DOI] [PubMed] [Google Scholar]
- Day NC, McCormack AL, Ince PG, Shaw PJ, Craig PJ, Smith W, Beattie RE, Ellis SB, Harpold MM, Lodge D, Volsen SG. Distribution of voltage-dependent calcium channel (VDCC) beta subunits in the human hippocampus. Neuropathology and Applied Neurobiology. 1996;22:458. [Google Scholar]
- De Waard M, Campbell KP. Subunit regulation of the neuronal α1A Ca2+ channel expressed in Xenopus oocytes. The Journal of Physiology. 1995;485:619–634. doi: 10.1113/jphysiol.1995.sp020757. [DOI] [PMC free article] [PubMed] [Google Scholar]
- Dolphin AC. The G. L. Brown Prize Lecture. Voltage-dependent calcium channels and their modulation by neurotransmitters and G proteins. Experimental Physiology. 1995;80:1–36. doi: 10.1113/expphysiol.1995.sp003825. [DOI] [PubMed] [Google Scholar]
- Fedulova SA, Kostyuk PG, Veselovsky NS. Two types of calcium channels in the somatic membrane of new-born rat dorsal root ganglion neurones. The Journal of Physiology. 1985;359:431–446. doi: 10.1113/jphysiol.1985.sp015594. [DOI] [PMC free article] [PubMed] [Google Scholar]
- Gurnett CA, De Waard M, Campbell KP. Dual function of the voltage-dependent Ca2+ channel α2δ subunit in current stimulation and subunit interaction. Neuron. 1996;16:431–440. doi: 10.1016/s0896-6273(00)80061-6. 10.1016/S0896-6273(00)80061-6. [DOI] [PubMed] [Google Scholar]
- Hamill OP, Marty A, Neher E, Sakmann B, Sigworth FJ. Improved patch-clamp techniques for high resolution current recording from cells and cell-free membrane patches. Pflügers Archiv. 1981;391:85–100. doi: 10.1007/BF00656997. [DOI] [PubMed] [Google Scholar]
- Ikeda SR, Schofield GG. Tetrodotoxin-resistant sodium current of rat nodose neurones: monovalent cation selectivity and divalent cation block. The Journal of Physiology. 1987;389:255–270. doi: 10.1113/jphysiol.1987.sp016656. [DOI] [PMC free article] [PubMed] [Google Scholar]
- Kobrinsky EM, Pearson HA, Dolphin AC. Low- and high-voltage-activated calcium channel currents and their modulation in the dorsal root ganglion cell line ND7–23. Neuroscience. 1994;58:539–552. doi: 10.1016/0306-4522(94)90079-5. [DOI] [PubMed] [Google Scholar]
- Lacerda AE, Perez-Reyes E, Wei X, Castellano A, Brown AM. T-type and N-type calcium channels of Xenopus oocytes: Evidence for specific interactions with β subunits. Biophysical Journal. 1994;66:1833–1843. doi: 10.1016/S0006-3495(94)80977-4. [DOI] [PMC free article] [PubMed] [Google Scholar]
- Lambert RC, Maulet Y, Cribbs LL, Perez-Reyes E, Feltz A. Identifying low voltage-activated Ca2+ channels in primary sensory neurons: an antisense strategy. Biophysical Journal. 1998;74:A100. doi: 10.1523/JNEUROSCI.18-21-08605.1998. [DOI] [PMC free article] [PubMed] [Google Scholar]
- Lambert RC, Maulet Y, Mouton J, Beattie R, Volsen S, De Waard M, Feltz A. T-type Ca2+ current properties are not modified by Ca2+ channel β subunit depletion in nodosus ganglion neurons. Journal of Neuroscience. 1997;17:6621–6628. doi: 10.1523/JNEUROSCI.17-17-06621.1997. [DOI] [PMC free article] [PubMed] [Google Scholar]
- Lievano A, Bolden A, Horn R. Ca channels in excitable cells: divergent genotypic and phenotypic expression of α1 subunits. American Journal of Physiology. 1994;267:C411–424. doi: 10.1152/ajpcell.1994.267.2.C411. [DOI] [PubMed] [Google Scholar]
- Meir A, Dolphin AC. Known calcium channel α1 subunits can form low threshold, small conductance channels, with similarities to native T type channels. Neuron. 1998;20:341–351. doi: 10.1016/s0896-6273(00)80461-4. [DOI] [PubMed] [Google Scholar]
- Neely A, Wei X, Olcese R, Birnbaumer L, Stefani E. Potentiation by the β subunit of the ratio of the ionic current to the charge movement in the cardiac calcium channel. Science. 1993;262:575–578. doi: 10.1126/science.8211185. [DOI] [PubMed] [Google Scholar]
- Olcese R, Qin N, Schneider T, Neely A, Wei X, Stefani E, Birnbaumer L. The amino terminus of a calcium channel β subunit sets rates of channel inactivation independently of the subunit's effect on activation. Neuron. 1994;13:1433–1438. doi: 10.1016/0896-6273(94)90428-6. [DOI] [PubMed] [Google Scholar]
- Perez-Reyes E, Cribbs LL, Daud A, Lacerda AE, Barclay J, Williamson MP, Fox M, Rees M, Lee J. Molecular characterisation of a neuronal low-voltage-activated T type calcium channel. Nature. 1998;391:896–900. doi: 10.1038/36110. [DOI] [PubMed] [Google Scholar]
- Perez-Reyes E, Schneider T. Calcium channels: structure, function, and classification. Drug Development Research. 1994;33:295–318. [Google Scholar]
- Piedras-Renteria ES, Chen C, Best PM. Antisense oligonucleootides against rat brain α1E DNA and its atrial homologue decrease T-type calcium current in atrial myocytes. Proceedings of the National Academy of Sciences of the USA. 1997;94:14936–14941. doi: 10.1073/pnas.94.26.14936. [DOI] [PMC free article] [PubMed] [Google Scholar]
- Randall AD, Tsien RW. Contrasting biophysical and pharmacological properties of T-type and R-type calcium channels. Neuropharmacology. 1997;36:879–893. doi: 10.1016/s0028-3908(97)00086-5. [DOI] [PubMed] [Google Scholar]
- Shistik E, Ivanina T, Puri T, Hosey M, Dascal N. Ca2+ current enhancement by α2/δ and β subunits in Xenopus oocytes: contribution of changes in channel gating and α1 protein level. The Journal of Physiology. 1995;489:55–62. doi: 10.1113/jphysiol.1995.sp021029. [DOI] [PMC free article] [PubMed] [Google Scholar]
- Soong TW, Stea A, Hodson CD, Dubel SJ, Vincent SR, Snutch TP. Structure and functional expression of a member of the low voltage-activated calcium channel family. Science. 1993;260:1133–1136. doi: 10.1126/science.8388125. [DOI] [PubMed] [Google Scholar]
- Stephens GJ, Brice NL, Berrow NS, Dolphin AC. Facilitation of rabbit α1B calcium channels: involvement of endogenous Gβγ subunits. The Journal of Physiology. 1998;509:15–27. doi: 10.1111/j.1469-7793.1998.015bo.x. [DOI] [PMC free article] [PubMed] [Google Scholar]
- Stephens GJ, Page KM, Burley JR, Berrow NS, Dolphin AC. Functional expression of rat brain cloned α1E calcium channels in COS-7 cells. Pflügers Archiv. 1997;433:523–532. doi: 10.1007/s004240050308. [DOI] [PubMed] [Google Scholar]
- Volsen SG, Day NC, McCormack AL, Smith W, Craig PJ, Beattie R, Ince PG, Shaw PJ, Ellis SB, Gillespie A, Harpold MM, Lodge D. The expression of neuronal voltage-dependent calcium channels in human cerebellum. Molecular Brain Research. 1995;34:271–282. doi: 10.1016/0169-328x(95)00234-j. [DOI] [PubMed] [Google Scholar]
- Walker D, Bichet D, Campbell KP, De Waard M. A β4 isoform-specific interaction site in the carboxyl-terminal region of the voltage-dependent Ca2+ channel α1A subunit. Journal of Biological Chemistry. 1998;273:2361–2367. doi: 10.1074/jbc.273.4.2361. [DOI] [PubMed] [Google Scholar]
- Williams ME, Feldman DH, McCue AF, Brenner R, Velicelebi G, Ellis SB, Harpold MM. Structure and functional expression of α1, α2, and β subunits of a novel human neuronal calcium channel subtype. Neuron. 1992;8:71–84. doi: 10.1016/0896-6273(92)90109-q. [DOI] [PubMed] [Google Scholar]
- Wyatt CN, Campbell V, Brodbeck P, Brice NL, Page KM, Berrow NS, Brickley K, Terracciano R, Naqvi RV, Macleod KT, Dolphin AC. Voltage-dependent binding and calcium current inhibition by an anti-α1D subunit antibody in rat dorsal root ganglion neurones and guinea-pig myocytes. The Journal of Physiology. 1997;502:307–319. doi: 10.1111/j.1469-7793.1997.307bk.x. [DOI] [PMC free article] [PubMed] [Google Scholar]