

Abstract
The mechanisms governing the return of intracellular calcium to baseline levels following depolarization-evoked [Ca2+]i rises were investigated in Purkinje cell somata using tight-seal whole-cell recordings and fura-2 microfluorometry, for peak [Ca2+]i ranging from 50 nM to 2 μM.
decay was well fitted by a double exponential with time constants of 0.6 and 3 s. Both time constants were independent of peak [Ca2+]i but the contribution of the faster component increased with [Ca2+]i.
Thapsigargin (10 μM) and cyclopiazonic acid (50 μM) prolonged decay indicating that sarco-endoplasmic reticulum Ca2+ (SERCA) pumps contribute to Purkinje cell clearance.
A modest participation in clearance was found for the plasma membrane Ca2+ (PMCA) pumps using 5,6-succinimidyl carboxyeosin (40 μM).
The Na+–Ca2+ exchanger also contributed to the clearance process, since replacement of extracellular Na+ by Li+ slowed decay.
Carbonyl cyanide m-chlorophenylhydrazone (CCCP, 2 μM) and rotenone (10 μM) increased [Ca2+]i and elicited large inward currents at −60 mV. Both effects were also obtained with CCCP in the absence of external Ca2+, suggesting that mitochondrial Ca2+ uptake uncouplers release Ca2+ from intracellular stores and may alter the membrane permeability to Ca2+. These effects were irreversible and impeded tests on the role of mitochondria in clearance.
The relative contribution of the clearance systems characterized in this study varied as a function of [Ca2+]i. At 0.5 μM , SERCA pumps, PMCA pumps and the Na+–Ca2+ exchanger contribute equally to removal and account for 78% of the process. Only 45% of the removal at 2 μM can be explained by these systems. In this high [Ca2+]i range the major contribution is that of SERCA pumps (21%) and of the Na+–Ca2+ exchanger (18%), whereas the contribution of PMCA pumps is only 6%.
Variations in intracellular calcium levels play crucial roles in information processing in cerebellar Purkinje cells, since several forms of synaptic plasticity at their excitatory (Sakurai, 1990) and inhibitory inputs (reviewed by Marty & Llano, 1995) are triggered by [Ca2+]i rises. Transient changes in dendritic [Ca2+]i can be elicited by stimulation of the two excitatory synaptic inputs converging on Purkinje cells: climbing and parallel fibres (Miyakawa, Lev-Ram, Lasser-Ross & Ross, 1992; Denk, Sugimori & Llinás, 1995). Activation of voltage-gated Ca2+ channels leads to large increases in dendritic (Tank, Sugimori, Connor & Llinás, 1988; Lev-Ram, Miyakawa, Lasser-Ross & Ross, 1992) as well as in somatic [Ca2+]i (Kano, Schneggenburger, Verkhratsky & Konnerth, 1995), and these signals can be amplified by calcium-induced calcium release (CICR; Llano, DiPolo & Marty, 1994). Confocal imaging has shown that climbing fibre activation produces substantial increases in [Ca2+]i, not only in Purkinje cell dendrites, but also in the cell somata (Eilers, Callewaert, Armstrong & Konnerth, 1995).
Cerebellar Purkinje cells have powerful systems to control [Ca2+]i. Immunocytochemical studies demonstrate considerable amounts of Ca2+-binding proteins, particularly calbindin D28k and parvalbumin (Tolosa de Talamoni, Smith, Wasserman, Beltramino, Fullmer & Penniston, 1993). Calsequestrin, a well-known constituent of skeletal muscle sarcoplasmic reticulum which is not found in other neurones, has also been reported (Takei et al. 1992, and references therein). Concerning potential sources of Ca2+ release from intracellular stores (reviewed by Ogden, 1996), Purkinje cells express different forms of inositol trisphosphate receptors (InsP3Rs), as well as of ryanodine receptors (RyRs); they are unique among CNS neurones in expressing the skeletal type of RyRs. Rises in [Ca2+]i mediated by activation of InsP3Rs (Khodakhah & Ogden, 1995, and references therein) and RyRs (Llano et al. 1994) have been demonstrated in Purkinje cells.
In addition to these unusual characteristics, other ubiquitous systems involved in homeostasis have been described in Purkinje cells. By immunocytochemical techniques the presence of sarco-endoplasmic reticulum Ca2+ (SERCA) pumps has been recognized (Plessers, Eggermont, Wuytack & Casteels, 1991). SERCA pumps are particularly abundant at the level of the endoplasmic reticulum cisterns (Takei et al. 1992, and references therein). The plasma membrane Ca2+ (PMCA) pumps are ubiquitous in the plasma membrane of Purkinje cells (Tolosa de Talamoni et al. 1993).
Although several studies on dendritic dynamics in Purkinje cells have been performed (reviewed in Regehr & Tank, 1994), little is known of the kinetics of removal at the somata and dendrites of these neurones. In a previous paper we showed that Purkinje cells have a very high Ca2+-binding ratio which endows them with the ability to efficiently handle large loads (Fierro & Llano, 1996). Because buffers confiscate Ca2+, they decrease the effective extrusion rates of clearance mechanisms which are only effective on freely diffusing Ca2+ ions. Therefore, the presence of very strong buffers suggests that Purkinje cells extrude Ca2+ at slow rates, or else, that they should have particularly efficient clearance systems. In the present work, we study the mechanisms responsible for clearance at Purkinje cell somata and describe their respective contributions to the removal process in the range of [Ca2+]i increments pertaining to physiological activity.
METHODS
The procedures for preparation of cerebellar slices and subsequent tight-seal whole-cell recordings (WCR) combined with fluorometric fura-2 measurements have been described in detail in a recent publication (Fierro & Llano, 1996). In the present study, cerebellar slices were obtained from 12- to 17-day-old rats, decapitated following cervical dislocation. The external saline had a composition of (mM): 125 NaCl, 2.5 KCl, 2 CaCl2, 1 MgCl2, 1.25 NaH2PO4, 26 NaHCO3 and 10 glucose (pH of 7.4 when equilibrated with a mixture of 95% O2 and 5% CO2; 295–300 mosmol l−1). The experimental chamber was perfused at a rate of 0.8–1 ml min−1 with this saline, complemented with tetrodotoxin (200 nM) and the GABAA receptor antagonist bicuculline methochloride (10 μM). WCR was performed with pipettes filled with a solution containing (mM): 150 CsCl, 4.6 MgCl2, 10 Hepes acid, 0.4 Na-GTP and 4 Na2-ATP (pH adjusted to 7.34 with N-methyl-D-glucamine; 295–300 mosmol l−1). Unless otherwise noted, 250 μM fura-2 was included in the pipette solution. Experiments were done at room temperature (20-24°C).
All reagents were purchased from Sigma, except bicuculline methochloride (Tocris Neuramin), thapsigargin (Calbiochem), 5,6-succinimidyl carboxyeosin (Molecular Probes) and fura-2 (Molecular Probes). Thapsigargin, carbonyl cyanide p-trifluoromethoxyphenylhydrazone (FCCP), carbonyl cyanide m-chlorophenylhydrazone (CCCP), oligomycin, rotenone, 5,6-succinimidyl carboxyeosin and cyclopiazonic acid were dissolved in DMSO and stored at −20°C. Final concentrations of DMSO never exceeded 0.01%, a concentration which does not affect levels.
Experimental protocols and analysis routines
Most of the experiments in this work involve comparisons of the rate of decay of pulse-evoked [Ca2+]i rises in control external saline and after the application of an inhibitor of a putative clearance system. Cells were held at −60 mV and transients were elicited by depolarizing pulses of 20–300 ms duration to 0 mV. The membrane current and the fluorescence signal resulting from 390 nm excitation were acquired at a sampling rate of 1 ms point−1 during the 10 s following the voltage step. Average values of the fluorescence at the isosbestic point (F360) were obtained from 100 ms exposures to 360 nm light immediately before and after the 390 nm excitation. These values were interpolated to generate a data set of F360versus time, containing the same number of points as the 390 nm data. The two data sets were then divided point by point, and from the resulting ratio values (F360/F390) [Ca2+]i was calculated as explained in Fierro & Llano (1996). To examine the contribution of the different mechanisms to the decay of transients, a series of pulses of different duration was applied at 90 s intervals in control saline. Four to five minutes after adding the inhibitor the series of pulses was repeated. This protocol was used in all the experiments, unless otherwise stated in the figure legends.
To estimate the contribution of each system to the return of [Ca2+]i to baseline levels, transients which reached similar peak values in control and test conditions were chosen and the clearance rate was calculated as follows. (i) The decay phase of each transient was fitted by a single or a double exponential function and the derivative function (d[Ca2+]i/dt) was calculated from the fit. (ii) -d[Ca2+]i/dt was then plotted as a function of the [Ca2+]i values obtained from the exponential fit. (iii) The plots from transients with equal peak [Ca2+]i in each condition (control versus inhibitor) were pooled and fitted with a polynomial function of fifth to seventh order. (iv) The polynomial fit calculated for the inhibitor condition was subtracted from the polynomial fit calculated from the control data, to yield the mean contribution to clearance of the system studied as a function of [Ca2+]i.
To explore the effects of experimental manipulations on the resting calcium concentration, [Ca2+]R, the fluorescence resulting from 200 ms paired exposures to 360 and 390 nm light was acquired and used to calculate [Ca2+]R. When the external solution was replaced by a Ca2+-free saline (no added Ca2+ plus 200 μM EGTA; e.g. Fig. 6C), depolarizing pulses from −60 to 0 mV were applied before and after Ca2+ removal to assess the effectiveness of the solution exchange. In general, 8 min after the slice was perfused with Ca2+-free saline, complete Ca2+ removal from the extracellular media was reached as evidenced by the lack of [Ca2+]i rises upon depolarization.
Figure 6. Effects of mitochondrial Ca2+ uptake uncouplers on Purkinje cells.
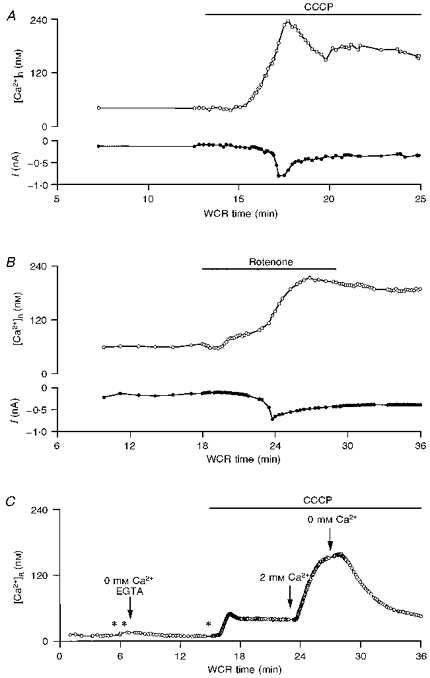
A, plot of the resting calcium concentration, [Ca2+]R, (upper panel) and of the holding current at a potential of −60 mV (lower panel) as a function of WCR time. CCCP (2 μM), added to the bath solution during the time indicated by the bar, provoked an increase in [Ca2+]R and the development of an inward current. B, similar experiment, from a different cell, exposed to 10 μM rotenone and 4 μg ml−1 oligomycin, which also led to an increase in [Ca2+]R and the activation of an inward current. C, CCCP (2 μM) induced an increase in [Ca2+]R when the slice was bathed in a Ca2+-free solution, suggesting the presence of a CCCP-sensitive intracellular Ca2+ store in Purkinje cell somata. When extracellular Ca2+ was reintroduced to the bath solution while CCCP was present, there was an additional increase in [Ca2+]R. Points in time when depolarizations were applied are indicated by *; the last depolarization did not elicit any transient, confirming that external Ca2+ was effectively removed (see Methods). The transients elicited by depolarizing pulses are not included in the graph, which plots only the values of [Ca2+]R, as in A and B.
RESULTS
Decay of transients in Purkinje cell somata
In this section, we describe the general properties of the return of [Ca2+]i to baseline levels following depolarization-induced [Ca2+]i rises in Purkinje cell somata. In these experiments, resting [Ca2+]i was 25 ± 10 nM (n = 20; mean ±s.d.) and depolarizing pulses of increasing duration (50–300 ms) induced transient rises in [Ca2+]i to peak levels ranging from 50 nM to 2 μM. The rising phase of the pulse-evoked transients showed a biphasic behaviour in the high [Ca2+]i range, indicative of CICR (Llano et al. 1994). As shown in Fig. 1A, throughout most of the [Ca2+]i range explored, the return of [Ca2+]i to baseline levels was well described by a double exponential function with a fast time constant (τ1) of the order of 700 ms and a slow time constant (τ2) of the order of 4 s (fits are superimposed on the traces). Biexponential decays were observed in all cells analysed (n = 110) for peak levels over 300 nM. At lower peak levels, 50% of the cells had transients which were well approximated by a single exponential function. In these cases, the apparent threshold between a monophasic and a biphasic decay ranged from 100 to 280 nM. Figures 1B and C present the pooled data from ten of the cells exhibiting biexponential decay throughout the [Ca2+]i range studied. The plots of τ1 and τ2 as a function of the peak value of [Ca2+]i (Fig. 1B) indicate little dependence of both time constants on peak [Ca2+]i. However, the contribution of each component to the biphasic decay varies as function of peak [Ca2+]i: the fast component dominates above 0.5 μM whereas the slow component dominates at lower peak [Ca2+]i (Fig. 1C). This behaviour translates to a decrease in the time required for [Ca2+]i to decay to 50% of its peak value as the peak [Ca2+]i increases (see Fig. 2B).
Figure 1. Decay of transients in cerebellar Purkinje cell somata.
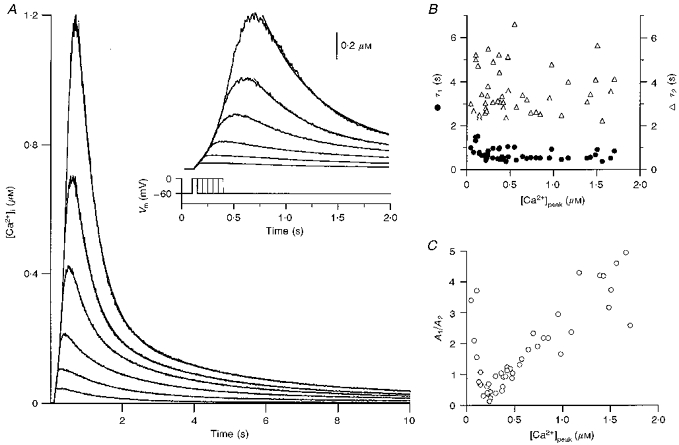
A, representative transients elicited by depolarizations of durations ranging from 50 to 300 ms (steps of 50 ms, as shown in lower part of inset). Double exponential fits of the decay phase are superimposed on each trace. An expanded view of the same data is displayed in the inset. In this and subsequent figures, the holding potential was set to −60 mV and the pulse brought the membrane potential to 0 mV. B, pooled data (10 cells) for the value of the time constants of the decay of transients (τ1 and τ2) as a function of peak [Ca2+]i ([Ca2+]peak). C, plot of the ratio of the corresponding amplitude coefficients (A1/A2) as a function of peak [Ca2+]i for the same cells as in B.
Figure 2. Stability of transients in WCR.
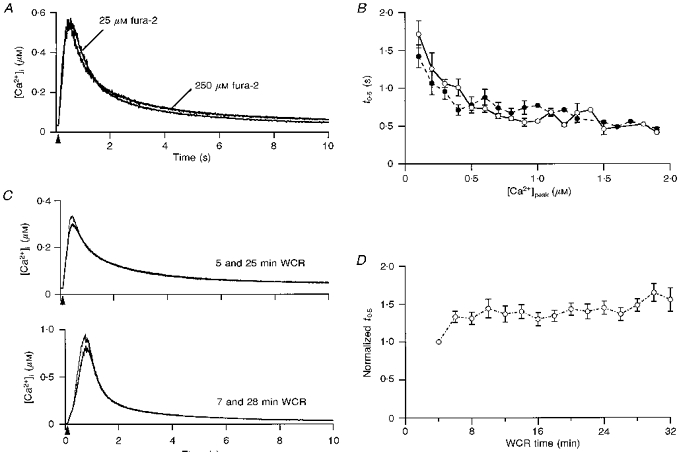
A, transients elicited in 2 Purkinje cells by 100 ms depolarizations. The cells were dialysed with 25 and 250 μM fura-2, as indicated on the graph. B, pooled data for the mean t0.5 for transients, elicited by depolarizations ranging in duration from 20 to 300 ms, in cells dialysed with 25 μM fura-2 (•; 11 cells) or 250 μM fura-2 (^; 14 cells). t0.5 values in each cell were binned at increments of 100 nM peak [Ca2+]i. C, upper panel, 2 transients with peak levels in the 300 nM range were elicited by 175 ms depolarizations at the indicated WCR times. Lower panel, similar experiment with a different cell using 250 ms depolarizations, which elicit transients with peak values close to 1 μM. D, pooled data for the mean t0.5 as a function of time in WCR (10 cells). For each cell, the t0.5 values at different WCR times were normalized to the t0.5 at 4 min in WCR. Normalized data were binned in 2 min increments. In B and D, symbols display the mean and error bars the s.d.
Two sets of experiments were carried out to ascertain that the time course of the decay of transients was not affected by the experimental procedures used in the present work. Firstly, we verified that the use of fura-2 at 250 μM did not slow-down transients. The addition of a high-affinity Ca2+ buffer, such as fura-2, can alter the kinetics of signals (Sala & Hernández-Cruz, 1990) to an extent set by the properties of the endogenous buffers (reviewed by Neher, 1995). Purkinje cells have an unusually high Ca2+-binding ratio (Fierro & Llano, 1996) and thus addition of 250 μM fura-2 should not interfere with the endogenous systems. To verify this point, the time course of the decay of pulse-evoked transients was compared in cells dialysed with 25 (n = 11) and 250 μM fura-2 (n = 14), as shown in Fig. 2A. To quantify these experiments, each transient was analysed in terms of t0.5 (the time at which [Ca2+]i decayed to 50% of its peak), and the data, binned at 100 nM increments in peak [Ca2+]i, were plotted as a function of peak [Ca2+]i. The results, displayed in Fig. 2B, confirm that decay is not affected by fura-2 concentration in the 25–250 μM range.
We next determined the behaviour of decay as a function of WCR time, to rule out possible effects of wash-out of cytoplasmic components on homeostasis. transients were elicited by depolarizing steps repeated at 2 min intervals, starting 4 min after breaking into the cell and followed for the ensuing 32–34 min. Figure 2C presents superimposed transients obtained from two different cells at the indicated times in WCR, for stimuli raising [Ca2+]i to ∼300 nM (upper panel) and ∼1 μM (lower panel). The time course of decay of the signals is quite similar, irrespective of the time in WCR. The pooled data (n = 10) for t0.5 as a function of WCR time displayed in Fig. 2D demonstrate that the decay phase of transients is stable within a time window ranging from 6 to 30 min after establishment of the WCR configuration. Therefore, the experiments described in the remaining sections were collected from 8 to 28 min after breaking into the cell.
Mechanisms contributing to clearance in Purkinje cell somata
In most cell types studied, two main types of mechanism regulate the time course of decay of transients: those which sequester Ca2+ ions into intracellular stores and those which transport the ions towards the extracellular space. In the following, we describe pharmacological and ion-substitution experiments designed to determine the relative contribution of several putative clearance systems to the removal of from Purkinje cell somata following depolarization-evoked [Ca2+]i rises.
SERCA pumps
SERCA pumps are one of the well-studied ATP-dependent Ca2+ mechanisms in several cells and their presence in cerebellar Purkinje cells has been ascertained by immunocytochemistry (Takei et al. 1992, and references therein). To study their contribution to the decay phase of transients, we used cyclopiazonic acid (CPA) and thapsigargin, specific inhibitors of this ATPase (Inesi & Sagara, 1994). Figure 3 illustrates characteristic examples of the results obtained with 50 μM CPA for transients peaking in the 100 nM range (Fig. 3A) and in the 1–2 μM range (Fig. 3B). In both cases, CPA slows significantly the return of [Ca2+]i to resting levels. Similar results were obtained in seven out of eight cells tested. The effect of CPA was dose dependent, 4 μM (n = 5; data not shown) exerting a smaller effect than 50 μM. Thapsigargin had similar actions to CPA when used at 10 μM (4 out of 5 cells; example in Fig. 3C). Neither inhibitor affected the resting value of [Ca2+]i.
Figure 3. Contribution of SERCA pumps to clearance.
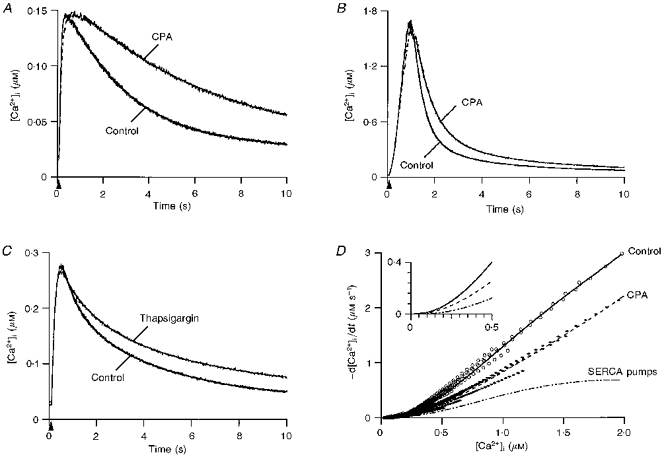
A, effect of cyclopiazonic acid (CPA) on small transients: superimposed transients recorded in control external saline and in the presence of 50 μM CPA. The control trace was elicited by a 60 ms depolarization at 9 min in WCR and the CPA trace by a 50 ms depolarization at 21 min WCR. The corresponding t0.5 values were 2.2 and 5.2 s, respectively. Superimposed on both traces are the fits of the decay phase by a single exponential, with t = 2.88 s in control and 6.63 s in CPA. B, effect of 50 μM CPA on large transients: the control trace corresponds to a 220 ms depolarization at 13 min in WCR while the CPA trace was elicited by a 200 ms depolarization at 28 min in WCR. The t0.5 values were 0.5 and 0.8 s, respectively. The fit of the decay by a double exponential is superimposed on each trace; τ1 and τ2 were 0.52 and 3.56 s in control, and 0.76 and 4.34 s in CPA. C, effect of 10 μM thapsigargin on transients. The control trace was elicited by a 100 ms depolarization at 10.5 min in WCR while the thapsigargin trace results from a 80 ms depolarization at 28 min in WCR. The corresponding t0.5 values were 1.6 and 3.6 s, respectively. Fits by a double exponential (superimposed on each trace) yield τ1 and τ2 values of 0.69 and 4.07 s in control, and 1.04 and 5.29 s in thapsigargin. D, data from 36 transients (18 in control saline and 18 in CPA) were pooled from 7 cells and analysed in terms of -d[Ca2+]i/dt as a function of [Ca2+]i. The symbols correspond to the data points and the lines to the fit of the pooled data. The inset illustrates polynomial fits and the resulting subtraction for the low [Ca2+]i range.
To quantify the contribution of SERCA pumps to clearance, transients with similar peak [Ca2+]i were analysed as detailed in Methods to determine the rate of clearance (-d[Ca2+]i/dt) as a function of [Ca2+]i. Figure 3D shows the resulting plots for both conditions (control and CPA; 7 cells). Each plot was fitted with a fifth order polynomial function. The subtraction of the polynomial fit in the presence of CPA from the polynomial fit in control yielded the contribution of SERCA pumps to clearance. The inset expands the polynomial fits and resulting subtraction for the low [Ca2+]i range.
Plasma membrane clearance systems
In most cell types it is well known that plasma membrane Ca2+ (PMCA) pumps and plasma membrane Na+–Ca2+ exchangers, working in parallel, contribute to the decay of transients. Several agents (e.g. calmidazolium and La3+) can inhibit PMCA pump activity partially or totally. However, unlike SERCA pump antagonists, they do not have a high specificity for PMCA pumps. Fluorescein analogues such as eosin and carboxyeosin have been demonstrated to be powerful inhibitors of PMCA activity in cardiac myocytes (Bassani, Bassani & Bers, 1995) and in squid giant axon (R. DiPolo & L. Beaugé, personal communication). Thus, we tested the effects of 5,6-succinimidyl carboxyeosin (CE) at 40 μM, a concentration at which this fluorescein analogue can affect SERCA as well as PMCA pumps, but does not interfere with the Na+–Ca2+ exchanger (Bassani et al. 1995; R. DiPolo & L. Beaugé, personal communication). To assay the role of PMCA pumps in isolation from SERCA pumps, these experiments were performed in the presence of 50 μM CPA (applied by bath perfusion 8 min prior to the experiment). Figure 4 illustrates the results obtained in the low (Fig. 4A) and high range of [Ca2+]i (Fig. 4B). The effect of CE on the time course of decay of transients was dose dependent, 20 μM (n = 3; data not shown) exerting a smaller effect than 40 μM of the inhibitor. There were no significant changes in resting [Ca2+]i, nor on the peak [Ca2+]i reached by a given depolarization.
Figure 4. Contribution of PMCA pumps to clearance.
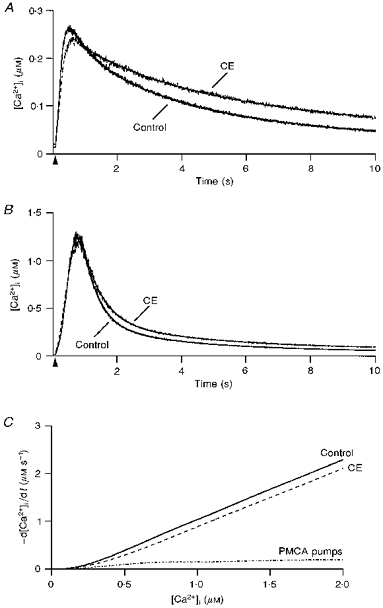
A, effect of 5,6-succinimidyl carboxyeosin (CE) on small transients: superimposed transients recorded in control external saline and in the presence of 40 μM CE. The control trace was elicited by a 160 ms depolarization at 13 min in WCR and the CE trace results from a 150 ms depolarization at 25 min in WCR. The corresponding t0.5 values were 2.2 and 3.6 s. Superimposed on each trace are the fits of the decay by a double exponential, with τ1 and τ2 of 0.78 and 4.06 s in control, and 2.68 and 8.4 s in CE. B, effect of 40 μM CE on large transients: the control trace corresponds to a 210 ms depolarization at 11.5 min in WCR while the CE trace was elicited by a 200 ms depolarization at 25 min in WCR. The t0.5 values were 0.55 and 0.66 s, respectively. Time constants of decay (fits are superimposed on each trace) were 0.63 and 4.31 s in control, and 0.53 and 3.57 s in CE. C, data from 48 transients (24 in control saline and 24 in CE) were pooled from 13 cells and analysed in terms of -d[Ca2+]i/dt as a function of [Ca2+]i.
A similar data analysis to that performed in the experiments with CPA was used to assess the role of PCMA pumps in clearance. The results are summarized in Fig. 4C, which displays the polynomial fits of -d[Ca2+]i/dt as a function of [Ca2+]i for transients obtained before and after addition of CE (13 cells), as well as the result of their subtraction, corresponding to the contribution of PMCA pumps to clearance.
As in the case of PMCA pumps, specific antagonists of the Na+–Ca2+ exchanger are not available. However, monovalent cations such as Li+, choline and N-methyl-D-glucamine (NMDG) cannot substitute for Na+ in the exchange reaction (Philipson & Nicoll, 1992, and references therein). Therefore, to evaluate the contribution of the Na+–Ca2+ exchanger to clearance, 125 mM NaCl in the extracellular saline was replaced by equimolar LiCl (leaving 27 mM Na+ in what will be called hereafter Li+ saline). In our experimental conditions this lowering of extracellular Na+ is sufficient to invert the electromotive force for the forward reaction of the exchanger, even at 2 μM . As illustrated in Fig. 5A, the decay of transients was slowed by Li+ saline, a result observed in all cells tested (n = 15). In 70% of the cells, the rate of decay upon reintroduction of Na+ returned to 50–70% of the initial value in control saline (n = 13).
Figure 5. Contribution of the Na+–Ca2+ exchanger to clearance.
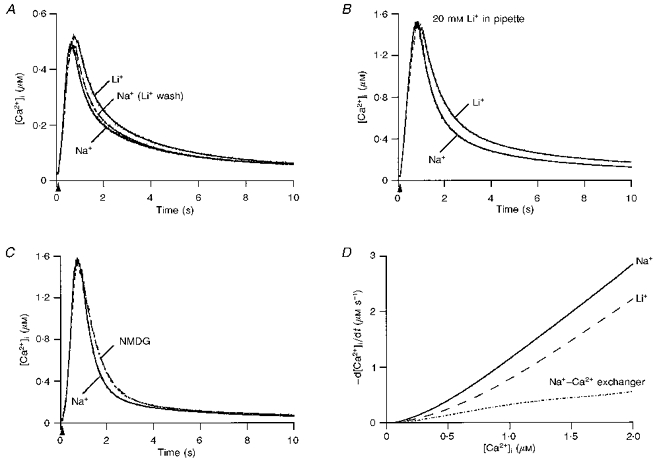
A, 3 superimposed Ca2+ transients recorded from the same cell in control external saline (Na+), after changing the bath to a Li+ saline (Li+) and upon reintroduction of control saline (Na+ (Li+ wash)). The pulse duration and WCR times were: 250 ms and 7 min, respectively, for the Na+ trace; 275 ms and 12 min, respectively, for the Li+ trace; and 250 ms and 17 min, respectively, for the Na+ (Li+ wash) trace. The corresponding t0.5 values were 0.82, 1.05 and 0.89 s, respectively. The fits of the decay by a double exponential are superimposed on each trace; τ1 and τ2 were 0.49 and 3.10 s in control, 0.60 and 3.37 s in Li+, and 0.48 and 2.75 s upon return to Na+. B, 2 superimposed transients recorded before (Na+ trace) and after replacement of external Na+ by Li+ (Li+ trace) from a cell in which 20 mM Li+ was included in the patch pipette. Both transients were elicited by a 150 ms depolarization. WCR times, 9.3 min (Na+ trace) and 15 min (Li+ trace); t0.5 values, 0.67 and 1.0 s. Double exponential fits of the decay give τ1 and τ2 values of 0.61 and 3.42 s in control, and 0.8 and 4.16 s in Li+. C, effect of external Na+ replacement by NMDG: transients elicited by 180 ms depolarizations in control external saline (Na+ trace; 7 min in WCR) and in NMDG saline (NMDG trace; 12.5 min in WCR). The corresponding t0.5 values were 0.54 and 0.71 s. Time constants of decay were 0.48 and 3.76 s in control, and 0.70 and 3.86 s in NMDG. D, 36 Ca2+ transients from 15 cells, 18 for each condition (control and external Li+) were analysed to calculate -d[Ca2+]i/dt as a function of [Ca2+]i.
External perfusion with Li+ may lead to the entry of this ion into the cytoplasm, where it could modulate homeostasis in ways unrelated to its action on the Na+–Ca2+ exchanger (for example, by interfering with the InsP3 cascade). Two sets of control experiments were performed to rule out this possibility. The first involved substitution of 20 mM CsCl in the internal solution by equimolar LiCl; under this condition, replacement of control saline by Li+ saline still slowed transients (Fig. 5B). Similar results were obtained in all cells studied (n = 5), indicating that the effect of Li+ on transients is due to the lowering of the external Na+ concentration. The second control involved the use of NMDG, an inert cation, as a replacement for Na+. In seven out of nine cells tested, such replacement slowed the decay of transients, as displayed in Fig. 5C. The effect in these seven cells was smaller than that observed with Li+ replacement and it was partially reversible in only 33% of the cells (n = 6). For a given pulse duration and amplitude, peak [Ca2+]i values reached in either Li+ or NMDG were similar to those in control external saline. Replacement of extracellular Na+ by Li+ (but not by NMDG) led to small (5–10 nM) increases in the resting level of [Ca2+]i.
Data from the set of experiments in which extracellular Na+ was replaced by Li+ (15 cells) were analysed in terms of -d[Ca2+]i/dt as a function of [Ca2+]i. The corresponding polynomial fits, as well as their subtraction, are shown in Fig. 5D.
Mitochondria
We next probed the role of mitochondria in Purkinje cell homeostasis using Ca2+ uptake uncouplers. First, we tested the protonophores carbonyl cyanide p-(trifluoromethoxy)phenylhydrazone (FCCP) and carbonyl cyanide m-chlorophenylhydrazone (CCCP), which dissipate the transmembrane mitochondrial potential and thus release Ca2+ from mitochondria preventing further uptake of the ion by the organelle. These protonophores have been widely used to assay the role of mitochondria in clearance. In our experimental conditions, bath applications of FCCP (4 μM) and CCCP (2 μM) provoked irreversible changes in the membrane conductance and in the resting calcium concentration, [Ca2+]R, of all Purkinje cells tested (n = 4 and 5, respectively). Figure 6A illustrates a typical example of these changes. Upon addition of the drug, [Ca2+]R increased gradually from its basal level of 20–40 nM to ∼200 nM and remained elevated after washing out the agent. In parallel with this increment in [Ca2+]R, an inward current was generated at the holding potential (-60 mV). Given the ionic conditions, this current is likely to represent activation of Ca2+-dependent Cl− channels and/or non-specific Ca2+-dependent cationic channels. Addition to the patch pipette of oligomycin (4 μg ml−1) and of 50 mM Hepes did not prevent the changes in [Ca2+]R or the accompanying inward current (n = 3; data not shown).
We also examined the effect of rotenone (10 μM), a specific inhibitor of complex I of the respiratory chain. As shown in Fig. 6B, bath applications of this compound mimicked the effects of protonophores both on [Ca2+]R and on the membrane holding current (n = 2). Due to these effects, Ca2+ uptake uncouplers were not useful for assaying the role of mitochondria in clearance in Purkinje cells. It is nonetheless important to determine the source of Ca2+ responsible for the increment in [Ca2+]R caused by agents which disturb mitochondrial metabolism, to compare with results from other preparations (see Discussion). To this effect, two types of experiments were performed. Firstly, voltage-gated Ca2+ channels were blocked by bath application of CdCl2 (200 μM) and D600 (methoxyverapamil; 200 μM). This reduced, but did not eliminate, the effects of FCCP or CCCP (n = 4; data not shown). Secondly, the effects of protonophores were studied in the absence of external Ca2+. As illustrated in Fig. 6C, application of 2 μM CCCP in Ca2+-free saline (no added Ca2+ plus 200 μM EGTA) provoked a small but clear increment in [Ca2+]R. Subsequent addition of 2 μM external Ca2+ led to a further increase in [Ca2+]R, which reached a steady level close to that attained in cells exposed to CCCP in normal saline. Control experiments showed that, in the absence of protonophores, [Ca2+]R does not change when external Ca2+ is removed. However, in two out of three cells, addition of external Ca2+ following a 6–10 min exposure to Ca2+-free saline, led to a rise in [Ca2+]R similar to that observed upon Ca2+ re-admission in the presence of CCCP (data not shown). Taken together these results strongly suggest that mitochondrial uncouplers release Ca2+ from mitochondria. However, contribution of Ca2+ influx and/or release from other intracellular stores to the observed increase in resting [Ca2+]i cannot be ruled out (see Discussion).
DISCUSSION
General properties of decay in cerebellar Purkinje cell somata
This work is the first attempt to characterize the mechanisms governing clearance in rat cerebellar Purkinje cells. We focused the study on neuronal somata to manipulate accurately the amplitude and duration of local voltage signals leading to [Ca2+]i rises. It has been shown previously that the somata of Purkinje cells are accurately voltage clamped using tight-seal whole-cell recording techniques, and that the regenerative current responses which may occur in the dendritic compartment following depolarizing pulses do not contribute to the somatic [Ca2+]i changes (Llano et al. 1994). Consequently, our experimental conditions allowed us to explore a wide range of [Ca2+]i in a reproducible fashion.
It is important to emphasize that we studied the time course of decay of spatially averaged transients. Confocal microscopy of Purkinje cells indicates that substantial spatial gradients are achieved when [Ca2+]i rises in the neuronal somata following climbing fibre stimulation or depolarization in voltage-clamped neurones (Eilers et al. 1995). The decay of the spatially averaged transients measured in the present study (τ1, ∼0.6 s; τ2, ∼3 s) is slower than that observed by Eilers et al. (1995) in the subplasmalemmal region of Purkinje cell somata (τ1, ∼0.1 s; τ2, ∼0.8 s). In our work, we observed a double exponential decay throughout the range of [Ca2+]i explored (50 nM to 2 μM), reflecting the combined action of endogenous and exogenous calcium buffers as well as cellular calcium clearance systems. Concerning endogenous buffers, calcium-binding proteins such as calbindin and parvalbumin are likely to play key roles in Purkinje cells. Two recent reports support the involvement of calbindin. Firstly, we have found that the buffering capacity of Purkinje cells increases during development, paralleling the increased expression of calbindin D28k (Fierro & Llano, 1996, and references within). Secondly, it has been shown that the amplitude of transients is significantly larger in Purkinje cells from mice lacking calbindin D28k than in cells from control animals (Airaksinen, Eilers, Garaschuk, Thoenen, Konnerth & Meyer, 1997). This result is in agreement with the fast on-rate and high affinity of calbindin for Ca2+, which would constrain the maximum [Ca2+]i rise attained for a given influx and set an upper limit to the speed of its decay (Sala & Hernandez-Cruz, 1990; Lledo, Somasundaram, Morton, Emson & Mason, 1992; Chard, Bleakman, Christakos, Fullmer & Miller, 1993). There are no physiological data pertaining to the involvement of parvalbumin in Purkinje cells. In other systems, this protein also limits [Ca2+]i rises and slows their decay (Chard et al. 1993). In the present work, we find the values of the two decay time constants to be independent of peak [Ca2+]i, whereas the contribution of the faster time constant increases with [Ca2+]i. Such behaviour could result from the progressive acceleration, as a function of [Ca2+]i, of clearance mechanisms, particularly those with fast kinetics and low Ca2+ affinity.
Relative contribution of the mechanisms which participate in clearance in Purkinje cell somata
We have compared transients with similar peak values in control and experimental conditions in order to calculate the rates of clearance. Although similar peak responses do not necessarily imply similar loads, this assumption is strongly supported by the stability during long whole-cell recording periods of both the peak [Ca2+]i induced by a given stimulus and the time course of decay of the transients. Both parameters indicate that Ca2+ influx and/or release and the endogenous Ca2+-binding ratio remain constant during the experiments.
Figure 7 summarizes the clearance rates as a function of [Ca2+]i for the three systems investigated in the present work: SERCA pumps, PMCA pumps and the Na+–Ca2+ exchanger. Since the curves were obtained by subtraction (see Methods), no correction is needed for Ca2+ diffusion to the pipette. The relative contribution of each system, calculated from these curves for four values of [Ca2+]i, is given in Table 1A. At the lowest range of [Ca2+]i, the combined action of the three systems can account for a high fraction (78%) of the removal process. As [Ca2+]i increases, their total contribution declines, reaching 45% at 2 μM . The relative contribution of the clearance systems varies as a function of [Ca2+]i. In the low range, the proportion of removed by SERCA pumps, PMCA pumps and the Na+–Ca2+ exchanger is balanced. At 2 μM the major contributors are the SERCA pumps (21%) and the Na+–Ca2+ exchanger (18%), whereas PMCA pumps account for only 6% of clearance. Table 1B presents the fraction of the maximal rate of activity expected from each of these systems, as well as for mitochondria, when allowance is made for their Ca2+ affinity and for the number of Ca2+ ions transported per molecule (see Table 1 legend). These calculations indicate that SERCA pumps will be close to saturation at levels above 1.5 μM, whereas PMCA pumps will already be near saturation at 0.5 μM. The predictions are in accordance with the data displayed in Fig. 7, which shows that while clearance rates for PMCA pumps level slightly above 0.5 μM , rates for SERCA pumps continue to increase up to 1.5 μM .
Figure 7. Summary of clearance in rat cerebellar Purkinje cell somata.
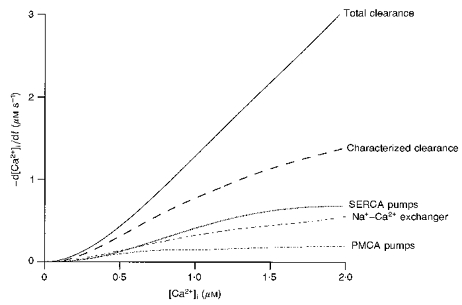
Total Ca2+ clearance rate is presented in comparison with the rate of the different components characterized during the present study. Clearance rate is plotted as a function of the [Ca2+]i in the range between 50 nM and 2 μM.
Table 1.
Relative contribution of cellular clearance systems to removal
| 0.5 μM | 1 μM | 1.5 μM | 2 μM | |
|---|---|---|---|---|
| A. Determined contribution (%) | ||||
| SERCA pumps | 27 | 31.5 | 28.5 | 21 |
| PMCA pumps | 21 | 11.5 | 8 | 6 |
| Na+–Ca2+ exchanger | 30 | 25 | 20 | 18 |
| Total characterized | 78 | 68 | 56.5 | 45 |
| B. Predicted maximal rate of activity (%) | ||||
| SERCA 2b pumps | 77 | 93 | 97 | 98 |
| SERCA 2a pumps | 61 | 86 | 93 | 96 |
| PMCA pumps | 95 | 99 | 99 | 99 |
| Na+–Ca2+ exchanger | ||||
| High affinity | 50 | 67 | 75 | 80 |
| Low affinity | 1 | 2 | 4 | 5 |
| Mitochondrial uptake | 3 | 6 | 9 | 11 |
A, the relative percentage contribution of each system to clearance was calculated for different levels of , from the polynomial fits to the experimental data summarized in Fig. 7. B, for each system and range of [Ca2+]i, the numbers correspond to the fraction of the maximal rate of activity, calculated as: ([Ca2+]n/(K0.5n+[Ca2+]n)) × 100, where K0.5 and n represent the affinity constant for Ca2+ and the number of Ca2+ ions transported per cycle per molecule, respectively (Lytton, Westlin, Burk, Shull & MacLennan, 1992). Values for K0.5 and n were: SERCA 2b pumps: 0.27 μM, n = 2; and SERCA 2a pumps: 0.4 μM, n = 2 (Lytton et al. 1992); PMCA pumps: 0.11 μM, n = 2 (Gill et al. 1984); Na+–Ca2+ exchanger, low affinity: 40 μM, n = 1; and Na+–Ca2+ exchanger, high affinity: 0.5 μM, n = 1 (Gill et al. 1984); mitochondria: 16 μM, n = 1 (Gunter & Gunter, 1994).
The involvement of SERCA pumps in Purkinje cell homeostasis is in accordance with immunocytochemical studies demonstrating high levels of SERCA pumps of the 2b subtype (K0.5, ∼0.27 μM) and lower levels for the 2a subtype (K0.5, ∼0.4 μM) (Takei et al. 1992, and references therein). PMCA pumps have also been described in Purkinje cells. The PMCA pump type 2 is the most abundant, having a 10-fold higher concentration than other pumps of the same family (Tolosa de Talamoni et al. 1993). Additionally, it is considered that PMCA pump types 1 and 4 are present in almost all cell types and participate in regulating resting [Ca2+]i. Although eosin derivatives have not been studied before in Purkinje cells, the contribution we calculate for PMCA pumps is similar to that obtained in other cell types with different PMCA pump blockers (Herrington, Park, Babcok & Hille, 1996) and to the one expected for a system with high affinity, low capacity and slow transport turnover.
It is worth noting that agents which interfered with SERCA or PMCA pumps, as well as ionic substitutions affecting the Na+–Ca2+ exchanger, did not alter resting levels. In this context, one must consider that the resting [Ca2+]i in Purkinje cells is quite low and that it is not affected by removal of external Ca2+, indicating that the passive leak of Ca2+ into the cell somata is small. The clearance systems are therefore expected to work at slow rates under basal conditions. Since in our experiments only one putative clearance system was blocked at a given time, any small [Ca2+]i increase would be compensated for by the activation of the other systems.
The Na+–Ca2+ exchanger
The Na+–Ca2+ exchanger has been shown to participate in the regulation of homeostasis and of exocytosis in neuronal cells (e.g. Reuter & Porzig, 1995). Our analysis shows a small but sustained increase in the clearance performed by this system as [Ca2+]i increases, a similar result to that reported for chromaffin cells (Herrington et al. 1996). These findings can be explained by a system with two sites for transport, one with high affinity and the other with low affinity, as proposed from studies of the Na+–Ca2+ exchanger in synaptosomes (Gill, Chueh & Whitlow, 1984). Alternatively, a single site whose affinity for Ca2+ decreases with increments in [Ca2+]i can account for the results. In either case, no saturation is expected for the Na+–Ca2+ exchanger in the [Ca2+]i range covered by our experiments. The presence of the Na+–Ca2+ exchanger has not been documented immunocytochemically in Purkinje cells at the single cell level. However, antibodies against mRNA encoding the cardiac type of the exchanger, isolated from cerebellar granular cells, label the Purkinje cell layer (Marlier, Jian Tang & Grayson, 1993). The modest contribution of the exchanger to Purkinje cell clearance observed in the present work indicates that while the exchanger is present in Purkinje cells, its density is much lower than in other tissues such as cardiac muscle where this system plays a predominant role in governing homeostasis (reviewed by Philipson & Nicoll, 1992).
Mitochondria
Protonophores, as well as the respiratory chain inhibitor rotenone, led to significant increases in the basal levels of in Purkinje cells. Exposure to agents which interfere with mitochondrial Ca2+ uptake induce changes in resting [Ca2+]i that vary considerably amongst cell types. Thus, protonophores do not affect resting [Ca2+]i in chromaffin cells (Herrington et al. 1996) or in cortical pyramidal neurones (Markram, Helm & Sackmann, 1995). On the other hand, protonophores and/or respiratory chain inhibitors provoke augmentations in [Ca2+]i in mammalian neurones dissociated from the nucleus basalis (Tatsumi & Katayama, 1993), from the cerebellum (Kaplin, Snyder & Linden, 1996) and from the hippocampus (Villalba et al. 1994; Nowicky & Duchen, 1998), as well as in bullfrog sympathetic neurones (Friel & Tsien, 1994). Some of the reported alterations in homeostasis are likely to involve ATP depletion and subsequent release from intracellular stores. In fact, Kaplin et al. (1996) identify InsP3R-sensitive stores as the target for the large [Ca2+]i rises induced by cyanide in PC12 cells and in dissociated cerebellar Purkinje cells. However, in some of the studies cited above as well as in the present work, the [Ca2+]i elevations do not appear to be secondary to changes in intracellular pH or to ATP depletion, since they are obtained in cells dialysed with millimolar concentrations of ATP and with high pH buffering power (Tatsumi & Katayama, 1993; the present study). Furthermore, oligomycin, when used in conjunction with protonophores to prevent ATP hydrolysis, does not impede the [Ca2+]i rises (Villalba et al. 1994; the present study). The source of Ca2+ ions responsible for these [Ca2+]i elevations appears to be dual. On the one hand, Ca2+ channel blockers reduce the increase in [Ca2+]i, suggesting that the plasma membrane permeability to Ca2+ is altered by mitochondrial uncouplers and inhibition of the respiratory chain (Nowicky & Duchen, 1998; the present study). On the other hand, the [Ca2+]i rises can be obtained in the absence of extracellular Ca2+, indicating release from intracellular stores (Villalba et al. 1994; the present study). Regardless of the source of Ca2+, the possibility must be envisaged that some of the effects of mitochondrial uncouplers are due to release of neurotansmitters from other neurones in the preparation, and subsequent activation of receptors coupled to intracellular Ca2+ release pathways (e.g. metabotropic glutamate receptors).
During the present study, the effects of protonophores and rotenone on Purkinje cell membrane conductance and resting [Ca2+]i hindered further characterization of the role of mitochondria in removal following depolarization-evoked [Ca2+]i rises. In other preparations, namely bullfrog sympathetic neurones (Friel & Tsien, 1994), rat dorsal root ganglion neurones (Thayer & Miller, 1990) and chromaffin cells (Herrington et al. 1996), a dominant role of mitochondria in clearance has been postulated. In neurones from the rat nucleus basalis (Tatsumi & Katayama, 1993) and in rat isolated neurohypophysial nerve endings (Stuenkel, 1994) both mitochondria and Ca2+ pumps have been found to play an important role in clearance. Finally, in rat septal neurones (Bleakman, Roback, Wainer, Miller & Harrison, 1993) and in cortical pyramidal neurones (Markram et al. 1995) mitochondria do not contribute to clearance whereas SERCA pumps play a crucial role. This variability between different cell types in mitochondrial contribution to clearance might result from differences in the regulation of mitochondrial Ca2+ transport (Gunter & Gunter, 1994).
Limitations of the present study
Our results are likely to correspond to a lower limit for the contribution of the various systems studied, for two reasons. Firstly, the turnover of Ca2+ pumps as well as of the Na+–Ca2+ exchanger is highly temperature dependent (Q10, 2–4) and our experiments were done at 20–24°C. Secondly, we have studied each clearance system by interfering with it either through specific inhibitors or by ionic replacement, while leaving other systems unaltered. Under these conditions, unblocked mechanisms should be able to compensate, at least partially, for the inhibition of the blocked system. Furthermore, although we have used inhibitors at doses which induce maximal inhibition in isolated transport systems and allowed for several minutes of incubation, we cannot ensure that such doses are sufficient to inhibit totally the system in question in a brain slice. These factors may partially explain the relatively high percentage of total clearance which remains unaccounted for by the present study. Furthermore, at least 15% of the removal could correspond to diffusion of the ion towards the patch pipette (see Fig. 3D in Herrington et al. 1996). On the other hand, mechanisms not yet identified may contribute to Purkinje cell clearance. Thus, in cerebellar microsomal fractions it has been observed that cyclopiazonic acid and thapsigargin can inhibit only 50–75% of ATP-dependent Ca2+ transport (Michelangeli, DaSilva, Sayers & Brown, 1992). This suggests that some or probably all cerebellar cells possess intracellular compartments with Ca2+-ATPases distinct from SERCA pumps. These pumps could be partially responsible for the component of clearance unaccounted for in our work. Finally, further experiments need to be carried out in Purkinje cells to determine the role played by mitochondria in the clearance of following depolarization-induced [Ca2+]i rises.
Acknowledgments
We thank A. Marty for discussions throughout the course of this study, L. Forti for comments on the manuscript and C. Auger and C. Pouzat for aid on analysis routines. This work was supported by the Max-Planck-Gesellschaft and the Hildegard Doerenkamp-Gerhard Zbinden Foundation. R. DiPolo was a visiting fellow under the auspices of the CONICIT (grant S1-97001765) and the Deutscher Akademischer Austausschdienst. L. Fierro was supported by a doctoral fellowship from the Colombian Institute for the Development of Science and Technology (COLCIENCIAS).
References
- Airaksinen MS, Eilers J, Garaschuk O, Thoenen H, Konnerth A, Meyer M. Ataxia and altered dendritic calcium signaling in mice carrying a targeted null mutation of the calbindin D28k gene. Proceedings of the National Academy of Sciences of the USA. 1997;94:1488–1493. doi: 10.1073/pnas.94.4.1488. 10.1073/pnas.94.4.1488. [DOI] [PMC free article] [PubMed] [Google Scholar]
- Bassani RA, Bassani JW, Bers DM. Relaxation in ferret ventricular myocytes: role of the sarcolemmal Ca ATPase. Pflügers Archiv. 1995;430:573–578. doi: 10.1007/BF00373894. [DOI] [PubMed] [Google Scholar]
- Bleakman D, Roback JD, Wainer BH, Miller RJ, Harrison NL. Calcium homeostasis in rat septal neurons in tissue culture. Brain Research. 1993;600:257–267. doi: 10.1016/0006-8993(93)91381-2. [DOI] [PubMed] [Google Scholar]
- Chard P, Bleakman D, Christakos S, Fullmer CS, Miller RJ. Calcium buffering properties of calbindin D28k and parvalbumin in rat sensory neurones. The Journal of Physiology. 1993;472:341–357. doi: 10.1113/jphysiol.1993.sp019950. [DOI] [PMC free article] [PubMed] [Google Scholar]
- Denk W, Sugimori M, Llinás R. Two types of calcium response limited to single spines in cerebellar Purkinje cells. Proceedings of the National Academy of Sciences of the USA. 1995;92:8279–8282. doi: 10.1073/pnas.92.18.8279. [DOI] [PMC free article] [PubMed] [Google Scholar]
- Eilers J, Callewaert G, Armstrong C, Konnerth A. Calcium signaling in a narrow somatic submembrane shell during synaptic activity in cerebellar Purkinje neurons. Proceedings of the National Academy of Sciences of the USA. 1995;92:10272–10276. doi: 10.1073/pnas.92.22.10272. [DOI] [PMC free article] [PubMed] [Google Scholar]
- Fierro L, Llano I. High endogenous calcium buffering in Purkinje cells from rat cerebellar slices. The Journal of Physiology. 1996;496:617–625. doi: 10.1113/jphysiol.1996.sp021713. [DOI] [PMC free article] [PubMed] [Google Scholar]
- Friel DD, Tsien RW. An FCCP-sensitive store in bullfrog sympathetic neurons and its participation in stimulus-evoked changes in [Ca2+]i. Journal of Neuroscience. 1994;14:4007–4024. doi: 10.1523/JNEUROSCI.14-07-04007.1994. [DOI] [PMC free article] [PubMed] [Google Scholar]
- Gill DL, Chueh S-H, Whitlow CL. Functional importance of the synaptic plasma membrane calcium pump and sodium-calcium exchanger. Journal of Biological Chemistry. 1984;259:10807–10813. [PubMed] [Google Scholar]
- Gunter KK, Gunter TE. Transport of calcium by mitochondria. Journal of Bioenergetics and Biomembranes. 1994;26:471–485. doi: 10.1007/BF00762732. [DOI] [PubMed] [Google Scholar]
- Herrington J, Park YB, Babcock DF, Hille B. Dominant role of mitochondria in clearance of large Ca2+ loads from rat adrenal chromaffin cells. Neuron. 1996;16:219–228. doi: 10.1016/s0896-6273(00)80038-0. [DOI] [PubMed] [Google Scholar]
- Inesi G, Sagara Y. Specific inhibitors of intracellular Ca2+ transport ATPases. Journal of Membrane Biology. 1994;141:1–6. doi: 10.1007/BF00232868. [DOI] [PubMed] [Google Scholar]
- Kano M, Schneggenburger R, Verkhratsky A, Konnerth A. Depolarization-induced calcium signals in the somata of cerebellar Purkinje neurons. Neuroscience Research. 1995;24:87–95. doi: 10.1016/0168-0102(95)00978-7. [DOI] [PubMed] [Google Scholar]
- Kaplin AI, Snyder SH, Linden DJ. Reduced nicotinamide adenine dinucleotide-selective stimulation of inositol 1,4,5-trisphosphate receptors mediates hypoxic mobilization of calcium. Journal of Neuroscience. 1996;15:2002–2011. doi: 10.1523/JNEUROSCI.16-06-02002.1996. [DOI] [PMC free article] [PubMed] [Google Scholar]
- Khodakhah K, Ogden D. Fast activation and inactivation of inositol trisphosphate-evoked Ca2+ release in rat cerebellar Purkinje neurones. The Journal of Physiology. 1995;487:343–358. doi: 10.1113/jphysiol.1995.sp020884. [DOI] [PMC free article] [PubMed] [Google Scholar]
- Lev-Ram V, Miyakawa H, Lasser-Ross N, Ross WN. Calcium transients in cerebellar Purkinje neurons evoked by intracellular stimulation. Journal of Neurophysiology. 1992;68:1167–1177. doi: 10.1152/jn.1992.68.4.1167. [DOI] [PubMed] [Google Scholar]
- Llano I, DiPolo R, Marty A. Calcium-induced calcium release in cerebellar Purkinje cells. Neuron. 1994;12:663–673. doi: 10.1016/0896-6273(94)90221-6. [DOI] [PubMed] [Google Scholar]
- Lledo PM, Somasundaram B, Morton AJ, Emson PC, Mason WT. Stable transfection of calbindin D28k into the GH3 cell line alters calcium currents and intracellular calcium homeostasis. Neuron. 1992;9:943–954. doi: 10.1016/0896-6273(92)90246-a. [DOI] [PubMed] [Google Scholar]
- Lytton J, Westlin M, Burk SE, Shull GE, MacLennan DH. Functional comparisons between isoforms of the sarcoplasmic or endoplasmic reticulum family of calcium pumps. Journal of Biological Chemistry. 1992;267:14483–14489. [PubMed] [Google Scholar]
- Markram H, Helm JP, Sakmann B. Dendritic calcium transients evoked by single back-propagating action potentials in rat neocortical pyramidal neurons. The Journal of Physiology. 1995;485:1–20. doi: 10.1113/jphysiol.1995.sp020708. [DOI] [PMC free article] [PubMed] [Google Scholar]
- Marlier LNJ-L, Jian Tang TZ, Grayson DR. Regional distribution in the rat central nervous system of a mRNA encoding a portion of the cardiac sodium/calcium exchanger isolated from cerebellar granule neurons. Molecular Brain Research. 1993;20:21–39. doi: 10.1016/0169-328x(93)90107-z. [DOI] [PubMed] [Google Scholar]
- Marty A, Llano I. Modulation of inhibitory synapses in the mammalian brain. Current Opinion in Neurobiology. 1995;5:335–341. doi: 10.1016/0959-4388(95)80046-8. [DOI] [PubMed] [Google Scholar]
- Michelangeli F, DaSilva A, Sayers L, Brown G. The effects of thimerosal and cyclopiazonic acid on the Ca2+ pumps from rat cerebellum microsomes. Biochemical Society Transactions. 1992;20:205S. doi: 10.1042/bst020205s. [DOI] [PubMed] [Google Scholar]
- Miyakawa H, Lev-Ram V, Lasser-Ross N, Ross WN. Calcium transients evoked by climbing fiber and parallel fiber synaptic inputs in guinea pig cerebellar neurons. Journal of Neuroscience. 1992;68:1178–1189. doi: 10.1152/jn.1992.68.4.1178. [DOI] [PubMed] [Google Scholar]
- Neher E. The use of fura-2 for estimating Ca buffers and Ca fluxes. Neuropharmacology. 1995;34:1423–1442. doi: 10.1016/0028-3908(95)00144-u. [DOI] [PubMed] [Google Scholar]
- Nowicky AV, Duchen MR. Changes in [Ca2+]i and membrane currents during impaired mitochondrial metabolism in dissociated rat hippocampal neurons. The Journal of Physiology. 1998;507:131–145. doi: 10.1111/j.1469-7793.1998.131bu.x. [DOI] [PMC free article] [PubMed] [Google Scholar]
- Ogden D. Intracellular calcium release in central neurones. Seminars in the Neurosciences. 1996;8:281–291. [Google Scholar]
- Philipson KD, Nicoll DA. Sodium-calcium exchange. Current Opinion in Cell Biology. 1992;4:678–683. doi: 10.1016/0955-0674(92)90089-u. [DOI] [PubMed] [Google Scholar]
- Plessers L, Eggermont JA, Wuytack F, Casteels R. A study of the organellar Ca2+-transport ATPase isozymes in pig cerebellar Purkinje neurons. Journal of Neuroscience. 1991;11:650–656. doi: 10.1523/JNEUROSCI.11-03-00650.1991. [DOI] [PMC free article] [PubMed] [Google Scholar]
- Regehr WG, Tank DW. Dendritic calcium dynamics. Current Opinion in Neurobiology. 1994;4:373–382. doi: 10.1016/0959-4388(94)90099-x. [DOI] [PubMed] [Google Scholar]
- Reuter H, Porzig H. Localization and functional significance of the Na+/Ca2+ exchanger in presynaptic boutons of hippocampal cells in culture. Neuron. 1995;15:1077–1084. doi: 10.1016/0896-6273(95)90096-9. [DOI] [PubMed] [Google Scholar]
- Sakurai M. Calcium is an intracellular mediator of the climbing fiber in induction of cerebellar long-term depression. Proceedings of the National Academy of Sciences of the USA. 1990;87:3383–3385. doi: 10.1073/pnas.87.9.3383. [DOI] [PMC free article] [PubMed] [Google Scholar]
- Sala F, Hernández-Cruz A. Calcium diffusion modeling in a spherical neuron. Biophysical Journal. 1990;57:313–324. doi: 10.1016/S0006-3495(90)82533-9. [DOI] [PMC free article] [PubMed] [Google Scholar]
- Stuenkel EL. Regulation of intracellular calcium and calcium buffering properties of rat isolated neurohypophysial nerve endings. The Journal of Physiology. 1994;481:251–271. doi: 10.1113/jphysiol.1994.sp020436. [DOI] [PMC free article] [PubMed] [Google Scholar]
- Takei K, Stukenbrok H, Metcalf A, Mignery GA, Südhof TC, Volpe P, De Camilli P. Ca2+ stores in Purkinje neurons: Endoplasmic reticulum subcompartments demonstrated by the heterogeneous distribution of the InsP3 receptor, Ca2+ ATPase and calsequestrin. Journal of Neuroscience. 1992;12:489–505. doi: 10.1523/JNEUROSCI.12-02-00489.1992. [DOI] [PMC free article] [PubMed] [Google Scholar]
- Tank DW, Sugimori M, Connor JA, Llinás RR. Spatially resolved calcium dynamics of mammalian Pukinje cells in cerebellar slice. Science. 1988;242:773–777. doi: 10.1126/science.2847315. [DOI] [PubMed] [Google Scholar]
- Tatsumi H, Katayama Y. Regulation of the intracellular free calcium concentration in acutely dissociated neurones from rat nucleus basalis. The Journal of Physiology. 1993;464:165–181. doi: 10.1113/jphysiol.1993.sp019628. [DOI] [PMC free article] [PubMed] [Google Scholar]
- Thayer SA, Miller RJ. Regulation of the intracellular free calcium concentration in single rat dorsal root ganglion neurones in vitro. The Journal of Physiology. 1990;425:85–115. doi: 10.1113/jphysiol.1990.sp018094. [DOI] [PMC free article] [PubMed] [Google Scholar]
- Tolosa de Talamoni N, Smith CA, Wasserman RH, Beltramino C, Fullmer CS, Penniston JT. Immunocytochemical localization of the plasma membrane calcium pump, calbindin-D28k and parvalbumin in Purkinje cells of avian and mammalian cerebellum. Proceedings of the National Academy of Sciences of the USA. 1993;90:11949–11953. doi: 10.1073/pnas.90.24.11949. [DOI] [PMC free article] [PubMed] [Google Scholar]
- Villalba M, Martínez-Serrano A, Gómez-Puertas P, Blanco P, Börner C, Villa A, Casado M, Giménez C, Pereira R, Bogonez E, Pozzan T, Satrústegui C. The role of pyruvate in neuronal calcium homeostasis. Journal of Biological Chemistry. 1994;269:2468–2476. [PubMed] [Google Scholar]