Abstract
Electrical events and intracellular calcium concentration ([Ca2+]) imaged using fluo-3 and laser scanning confocal microscopy were simultaneously monitored in single smooth muscle cells freshly isolated from guinea-pig vas deferens or urinary bladder.
Images obtained every 8 ms, during stepping from -60 to 0 or +10 mV for 50 ms under voltage clamp, showed that a rise in [Ca2+] could be detected within 20 ms of depolarization in five to twenty small (< 2 μm diameter) ‘hot spots’, over 95 % of which were located within 1.5 μm of the cell membrane. Depolarization at 30 s intervals activated hot spots at the same places.
Cd2+ or verapamil abolished both hot spots and Ca2+-activated K+ current (IK,Ca). Caffeine almost abolished hot spots and markedly reduced IK,Ca. Cyclopiazonic acid, which raised basal global [Ca2+], decreased the rise in hot spot [Ca2+] and IK,Ca amplitude during depolarization. These results suggest that Ca2+ entry caused Ca2+-induced Ca2+ release (CICR).
Under voltage clamp, hot spot [Ca2+] closely paralleled the rise in IK,Ca and reached a peak within 20 ms of the start of depolarization, but the rise in global [Ca2+] over the whole cell area was much slower. Step depolarization to potentials positive to -20 mV caused hot spots to grow in size and coalesce, leading to a rise in global [Ca2+] and contraction. Ca2+ hot spots also occurred during the up-stroke of an evoked action potential under current clamp.
It is concluded that the entry of Ca2+ in the early stages of an action potential evokes CICR from discrete subplasmalemma Ca2+ storage sites and generates hot spots that spread to initiate a contraction. The activation of Ca2+-dependent K+ channels in the plasmalemma over hot spots initiates IK,Ca and action potential repolarization.
Ca2+-induced Ca2+ release (CICR; Endo, 1977) is one of the fundamental mechanisms involved in the rise of intracellular Ca2+ concentration ([Ca2+]) in response to a wide range of stimuli in a variety of cell types, including myocytes, neurons, secretory and epithelial cells. Only in cardiac myocytes is CICR established as an essential step in excitation-contraction (E-C) coupling (Fabiato, 1985). In smooth muscle cells, although Ca2+-gated ryanodine receptors (Herrmann-Frank, Darling & Meissner, 1991; Xu et al. 1994) and CICR after a delay from the beginning of depolarization (Zholos, Baidan & Shuba, 1992; Ganitkevich & Isenberg, 1992, 1995) have been reported, the contribution of CICR to contraction has been suggested to be small (Iino, 1989) and the function of CICR in E-C coupling is unknown (Somlyo & Somlyo, 1994). The amount of Ca2+ influx through voltage-dependent Ca2+ channels during an action potential could be large enough to induce a contraction without involvement of CICR in smooth muscle cells (Kamishima & McCarron, 1996). In that case, if Ca2+ channels are distributed uniformly on the plasmalemma, the rise of [Ca2+] during a depolarization may start immediately beneath the plasmalemma and spread to the centre of the cell by diffusion. It has, however, been shown that a dissociation between Ca2+ release available for Ca2+-dependent K+ current (IK,Ca) activation and that for contraction occurs (Ganitkevich & Isenberg, 1996; Imaizumi et al. 1996b). The [Ca2+] measured by indo-1 as an integrated signal from the whole cell area may not reflect the subplasmalemma [Ca2+], which can be monitored by Ca2+-dependent K+ channel activity (Imaizumi, Henmi, Nagano, Muraki & Watanabe, 1996a).
In the present study, the possibility of a contribution of CICR to E-C coupling during an action potential was examined by the simultaneous measurement of two-dimensional Ca2+ images and membrane currents during depolarization. The results indicate that the mechanism of Ca2+-dependent K+ current activation is the major cause of action potential repolarization and after-hyperpolarization; it is also shown that rapid CICR from sparsely distributed subplasmalemma Ca2+ storage sites leads to a generalized rise in [Ca2+] and so elicits contraction. The preliminary results have been presented as an abstract (Imaizumi, Torii, Ooi, Muraki, Bolton & Watanabe, 1997).
METHODS
Cell isolation
Smooth muscle cells were isolated from vas deferens and urinary bladder using a slight modification of a previously described method (Imaizumi, Muraki & Watanabe, 1989). In brief, male guinea-pigs were stunned by a blow to the head and killed by exsanguination. All experiments were carried out in accordance with the guiding principles for the care and use of laboratory animals (the Science and International Affairs Bureau of the Japanese Ministry of Education, Science, Sports and Culture) and also with the approval of the ethics committee in Nagoya City University. Vas deferens and urinary bladder were dissected out in Ca2+-free Krebs solution. The tissue was immersed in Ca2+-free Krebs solution for 15 min in a test-tube at 37°C. Thereafter the solution was replaced with Ca2+-free solution containing 0.2 or 0.3 % collagenase, 0.2 % albumin and 0.2 % trypsin inhibitor. After 15-50 min treatment with these agents, the solution was replaced with Ca2+-free and collagenase-free Krebs solution. The tissue was gently sucked in and out of a glass pipette to isolate cells. At the start of each experiment, a few drops of cell suspension were placed in a recording chamber (0.5 ml) mounted on the stage of a phase contrast microscope (Nikon TMD). Cells were continuously perfused with Hepes-buffered solution (see Solutions) at a flow rate of 5 ml per min.
Solutions
Standard Krebs solution contained (mm): NaCl, 112; KCl, 4.7; CaCl2, 2.2; MgCl2, 1.2; NaHCO3, 25; KH2PO4, 1.2; glucose, 14. The pH was 7.4. Ca2+-free Krebs solution was prepared by omitting Ca2+ from standard Krebs solution. Standard and modified Krebs solutions were gassed with a mixture of 95 % O2 and 5 % CO2. For electrical recordings, Hepes-buffered solution (standard solution) having the following composition was used as the external solution (mm): NaCl, 137; KCl, 5.9; CaCl2, 2.2; MgCl2, 1.2; glucose, 14; Hepes, 10. The pH was adjusted to 7.4 with NaOH. The pipette-filling solution (pipette solution) contained (mm): KCl, 140; MgCl2, 1; ATP-Na2, 2; Hepes, 10; fluo-3, 0.1. The pH was adjusted to 7.2 with KOH. When only electrical signals were recorded, the pipette solution contained 0.05 mm EGTA instead of 0.1 mm fluo-3.
Electrical recording and data analysis
Whole-cell voltage clamp was applied to single cells with patch pipettes (Hamill, Marty, Neher, Sakmann & Sigworth, 1981) using an EPC-7 (List, Germany) or CEZ-2400 (Nihon Kohden, Japan) amplifier. The pipette resistance ranged from 2-4 MΩ when filled with the pipette solution. The seal resistance was approximately 30 GΩ. Series resistance was between 4 and 8 MΩ and was partly compensated. Data were stored and analysed using menu-drive software as previously reported (Imaizumi et al. 1996b). Membrane currents were digitized using a pulse code modulation (PCM) recording system (PCM-501ES; Sony, Tokyo, Japan) which was modified to give a frequency response from DC to 20 kHz and stored on videotape. Data on tape were replayed into a personal computer using data acquisition software. Data analysis was done on a computer using software (Cell-Soft) developed at the University of Calgary, Canada. Leakage currents at potentials positive to -60 mV were subtracted on the computer, assuming a linear relationship between current and voltage in the range of -90 to -60 mV. All experiments were done at room temperature (23 ± 1°C).
Measurement of fluo-3 signal from single cells
Ca2+ images were obtained using a fast laser scanning confocal microscope (RCM 8000; Nikon, Japan) and Ratio3 software (Nikon). A myocyte was loaded with 100 μm fluo-3 by diffusion from the recording pipette during whole-cell clamp. The excitation light of 488 nm from an argon ion laser was delivered through a water-immersion objective (Nikon Fluo × 40, 1.15 NA). The emission light of > 515 nm was detected by a photomultiplier. It takes 33 ms to scan one full frame (512 pixels × 512 pixels). Using 1/4 band scan mode, a frame which corresponds to an area of 170 μm × 27.5 μm was obtained every 8.25 ms. The resolution of the microscope was approximately 0.34 μm × 0.27 μm (x and y) × 0.5 μm (z), but the z-axis resolution was not determined systematically. The confocal plane through the cell was usually set where the width of the cell was largest, approximately 2 μm from its lowest point. The diffusion rate of fluo-3 into the cell appeared to vary widely from cell to cell and fluo-3 concentration increased rapidly during the first 5 min and gradually thereafter. Recordings were therefore started at least 5 min after rupturing the patch membrane.
Ca2+ images were stored on optical disk cartridges (LM-A410, Panasonic, Japan) by a rewritable optical disk recorder (LQ-4100A, Panasonic). The images on the optical disks were replayed later and analysed using Ratio3 software. Some analyses were performed using GLOBAL LAB image (Data Translation, Marlboro, MA, USA) after files were transferred to an IBM-AT compatible computer. Selected records were printed out by ink-jet colour printer (Hewlett Packard Diskjet 720C).
During the recording of fluorescent images, the cell shape was also monitored using red/infrared light having a wavelength range of > 600 nm and an IR-CCD video camera module (Sony, XC-77BB) which was attached to the microscope and recorded on a videotape. Video capturing and analyses of cell shape changes were performed later on an IBM-AT compatible computer using an AD translation board (Data Translation DT-55) and GLOBAL LAB imaging software.
Drugs
The sources of pharmacological agents were as follows: collagenase (500 U mg−1; Yakult, Tokyo); trypsin inhibitor (Sigma); albumin (Seikagaku Corporation, Tokyo); 4-aminopyridine (4-AP; Sigma) and CdCl2 (Wako Pure Chemical Industries, Osaka); tetraethylammonium chloride (TEA; Tokyokasei, Tokyo), EGTA and Hepes (Dojin, Kumamoto); flou-3 (Dojin); caffeine (Walker); cyclopiazonic acid (CPA; Sigma) and iberiotoxin (Peptide Institute Inc., Osaka).
Statistics
Pooled data are shown as means ±s.e.m. in the text. Statistical significance was evaluated using Student's t test. * and ** in the figures indicate statistical significance at P values of 0.05 and 0.01, respectively.
RESULTS
Ca2+ images during depolarization
[Ca2+] was monitored by calculating the averaged fluorescence intensity of fluo-3 (F intensity) from the whole cell area (global F intensity) of a single isolated vas deferens smooth muscle cell (Fig. 1A, green circles). Stepping to +10 mV under voltage clamp increased [Ca2+] but the rate of increase in the F intensity was much slower than the activation of outward current (Fig. 1A, blue dots). The Ca2+ image shown in Fig. 1B was obtained 11 ms after the start of depolarization. Although the averaged [Ca2+] was not high, several small (< 2 μm) hot spots located in areas of the subplasmalemma were observed (three arrows in Fig. 1B). The F intensity in a small circular area (diameter, 1.2 μm) over hot spot ‘a’ in Fig. 1B was measured in arbitrary intensity units (a.i.u.) and its time course is shown in Fig. 1A (red triangles). It takes only 0.25 ms to scan a 1.2 μm width band. Therefore the timing of the scan over each hot spot can be calculated accurately based on the position of the spot. The global F intensity was obtained as the averaged value from all pixels over the image of the cell (or the part of the cell in the frame) and plotted at the mean time of the scan over the cell.
Figure 1. Ca2+ image and membrane current in single myocytes of the guinea-pig vas deferens during a voltage step to +10 mV.
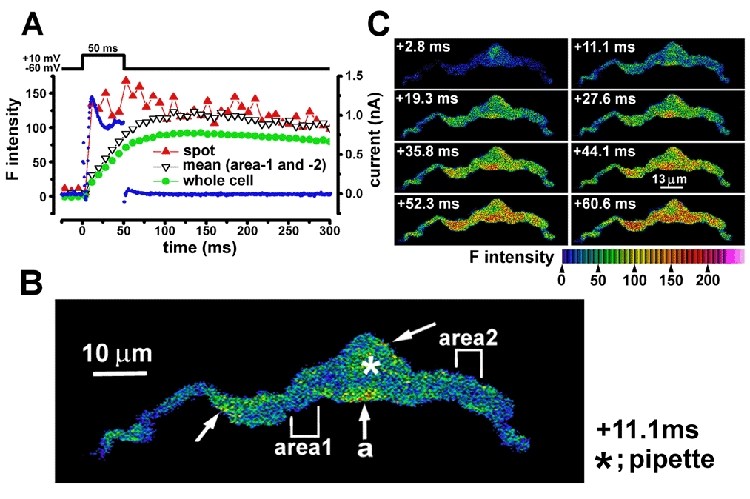
In A the cell was voltage clamped and stepped from a holding potential of -60 to +10 mV for 50 ms once every 30 s. Changes in intracellular Ca2+ concentration ([Ca2+]) produced by the voltage step were monitored by fluo-3 fluorescence and shown as the F intensity in arbitrary intensity units (see colour bar). The averaged F intensity over the whole area of the cell and that in a Ca2+ hot spot (see below) are indicated by green circles and red triangles, respectively. The averaged F intensity in two subplasmalemma areas which did not include hot spots is indicated by reversed open triangles. Membrane current (blue dots) was simultaneously recorded. B, Ca2+ image in a cell 11.1 ms after stepping to +10 mV. The asterisk indicates the position of the tip of the recording pipette. The confocal plane through the cell was where the width of the cell was largest, approximately 2 μm from its lowest point. Three arrows indicate Ca2+ hot spots in the subplasmalemma area. F intensity was measured in a Ca2+ hot spot at the point indicated by an arrow as ‘a’ by recording from a small circular spot of 1.2 μm in the subplasmalemma area; the centre of the spot was < 1 μm from the cell edge. The F inTensity in spot ‘a’ was plotted against time in A (red triangles)F intensities in subplasmalemma areas 1 and 2 which did not include hot spots were also measured. In each area, four circular spots (1.2 μm in diameter) were placed side by side under the plasmalemma. The averaged F intensity was plotted against time in A (reversed open triangles). C, Ca2+ images were obtained about every 8 ms. The image obtained at +11.1 ms is the same one as shown in B.
It was found that the increase in fluorescence in these hot spots occurred over the same time course as outward current activation (see also Fig. 2). In contrast, F intensities in two subplasmalemma areas where hot spots did not occur (Fig. 1B, areas 1 and 2) increased slowly (Fig. 1A, open inverted triangles). Outward current declined to a steady level from its initial peak at +10 mV and was terminated by stepping back to -60 mV, but the F intensity in hot spots remained at a high level for over 300 ms subsequently. At +10 mV, the hot spots grew in size and spread along the plasmalemma (at 0.2-0.8 μm ms−1) and also spread, more slowly, into the centre of the cell (at 0.1-0.2 μm ms−1) during the first 20 ms of depolarization (Fig. 1; see also Figs 3 and 7). Eventually they coalesced. However, even at the end of 50 ms depolarization, the F intensity was not uniform in the cell. The cell started to contract approximately 500 ms after stepping to +10 mV and the contraction reached a maximum after about 1.5 s. The cell length was shortened to approximately 70 % by the first depolarizing pulse and recovered to approximately 80 % of the length before depolarization. Subsequent pulses once every 30 s induced smaller contractions by about 15 %, and recovery was to over 90 %, of that before depolarization. Figure 1 shows the results obtained in response to the second pulse. Although a similar tendency in the rate of shortening during repetitive stimulation was observed in eighteen vas deferens cells examined, the absolute values of shortening (%) varied widely from cell to cell.
Figure 2. Half-rise time of IK,Ca, hot spot F intensity and global F intensity.
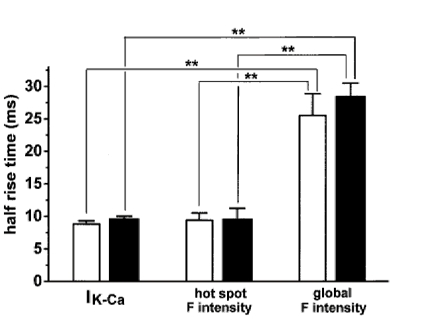
Cells were depolarized from -60 to 0 mV for 50 ms. Ca2+ images were obtained every 8.25 ms as shown in Fig. 1. The times required for 50 % activation (half-rise time) of IK,Ca and global F intensity were measured. The half-rise time of hot spot F intensity was determined from the line between two values just below and beyond 50 % of the maximum. □, vas deferens (n = 13); ▪, urinary bladder (n = 9). Statistical significance between mean values of the two groups was indicated by ** (P < 0.01).
Figure 3. Effects of Cd2+ on Ca2+ hot spots and IK,Ca in a vas deferens cell.
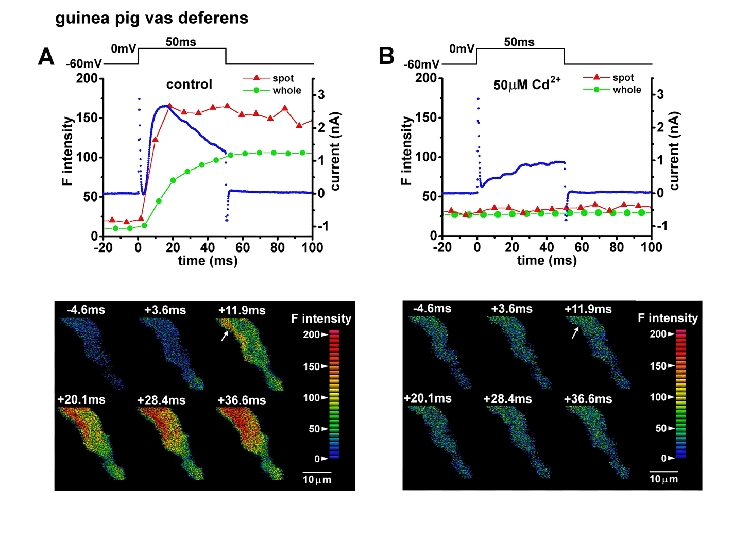
A cell was depolarized from -60 to 0 mV in the absence (A) and presence of 50 μm Cd2+ (B). The averaged F intensity in the hot spot which is indicated by the arrow (A, lower panel) and that over the whole image of the part of the cell in the frame (global F intensity) were measured from Ca2+ images in the same manner as shown in Fig. 1 and plotted against time. Red and green lines indicate hot spot and global F intensity. The blue dots indicate membrane current. Images in the lower panels were obtained at the times indicated correspondingly in the upper panels. Note that in the presence of 50 μm Cd2+ the depolarization induced neither hot spots nor IK,Ca. These two signals recovered after washout of Cd2+ (not shown).
Figure 7. Effects of caffeine on Ca2+ hot spots and IK,Ca in a vas deferens cell.
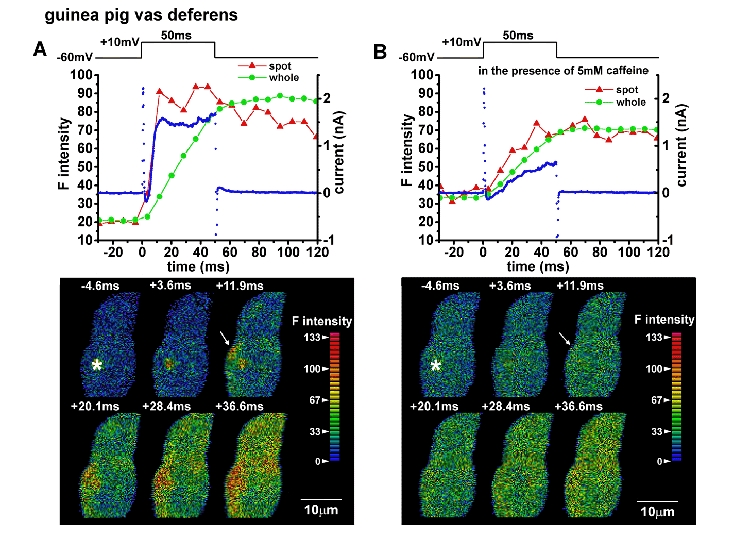
Caffeine was applied by increasing the concentration slowly up to 5 mm over 30 s to prevent a contraction. The cell was depolarized from -60 to +10 mV. A, before application of caffeine. B, 40 s after application of caffeine. Caffeine (5 mm) was present in the bathing solution. The averaged F intensities in a hot spot indicated by the arrow in the lower panel and that over the whole image of the part of the cell in the frame (global) were measured from Ca2+ images in the same manner as shown in Fig. 1 and plotted against time. Red and green lines indicate hot spot and global F intensity, respectively. The blue dots indicate membrane current. Images in the lower panels were obtained at the times indicated in the corresponding upper panels. Note that IK,Ca and Ca2+ hot spots were markedly reduced by caffeine.
An initial inward current through voltage-dependent Ca2+ channels (ICa) (about 100 pA at the peak, see also Fig. 8) and a subsequent large transient and smaller sustained outward current were seen when the cell was depolarized positive to -10 mV. Upon depolarization to 0 mV the transient outward current reached a peak within 20 ms of the start of the depolarization. Similar currents were observed in urinary bladder myocytes (Imaizumi et al. 1996b). The time to the peak of global F intensity at 0 mV over the whole image was 78.8 ± 6.0 ms in vas deferens cells (n = 18) and 63.5 ± 1.1 ms in urinary bladder cells (n = 13) but the outward current peaked within 15.0 ± 0.8 ms (n = 18) in vas deferens and 16.3 ± 0.8 ms (n = 13) in urinary bladder cells. The averaged peak amplitudes of outward current at 0 mV were 1.13 ± 0.12 and 1.25 ± 0.08 nA in vas deferens (n = 18) and urinary bladder (n = 13) myocytes, respectively. In all cells which had substantial ICa and IK,Ca at 0 mV, Ca2+ hot spots were observed (n > 20 for both vas deferens and urinary bladder cells). Figure 2 shows summarized results for the time required for 50 % activation of IK,Ca (half-rise time), hot spot F intensity and global F intensity when cells were depolarized from -60 to 0 mV for 50 ms. The half-rise time of hot spot F intensity was measured from the line connecting two values just below and beyond 50 %. Although this may not give an exact half-rise time, the error should be small (less than 4 ms). In both vas deferens and urinary bladder smooth muscle cells, the half-rise time of hot spot F intensity (9.41 ± 1.12 and 9.68 ± 1.56 ms, respectively) was not significantly different from that of IK,Ca (8.81 ± 0.50 and 9.71 ± 0.32 ms, respectively; P > 0.05 vs. hot spot F intensity), and was significantly shorter than the half-rise time of global F intensity (25.5 ± 3.4 and 28.6 ± 2.0 ms, respectively; P < 0.01 vs. both IK,Ca and hot spot F intensity). It is clear that the activation time course of IK,Ca is similar to that of hot spot F intensity and much faster than global F intensity.
Figure 8. Effects of cyclopiazonic acid (CPA) on membrane currents and Ca2+ hot spots.
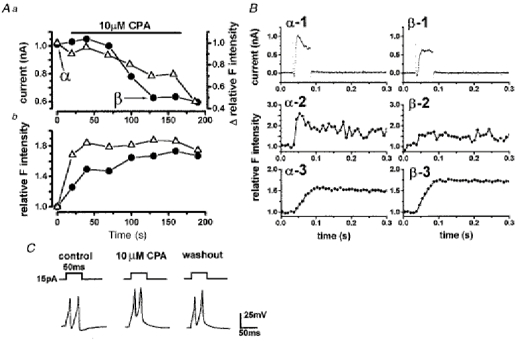
A a urinary bladder myocyte was stepped from -60 to 0 mV at the times indicated. Application of 10 μm CPA reduced both the outward current amplitude (circles) and the increase in F intensity (triangles) in a small area (a circle of 1.2 μm diameter) enclosing a hot spot evoked by depolarization (a). The Δ relative F intensity was obtained by taking the absolute value of the increase in intensity caused by depolarization in the hot spot just before the application of CPA as unity. The membrane current and F intensity measured at the times indicated by α and β are shown in B. In Ab, the changes of whole-cell basal F intensity (circles) at -60 mV and those of whole-cell peak F intensity during depolarization (triangles) were plotted on the same time course as in Aa. The basal or peak F intensity before the application of 10 μm CPA was taken as unity. B, membrane currents (1) and relative F intensity in a Ca2+ hot spot (2) and over the whole cell area (3) were recorded at the times indicated by α and β in Aa. The averaged intensity for 40 ms just before the application of a step pulse was taken as unity. Note that the increase in intensity during depolarization in the hot spot (β-2) was severely decreased and that over the whole cell area (β-3) was increased by application of CPA. Similar results were obtained in all cells examined (n = 5). C, effects of 10 μm CPA on action potential shape in single vas deferens myocytes. Action potentials were recorded before, about 3 min after the application of CPA and about 3 min after washout of CPA. The resting membrane potential was approximately -58 mV. Note that the amplitude and duration of the action potential at 50 % maximum size was increased and after-hyperpolarization was abolished by CPA. These effects of 10 μm CPA were reversed at least in part by washout.
Figure 3 shows the effects of 50 μm Cd2+ on Ca2+ images and membrane currents when a vas deferens myocyte was depolarized to 0 mV for 50 ms. ICa was completely blocked by 50 μm Cd2+. The F intensity in the hot spots indicated by the arrows in the lower two panels of Fig. 3 and that over the whole image was measured as in Fig. 1. The result shows that both the hot spots and most of the initial phasic outward current were triggered by Ca2+ entering the cell. The remaining outward current in the presence of Cd2+ was mainly delayed rectifier-type K+ current since it was gradually activated during depolarization, not affected by 1 mm TEA but markedly reduced by 20 mm TEA (not shown). The effects of Cd2+ were removed by washout. Similar results with 50-100 μm Cd2+ or 10 μm verapamil were obtained in three vas deferens cells and two urinary bladder cells.
The outward current, but not the hot spots, was inhibited by 1-2 mm TEA or 30-100 nm iberiotoxin (IbTX); the decreases in peak outward current by Cd2+, TEA or IbTX were 86 ± 5, 79 ± 6 and 67 ± 7 %, respectively, in vas deferens myocytes (n = 5, 8 and 5), which were similar to the decreases in urinary bladder myocytes (Imaizumi et al. 1996b). Addition of 10 mm EGTA to the pipette solution markedly reduced the outward current (n = 4). These results indicate that the major component of outward current is Ca2+-dependent K+ current (IK,Ca) through large-conductance K+ (BK) channels. This is evoked in the membrane probably over hot spots triggered by Ca2+ entering the cell through voltage-dependent Ca2+ channels. Although other voltage-dependent K+ currents were observed in these myocytes, their amplitude was approximately one-fourth of that of IK,Ca at +10 mV (see also Fig. 3B, at 0 mV in the presence of Cd2+).
Hot spot and IK,Ca during a small depolarization
If instead of stepping to +10 mV, a urinary bladder myocyte was depolarized to only -20 mV, the increase in hot spot Ca2+ fluorescence declined even during depolarization (Fig. 4) and was not maintained as it was following a pulse to 0 or +10 mV. Hot spot [Ca2+] declined with a time course similar to the decline in IK,Ca and global [Ca2+] subsequently rose only slightly. Thus, stepping to 0 mV exceeded the threshold for propagation of the Ca2+ signal from hot spots whereas stepping to -20 mV did not; in the latter case a substantial rise in [Ca2+] over the cell was not established by the coalescence of enlarging hot spots. However, the peak amplitude of outward current at -20 mV was 340 pA (approximately 35 % of that at 0 mV). The peak F intensity in the hot spot indicated by the arrow in Fig. 4B c was 125 a.i.u. When depolarized to 0 mV for 50 ms, the hot spot appeared exactly in the same place but spread over a large area (not shown). The maximum F intensity in the spot at 0 mV was 130 a.i.u. and comparable to that at -20 mV. A clear rise in [Ca2+] over a spot was not elicited by a lesser depolarization to -30 mV in this particular cell but was observed in two vas deferens cells out of six. Non-propagated Ca2+ hot spots at -20 mV were also observed in two urinary bladder cells out of three. When Ca2+ hot spots did not spread to other parts, a contraction was not evoked in any cells examined.
Figure 4. Ca2+ image and membrane current during depolarization to -20 mV in a single myocyte of guinea-pig urinary bladder.
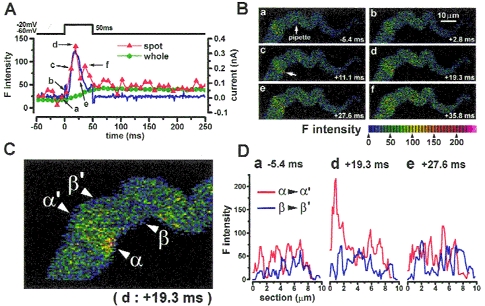
A, membrane potential of a cell stepped from -60 to -20 mV. Ca2+ current and subsequent transient outward current were observed (blue dots). Green circles indicate the averaged F intensity over the whole area of the cell. Red triangles indicate F intensity in a hot spot (a circle of 1.2 μm in diameter) in a subplasmalemma area at the position indicated by an arrow in Bc. The images were obtained at 6 different times as indicated (a-f) and are shown correspondingly in B and D. Transient outward current was activated with the same time course as the rise of [Ca2+] in the hot spot. Moreover, the increase in hot spot F intensity was also transient and decreased just after repolarization to a level slightly higher than that at rest. B, Ca2+ images obtained at the times shown in A. The recording pipette was placed at the centre of the cell, indicated by an arrow in a.C, the image shown in Bd (+19.3 ms) is enlarged. D, profiles of F intensity along two cross-sections indicated by the two sets of small triangles in C; α-α′ and β-β′ are plotted against the cell section (red and blue lines, respectively). Profiles in a, d and e were obtained from corresponding images in B. Zero corresponds to the position of the cell membrane. The line α-α′ was placed just on the centre of the hot spot and the line β-β′ was placed in a quiescent area. The peak of intensity in Dd indicates that the centre of the Ca2+ hot spot is located about 0.7 μm from the edge of the cell. In contrast, the intensity profile along line β-β′ showed only low-level fluctuations in [Ca2+]. In the presence of 0.1 mm Cd2+, both hot spots and IK,Ca were not observed on depolarization to -20 mV (not shown). Similar transient outward current and Ca2+ hot spots on depolarization to -20 mV were observed in all cells examined, 5 vas deferens and 3 urinary bladder myocytes.
When K+ currents were blocked by externally applied 20 mm TEA, the peak Ca2+ current (ICa) amplitudes at -20, 0 and +10 mV were, respectively, -58 ± 7, -471 ± 33 and -502 ± 37 pA (n = 10) in vas deferens myocytes and -37 ± 3, -348 ± 27 and -371 ± 34 pA (n = 11) in urinary bladder myocytes. It is notable that ICa amplitude at -20 mV was approximately one-ninth or one-tenth of that at 0 and +10 mV. ICa was blocked by 0.1 mm Cd2+. The activities of BK channels in outside-out patches were not affected markedly by the addition of 0.1-0.5 mm Cd2+ (not shown).
Hot spots were imaged in two dimensions and such analysis showed that they often arose within 1 μm of the cell membrane. Figure 4D shows the profile of F intensity in cross-sections along two lines on a hot spot indicated by α-α′ and on an adjacent quiescent area indicated by β-β’ in Fig. 4C. The centre of the hot spot was located 0.7 μm from a cell edge (Fig. 4D, +19.3 ms). The F intensity near the other cell edge on line α-α′, and that along the whole of line β-β′, was not changed markedly.
Subplasmalemma localization of Ca2+ hot spots
An important question about the depolarization-induced Ca2+ hot spots is whether they appear in the same place upon repeated depolarization. Figure 5 shows two sets of recordings of F intensity and IK,Ca evoked by depolarization to 0 mV in a urinary bladder myocyte. Two depolarizing pulses were applied at an interval of 30 s. To measure the F intensity, a circle of 1.2 μm diameter was placed on a hot spot (in the same manner as described in Fig. 1) located within < 1 μm of the cell membrane. The F intensity in the hot spot was measured in exactly the same place and in the same plane of the cell during each depolarization. Although contractions of the cell occurred in response to the depolarization, only the longitudinal ends of the myocytes moved slightly (shortened by approximately 15 %) and recovered almost completely after ∼15 s. The location of the hot spot was in the middle part of the cell and was not affected by the contraction. The chosen hot spot was the clearest one in this plane and appeared in the image obtained 11.1 ms after the start of depolarization. The time courses of hot spot F intensity and IK,Ca were very similar in the two recordings. Similar results indicating that discrete hot spots appear exactly in the same place upon repeated depolarization of each myocyte were obtained in five vas deferens and six urinary bladder myocytes. In these cells, relatively small contractions occurred at the ends of the cell but these did not prevent identification of the exact location of subplasmalemma hot spots during repetitive stimulation.
Figure 5. Repetitive stimulation elicited hot spots in the same places.
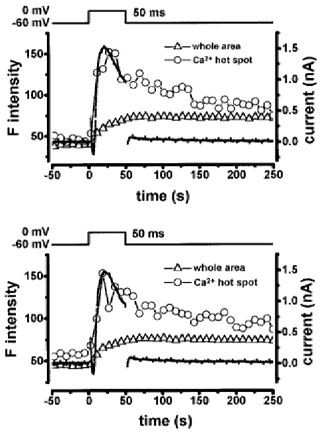
Two sets of recordings of F intensity and membrane currents obtained by two sequential depolarizations at an interval of 30 s. A urinary bladder myocyte was depolarized from -60 to 0 mV for 50 ms. Three subplasmalemmal hot spots were elicited in the confocal plane within the first 20 ms of depolarization. The time course of F intensity indicated by open circles was measured from the most clear hot spot, which was located just beneath the plasma membrane (< 1 μm) in the middle part of the cell. A circle (1.2 μm in diameter) was placed on the hot spot and the averaged F intensity was measured. The triangles indicate the averaged F intensity of the whole cell area. The dotted line indicates the membrane currents. Note that the time courses of F intensity in the hot spot and IK,Ca were comparable in the two sets of recordings.
In this study, a total of forty-three Ca2+ hot spots were observed in twelve vas deferens myocytes within 20 ms of depolarization from -60 to 0 mV (pulses applied at 0.03 Hz). The average number of hot spots in each cellular Ca2+ image obtained at 19.3 ms after the start of depolarization was 3.6. The rises in F intensity in hot spots had a similar time course. Figure 6 shows the distribution histogram of the distances between the centre of the hot spots and the edge of the cell membrane. It is notable that over 95 % of hot spots were observed in subplasmalemma areas (< 1.5 μm from the plasmalemma). Qualitatively similar results were obtained by analyses of Ca2+ images in urinary bladder myocytes depolarized from -60 to 0 mV for 50 ms. Among sixteen hot spots in five myocytes, eleven hot spots were located within 1 μm of the cell edge, four spots between 1 and 1.5 μm and one between 1.5 and 2 μm.
Figure 6. Location of hot spots from the cell edge.
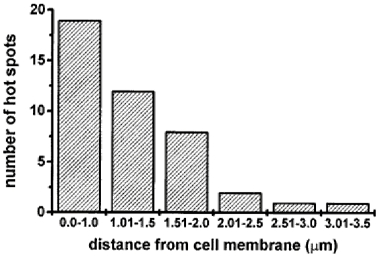
The number of hot spots observed within 20 ms of the step from -60 to 0 mV is shown against the distance between the centre of the hot spots and the closest part of the plasma membrane. The distance was measured from the profile of each hot spot as shown in Fig. 4D.
Effects of caffeine and cyclopiazonic acid on IK,Ca and hot spots
It has been suggested that the transient IK,Ca upon depolarization is elicited by Ca2+ influx triggering Ca2+ release (CICR) in smooth muscle cells (Ohya, Kitamura, Kuriyama, 1987; Sakai, Terada, Kitamura & Kuriyama, 1988; Bolton & Lim, 1989; Kitamura, Sakai, Kajioka & Kuriyama, 1989). IK,Ca was not only reduced markedly by 0.5 mm Cd2+ but also by 5 mm caffeine or 10 μm ryanodine. Similar results were obtained in several types of smooth muscle myocytes, including vas deferens (Imaizumi et al. 1996a, b). Figure 7 shows the effects of caffeine on Ca2+ images and membrane current in a vas deferens myocyte. When 5 mm caffeine was applied rapidly (< 2 s), a large transient increase in [Ca2+]i lasting a few seconds and a subsequent large contraction were observed (Imaizumi et al. 1996b). To prevent a contraction, the concentration of caffeine was slowly increased up to 5 mm over 30 s. The Ca2+ image and IK,Ca were obtained before the application (Fig. 7A) and also in the presence of caffeine (after 40 s from the start of application, Fig. 7B). The resting F intensity over the whole area in the presence of caffeine was slightly higher than that before application. After the application of caffeine, hot spots and the transient IK,Ca did not appear clearly during depolarization (Fig. 7B). The hot spot F intensity indicated by an arrow in the image at 11.9 ms (Fig. 7A, lower panel) was 90.8 a.i.u. and the F intensity in the same place at the corresponding time was decreased to 47.9 a.i.u. after the application of caffeine (Fig. 7B). Hot spots recovered after washout of caffeine (not shown) and the corresponding F intensity was 75.2 a.i.u. The amplitude of outward current at 12 ms was also decreased from 1.59 nA to almost zero by caffeine (Fig. 7) and recovered to 1.04 nA after washout (not shown). Similar results were obtained in three vas deferens cells and three urinary bladder cells. When 10 μm ryanodine was applied, both the amplitude of IK,Ca and the F intensity in Ca2+ hot spots decreased progressively with time (n = 2 for both vas deferens and urinary bladder).
In addition, 10 μm cyclopiazonic acid (CPA), a specific inhibitor of the endoplasmic/sarcoplasmic reticulum (ER/SR) Ca2+ pump (Goeger, Riley, Dorner & Cole, 1988; Seidler, Jona, Vegh & Martonosi, 1989) reduces IK,Ca without affecting single BK channel current and ICa (Suzuki, Muraki, Imaizumi & Watanabe, 1992). Figure 8A and B shows the effects of 10 μm CPA on F intensity and membrane currents during depolarization in vas deferens myocytes. Application of CPA reduced both the peak amplitude of IK,Ca and the increase in F intensity in a hot spot at 0 mV within a few minutes (Fig. 8Aa), presumably by depleting SR Ca2+ stores close under the membrane. In the presence of CPA, the resting F intensity at -60 mV increased by about 60 % and the peak F intensity at 0 mV over the whole cell area increased by about 80 % (Fig. 8Ab). Original recordings obtained at α and β (Fig. 8Aa) are shown in Fig. 8B. When CPA had taken effect, the increase in F intensity in a hot spot at 0 mV was much reduced (β-2 vs.α-2) but that over the whole cell area was rather larger than before (β-3 vs.α-3). Outward current was also reduced by about 45 %, presumably because IK,Ca was reduced (Fig. 8B, α-1 and β-1) (Suzuki et al. 1992). Corresponding to the decrease in IK,Ca upon depolarization, the rate of repolarization and the amplitude of after-hyperpolarization of evoked action potentials were markedly decreased after application of 10 μm CPA (Fig. 8C).
Ca2+ hot spots during an action potential
To clarify the physiological role of CICR from subplasmalemma SR, [Ca2+] images during an evoked action potential were obtained in a vas deferens myocyte (Fig. 9). The rise in global F intensity started when the membrane depolarized to -10 mV and reached a maximum at about 85 ms (75-105 ms; n = 3) later than the action potential peak (Fig. 9A, red circles). The maximum after-hyperpolarization was recorded 20-30 ms prior to the maximum F intensity over the whole image. At least four hot spots were observed in the subplasmalemma area (one of them is shown by an arrow at ‘a’ in Fig. 9C, +52.3 ms). The F intensity in the hot spot (Fig. 9B, red triangles) reached a maximum almost at the same time as the action potential peak and stayed at a high level for over 200 ms. The F intensity in a subplasmalemma area which did not include hot spots (Fig. 9C, +52.3 ms, ‘b’), increased more slowly (Fig. 9B green triangles). [Ca2+] images during action potentials were obtained in three vas deferens cells and two urinary bladder cells. Two to five hot spots were observed in the subplasmalemma area in all images of each cell examined during discharge of an action potential. The increase in F intensity in hot spots during an action potential was always 25-50 ms faster and larger than that in non-hot spot subplasmalemma areas.
Figure 9. Ca2+ images during an action potential in a vas deferens myocyte.
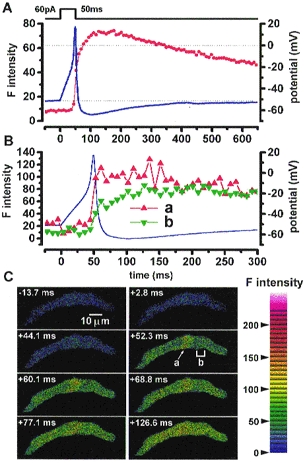
A, an action potential (blue line) was elicited by a current injection of 60 pA through the recording pipette under current clamp mode. The resting membrane potential, the peak of overshoot and after-hyperpolarization were -52, 18 and -66 mV, respectively. The F intensity over the whole cell area is indicated by red circles. The maximum rate of increase in F intensity was observed when action potential repolarization started. The peaks of after-hyperpolarization and F intensity were obtained approximately 50 and 100 ms after the action potential peaks, respectively. B, the action potential in A shown on a faster time scale with the F intensity at a Ca2+ hot spot (red triangles) and in a subplasmalemma area (green triangles) shown at a and b, respectively, in C (+52.3 ms). The F intensities in the hot spot ‘a’ and in the area ‘b’ were measured respectively in a circular spot (1.2 μm in diameter) and in four similar spots placed side by side. Note that Ca2+ hot spots appeared just before the upstroke of the action potential at a potential of approximately -20 mV. C, eight Ca2+ images were obtained at the times indicated, during an evoked action potential; note that as under voltage clamp, [Ca2+] rises first in hot spots, which then spread through the cell.
DISCUSSION
In the present study it is clearly shown that the rise of [Ca2+] during depolarization or the action potential does not occur uniformly immediately underneath the plasmalemma but appears as hot spots and spreads to other parts of the cell by growth and coalescence of these hot spots. The results indicate that Ca2+ hot spots are evoked by CICR from SR. The number of superficial hot spots which appear just after depolarization (< 20 ms) from -60 to 0 mV was variable from cell to cell. In one full confocal section of a cell, two to six superficial hot spots were observed (an average of 3.6 in 12 cells). Most of the Ca2+ hot spots (> 95 %) were located within 1.5 μm of the cell edge. Although the confocal plane was not always adjusted to the centre of the hot spots, this finding strongly suggests that Ca2+ hot spots are evoked by CICR from subplasmalemmal SR. The distance between SR and caveolae in plasmalemma has been reported to be occasionally as little as 10 nm (Gabella, 1981), which is apparently far beyond the resolution limit of the confocal microscope. Therefore, in this study, not the initiating but the somewhat spreading Ca2+ hot spots were detected even within the first 15 ms of the depolarization.
The size of hot spots was smaller than 2 μm in the first 20 ms of depolarization to 0 or +10 mV. If the thickness of a cell can be roughly assumed to be 5-10 μm, the total number of hot spots in a cell can be calculated as between five and twenty. This number might be considered to be unexpectedly small if the CICR mechanism is available in every subplasmalemma SR in smooth muscle (Villa, Podini, Panzeri, Söling, Volpe & Meldolesi, 1993). Functionally and/or spatially distinctive types of Ca2+ storage sites have, however, been suggested in smooth muscle cells (Iino, Kobayashi & Endo, 1988; Tribe, Borin & Blaustein, 1994; Golovina & Blaustein, 1997). Of importance is that subplasmalemmal SR, which may be presumed to be the main contributor to IK,Ca activation and action potential repolarization, is rather sparsely distributed in these smooth muscle cells. Assuming ten Ca2+ hot spots in a cell and a peak IK,Ca amplitude of 1.5 nA at 0 mV, each hot spot activates 150 pA IK,Ca.
Ca2+ hot spots activated by a 50 ms step positive to 0 mV lasted for over half a second, whereas those elicited at -20 mV were transient. In the former case hot spots spread to neighbouring areas preferentially along the cell membrane (Figs 1C, 3A and 7A). Although the spread of a hot spot to the centre of a cell was also observed, the spread was slower than along the long axis of the cell. The increase in global [Ca2+] elicited by 50 ms depolarization to 0 mV reached a peak 60-100 ms after the start of depolarization, indicating that the spread of Ca2+ hot spots continued even after most voltage-dependent Ca2+ channels closed. This supports the contention that CICR, which is initiated in the subplasmalemma area from a small number of hot spots, spreads to Ca2+ release sites deep inside (Fig. 10, DSR) in this type of smooth muscle cell.
Figure 10. Schematic diagrams for the mechanism of Ca2+ hot spots in subplasmalemma Ca2+ storage sites (superficial sarcoplasmic reticulum) for their contribution to IK,Ca and action potential shape.
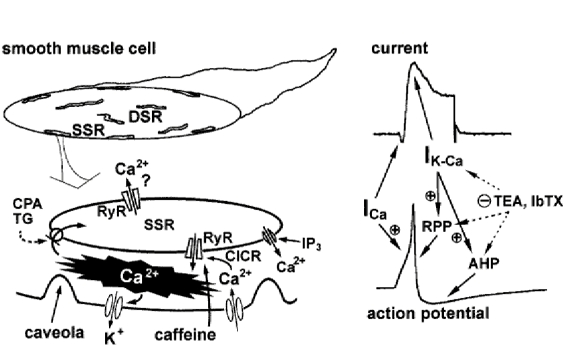
Abbreviations not already defined in the text are: SSR, superficial sarcoplasmic reticulum; DSR, sarcoplasmic reticulum deep inside; RPP, repolarization phase of an action potential; AHP, after-hyperpolarization; TG, thapsigargin; IP3, inositol 1,4,5-trisphosphate.
The discrepancy that IK,Ca activation upon depolarization is faster than the rise of [Ca2+] monitored by Ca2+ indicators over the whole (or a substantial part) of the cell area (Stehno-Bittle & Sturek, 1992; Ganitkevich & Isenberg, 1996; Imaizumi et al. 1996a) is completely resolved by this study. In this study, the rise of [Ca2+] in superficial hot spots during depolarization occurred with the same time course as the activation of IK,Ca (Fig. 2). Since treatment with caffeine (Fig. 7), CPA (Fig. 8) or ryanodine markedly reduced both the transient IK,Ca and the rapid rise of [Ca2+] in hot spots upon depolarization, the large transient IK,Ca is due to activation of BK channels, presumably near superficial hot spots, and the primary initiating event is CICR triggered by Ca2+ influx through voltage-dependent Ca2+ channels (Fig. 10).
It is possible that Ca2+ influx through voltage-dependent Ca2+ channels near the hot spot results in the accumulation of Ca2+ in the narrow space between superficial SR and plasma membrane. This may therefore suggest that CICR is not involved in the formation of a hot spot and that the superficial SR simply acts as a barrier to Ca2+ diffusion (Van Breemen, Chen & Laher, 1995; Yoshikawa, Van Breemen & Isenberg, 1996). This is, however, very unlikely since [Ca2+] in a hot spot during depolarization to -20 mV reached a maximum within 25 ms and thereafter declined during depolarization. If a simple barrier was the cause, Ca2+ accumulation should increase throughout the depolarization period. Moreover, the peak ICa at -20 mV was only one-ninth of that at 0 mV even though the increase in [Ca2+] in hot spots was comparable, suggesting that Ca2+ release in a hot spot occurs in an all-or-none manner. Alternatively, [Ca2+] in a hot spot may be higher than that measurable by fluo-3 due to the dye saturating over 10 μm (Minta, Kao & Tsien, 1989). Application of caffeine, CPA or ryanodine abolished or almost abolished Ca2+ hot spots during depolarization. The amount of stored Ca2+ may be substantially reduced by these compounds. The abolition of Ca2+ hot spots cannot be explained simply by the decrease in Ca2+ influx by Ca2+-dependent inactivation of Ca2+ channels (for example, ∼30 % decrease by CPA; Yoshikawa et al. 1996). In the present study, substantial ICa was recorded in the presence of these compounds. These results strongly support the assumption that Ca2+ hot spots are evoked via CICR.
Spontaneous quantal Ca2+ release from the SR has been detected in cardiac myocytes as a Ca2+‘spark’, which is considered to be the elementary event of E-C coupling (Cheng, Lederer & Cannell, 1993; Cannell, Cheng & Lederer, 1995; López-López, Shacklock, Balke & Wier, 1995; Cheng et al. 1996). Similar Ca2+ sparks have been detected in smooth muscle cells (Nelson et al. 1995; Mironneau, Arnaudeau, Macrez-Lepretre & Boittin, 1996; Gordienko, Bolton & Cannell, 1998). In isolated but not voltage-clamped myocytes of the longitudinal muscle of the guinea-pig small intestine, several sites were identified which discharged Ca2+ sparks (Gordienko et al. 1998). These sites were termed ‘frequent discharge sites’ (FDS) and it was suggested that they represented aggregations of SR; FDS were commonly but not invariably superficially situated in the cell. It is feasible that FDS and hot spots represent the same aggregations of SR. Ca2+ sparks in smooth muscle can give rise to spontaneous transient outward currents (STOCs; Benham & Bolton, 1986; Nelson et al. 1995) which are abolished by caffeine (Bolton & Lim, 1989; see as a review, Bolton & Imaizumi, 1996). Activation of BK channels by spontaneous Ca2+ release from the SR has been demonstrated in isolated membrane patches, indicating close contact of a part of the SR to the cell membrane (Xiong, Kitamura & Kuriyama, 1992). In the present study, spontaneous Ca2+ sparks at a holding potential of -60 mV were detected in only four cells out of about forty cells and were not examined further. The initial size of hot spots, 1-2 μm (Fig. 4Dd), is similar to that of sparks in cardiac (Cheng et al. 1993) and smooth muscle (Nelson et al. 1995; Gordienko et al. 1998). Higher resolution analysis of the spread of the calcium wave (Gordienko et al. 1998) makes it likely that, as in cardiac cells, the enlargement and coalescence of hot spots represent the stochastic discharge of multiple sparks giving rise to a spreading wave of calcium (Cannell, Cheng & Lederer, 1994; Cheng, Lederer, Lederer & Cannell, 1996); Ca2+ entering the cell initially triggers the opening of ryanodine receptors (RyRs) and at some critical level of Ca2+ release from these, further CICR from adjacent SR Ca2+ release channels is evoked.
It is particularly noteworthy that hot spots occurred in the early phase of an action potential. The rise of [Ca2+] in hot spots started around -25 mV during current injection, markedly increased during the action potential upstroke, and reached a peak near the peak potential. This local Ca2+ release from superficial SR via CICR activates IK,Ca, which is one of the major currents contributing to repolarization and after-hyperpolarization, and also spreads over the whole cell to induce a contraction. Moreover, IK,Ca activation by hot spots at near -30 mV delays initiation of the action potential. These findings are consistent with the observation that spontaneous action potential firing in smooth muscle cells is enhanced by charybdotoxin and CPA (Uyama, Imaizumi & Watanabe, 1993). The large contribution of IK,Ca activated by superficial CICR to the negative feedback of membrane excitability and/or the regulation of action potential shape is characteristic of smooth muscle cells (Imaizumi et al. 1996a). Although the regulation of membrane excitability by CICR from SR/ER via activation of IK,Ca has been reported in some neurons (Kuba, 1994; Yoshizaki et al. 1995; Cohen, Moore, Bangalore, Jafri, Weinreich & Kao, 1997), high time-resolution spatial analyses of Ca2+ release from the SR/ER have not yet been done.
In conclusion, CICR from discrete subplasmalemma SR in smooth muscle cells is a critical step in initiating and regulating E-C coupling and exerts an important repolarizing influence on the cell via activation of IK,Ca.
Acknowledgments
We thank Dr Wayne Giles (University of Calgary) for providing the data acquisition and analysis program for the IBM-AT. M. Watanabe and Y. Imaizumi are supported by a Grant-in-Aid for Scientific Research on Priority Areas No. 09273101 from the Japanese Ministry of Education, Science, Sports and Culture. T. B. Bolton is supported by the Medical Research Council of the UK and The Wellcome Trust.
References
- Benham CD, Bolton TB. Spontaneous transient outward currents in single visceral and vascular smooth muscle cells of the rabbit. Journal of Physiology. 1986;281:385–406. doi: 10.1113/jphysiol.1986.sp016333. [DOI] [PMC free article] [PubMed] [Google Scholar]
- Bolton TB, Imaizumi Y. Spontaneous transient outward currents in smooth muscle cells. Cell Calcium. 1996;20:141–152. doi: 10.1016/s0143-4160(96)90103-7. [DOI] [PubMed] [Google Scholar]
- Bolton TB, Lim SP. Properties of calcium stores and transient outward currents in single smooth muscle cells of rabbit intestine. Journal of Physiology. 1989;409:385–401. doi: 10.1113/jphysiol.1989.sp017504. [DOI] [PMC free article] [PubMed] [Google Scholar]
- Cannell MB, Cheng H, Lederer WJ. Spatial non-uniformities in [Ca2+]i during excitation-contraction coupling in cardiac myocytes. Biophysical Journal. 1994;67:1942–1956. doi: 10.1016/S0006-3495(94)80677-0. [DOI] [PMC free article] [PubMed] [Google Scholar]
- Cannell MB, Cheng H, Lederer WJ. The control of calcium release in heart muscle. Science. 1995;268:1045–1049. doi: 10.1126/science.7754384. [DOI] [PubMed] [Google Scholar]
- Cheng H, Lederer WJ, Cannell MB. Calcium sparks: elementary events underlying excitation-contraction coupling in heart muscle. Science. 1993;262:740–744. doi: 10.1126/science.8235594. [DOI] [PubMed] [Google Scholar]
- Cheng H, Lederer MR, Lederer WJ, Cannell MB. Calcium sparks and [Ca2+]i waves in cardiac myocytes. American Journal of Physiology. 1996;270:C148–159. doi: 10.1152/ajpcell.1996.270.1.C148. [DOI] [PubMed] [Google Scholar]
- Cheng H, Lederer MR, Xiao RP, Gomez AM, Zhou YY, Ziman B, Spurgeon H, Lakatta EG, Lederer WJ. Excitation-contraction coupling in heart: new insights from Ca2+ sparks. Cell Calcium. 1996;20:129–140. doi: 10.1016/s0143-4160(96)90102-5. [DOI] [PubMed] [Google Scholar]
- Cohen AS, Moore KA, Bangalore R, Jafri MS, Weinreich D, Kao JP. Ca2+-induced Ca2+ release mediates Ca2+ transients evoked by single action potentials in rabbit vagal afferent neurones. Journal of Physiology. 1997;499:315–328. doi: 10.1113/jphysiol.1997.sp021929. [DOI] [PMC free article] [PubMed] [Google Scholar]
- Endo M. Calcium release from sarcoplasmic reticulum. Physiological Reviews. 1977;57:71–108. doi: 10.1152/physrev.1977.57.1.71. [DOI] [PubMed] [Google Scholar]
- Fabiato A. Simulated calcium current can both cause calcium loading and trigger calcium release from the sarcoplasmic reticulum of a skinned canine cardiac Purkinje cell. Journal of General Physiology. 1985;85:291–320. doi: 10.1085/jgp.85.2.291. 10.1085/jgp.85.2.291. [DOI] [PMC free article] [PubMed] [Google Scholar]
- Gabella G. Structure of smooth muscles. In: Bülbring AF, Jones AW, Tomita T, editors. Smooth Muscle: an Assessment of Current Knowledge. London, UK: Edward Arnold (Publishers) Ltd; 1981. pp. 1–46. [Google Scholar]
- Ganitkevich VY, Isenberg G. Contribution of Ca2+-induced Ca2+ release to the [Ca2+]i transients in myocytes from guinea-pig urinary bladder. Journal of Physiology. 1992;458:119–137. doi: 10.1113/jphysiol.1992.sp019409. [DOI] [PMC free article] [PubMed] [Google Scholar]
- Ganitkevich VY, Isenberg G. Efficacy of peak Ca2+ currents (ICa) as trigger of sarcoplasmic reticulum Ca2+ release in myocytes from the guinea-pig coronary artery. Journal of Physiology. 1995;484:287–306. doi: 10.1113/jphysiol.1995.sp020665. [DOI] [PMC free article] [PubMed] [Google Scholar]
- Ganitkevich VY, Isenberg G. Dissociation of subsarcolemmal from global cytosolic [Ca2+] in myocytes from guinea-pig coronary artery. Journal of Physiology. 1996;490:305–318. doi: 10.1113/jphysiol.1996.sp021145. [DOI] [PMC free article] [PubMed] [Google Scholar]
- Goeger DE, Riley RT, Dorner JW, Cole RJ. Cyclopiazonic acid inhibition of the Ca2+-transport ATPase in rat skeletal muscle sarcoplasmic reticulum vesicles. Biochemical Pharmacology. 1988;37:978–981. doi: 10.1016/0006-2952(88)90195-5. 10.1016/0006-2952(88)90195-5. [DOI] [PubMed] [Google Scholar]
- Golovina VA, Blaustein MP. Spatially and functionally distinct Ca2+ stores in sarcoplasmic and endoplasmic reticulum. Science. 1997;275:1643–1648. doi: 10.1126/science.275.5306.1643. 10.1126/science.275.5306.1643. [DOI] [PubMed] [Google Scholar]
- Gordienko DV, Bolton TB, Cannell MB. Variability in spontanous subcellular release in guinea-pig ileum smooth muscle cells. Journal of Physiology. 1998;507:707–720. doi: 10.1111/j.1469-7793.1998.707bs.x. [DOI] [PMC free article] [PubMed] [Google Scholar]
- Hamill OP, Marty A, Neher E, Sakmann B, Sigworth FJ. Improved patch-clamp techniques for high resolution current recording from cells and cell-free membrane patches. Pflügers Archiv. 1981;391:85–100. doi: 10.1007/BF00656997. [DOI] [PubMed] [Google Scholar]
- Herrmann-Frank A, Darling E, Meissner G. Functional characterization of the Ca2+-gated Ca2+ release channel of vascular smooth muscle sarcoplasmic reticulum. Pflügers Archiv. 1991;418:353–359. doi: 10.1007/BF00550873. [DOI] [PubMed] [Google Scholar]
- Iino M. Calcium-induced calcium release mechanism in guinea-pig taenia caeci. Journal of General Physiology. 1989;94:363–383. doi: 10.1085/jgp.94.2.363. [DOI] [PMC free article] [PubMed] [Google Scholar]
- Iino M, Kobayashi T, Endo M. Use of ryanodine for functional removal of the calcium store in smooth muscle cells of the guinea-pig. Biochemical and Biophysical Research Communications. 1988;152:417–422. doi: 10.1016/s0006-291x(88)80730-7. [DOI] [PubMed] [Google Scholar]
- Imaizumi Y, Henmi S, Nagano N, Muraki K, Watanabe M. Regulation of Ca-dependent K current and action potential shape by intracellular Ca storage sites in some types of smooth muscle cells. In: Bolton TB, Tomita T, editors. Smooth Muscle Excitation. UK: Academic Press; 1996a. pp. 337–354. [Google Scholar]
- Imaizumi Y, Henmi S, Uyama Y, Atsuki K, Torii Y, Ohizumi Y, Watanabe M. Characteristics of Ca2+ release for activation of K+ current and contractile system in some smooth muscles. American Journal of Physiology. 1996b;271:C772–782. doi: 10.1152/ajpcell.1996.271.3.C772. [DOI] [PubMed] [Google Scholar]
- Imaizumi Y, Muraki K, Watanabe M. Ionic currents in single smooth muscle cells from the ureter of the guinea-pig. Journal of Physiology. 1989;411:131–159. doi: 10.1113/jphysiol.1989.sp017565. [DOI] [PMC free article] [PubMed] [Google Scholar]
- Imaizumi Y, Torii Y, Ooi Y, Muraki K, Bolton TB, Watanabe M. Ca2+ imaging with a fast scanning confocal microscope during the action potential in smooth muscle cells. Biophysical Journal. 1997;72:A343. [Google Scholar]
- Kamishima T, McCarron JG. Depolarization-evoked increases in cytosolic calcium concentration in isolated smooth muscle cells of rat portal vein. Journal of Physiology. 1996;492:61–74. doi: 10.1113/jphysiol.1996.sp021289. [DOI] [PMC free article] [PubMed] [Google Scholar]
- Kitamura K, Sakai T, Kajioka S, Kuriyama H. Activation of the Ca dependent K channel by Ca released from the sarcoplasmic reticulum of mammalian smooth muscles. Biochimica et Biophysica Acta. 1989;48:S364–369. [PubMed] [Google Scholar]
- Kuba K. Ca2+-induced Ca2+ release in neurones. Japanese Journal of Physiology. 1994;44:613–650. doi: 10.2170/jjphysiol.44.613. [DOI] [PubMed] [Google Scholar]
- López-López JR, Shacklock PS, Balke CW, Wier WG. Local calcium transients triggered by single L-type calcium channel currents in cardiac cells. Science. 1995;268:1042–1045. doi: 10.1126/science.7754383. [DOI] [PubMed] [Google Scholar]
- Minta A, Kao JP, Tsien RY. Fluorescent indicators for cytosolic calcium based on rhodamine and fluorescein chromophores. Journal of Biological Chemistry. 1989;264:8171–8178. [PubMed] [Google Scholar]
- Mironneau J, Arnaudeau S, Macrez-Lepretre N, Boittin FX. Ca2+ sparks and Ca2+ waves activate different Ca2+-dependent ion channels in single myocytes from rat portal vein. Cell Calcium. 1996;20:153–160. doi: 10.1016/s0143-4160(96)90104-9. [DOI] [PubMed] [Google Scholar]
- Nelson MT, Cheng H, Rubart M, Santana LF, Bonev AD, Knot HJ, Lederer WJ. Relaxation of arterial smooth muscle by calcium sparks. Science. 1995;270:633–637. doi: 10.1126/science.270.5236.633. [DOI] [PubMed] [Google Scholar]
- Ohya Y, Kitamura K, Kuriyama H. Cellular calcium regulates outward currents in rabbit intestinal smooth muscle cell. American Journal of Physiology. 1987;252:C401–410. doi: 10.1152/ajpcell.1987.252.4.C401. [DOI] [PubMed] [Google Scholar]
- Sakai T, Terada K, Kitamura K, Kuriyama H. Ryanodine inhibits the Ca-dependent K current after depletion of Ca stored in smooth muscle cells of the rabbit ileal longitudinal muscle. British Journal of Pharmacology. 1988;95:1089–1100. doi: 10.1111/j.1476-5381.1988.tb11743.x. [DOI] [PMC free article] [PubMed] [Google Scholar]
- Seidler NW, Jona I, Vegh M, Martonosi A. Cyclopiazonic acid is a specific inhibitor of the Ca2+-ATPase of sarcoplasmic reticulum. Journal of Biological Chemistry. 1989;264:17816–17823. [PubMed] [Google Scholar]
- Somlyo AP, Somlyo AV. Signal transduction and regulation in smooth muscle. Nature. 1994;372:231–236. doi: 10.1038/372231a0. [DOI] [PubMed] [Google Scholar]
- Stehno-Bittel L, Sturek M. Spontaneous sarcoplasmic reticulum calcium release and extrusion from bovine, not porcine, coronary artery smooth muscle. Journal of Physiology. 1992;451:49–78. doi: 10.1113/jphysiol.1992.sp019153. [DOI] [PMC free article] [PubMed] [Google Scholar]
- Suzuki M, Muraki K, Imaizumi Y, Watanabe M. Cyclopiazonic acid, an inhibitor of sarcoplasmic reticulum Ca2+-pump, reduces Ca2+-dependent K+ current in smooth muscle cells. British Journal of Pharmacology. 1992;107:134–140. doi: 10.1111/j.1476-5381.1992.tb14475.x. [DOI] [PMC free article] [PubMed] [Google Scholar]
- Tribe RM, Borin ML, Blaustein MP. Functionally and spatially distinct Ca2+ stores are revealed in cultured vascular smooth muscle cells. Proceedings of the National Academy of Sciences of the USA. 1994;91:5908–5912. doi: 10.1073/pnas.91.13.5908. [DOI] [PMC free article] [PubMed] [Google Scholar]
- Uyama Y, Imaizumi Y, Watanabe M. Cyclopiazonic acid, an inhibitor of Ca2+-ATPase in sarcoplasmic reticulum, increases excitability in ileal smooth muscle. British Journal of Pharmacology. 1993;110:565–572. doi: 10.1111/j.1476-5381.1993.tb13848.x. [DOI] [PMC free article] [PubMed] [Google Scholar]
- Van Breemen C, Chen Q, Laher I. Superficial buffer barrier function of smooth muscle sarcoplasmic reticulum. Trends in Pharmacological Sciences. 1995;16:98–104. doi: 10.1016/s0165-6147(00)88990-7. [DOI] [PubMed] [Google Scholar]
- Villa A, Podini P, Panzeri MC, Soling HD, Volpe P, Meldolesi J. The endoplasmic-sarcoplasmic reticulum of smooth muscle: immunocytochemistry of vas deferens fibers reveals specialized subcompartments differently equipped for the control of Ca2+ homeostasis. Journal of Cell Biology. 1993;121:1041–1051. doi: 10.1083/jcb.121.5.1041. [DOI] [PMC free article] [PubMed] [Google Scholar]
- Xiong Z, Kitamura K, Kuriyama H. Evidence for contribution of Ca2+ storage sites on unitary K+ channel currents in inside-out membrane of rabbit portal vein. Pflügers Archiv. 1992;420:112–114. doi: 10.1007/BF00378651. [DOI] [PubMed] [Google Scholar]
- Xu L, Lai FA, Cohn A, Etter E, Guerrero A, Fay FS, Meissner G. Evidence for a Ca2+-gated ryanodine-sensitive Ca2+ release channel in visceral smooth muscle. Proceedings of the National Academy of Sciences of the USA. 1994;91:3294–3298. doi: 10.1073/pnas.91.8.3294. [DOI] [PMC free article] [PubMed] [Google Scholar]
- Yoshikawa A, Van Breemen C, Isenberg G. Buffering of plasmalemmal Ca2+ current by sarcoplasmic reticulum of guinea pig urinary bladder myocytes. American Journal of Physiology. 1996;271:C833–841. doi: 10.1152/ajpcell.1996.271.3.C833. [DOI] [PubMed] [Google Scholar]
- Yoshizaki K, Hoshino T, Sato M, Koyano H, Nohmi M, Hua SY, Kuba K. Ca2+-induced Ca2+ release and its activation in response to a single action potential in rabbit otic ganglion cells. The Journal of Physiology. 1995;486:177–187. doi: 10.1113/jphysiol.1995.sp020801. [DOI] [PMC free article] [PubMed] [Google Scholar]
- Zholos AV, Baidan LV, Shuba MF. Some properties of Ca2+-induced Ca2+ release mechanism in single visceral smooth muscle cell of the guinea-pig. Journal of Physiology. 1992;457:1–25. doi: 10.1113/jphysiol.1992.sp019362. [DOI] [PMC free article] [PubMed] [Google Scholar]


