

Abstract
The sensitivity of arterial chemoreceptor spike generation to reductions in excitability was examined using rat chemoreceptors in vitro. Axonal excitability was reduced by reducing extracellular sodium concentration ([Na+]o) by 10-40 % or by applying low doses of tetrodotoxin (TTX).
In normoxia and in hypoxia, an isosmotic reduction in [Na+]o caused a proportional decrease in single-fibre, spiking nerve activity. For a 20 % reduction in [Na+]o, nerve activity decreased to 54 ± 7 % of control in normoxia and 41 ± 5 % in hypoxia.
Low doses of TTX (25-50 nM) caused a similar decrease in spiking frequency, but this response was variable amongst fibres, with some fibres unaffected by TTX.
A reduction in [Na+]o by 20 % caused a slowing of conduction velocity, measured using an electrical stimulus delivered to an electrode placed in the carotid body. Threshold current for spike generation was increased by about 2·7 ± 1·4 %. Threshold current increased by 6·5 ± 3·7 % following a 40 % reduction in [Na+]o.
The spike generation process was modelled as a Poisson process in which depolarizing events summate and give rise to an action potential. The experimental data were best fitted to a high order process characterized by a large number of events and high event threshold.
This result is not consistent with depolarization events caused by episodic transmitter release, but suggests that afferent spike generation is an endogenous process in the afferent nerve fibres, perhaps linked to random channel activity or to thermal noise fluctuations.
It is well established that hypoxia stimulates carotid body chemoreceptors, leading to an increase in sinus nerve activity and a number of protective reflexes including arousal, increased breathing and increased blood pressure. The mechanism leading to spike initiation is unresolved, but is generally attributed to release of an excitatory transmitter from a cell (glomus cell) presynaptic to the nerve terminals, thereby causing a generator potential (Eyzaguirre & Nishi, 1974; Gonzalez et al. 1994). This theory received experimental support from a study employing microelectrode impalement of nerve terminals which showed random spontaneous depolarizing potentials (SDPs) that appeared to summate and to give rise to action potentials (APs) (Hayashida et al. 1980). Histograms of inter-event times for both SDPs and APs were exponentially distributed, suggesting that the pattern of SDPs may account for the pattern of nerve activity (Eyzaguirre & Koyano, 1965; Hayashida et al. 1980). An exponential inter-event histogram is consistent with a Poisson-type random process characterized by a constant probability of events in a given time period.
The purpose of the present study was to test the validity of the Poisson model by observing the effect of reductions in nerve excitability on the spike generation process. If events, like SDPs, are independent and summate to give rise to APs, then a reduction in nerve excitability will raise the summation requirements for AP generation, and reduce the AP frequency. Measurement of AP frequency before and after a reduction of excitability may be useful in defining the characteristics of the underlying process, i.e. the effective frequency of SDPs and threshold level. This was tested in experiments in which nerve excitability was reduced by reducing extracellular sodium concentration ([Na+]o) or by adding small doses of tetrodotoxin (TTX) to the superfusate. Our general hypothesis was that observed perturbations in spike frequency generation are consistent with those predicted by a Poisson process characterized by a low event probability and low threshold.
METHODS
Carotid body isolation and nerve recording
Carotid bodies were harvested from rats between 15 and 30 days of age using a technique previously described (Kholwadwala & Donnelly, 1992). Rats were anaesthetized by placement in a chamber with an atmosphere saturated with methoxyflurane vapour (Mallinckrodt Veterinary Inc., Mundelein, IL, USA). After deep anaesthetization, evidenced by slow breathing movements and an absence of volitional motor movements, the rats were removed from the chamber and decapitated. The region around the carotid bifurcation was rapidly removed and placed in chilled, oxygenated Ringer saline (mm): 120 NaCl, 3 KCl, 2.4 CaCl2, 1.3 MgCl2, 1 Na2HPO4, 1 MgSO4, 24 NaHCO3 and 10 glucose. Some experiments were undertaken on a more intact preparation in which the petrosal ganglion was harvested along with a portion of the glossopharyngeal nerve and carotid body (chemoreceptor complex). This preparation had not previously been developed for the rat carotid body, but was previously used in experiments on cat carotid body (Belmonte & Gallego, 1983). The carotid body or chemoreceptor complex was cleaned of the surrounding connective tissue and placed in oxygenated saline containing a dilute enzyme mixture (0.02 % collagenase and 0.01 % protease in Ringer solution, 27°C, 30 min) to aid in further cleaning. Following enzyme exposure, the carotid body was superfused (2.5 ml min−1) with Ringer solution at 32-34°C in a perfusion chamber mounted on the stage of an inverted microscope.
Single-fibre chemoreceptor afferent nerve activity was recorded using a suction pipette attached to the cut nerve ending, or, in the case of recording from the chemoreceptor complex, by extracellular recording from the soma of a petrosal neurone with projections to the carotid body. Single-axon nerve activity was discriminated (BAK DIS-1; BAK Electronics Inc., Rockville, MD, USA) and the number of APs was counted and recorded each second (TECMAR Labmaster; Labmaster Scientific Solutions Inc., Solon, OH, USA). The unit logic pulse also triggered a storage oscilloscope with pre-trigger display for viewing the entire waveform.
In some cases, it was desired to evoke an orthodromic spike using an electrical stimulus delivered to the carotid body tissue. The stimulus electrode placed in the carotid body was a 10 μm platinum wire, which was insulated in a glass pipette except for the tip. The stimulus pulse was delivered by an optically isolated constant current source (BSI-1, BAK Instruments), and current magnitude was an analog function of the D/A output.
Superfusate PO2 near the carotid body was monitored by a platinum wire electrode, which was covered with a butyl acetate membrane and polarized to -0.8 V. The O2 electrode was calibrated during superfusion with Ringer saline equilibrated with 21 % O2, 5 % CO2, balance N2 (PO2≈ 150 Torr), and with 5 % CO2, balance N2, with the addition of an oxygen scavenger (glucose oxidase, 10 μg ml−1) (PO2≈ 0 Torr). Osmolarity was measured with a Wescor model 5500 osmometer (Wescor Inc., Logan, UT, USA).
Experimental protocol
The perfusion system included four reservoirs, two bubbled with 21 % O2, 5 % CO2; one bubbled with 5 % CO2, balance N2; and one bubbled with 21 % O2, 5 % CO2, but containing a test solution. Most experiments employed a reduction in [Na+]o in which Na+ was replaced isosmotically with N-methyl-D-glucamine (NMDG), resulting in a 20-80 % decrease in reservoir Na+ concentration. The final perfusion solution was obtained by mixing two solutions from two reservoirs at equal flow rates. A reduction in Na+ concentration was initiated by switching the perfusate from normal to reduced Na+ and mixing the perfusate with an equal flow of normal saline. Hypoxia was initiated by switching from normal saline to the reservoir containing hypoxic saline and mixing at equal rates with normal or reduced Na+ saline. The resultant superfusate PO2 during hypoxic stimulation was about 80 Torr compared with 150 Torr during normoxic superfusion. In some experiments, a reduction in Na+ concentration was replaced by the addition of TTX. The reservoir normally containing reduced Na+ saline was replaced with one containing 50-100 nM TTX added to normal saline. In some experiments, an increase in osmolarity was tested by adding NMDG to one reservoir and NaCl to another reservoir for switching to hypertonic solutions with and without a change in Na+ concentration. Four experimental series were undertaken.
Series 1: dose-response effect of Na+ perturbation
Experiments were conducted under moderate hypoxia in order to provide a better frequency resolution to changes in spiking activity, which is slow (about 1 s−1) under normoxia. Spiking activity was stimulated by equal mixtures of normal saline and hypoxic saline. For 2 min periods, half the perfusate was switched from normal saline to saline containing 20, 40 and 80 % less Na+ resulting in a reduction of [Na+] by 10, 20 and 40 % in the perfusate chamber, respectively. In the opposite vein, the effect of an increase in extracellular [Na+] was tested by first increasing the perfusate osmolarity by 20 % (due to the addition of NMDG) and then switching to a solution of increased Na+ by replacing NMDG with NaCl.
Series 2: Na+ perturbation during normoxia and during hypoxia
Half the perfusate was switched for 2 min from normal saline to saline containing a 40 % reduction in [Na+]. This switch was undertaken during normoxic perfusion and during hypoxic perfusion after obtaining a steady state in nerve activity.
Series 3: effect of TTX administration during normoxia and during hypoxia
Half the perfusate was switched for 2 min from a normal reservoir to a reservoir containing TTX (50-100 nM). This switch was undertaken during normoxic perfusion and during hypoxic perfusion after obtaining a steady state in nerve activity.
Series 4: orthodromic electrical stimulation for the estimation of nerve excitability
Recordings of afferent nerve activity were obtained from an extracellular electrode positioned in the petrosal ganglion and a single, constant current, cathodal electrical stimulus (0.1 ms duration) was delivered through an electrode positioned in the carotid body. The minimum stimulus intensity to evoke an orthodromic spike was measured and the range of currents during the experimental period was set above and below the minimum effective current. Stimuli were delivered at 2 s−1 and automatically increased in amplitude by 0.5-5 μA (pCLAMP 6, Axon Instruments), and the evoked voltage change at the extracellular electrode was recorded (20 kHz sample rate). Twenty trials were undertaken at each stimulus intensity and the results were averaged.
To test whether the evoked spikes were due to direct nerve stimulation or due to stimulation of presynaptic elements, the effect of cobalt was examined. Cobalt (an inorganic calcium channel blocking agent) has previously been shown to block hypoxia-evoked catecholamine secretion and hypoxia-evoked increases in afferent nerve activity (Donnelly & Kholwadwala, 1992). The response to increasing stimulus pulses was tested before, during and following addition of 2 mM cobalt to the perfusate. Since cobalt forms a precipitate in Ringer saline, these experiments were undertaken in Hepes-buffered saline (mM): 140 NaCl, 3 KCl, 2 CaCl2, 8.8 glucose and 10 Hepes, pH 7.35 at 34°C, bubbled with room air. Using bicarbonate-buffered saline, the effect of a decrease in [Na+]o on the evoked response was tested before, during and following 20 and 40 % reductions in [Na+]o.
Data analysis
Spike discharge frequency was quantified as a 10 s average during a period prior to switching to a reduced Na+ saline and immediately prior to the increase in spiking frequency following re-perfusion with normal Na+ saline. The significance of changes in spiking frequency was established using Student's paired t test with significance established at P < 0.05. Conduction time was calculated from the start of the stimulus artefact to the peak of the evoked spike waveform. Threshold stimulus current values were measured at the point at which two successes out of twenty trials were observed. All population data are expressed as means ±s.e.m.
RESULTS
Series 1: dose-response effect of Na+ perturbation
Spiking activity was highly sensitive to isosmotic reductions in extracellular (Na+o) concentration. A 10 % reduction in [Na+]o caused nerve activity to fall to 57 ± 9 % of control discharge frequency (n = 5; Fig. 1). Further reductions in [Na+]o caused a further reduction in nerve activity, to 43 ± 7.4 and 7.0 ± 2.1 % for reductions in [Na+]o by 20 and 40 %, respectively (Fig. 1). In order to test whether an increase in [Na+]o resulted in an increase in nerve activity, the perfusate was initially switched to a saline containing a 20 % increase in osmolarity due to addition of NMDG. An increase in osmolarity significantly decreased nerve activity (Fig. 2; P < 0.001, n = 4), a response previously observed by Gallego & Belmonte (1979) using perfused cat carotid bodies. An increase in [Na+]o at the same level of increased osmolarity returned activity to control levels (P= 0.8) (Fig. 2); however, the statistical test for the increase in nerve activity fell slightly below the significance level (P= 0.072) despite all fibres showing an increase in spiking activity. This was probably due to the small number of observations.
Figure 1. Dose-response relationship between chemoreceptor activity and reductions in extra.
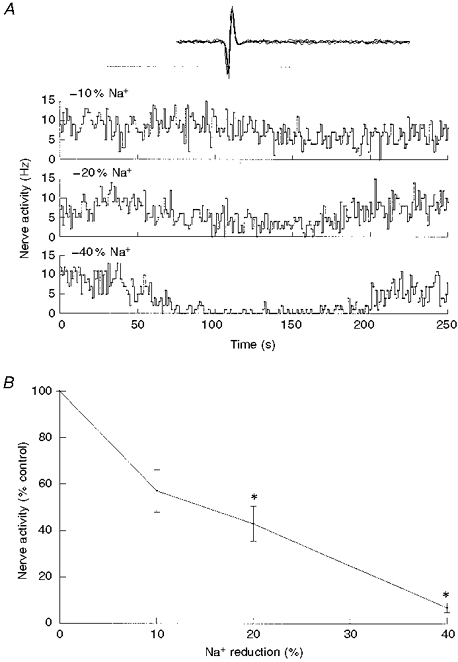
cellular Na+ concentrationA, single-fibre nerve activity before, during and following a 2 min perfusion with reduced Na+ saline, indicated by the bar. Top trace, isosmotic switching from 140 to 126 mM Na+o; middle, 140 to 112 mM Na+o; bottom, 140 to 84 mM Na+o. Inset (here and in subsequent figures), oscillographic tracing of superimposed action potentials triggered by the discriminator output. Total sweep was 10 ms. B, single-fibre nerve activity and activity at the end of switching to reduced Na+ saline (means ±s.e.m.), expressed as a percentage of control discharge frequency. Spiking activity was significantly reduced (*P < 0.05) during 20 and 40 % reductions in [Na+]o (n = 5).
Figure 2. Effect of hyperosmolarity on chemoreceptor discharge activity.
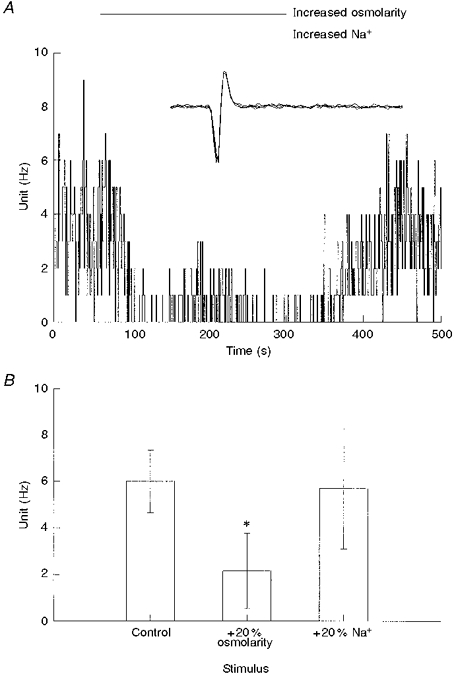
A, single-fibre nerve activity following an increase in perfusate osmolarity from 297 to 330 mosmol l−1, caused by the addition of NMDG to the saline (upper bar). Replacement of NMDG with Na+ resulted in an increase in perfusate [Na+] without further change in osmolarity (lower bar). B, single-fibre nerve activity (means ±s.e.m.) from 4 carotid bodies, before (Control) and following switching of the perfusate to hyperosmolar saline at constant [Na+] (+20 % osmolarity), and hyperosmolar saline at increased [Na+] (+20 % Na+). The increase in osmolarity significantly decreased frequency compared with control (* P < 0.001, n = 4), but frequency was not different from control following an isosmotic increase in [Na+]o (P= 0.8).
Series 2: Na+ perturbation during normoxia and during hypoxia
In order to determine whether the responses were quantitatively similar in normoxia and hypoxia, the response to a 20 % reduction in [Na+]o was tested in each condition. The 20 % value was selected because it produced an approximately half-maximal reduction in discharge frequency (Fig. 1). During normoxia, this reduction in [Na+]o caused nerve activity to decrease from 1.64 ± 0.38 to 0.75 ± 0.15 Hz (P < 0.01, n = 19). During hypoxia, this reduction in [Na+]o caused nerve activity to decrease from 11.7 ± 1.3 to 4.6 ± 0.7 Hz (P < 0.001). When normalized to control spiking activity, a decrease in [Na+]o caused nerve activity to decrease to 0.4-0.5 of control and the magnitude of decrease was not significantly different between normoxia and hypoxia (Fig. 3).
Figure 3. Effect of a reduction in [Na+]o on nerve activity in normoxia and hypoxia.
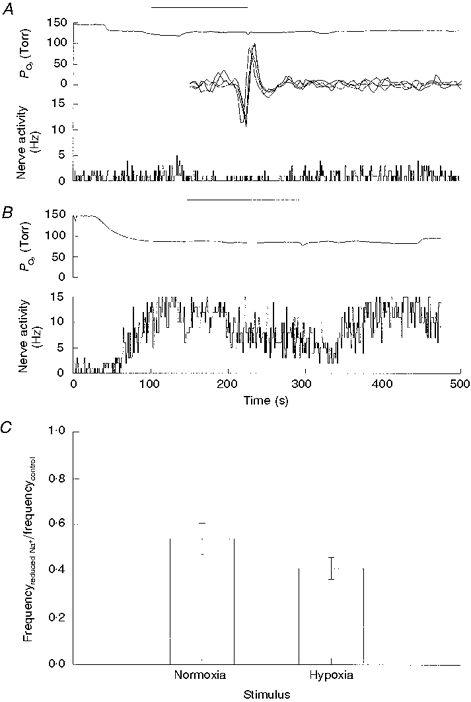
A, perfusate PO2 and nerve activity before, during and following a 2 min perfusion with an isotonic solution containing a 20 % reduction in [Na+]o, as indicated by the bar. B, same as A but perfusate was moderately hypoxic. C, ratio of nerve activities (means ±s.e.m.) before Na+ and following switching to a reduced Na+ saline. A reduction in [Na+]o by 20 % caused a significant decrease in discharge frequency during normoxia (P < 0.01, n = 19) and during hypoxia (P < 0.001, n = 19).
Series 3: effect of TTX administration during normoxia and during hypoxia
Given that a decrease in [Na+]o caused a decrease in nerve activity, we addressed whether the decrease in spiking would also occur with the Na+ channel blocker tetrodotoxin. Addition of TTX (25-50 nM) to the perfusate for 2 min caused a reduction in spiking rate in six fibres and caused no change in eight fibres. For the six fibres which responded to TTX, spiking rates during normoxia decreased from 1.4 ± 0.4 to 0.8 ± 0.2 Hz. In hypoxia, TTX caused nerve discharge to decrease from 11.0 ± 1.5 to 4.3 ± 0.7 Hz (P < 0.01, n = 6) (Fig. 4). In the eight fibres in which TTX had no apparent effect it was unclear whether this was due to permeation difficulties of TTX or due to TTX-resistant Na+ channels.
Figure 4. Effect of addition of TTX to the perfusate on nerve activity in normoxia and hypoxia.
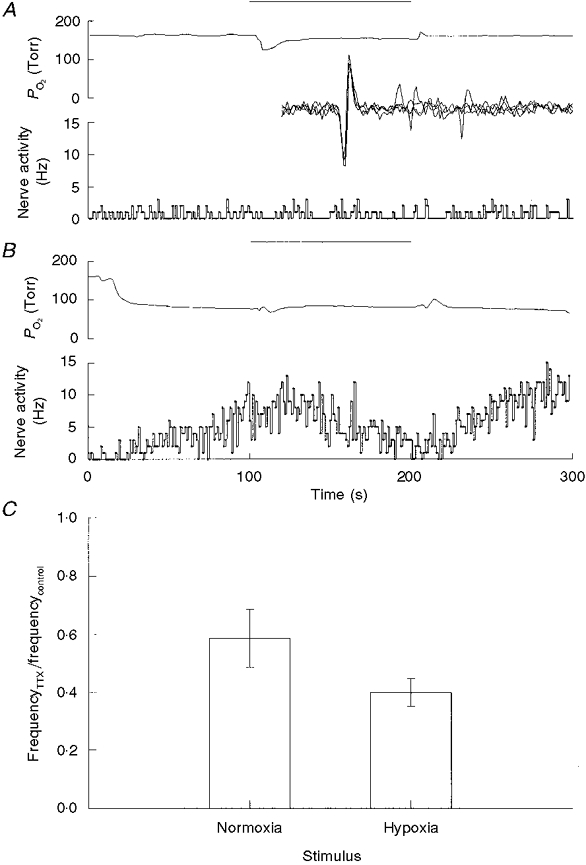
A, perfusate PO2 and nerve activity before, during and following a 2 min perfusion with saline containing 25 nM TTX (bar). Inset, oscillographic tracing of recorded action potential triggered by the unit pulse. Sweep length was 10 ms. B, same as A but perfusate was moderately hypoxic. C, ratio of nerve activities (means ±s.e.m.) measured following addition of TTX and before addition of TTX (control). TTX caused a significant reduction in discharge frequency during normoxia (P < 0.05, n = 6) and during hypoxia (P < 0.01, n = 6).
Series 4: orthodromic electrical stimulation for the estimation of nerve excitability
Constant current cathodal stimulation of the nerve terminals within the carotid body resulted in the orthodromic activation of nerve action potentials. This was probably due to a direct activation of the nerve terminals rather than the presynaptic element, since addition of cobalt did not block the evoked spike. The same dose of cobalt ablates the nerve response to hypoxia, suggesting a loss of stimulus secretion coupling in the presence of cobalt (Donnelly & Kholwadwala, 1992). Thus, if the electrical stimulus was evoking nerve activity through a presynaptic mechanism, then it should have been ablated in the presence of cobalt, but this did not occur.
Conduction time, measured from the stimulus artefact to the evoked action potential, ranged from 3.40 to 7.55 ms. The conduction distance was approximately 2 mm, resulting in an estimated conduction velocity of 0.26-0.58 m s−1 for the current sample of chemoreceptor afferents. This suggests that all the fibres in the sample were C fibres. Cobalt increased conduction time. For the example shown in Fig. 5, this increase was from 5.05 to 5.85 ms, and for the population this increase was to 119 % of control (Fig. 7).
Figure 5. Electrically evoked action potentials are not blocked by cobalt.
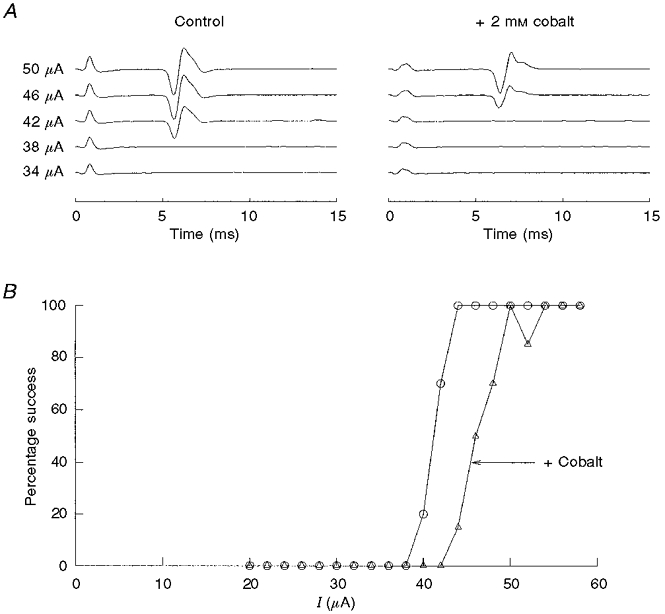
A, somal action potential activity following a current stimulus delivered to the carotid body. Each sweep is an average of 20 trials and is shown with increasing stimulus intensity. Stimulus artefact is apparent near 0.4 ms, and the evoked action potential is apparent near 5-6 ms. Addition of cobalt slowed the conduction time from 5.05 to 5.85 ms. B, the ordinate is the percentage of successfully evoked spikes based on the average, post-stimulus potential change for one preparation. Cobalt (▵) increased the stimulus threshold compared with control (○), but did not block the evoked spike.
Figure 7. Population responses to addition of cobalt and reductions in lsqb;Na+]o.
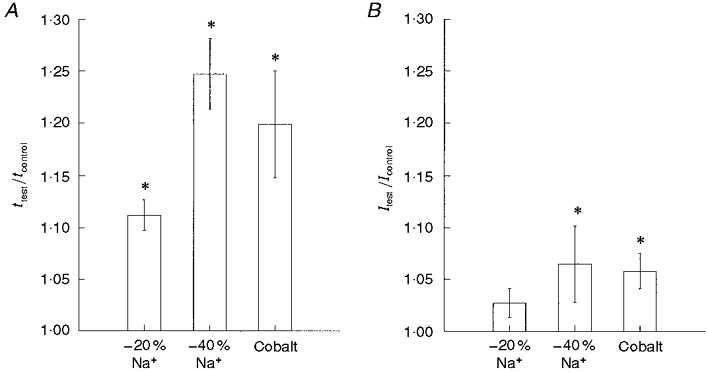
A, addition of cobalt (2 mM) and reductions in [Na+]o slowed conduction time (t). B, cobalt and decreased [Na+] increased the threshold current for orthodromically evoked spikes. Data are normalized to the conduction time and threshold current value measured prior to switching to the test solution. * Significantly different from control measure.
A reduction of [Na+]o caused a significant reduction in conduction velocity. Following a 20 % reduction in [Na+]o, conduction time significantly increased by about 12 % (Fig. 7). A 40 % reduction in [Na+]o caused an increase in conduction time of about 24 % (Figs 6 and 7). In comparison, the effects of [Na+]o reduction on excitability were smaller. On average, a 20 % reduction in [Na+]o caused a 2.7 ± 1.4 % increase in stimulus threshold (Fig. 7), and a 40 % reduction in [Na+]o caused threshold current to increase by 6.5 ± 3.7 % (Figs 6 and 7).
Figure 6. A reduction in [Na+]o slows conduction velocity and enhances the threshold for orthodromic spike generation.
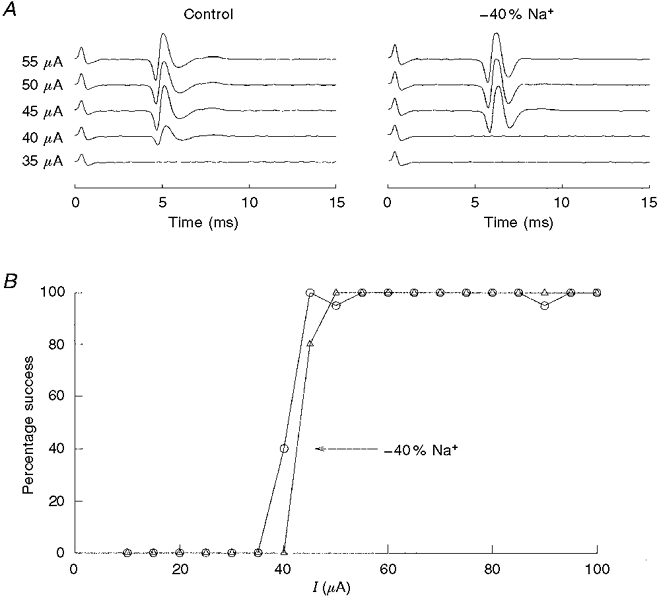
A, somal action potential activity following a current stimulus delivered to the carotid body. Each sweep is an average of 20 trials and is shown with increasing stimulus intensity. A 40 % reduction in [Na+]o slowed conduction time from 4.00 to 5.10 ms. Both records were recorded at the same gain. B, the ordinate is the negative voltage deflection of the evoked spike as a function of stimulus intensity. In this case, a reduction in [Na+]o by 40 % (▵) caused an increase in threshold current of approximately 12 % (5/40 μA) compared with control (○).
DISCUSSION
This is the first study to examine the effects of small isosmotic perturbations in extracellular Na+ on chemoreceptor afferent activity. The primary conclusion from this work is that the chemoreceptor afferent spike is generated by a process that is highly sensitive to changes in Na+ or Na+ current, such that a 20 % decrease in [Na+]o results in about a 50 % reduction in spiking activity. Outside of the implication of this observation on the mechanism of spike generation, the observation may be important in understanding physiological variability in the peripheral chemoreceptor contribution to ventilation. The normal range of serum [Na+] variability is about 8 % (10 mm) (Johnson, 1993), which may be reflected in a 30-40 % variability in chemoreceptor spiking activity, based on the sensitivity of the spike generator process to changes in Na+, as shown in Fig. 1. A linkage between Na+ gradient and hypoxia neural response was previously suggested based on experiments utilizing perfused cat carotid bodies in situ (Fitzgerald et al. 1989).
At present, it is unclear whether the Na+o effect is solely due to changes at the nerve fibres, as opposed to other cells within the carotid body. For instance, rabbit glomus cells possess fast, voltage-dependent Na+ currents which would also have been affected by manipulations in Na+ (Urena et al. 1989). However, unlike the rabbit, rat glomus cells have few or no fast Na+ channels (Fieber & McCleskey, 1993; Lopez-Lopez et al. 1997) and, since most of the present results using [Na+]o reduction could be replicated using low doses of TTX, the effect of [Na+]o reduction is probably mediated through axonal Na+ currents. Although changes in Na+ gradient may affect other processes that rely on the Na+ gradient, it is unlikely that the Na+ perturbations used in the present study would have any effect on these processes. Assuming an intracellular Na+ concentration of 12 mm, a 20 % reduction in extracellular [Na+] from 140 to 112 mm would cause only a 6 mV change in the Nernst potential for Na+ (64 to 58 mV), suggesting little effect on the electrochemical driving force for Na+ across a normally polarized cell membrane.
Two new experimental techniques employed in this study are the use of an intact rat carotid body-petrosal ganglion preparation and the use of a stimulating electrode within the carotid body to evoke an orthodromic spike. The intact rat ganglion-carotid body preparation follows from the work of Belmonte, who developed a similar preparation in the cat (Belmonte & Gallego, 1983). This preparation offers several advantages over the more conventional, carotid body/cut sinus nerve preparation which is stable and responsive for approximately 2-3 h and then degenerates (Iturriaga et al. 1991; Donnelly & Kholwadwala, 1992). With the intact ganglion, the nerve fibres appear to be better sustained and, although not part of this study, we have maintained a functional preparation for a period of 48-72 h in culture. Extracellular recordings from the soma also give an approximately 20-fold enhancement of the afferent signal due to the larger size of the soma compared with the axon; this not only allows for improved discrimination but also allows for nearby electrical stimulation without overloading the head stage of the recording electrode. This stimulus, applied within the carotid body, appeared to initiate a direct stimulation of the afferent fibres, since the orthodromic spike was not blocked by the addition of cobalt to the superfusate. Cobalt was previously shown to block the hypoxia-induced increase in afferent nerve activity, so it is reasonable to speculate that chemical transmission in the carotid body is blocked by cobalt (Donnelly & Kholwadwala, 1992).
Implications for a Poisson process
The chemoreceptor afferent train has been characterized as a Poisson-type random process, since the interspike interval distribution is exponential and there is little, if any, dependency between intervals (Eyzaguirre & Koyano, 1965; Nye & Powell, 1984; Niu et al. 1990; Donnelly, 1996). This characterization extends across species including rat, cat, goat and bird, and it follows that if the output is random, then the generator process must also be random.
One possible generator process was postulated by Hayashida & Eyzaguirre, who recorded SDPs in the afferent nerve fibre terminals (Hayashida et al. 1980). The SDPs appeared to summate and give rise to APs, and the distribution times of SDP occurrence showed the same exponential distribution, as did the occurrence times of afferent nerve APs. However, the source of SDPs was not resolved, since synaptic or pharmacological blockade was not employed in this study, beyond the demonstration that the SDP was not eliminated when spiking was eliminated with TTX. Alternatively, we have proposed that the pattern generator may be localized to the nerve fibres and not dependent upon synaptic transmission (Donnelly, 1996). We found that the nerve discharge pattern may be changed from a random pattern to a bursting pattern by small doses of veratridine, a Na+ channel agonist whose effect, we argued, should be confined to the nerve fibres. Thus, we suggested that the random behaviour of channels in the nerve terminals may underlie the random behaviour of the spiking activity and not the random release of an excitatory transmitter from glomus cells, which would be unaltered by veratridine (Donnelly, 1996). For both of these candidate generator processes, spike initiation may be modelled as a Poisson-type process in which the number of randomly occurring events in a given time period dictates whether an action potential is initiated. The probability (P) of observing k events in time period dt is given by the Poisson equation:
where m= mean rate of events × dt.
Within this model, an action potential is initiated if k or more events are observed in time period dt, so the overall probability of spike generation would be:
summed over k= threshold, threshold + 1, threshold + 2…
The probability of spike generation is known, since this is our measured variable. During normoxia the spiking rate is approximately 1 Hz, which corresponds to a spike probability of 0.001 ms−1. This spike probability may be fitted to a number of possible solutions, each having a unique (k, m) pair. In order to determine which (k, m) pair best fits the experimental data set, the theoretical changes in discharge frequency following a 5 % decrease in excitability (based on the change in threshold current) were calculated. The 5 % value is conservative, being one standard error above the mean threshold current change following a 20 % decrease in [Na+]o. The theoretical change in discharge frequency could not be directly computed, because the factorial function is only defined for integer values. However, the factorial function may be replaced by Euler's gamma function and is a continuous function which accurately computes the factorial for integer values: k! =Γ(k+ 1). Replacing the factorial function with the gamma function:
for k= threshold, threshold + 1, threshold + 2…
Theoretical spiking rates were calculated for k= threshold and for k= 1.05× threshold, using threshold values of two, ten, twenty and forty events (Fig. 8). Two predictions are apparent. (1) Over the normal spiking range from normoxia to hypoxia (1-15 Hz), a decrease in excitability produces similar changes in spiking frequency, i.e. the frequency ratios for a given threshold value are within 0.1 for a 5 % decrease in excitability during normoxia and during hypoxia. This is consistent with the experimental data of Fig. 3. (2) The magnitude of the effect of a given decrease in excitability becomes larger as the number of events increases and threshold increases. For the present experiments, a 20 % decrease in [Na+]o caused a frequency ratio of 0.4-0.5 and this was associated with an estimated 3-5 % decrease in nerve excitability. The best model fit for this observation is a random process characterized by many events per millisecond (e.g. 10-30) and a high threshold value of ten to twenty events. It is poorly fitted to a low event model such as that proposed for an occasional release of an excitatory transmitter approximately every 78 ms (event probability = 0.013) (Hayashida et al. 1980). If such a low-event process were dictating spike occurrence, then it would have been expected to be only slightly affected by a 5 % reduction in excitability. In fact, in the extreme case in which a single quanta evokes an action potential with some safety factor, then a slight reduction in excitability would have no effect on spiking rates. In the opposite vein, it is highly unlikely that chemical transmission could be a high event process, since this would require a rapid clearing process for secreted transmitters, otherwise long bursts of spike trains would be generated. This is clearly not the case based on analysis of interspike interval distributions (Donnelly, 1996), and much of the secreted transmitter release is removed by diffusion rather than degradation or reuptake (Fidone et al. 1982).
Figure 8. Theoretical change in discharge frequency for a Poisson-type generator process following an increase in event rate and following an increase in threshold requirements of 5 %.
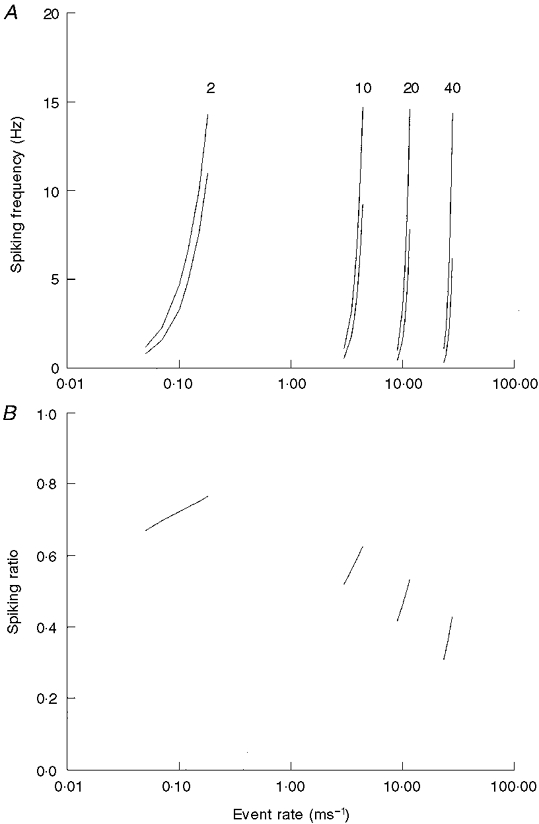
A, theoretical spiking frequency as event rate is increased for processes characterized by a threshold value of 2, 10, 20 and 40 events. The lower of each pair is the theoretical discharge frequency following an increase in threshold levels of 5 % (2.1, 11.55, 21 and 42). B, ratio of the discharge rate before and following an increase in threshold requirements of 5 %. Note that the sensitivity to an increase in threshold requirements increases as the threshold and event rate increase.
In conclusion, the present experiments demonstrate that chemoreceptor spiking activity is highly sensitive to isosmotic changes in extracellular Na+ concentration such that a 20 % decrease in [Na+]o may cause a 50 % decrease in afferent activity. This decrease in [Na+]o is associated with only a slight (ca 5 %) decrease in nerve excitability. Taken together, these results suggest that the spike pattern generator is not driven by rare secretory events but is probably due to a process intrinsic in the nerve terminals, for instance channel activity in the nerve terminals. This result does not argue against the postulate that the glomus cell controls spiking activity, but, rather, if it does control spiking rate then it is probably through a slow modulation of threshold requirements or mean event rates.
Acknowledgments
This work is supported by National Heart, Lung and Blood Institute Grant HL-53634. We thank Drs John Carroll and Ted Cummins for their helpful suggestions on this manuscript, and Dr Phillip Cheng for help with the mathematics.
References
- Belmonte C, Gallego R. Membrane properties of cat sensory neurones with chemoreceptor and baroreceptor endings. The Journal of Physiology. 1983;342:603–614. doi: 10.1113/jphysiol.1983.sp014871. [DOI] [PMC free article] [PubMed] [Google Scholar]
- Donnelly D. Generation of interspike intervals of rat carotid body chemoreceptors. In: Zapata P, Eyzaguirre C, Torrance RW, editors. Frontiers in Arterial Chemoreception. New York: Plenum Press; 1996. pp. 169–174. [DOI] [PubMed] [Google Scholar]
- Donnelly DF, Kholwadwala D. Hypoxia decreases intracellular calcium in adult rat carotid body glomus cells. Journal of Neurophysiology. 1992;67:1543–1551. doi: 10.1152/jn.1992.67.6.1543. [DOI] [PubMed] [Google Scholar]
- Eyzaguirre C, Koyano H. Effects of hypoxia, hypercapnia and pH on the chemoreceptor activity of the carotid body in vitro. Journal of Physiology. 1965;178:385–409. doi: 10.1113/jphysiol.1965.sp007634. [DOI] [PMC free article] [PubMed] [Google Scholar]
- Eyzaguirre C, Nishi K. Further study on mass receptor potential of carotid body chemosensors. Journal of Neurophysiology. 1974;37:156–169. doi: 10.1152/jn.1974.37.1.156. [DOI] [PubMed] [Google Scholar]
- Fidone S, Gonzalez C, Yoshizaki K. Effects of low oxygen on the release of dopamine from the rabbit carotid body in vitro. Journal of Physiology. 1982;333:93–110. doi: 10.1113/jphysiol.1982.sp014441. [DOI] [PMC free article] [PubMed] [Google Scholar]
- Fieber LA, McCleskey EW. L-type calcium channels in type I cells of the rat carotid body. Journal of Neurophysiology. 1993;70:1378–1384. doi: 10.1152/jn.1993.70.4.1378. [DOI] [PubMed] [Google Scholar]
- Fitzgerald RS, Shirahata M, Lahiri S. Testing for ionic pumps in the carotid body. In: Lahiri S, Forster RE, Davies RO, Pack AI, editors. Chemoreceptors and Reflexes in Breathing: Cellular and Molecular Aspects. New York: Oxford University Press; 1989. pp. 77–84. [Google Scholar]
- Gallego R, Belmonte C. The effects of blood osmolality changes on cat carotid body chemoreceptors in vivo. Pflügers Archiv. 1979;380:53–58. doi: 10.1007/BF00582612. [DOI] [PubMed] [Google Scholar]
- Gonzalez C, Almaraz L, Obeso A, Rigual R. Carotid body chemoreceptors: from natural stimuli to sensory discharges. Physiological Reviews. 1994;74:829–898. doi: 10.1152/physrev.1994.74.4.829. [DOI] [PubMed] [Google Scholar]
- Hayashida Y, Koyano H, Eyzaguirre C. An intracellular study of chemosensory fibers and endings. Journal of Neurophysiology. 1980;44:1077–1088. doi: 10.1152/jn.1980.44.6.1077. [DOI] [PubMed] [Google Scholar]
- Iturriaga R, Rumsey WL, Modashi A, Spergel D, Wilson D, Lahiri S. In vitro perfused-superfused cat carotid body for physiological and pharmacological studies. Journal of Applied Physiology. 1991;70:1393–1400. doi: 10.1152/jappl.1991.70.3.1393. [DOI] [PubMed] [Google Scholar]
- Johnson KB. Blood Chemistries. St Louis, MO, USA: Mosby-Year Book, Inc.; 1993. pp. 1–96. [Google Scholar]
- Kholwadwala D, Donnelly DF. Maturation of carotid chemoreceptor sensitivity to hypoxia: in vitro studies in the newborn rat. The Journal of Physiology. 1992;453:461–473. doi: 10.1113/jphysiol.1992.sp019239. [DOI] [PMC free article] [PubMed] [Google Scholar]
- Lopez-Lopez JR, Gonzalez C, Perez-Garcia MT. Properties of ionic currents from isolated adult rat carotid body chemoreceptor cells: effect of hypoxia. The Journal of Physiology. 1997;499:429–441. doi: 10.1113/jphysiol.1997.sp021939. [DOI] [PMC free article] [PubMed] [Google Scholar]
- Niu WZ, Engwall MJA, Bisgard GE. Two discharge patterns of carotid body chemoreceptors in the goat. Journal of Applied Physiology. 1990;69:734–739. doi: 10.1152/jappl.1990.69.2.734. [DOI] [PubMed] [Google Scholar]
- Nye PCG, Powell FL. Steady-state discharge and bursting of arterial chemoreceptors in the duck. Respiration Physiology. 1984;56:369–384. doi: 10.1016/0034-5687(84)90071-9. [DOI] [PubMed] [Google Scholar]
- Urena J, Lopez-Lopez J, Gonzalez C, Lopez-Barneo J. Ionic currents in dispersed chemoreceptor cells of the mammalian carotid body. Journal of General Physiology. 1989;93:979–999. doi: 10.1085/jgp.93.5.979. [DOI] [PMC free article] [PubMed] [Google Scholar]