

Abstract
Simultaneous patch clamp and rapid microfluorometric calcium measurements were performed on sixty-five motoneurones in slices of the nucleus hypoglossus in the brainstem of 2- to 6-day-old mice.
Hypoglossal motoneurones were particularly vulnerable to mechanical or metabolic stress during isolation of in vitro slice preparations. Therefore, experimental conditions were optimized for functional integrity, as judged by spontaneous rhythmic activity of hypoglossal nerves (XII).
Calcium concentrations in the cell soma were monitored with a temporal resolution in the millisecond time domain during depolarizing voltage steps. Ratiometric fluorescence measurements were made using a rapid monochromator (switching τ < 10 ms), a photomultiplier tube and the calcium sensitive dyes fura-2 and mag-fura-5.
Dynamics of somatic calcium transients were investigated as a function of the concentration of calcium indicator dye in the cell. Decays of calcium transients were approximated to a single exponential component and decay time constants showed a linear dependence on dye concentration. The extrapolated decay time in the absence of indicator dye was 0·7 ± 0·2 s, suggesting rapid somatic calcium dynamics under physiological conditions.
By a process of back-extrapolation, the ‘added buffer’ method, a calcium binding ratio of 41 ± 12 (9 cells) was obtained indicating that 98 % of the calcium ions entering a hypoglossal motoneurone were bound by endogenous buffers.
Endogenous calcium binding ratios in hypoglossal motoneurones were small compared with those of other neurones with comparable size or geometry. Accordingly, our measurements suggest that the selective vulnerability of hypoglossal motoneurones to calcium-related excitotoxicity might partially result from low concentrations of calcium buffers in these cells.
Rhythmic activity of hypoglossal motoneurones occurs in a number of physiological states including motor control of the tongue and respiratory function (e.g. Lowe, 1980; Withington-Wray et al. 1988; Greer et al. 1992). Calcium dependent modulation of motoneurone activity has been associated with calcium influx through different types of calcium channels, which can be distinguished by their voltage dependence, gating behaviour and specific pharmacological properties (Umemiya & Berger, 1994, 1995; Bayliss et al. 1995). For a given influx, the effective elevation in intracellular calcium concentration depends on multiple factors, including calcium uptake in intracellular stores, calcium extrusion mechanisms and endogenous calcium buffering of the cell. Endogenous calcium buffering can be quantified by the calcium binding ratio (κS), i.e. the ratio between the number of calcium ions bound to endogenous buffers and the number of calcium ions appearing as free calcium concentration in the cytosol (Neher & Augustine, 1992; Zhou & Neher, 1993; see Neher, 1995 for review). During patch clamp measurements, endogenous calcium buffering properties can be determined by the ‘added buffer’ method based on loading cells with fluorescent indicator dyes whose buffering properties are known (Neher & Augustine, 1992; Zhou & Neher, 1993; Neher, 1995; Fierro & Llano, 1996). For a defined amount of calcium flowing into the cell, competition between exogenous (e.g. fura-2) and endogenous calcium buffers reveals the calcium binding ratio, κS, under physiological conditions (Neher, 1995). Such measurements have demonstrated a substantial heterogeneity of calcium buffers in neurones, with values of κS ranging from 40 for the calyx of Held (Helmchen et al. 1997) and 168-207 for hippocampal CA1 neurones (Helmchen et al. 1996) to 2000 for cerebellar Purkinje cells in juvenile rats (Fierro & Llano, 1996). Interestingly, calcium buffering capacities may notably depend on development. For example, κS values in Purkinje cells have been shown to increase from 900 for 6-day-old to 2000 for 14-day-old rats (Fierro & Llano, 1996).
Pathophysiological states in motor neurone disease like those found during amyotrophic lateral sclerosis (ALS) have been associated, among others, with a selective vulnerability of motoneurones to glutamate and/or calcium mediated excitotoxicity (e.g. DePaul et al. 1988; Rothstein & Kuncl, 1995; Krieger et al. 1996). At present, the molecular and cellular factors responsible for this vulnerability are not completely understood (DePaul et al. 1988; Rothstein & Kuncl, 1995; Krieger et al. 1996). Interestingly, immunocytochemical studies have suggested that calbindin D28k and parvalbumin are expressed at low levels in those motoneurones that are particularly affected, pointing to the possibility that low concentrations of calcium binding proteins are an important factor controlling pathophysiological conditions (Baimbridge et al. 1992; Alexianu et al. 1994; Reiner et al. 1995). In this report, we performed simultaneous patch clamp and microfluorometrical measurements of calcium dynamics in motoneurones of the nucleus hypoglossus. Experimental conditions were optimized to preserve motoneurones in a functionally intact state, which was determined by spontaneous rhythmic activity of the hypoglossal nerve (Smith et al. 1991; Onimaru & Homma, 1992; Brockhaus et al. 1993; Frermann et al. 1997). Our results suggest that calcium binding ratios in hypoglossal motoneurones were small compared with those in other neurones of similar size or geometry (Tatsumi & Katayama, 1993; Fierro & Llano, 1996; Helmchen et al. 1996), indicating that a selective vulnerability might partially result from low levels of endogenous calcium buffering. Some of these results have been published in preliminary form (Lips & Keller, 1997).
METHODS
Preparation of slices and functional test of hypoglossal motoneurones
In vitro brainstem-spinal cord preparations were obtained from 2- to 6-day-old mice as previously described (Brockhaus et al. 1993 and the references therein). Rhythmic inspiratory discharges were recorded with suction electrodes from roots of hypoglossal and cervical nerves with standard electrophysiological equipment (Smith et al. 1991; Brockhaus et al. 1993; Frermann et al. 1997). Maximum oxygen supply was achieved by continuous bubbling of saline with carbogen (95 % O2, 5 % CO2); Tygon tubing connected saline reservoirs with the recording chamber and saline perfusion rates were up to 10 ml min−1. Transverse slices of the brainstem with a thickness of 150-500 μm were prepared according to previously described methods (Edwards et al. 1989; Keller et al. 1991; Frermann et al. 1997; Weigand & Keller, 1998). If not indicated otherwise, slices with a thickness of 150 μm were used as they provided optimal conditions for visual identification of cells and microfluorometric measurements. Animal experiments were carried out in accordance with the guidelines of the Ethics Committee of the Medical Faculty, University of Göttingen, Germany. Animals were decapitated, and brains were removed and subsequently cooled to 4°C. Starting from the rostral end of the area postrema up to seven slices containing the nucleus hypoglossus were taken for determination of the buffer capacity. Slices were maintained at room temperature in bicarbonate buffered saline (mM: 118 NaCl, 3 KCl, 1 MgCl2, 25 NaHCO3, 1 NaH2PO4, 1.5 CaCl2 and 20 glucose) at pH 7.4, continuously bubbled with carbogen (95 % O2, 5 % CO2). Prior to recordings, slices were incubated for at least 1 h to allow recovery. For whole-cell recordings (Hamill et al. 1981; Edwards et al. 1989), slices were placed in the recording chamber under a Zeiss upright microscope and continuously superfused with the solution described above (≥2 ml min−1). If not indicated otherwise, experiments were carried out at room temperature (23 ± 2°C).
Patch clamp recordings
During patch clamp experiments in slices, suitable hypoglossal motoneurones were selected by their intact overall shape, their ability to fire bursts of action potentials and the occurrence of spontaneous synaptic activity. In the majority of patch clamp measurements extracellular potassium concentrations were held at 3 mM significantly reducing the probability of spontaneous rhythmic activity. Slices displaying mechanically or metabolically disturbed hypoglossal motoneurones, which could be visually detected by a gradual degeneration of their overall shape and electrically by decreasing input resistances, were not further investigated.
The intracellular pipette solution contained (mM): 140 KCl, 10 Hepes, 2 MgCl2, 4 Na2-ATP and 0.4 Na-GTP (adjusted to pH 7.3 with KOH or CsOH). Fura-2 and mag-fura-5 were from Molecular Probes and used in concentrations ranging from 50 μM up to 1 mM in the pipette solution. In some experiments, 4.5 mg ml−1 neurobiotin was added to the intracellular solution to allow later anatomical identification of neurones analysed. Patch pipettes as well as stimulation pipettes were pulled from borosilicate glass tubing (Hilgenberg, Malsfeld, Germany) and heat polished before use. When filled with intracellular solution, they had resistances of 2.0-3.5 MΩ. Voltage-clamp recordings were performed with a patch clamp amplifier (EPC-9, Heka Elektronik, Lambrecht, Germany) employing optimal series resistance compensation as previously described (Titz & Keller, 1997; Frermann et al. 1997; D. Frermann, B. U. Keller & D. W. Richter, unpublished observations). The series resistance of hypoglossal motoneurones before compensation was typically 8-15 MΩ. Cells with series resistances higher than 15 MΩ were omitted from further analysis. Input resistances of hypoglossal motoneurones were 134 ± 72 MΩ under our experimental conditions. Values of series resistance (Rs) and membrane capacitance (Cm) were monitored with the patch clamp amplifier during the experiment. Series resistance compensation was set to 50-60 %. No compensation was made for liquid junction potentials. When not stated otherwise, whole-cell currents were recorded with sampling frequencies of 100 Hz to 5 kHz and filtered before analysis (filter 1: 3-pole Bessel filter, 10 kHz; filter 2: 4-pole Bessel filter, 2.9 kHz).
Microfluorometric calcium measurements
Intracellular calcium concentrations were measured using a computer-operated monochromator (TILL Photonics, Munich, Germany) that was controlled by the EPC-9 fura extension software. Fluorescence signals were detected by a photomultiplier mounted to a viewfinder (TILL Photonics) that defined a rectangular region of interest over which the fluorescence intensity was integrated. Slow recordings of fura-2 fluorescence at 360 nm (F360) and 390 nm (F390), membrane current and voltage at a sampling rate of 50 Hz were recorded by the X-chart version of the EPC-9 software. Rapid recordings of membrane current, F360 and F390 were obtained by the Pulse software (EPC-9) at a sampling rate of 10 kHz. For each recording interval lasting up to 70 s fluorescence signals F390 and F360 were recorded at short intervals of 25 ms. After that, F390 was collected for the rest of the interval to monitor calcium changes during voltage stimulation protocols (see for example Fig. 4). Calculations of intracellular calcium concentrations and further analysis were performed off-line by using the software Pulsefit (Heka) and IGOR (Wavemetrics, Lake Oswego, OR, USA). Calibration constants for fura-2 were determined according to Grynkiewicz et al. (1985) by patch clamping cells with the following intracellular solutions (mM): minimum fluorescence ratio (Rmin): 140 KCl, 10 Hepes, 2 MgCl2, 4 Na2-ATP, 0.4 Na-GTP and 10 BAPTA (adjusted to pH 7.3 with KOH); medium fluorescence ratio (Rmedium): 140 KCl, 10 Hepes, 2 MgCl2, 4 Na2-ATP, 0.4 Na-GTP, 9.9 BAPTA and 6.6 CaCl2 yielding a final concentration of 450 nM [Ca2+]i; and maximum fluorescence ratio (Rmax): 140 KCl, 10 Hepes, 2 MgCl2, 4 Na2-ATP, 0.4 Na-GTP and 10 CaCl2. Under our experimental conditions the dissociation constant for fura-2 (Kd) was determined by using the equation:
Calibration constants Kd, Rmax and Rmin were adjusted after several days of experiments to account for small fluorescence changes in the microfluorometric system. Typical values for Kd, Rmin and Rmax were 241 nM, 0.49 and 1.43, respectively. Fura-2 concentrations were checked by spectroscopic analysis demonstrating that nominal fura-2 concentrations reflected real concentrations with a deviation around 10 %. Fluorescence intensity is given in bead units (Cat. no. 18340, Polysciences Inc, Warrington, PA, USA).
Figure 4. Depolarizing pulses induce heterogeneous somatic Ca2+ signals in brainstem neurones.
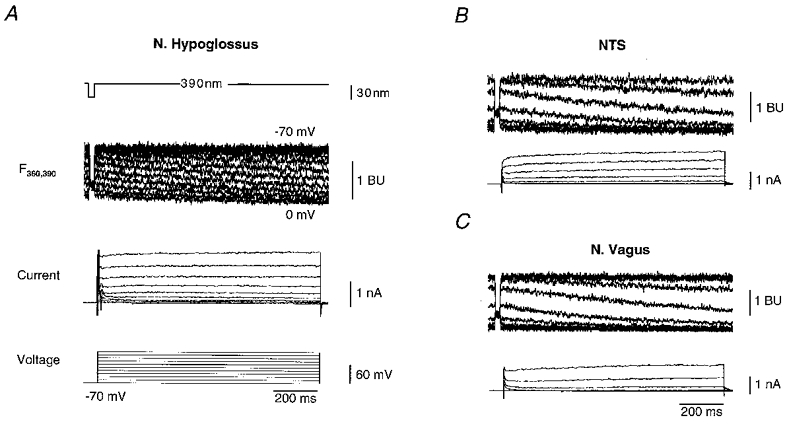
A, depolarizing pulses applied to motoneurones of nucleus hypoglossus and resulting changes in somatic calcium dependent and independent fluorescence in the in vitro slice preparation. Depolarizing pulses lasting 1 s to voltages between -60 and +50 mV lead to significant Ca2+ accumulation in the soma (holding potential, -70 mV; step size, +10 mV; pulse frequency, 0.5 Hz). Fluorescence traces show the signal F360,390 recorded at 360 (25 ms) and 390 nm as indicated in the top trace. Fluorescence signals are given in bead units (BU) as previously described (Neher, 1995). A decline of calcium dependent fluorescence F390 can be clearly detected for depolarizations positive to -60 mV. Note the constant value of fluorescence at 360 nm for consecutive depolarizations, indicating a constant dye concentration in the time interval of interest. B, corresponding recordings for an interneurone in the NTS. C, equivalent recordings for a dorsal vagal motoneurone. Note the differences in decay of calcium dependent fluorescence at 390 nm in NTS and vagal neurones compared with hypoglossal motoneurones.
Analysis of calcium dynamics and calcium binding ratios
Electrophysiological and microfluorometric signals were simultaneously recorded with EPC-9 hardware and software (PulseFit, Heka). Fluorescence signals were collected and spatially integrated over the soma of the cell. Integrated calcium signals were analysed according to a single compartment model (Neher & Augustine, 1992; Tank et al. 1995; Neher, 1995; Helmchen et al. 1997), which is based on the assumption of an instantaneous calcium influx and neglects spatial inhomogeneities in calcium concentrations inside the cell. Calcium buffering capacities were analysed according to the method of added buffer introduced by Neher & Augustine (1992). In this analysis, the incremental calcium binding ratio (κs) is the ratio of the change in Ca2+ bound to an endogenous buffer (S) ([CaS]) to the change in free calcium ([Ca2+]i):
(see also Neher, 1995; Fierro & Llano, 1996). Under our conditions, an exogenous (added) Ca2+ indicator dye (B) competes with the endogenous buffer (S) which affects amplitude and time course of Ca2+ transients. To characterize the buffering properties of the indicator dye, an incremental Ca2+ binding ratio (κB‘) is defined by (Neher & Augustine, 1992; Helmchen et al. 1997):
 |
where [Ca2+]rest is the free calcium concentration at rest and [Ca2+]peak=[Ca2+]rest+Δ[Ca2+]i defines the peak calcium concentration. [B]T is the concentration and Kd the dissociation constant of the calcium indicator (fura-2), which was 241 nM under our experimental conditions. The calcium binding capacity of mag-fura-5 was calculated according to Zhao et al. (1996) with a value of Kd= 31 μM as determined by in vitro absorbance titration experiments. Accordingly, mag-fura-5 concentrations of 500 μM yielded a calcium binding ratio:
In general, decays of calcium transients are mediated by different processes, including calcium extrusion across the plasma membrane, uptake into intracellular stores and slow binding to cytoplasmic buffers. In an elementary model, Ca2+ removal is approximated by a linear extrusion mechanism (Neher & Augustine, 1992; Neher, 1995; Helmchen et al. 1997):
where γ denotes the extrusion rate constant. In this case, decays of calcium transients evoked by a membrane depolarization are described by a single exponential component characterized by a decay time constant τ:
This time constant depends linearly on the exogenous (‘added’) calcium binding capacity, κB‘. Most important, measurement of τ as a function of κB‘permits determination of κS, the endogenous calcium binding ratio of the cell. κS is obtained from the negative x-axis intercept of a plot of τversusκB‘, which is equal to 1 +κS (Neher & Augustine, 1992; see also Fig. 8). The calcium decay time (τ) in the absence of exogenous buffers can be calculated by extrapolating the same plot to κB‘= 0.
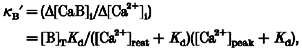
Figure 8. Endogenous Ca2+ buffering capacity in hypoglossal motoneurones.
A, calcium transients evoked by 500 ms depolarizing pulses to +10 mV. Amplitudes and decay time constants τ of somatic Ca2+ signals were determined by ratiometric calculations as described in the Methods section. B, decays of calcium transients were approximated by a single exponential and plotted against Ca2+ binding capacities, κB‘, of fura-2 or mag-fura-5. Concentrations and binding capacities of indicator dyes were estimated from calcium dependent and independent fluorescence at 360 and 390 nm, calcium resting levels and peak levels, which were recorded for each depolarizing pulse. A linear regression of τversusκB′ was determined according to least squares (Pearson's r= 0.95). The negative intercept of the regression line yielded a calcium binding ratio of 41 ± 12 (9 cells) for hypoglossal motoneurones. Calcium decay time constant at κB′= 0 was extrapolated as 0.7 ± 0.2 (9 cells). Open circle represents mean value from 7 experiments performed with mag-fura-5 (500 μm) in the pipette solution (mean ±s.e.m. decay time constant of calcium transient, 1.38 ± 0.13 s).
In the kinetic analysis, rise times of calcium signals were defined as the time from 20 to 80 % of the calcium amplitude. To determine the decay time constant a single exponential was fitted from peak to baseline using either PulseFit or IGOR software. For amplitude determinations data were filtered with 0.05 kHz to reduce noise. Statistics are given throughout the text as means ±s.d.
RESULTS
Functional integrity of hypoglossal motoneurones
Measurements were obtained from sixty-five motoneurones in the nucleus hypoglossus of 2- to 6-day-old mice using standard patch clamp techniques for slice recordings. During electrophysiological experiments, hypoglossal motoneurones were identified by their location close to the central canal (Fig. 1A), their large somata with diameters ranging from 20 to 30 μm and their distinct dendritic arborization. Recordings of spontaneous rhythmic-respiratory discharges from hypoglossal and cervical spinal nerves were used to assure functional integrity of motoneurones. Rhythmic activity of hypoglossal nerves (XII) was detected as repetitive ‘bursts’ of action potentials as illustrated in Fig. 1B. They could be recorded from in vitro brainstem-spinal cord preparations and thick (500 μm) slices of the medulla containing rootlets of the hypoglossal nerve. Rhythmic activity of hypoglossal motoneurones was observed in slices as thin as 200 μm, indicating that our in vitro preparation preserved synaptic connections and neuronal microenvironments in an intact state. After prolonged recording intervals, activitiy of XII nerves was slightly decreased, suggesting a moderate ‘rundown’ of motoneurone activity (Fig. 2A). By contrast, rhythmic inspiratory discharges of cervical spinal nerves, which were monitored under identical conditions, persisted over several hours without significant changes in their pattern of activity (C1, Fig. 2B). By comparison these findings showed that hypoglossal motoneurones (i) were preserved in a functionally intact state for up to 60 min allowing them to maintain their characteristic pattern of spontaneous rhythmic activity and (ii) appeared to be particularly sensitive to the mechanical and/or metabolic stress unavoidable during isolation and preparation of nervous tissue.
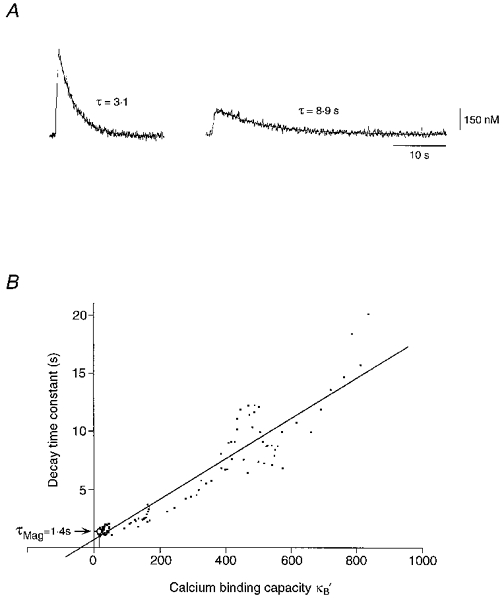
Figure 1. Nucleus hypoglossus in the brainstem of mouse.
A, schematic drawing of a transverse section showing hypoglossal regions investigated and important characteristics for orientation. Hypoglossal nerve endings (XII) emerge on the ventral side of the medulla. B, for recordings from the entire brainstem-spinal cord preparation (from the 8th spinal nerve to the pontomedullary junction) tissue was pinned down ventral side upwards in an acrylic glass chamber and superfused with artificial cerebrospinal fluid at 28 °C (for references see Methods). Superfusion rate was ≈8 ml min−1. Electrical activity was recorded extracellularly with conventional glass suction electrodes applied to the proximal nerve endings. Upper trace shows rhythmic-inspiratory discharges of a hypoglossal nerve (XII) root. Compound potentials were integrated after electronic bandpass filtering (lower trace, 1-2 kHz; Int. (XII)).
Figure 2. Comparison of spontaneous rhythmic discharges of the hypoglossal (XII) and cervical spinal nerve roots (C1).
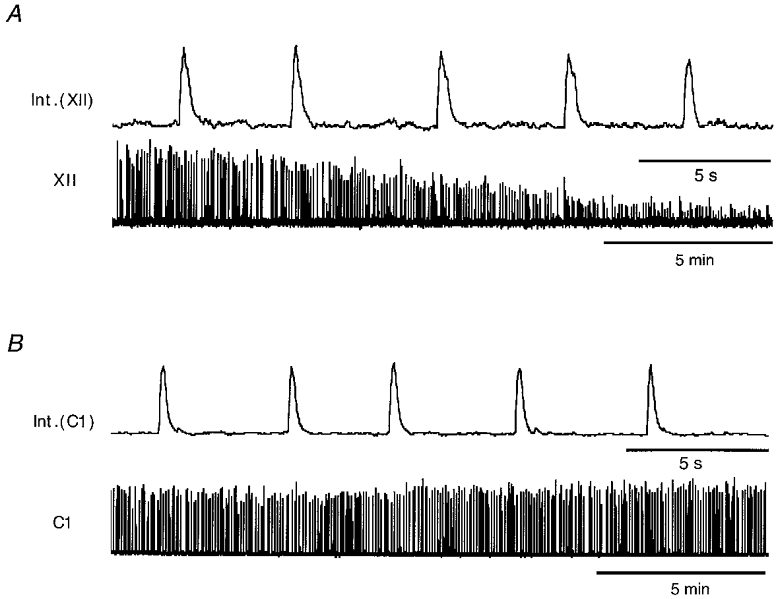
Extracellular recordings of rhythmic activity in the brainstem-spinal cord preparation. Respiratory-rhythmic compound action potentials were recorded from hypoglossal (A, XII) and cervical nerve roots (B, C1) as described in Fig. 1B. Rhythmic discharges from cervical roots remained unchanged for several hours, while activity of the hypoglossus nerve gradually decreased after 30-60 min. Lower traces in A and B show low and upper traces show high temporal resolution of integrated signals of nerve activity.
Simultaneous patch clamp and rapid microfluorometric measurements
After establishing the whole-cell patch clamp recording configuration, hypoglossal motoneurones were filled via the patch pipette with intracellular solutions containing either 4.5 mg ml−1 neurobiotin for anatomical analysis (Fig. 3A) or, alternatively, fura-2 concentrations ranging from 50 μM to 1 mM (Fig. 3B). To perform rapid measurements of intracellular calcium concentrations, a rectangular window was adjusted for fluorescence detection to the soma or proximal dendrites as illustrated in Fig. 3B. Calcium dependent and independent fluorescence of fura-2 was excited at wavelengths of 390 and 360 nm, respectively, by using a computer controlled monochromator based on a galvanometric scanner, which allowed switching between wavelengths within 10 ms. For a given excitation wavelength, emission fluorescence was integrated over the rectangular window, collected by a photomultiplier and digitized simultaneously with electrophysiological data.
Figure 3. Hypoglossal motoneurones filled with neurobiotin and fluorescent indicator.
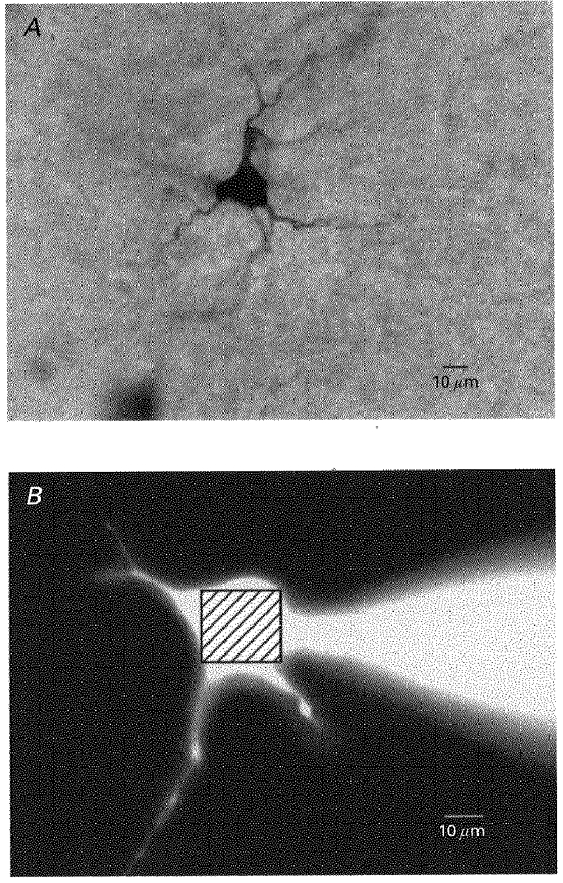
A, an intracellularly labelled hypoglossal motoneurone filled with neurobiotin (4.5 mg ml−1) during a patch clamp experiment. B, lower photomicrograph shows a different motoneurone filled with 200 μM fura-2 visualized under UV light. The square within the soma shows the region selected for somatic calcium measurements.
During patch clamp recordings, dye filling occurred with a time constant of 5-12 min as detected by calcium independent fluorescence of fura-2. After a stable dye concentration had been reached, depolarization-induced calcium signals were investigated in hypoglossal motoneurones and compared with those of other brainstem neurone types. Figure 4 illustrates a voltage clamp protocol based on ten consecutive depolarizations separated by time intervals of 1 s. Step-like depolarizations to voltages between -70 mV and +30 mV were performed on motoneurones in the nucleus hypoglossus, dorsal motoneurones in the nucleus vagus (NV) and interneurones in the nucleus tractus solitarius (NTS). Before cells were depolarized, fura-2 fluorescence (F360,390) was measured at excitation wavelengths of 390 and 360 nm (Fig. 4A). During depolarizing pulses calcium sensitive fluorescence (F390) was continuously recorded with a temporal resolution in the millisecond time domain. Ratiometric calculations of somatic calcium concentrations were performed off-line after the experiment. In hypoglossal motoneurones, F390 decayed significantly more slowly than in neurones in the nucleus tractus solitarius (Fig. 4B) or nucleus vagus (Fig. 4C), indicating that for a given depolarization somatic calcium increases occurred at slower rates. In all cells investigated, F390 changed in a linear way during membrane depolarization. This was also found for longer depolarizations lasting several seconds, suggesting that secondary events like calcium-induced calcium release did not significantly shape signals under our conditions. This view was further supported by the high reproducibility of calcium responses during repetitive voltage protocols. Resting calcium concentrations were found to be 157 ± 54 nM (n= 9) for hypoglossal motoneurones. They were essentially undisturbed by depolarization protocols if consecutive depolarizations were separated by longer time intervals lasting more than 20 s. For n= 7 cells resting levels changed from 197 ± 71 to 188 ± 80 nM after twelve depolarizations from -70 to 0 mV.
Figure 5A illustrates intracellular calcium concentrations after consecutive membrane depolarizations to voltages between -70 and +50 mV. As already observed in the original fluorescence recordings (Fig. 4), calcium elevations at a given voltage were small in hypoglossal motoneurones compared with other neurone types. This was further supported by estimates of the membrane depolarization necessary to evoke a half-maximum calcium response (Fig. 5). For calcium recordings from a hypoglossal motoneurone illustrated in Fig. 5A, six consecutive voltage steps up to -10 mV were necessary to reach a half-maximum calcium signal. In comparison, five depolarizations to -20 mV were usually sufficient to yield equivalent responses for nucleus tractus solitarius or vagal neurones (Fig. 5A). These and the average results illustrated in Fig. 5B indicated that (i) somatic calcium concentrations changed in a fairly homogeneous way upon consecutive, depolarizing voltage steps, (ii) somatic calcium dynamics in the brainstem were heterogeneous in different neurone types and (iii) for a given membrane depolarization, somatic calcium elevations were smaller and occurred at slower rates in hypoglossal motoneurones compared with neurones in the nucleus tractus solitarius or nucleus vagus.
Figure 5. Heterogeneity of depolarization-induced Ca2+ elevations in the soma of different brainstem neurone types.
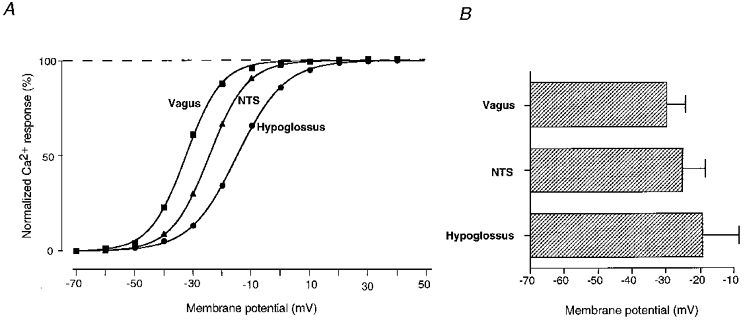
A, examples of depolarization-induced calcium elevations for vagal, NTS and hypoglossal neurones. Starting from a holding potential of -70 mV, step depolarizations lasting 1 s were applied to voltages between -60 and +40 mV (step size, +10 mV; frequency, 0.5 Hz; see also Fig. 4). Ca2+ concentrations were measured at the end of each pulse and plotted against the corresponding depolarizing membrane potential. Maximum calcium elevations [Ca]max were determined by fitting the function [Ca]i=[Ca]max/(1 + e-K(V - V½)) to data points from each neurone type (continuous lines; V½ denotes membrane depolarization at half-maximum response). Relative amplitudes of calcium elevations (as a percentage) are displayed in Fig. 5A. Accordingly, half-maximum calcium elevations were determined for membrane potentials of V½= -32, -25 and -15 mV for vagal, NTS and hypoglossal neurones, respectively. B, mean values for V½ were -29.4 ± 6.4 mV (n= 6) for vagal, -24.7 ± 8.6 mV (n= 12) for NTS and -18.9 ± 12 mV (n= 9) for hypoglossal neurones.
Calcium buffering in hypoglossal motoneurones
One prediction of the linear model for calcium dynamics presented in the Methods section is that there should be a single exponential time constant in the decay of calcium signals. Indeed, calcium decays in hypoglossal motoneurones were well described by a single exponential as illustrated in Fig. 6A (τ= 4.3 ± 0.9 s; n= 14 cells). Calcium decay started directly after the end of the depolarizing pulse, suggesting that calcium-induced calcium release did not notably shape somatic signals. Decays in other brainstem neurones were also well approximated by a single exponential (nucleus vagus: τ= 8.4 ± 1.4 s, n= 7; nucleus tractus solitarius: τ= 8.0 ± 0.7 s, n= 12; Fig. 6), indicating that the assumption of a linear calcium extrusion mechanism was justified for this protocol. Buffering capacities (κS) were estimated from nine hypoglossal motoneurones investigated during dye filling (fura-2) in the whole-cell patch clamp configuration. For all cells, F360,390 fluorescence signals were monitored starting immediately after establishing the whole-cell recording (Fig. 7A). Every 30 s, calcium responses were measured while depolarizing the cells to +10 mV for 500 ms. Figure 7B illustrates deflections of F390 during membrane depolarizations for increasing dye concentrations. For steady state conditions, the product of calcium elevation and decay time (Fig. 8A) was essentially constant for consecutive pulses, suggesting that ‘washout’ of calcium channels was not critical in these experiments.
Figure 6. Ca2+ transients decay according to a single exponential component.
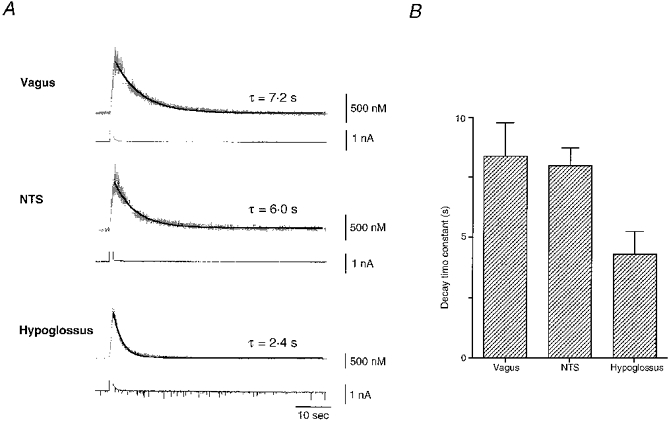
A, Ca2+ concentrations before, during and after depolarizing pulses to 0 mV lasting 1 s for vagal, NTS and hypoglossal neurones. Decays of calcium transients were well described by a single exponential component (dark line) but time constants were heterogeneous in different neurone types. Upper traces represent ratiometrically determined Ca2+ concentrations in 200 μM fura-2 and lower traces correspond to parallel current measurements. B, mean decay time constants in different neurone types. Histogram shows an almost 2-fold faster decline to resting levels of Ca2+ concentrations in hypoglossal motoneurones (n= 14, 4.3 ± 0.9 s) compared with vagal neurones (n= 7, 8.4 ± 1.4 s) or NTS neurones (n= 12, 8.0 ± 0.7 s).
Figure 7. Calcium transients during gradual increase in cytosolic concentration of calcium indicator dye.
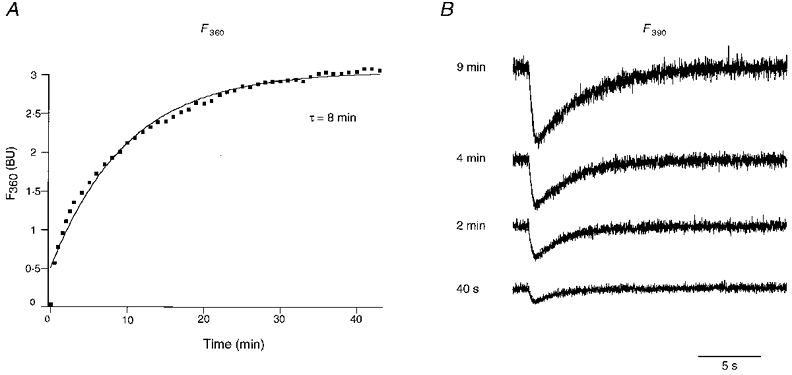
A, calcium independent fluorescenceF360 in bead units (BU) for different times after establishing the whole-cell patch clamp configuration. Continuous line represents a least-square fit with a single exponential function (time constant, 8 min). Note the deviation from a single exponential in the earliest period after establishing the whole-cell recording configuration. B, calcium dependent fluorescence F390 for different time intervals after establishing the whole-cell recording configuration during the 500 ms depolarizing pulse. Note the prolonged decay times of F390 signals after 40 s, 2 min, 4 min and 9 min, reflecting prolonged decay times of Ca2+ with increasing fura-2 concentrations (200 μM at the end of experiment).
As described in Methods, the endogenous calcium buffering capacity, κS, can be determined by using the equation:
(Neher & Augustine, 1992; Helmchen et al. 1997), where τ, κB‘and κS have the above mentioned meaning and γ denotes the effective calcium extrusion rate. Experimentally, κS was determined in hypoglossal motoneurones by plotting the decay time τ of calcium signals as a function of exogenous (‘added’) calcium binding capacity, κB‘. Figure 8B shows the result of a systematic study by using calcium indicator dyes fura-2 and mag-fura-5. For fura-2 concentrations ranging from 50 μM to 1 mM, we found decay time constants between 1.5 and 21 s, which were well-correlated with the dye concentration in the cytosol. There was a significant scatter of data points for a given exogenous calcium binding capacity, κB‘, most likely reflecting variations of calcium buffering conditions in different cells. The endogenous calcium binding ratio, κS, was calculated from the linear regression line for calcium decay time constant τversusκB′ (Fig. 8B). In hypoglossal motoneurones, κS was determined to be 41 ± 12 (n= 9 cells, fura-2) from the negative intercept, indicating that 1 out of 41 calcium ions contributed to the free calcium concentration under physiological conditions. Accordingly, 98 % of calcium ions were taken up by endogenous buffers. Extrapolation of Fig. 8B to κB′= 0 demonstrated that in the absence of exogenous buffers the decay time constant was 0.7 ± 0.2 s (n= 9 cells, 21°C), illustrating the dynamics of calcium transients under undisturbed conditions. Results from fura-2 experiments were consistent with independent measurements based on the low-affinity calcium indicator dye mag-fura-5. In this case, pipette solutions contained mag-fura-5 concentrations of 500 μM and calcium signals were recorded after the dye loading process of the soma was essentially complete (< 20 min). Under such conditions, calcium elevations displayed an average decay time constant of 1.38 ± 0.13 s (n= 7 cells), which was added as an extra data point in Fig. 8B (open circle). One additional parameter could be inferred from the function displayed in Fig. 8B. Since endogenous buffer capacities and decay times are known, the linear model of calcium homeostasis permits estimates of the extrusion rate constant (γ) by using the equation:
where κS, κB′ and τ have the above noted meaning. By extrapolating Fig. 8B to the absence of exogenous buffer concentrations (κB′= 0), γ was determined to be 60 ± 30 s−1 (n= 9 cells; 21°C) for somatic calcium transients in hypoglossal motoneurones.
DISCUSSION
Electrophysiological recordings from hypoglossal motoneurones
Simultaneous electrophysiological and microfluorometric measurements were performed in slices of the mouse brainstem which allowed us to describe for the first time the relationship between depolarization-induced calcium influx and somatic calcium changes in hypoglossal motoneurones. The functional integrity of hypoglossal motoneurones under our experimental conditions was demonstrated by the occurrence of spontaneous respiratory discharges of XII nerves in brainstem-spinal cord preparation and slices of the lower brainstem (Smith et al. 1991; Onimaru & Homma, 1992; Brockhaus et al. 1993; Frermann et al. 1997; D. Frermann, B. U. Keller & D. W. Richter, unpublished observations). Hypoglossal nerves showed a significant rundown of activity after 60 min while corresponding responses of cervical spinal nerves were essentially undisturbed. This behaviour correlated with a selective vulnerability of hypoglossal motoneurones after prolonged recording intervals, which was evident from a degeneration of their overall shape, elevations in resting calcium concentrations and gradual reduction of spontaneous electrical activity. Other brainstem neurones like dorsal vagal motoneurones or interneurones in the nucleus tractus solitarius displayed more stability under identical experimental conditions. These observations indicate that hypoglossal motoneurones are particularly sensitive to conditions of mechanical, hypoxic and/or excitotoxic stress which are unavoidable during isolation and preparation of nervous tissue.
Depolarization-induced calcium signals
The coupling between membrane depolarizations and changes in intracellular calcium concentrations was investigated with voltage clamp protocols previously used to characterize voltage dependent calcium currents (Viana et al. 1993; Umemiya & Berger, 1994, 1995). By utilizing a computer-controlled monochromator we were able to monitor calcium dynamics with a temporal resolution in the millisecond time domain. For several reasons, our voltage step protocols started at holding potentials of -70 mV. First, the complexity of calcium signals was reduced by selectively activating high voltage-activated (HVA) calcium channels leaving low voltage-activated (LVA) channels in hypoglossal motoneurones essentially inactivated (Viana et al. 1993; Umemiya & Berger, 1994, 1995). Second, the slower kinetics of HVA channels compared with LVA channels reduced a potential variability of calcium signals resulting from probably imperfect space clamp conditions in primary neurones with long dendrites. Even under these conditions, calcium elevations upon depolarizations of the soma are complex signals influenced by the types of calcium channels, their subcellular distribution, the shape of dendrites, subcellular distribution of calcium buffers, calcium extrusion mechanisms and surface to volume ratio of the cell. As none of these parameters is precisely known in hypoglossal motoneurones, the mechanisms controlling depolarization-induced calcium elevations in the soma are not well defined. For our present investigation, four important observations can be stated: (i) simultaneous patch clamp and microfluorometric recordings from hypoglossal motoneurones could be performed for several hours with resting calcium conditions that were sufficiently stable, (ii) somatic calcium signals were highly reproducible upon repetitive depolarizations, (iii) secondary events like calcium-induced calcium release were not apparent during somatic calcium measurements (Llano et al. 1994), and (iv) for a given depolarization protocol, calcium elevations were small in hypoglossal motoneurones compared with cells in the nucleus vagus or nucleus tractus solitarius.
Buffering capacity and calcium dynamics in hypoglossal motoneurones
Calcium buffering properties were determined by the method of ‘added buffer’, which involves filling of neurones with known calcium indicator dyes (Neher & Augustine, 1992; Neher, 1995; Fierro & Llano, 1996; Helmchen et al. 1997). In hypoglossal motoneurones, κS was found to be 41, indicating that of every 41 calcium ions in the cytosol, 1 contributed to the free intracellular calcium concentration. This was comparable to previously determined values of κS of 40 for the calyx of Held (Helmchen et al. 1997) and adrenal chromaffin cells (Zhou & Neher, 1993), but significantly smaller than 168-207 for CA1 neurones (Helmchen et al. 1996) and 900 for cerebellar Purkinje cells from 6-day-old rats (Table 1; Fierro & Llano, 1996; for review see Neher, 1995). Decay kinetics of calcium transients in the absence of exogenous buffers could be approximated by extrapolating decay times to κB= 0 (Fig. 8; Neher, 1995). We found decays of 0.7 ± 0.2 s (n= 9 cells; 21°C) for hypoglossal motoneurones, suggesting more rapid calcium kinetics under physiological conditions. This time constant was slow compared with those found in presynaptic terminals (91 ms, Helmchen et al. 1997), comparable to cerebellar Purkinje cells (Llano et al. 1994), but rapid compared with adrenal chromaffin cells (7.2 s, Neher & Augustine, 1992). For a given decay time the calcium extrusion rate constant γ could be calculated for the linear model if the calcium binding ratio was known (Neher, 1995). For hypoglossal motoneurones, we found a value of γ of 60 ± 30 s−1 (n= 9 cells), which was small compared with the calyx of Held (400 s−1; 21°C; Helmchen et al. 1997) but several times faster than adrenal chromaffin cells (Neher & Augustine, 1992).
Table 1.
Comparison of calcium buffer capacities in different cell types
| Cell type | Reference | κs |
|---|---|---|
| Cerebellar Purkinje cell (6-day-old rats) | Fierro & Llano, 1996 | 900 |
| Snail neurones (H. pomatia) | Schwiening & Thomas, 1996 | 360 |
| Neurohypophysial nerve endings | Stuenkel, 1994 | 174 |
| Hippocampal CA1 pyramidal cells | Helmchen et al. 1996 | 168–207 |
| N. basalis neurones | Tatsumi & Katayama, 1993 | 125 |
| Cortical layer V neurones | Helmchen et al. 1996 | 100–135 |
| Hypoglossal motoneurones | Lips & Keller, 1997 | 41 |
| Calyx of Held | Helmchen et al. 1997 | 40 |
| Adrenal chromaffin cell | Zhou & Neher, 1993 | 40 |
Several explanations might account for low buffering capacities in hypoglossal motoneurones. One is that a large fraction of mobile buffers is washed out during patch clamp measurements, a scenario that cannot be completely ruled out under our experimental conditions. However, calcium measurements starting immediately after establishing the whole-cell recording configuration provided no support for this hypothesis. One way to investigate this point in more detail is to repeat calcium measurements by using perforated patch techniques avoiding wash-out of mobile buffers (Zhou & Neher, 1993). An alternative explanation for low calcium buffering in hypoglossal motoneurones is a low expression of calcium binding proteins like calbindin D28k or parvalbumin. Indeed, small concentrations of calcium binding proteins have been detected in different types of motoneurones including hypoglossal motoneurones, which are particularly affected in motor neurone disease (Baimbridge et al. 1992; Alexianu et al. 1994; Reiner et al. 1995). Besides providing an attractive explanation, these data yield independent experimental evidence for low calcium buffering capacities in hypoglossal motoneurones. Furthermore, these interpretations are compatible with results from cerebellar Purkinje cells displaying both extraordinary large buffering capacities (κS= 2000 in 15-day-old rats) and high expression of calbindin D28k and parvalbumin in this phase of their development (Fierro & Llano, 1996).
One of the most interesting questions relates to the physiological relevance of low calcium buffering capacities in hypoglossal motoneurones. A characteristic feature provided by small calcium binding ratios versus larger ones is that a given calcium influx leads to a higher-amplitude, spatially more localized and faster decaying calcium transient if all other parameters are held constant. Under physiological conditions, this could facilitate locally defined calcium signals and, subsequently, an improved control of calcium dependent second messenger systems in subcellular compartments. Fast calcium dynamics resulting from low buffering capacities could have an additional advantage in rapidly oscillating networks like the respiratory system of young mice, where rhythmic-inspiratory discharges occur at frequencies above 1 Hz (Jacquin et al. 1996). Indeed, rhythmic calcium elevations have recently been observed in functionally intact neurones associated with rhythmic-respiratory activity (Frermann et al. 1997; D. Frermann, B. U. Keller & D. W. Richter, unpublished observations), demonstrating that rapid calcium oscillations can occur during normal rhythmic-inspiratory cycles. In pathophysiological states like those found during motor neurone disease, spontaneous calcium oscillations together with low buffering capacities might enhance a selective vulnerability of rhythmically active motoneurones to calcium mediated excitotoxic events.
Possible role of endogenous calcium buffers in calcium-related excitotoxicity
A selective vulnerability of motoneurones to excitotoxic events has been associated with specific pathophysiological states in motor neurone disease like amyotrophic lateral sclerosis in humans (DePaul et al. 1988; Alexianu et al. 1994; Appel et al. 1995; Reiner et al. 1995; Rothstein & Kuncl, 1995; Krieger et al. 1996). Accordingly, a selective vulnerability of hypoglossal motoneurones might be associated with an extraordinary collection of calcium channels carrying significant amounts of calcium influx upon small membrane depolarizations (see for example Alexianu et al. 1994; Appel et al. 1995; Reiner et al. 1995; Rothstein & Kuncl, 1995; Krieger et al. 1996). In contrast, somatic calcium elevations were small in hypoglossal motoneurones compared with neurones of the nucleus vagus or nucleus tractus solitarius during identical voltage clamp protocols. In addition, kinetic measurements indicated that calcium influx occurred at slower rates in hypoglossal motoneurones compared with other neurone types. On the one hand, these data clearly indicate a heterogeneity of calcium signals in different brainstem neurones, providing a plausible cellular basis for selective vulnerability. On the other hand, these data do not support the idea that a selective vulnerability of hypoglossal motoneurones results from a collection of exceptionally effective calcium influx pathways, as there was no evidence for calcium influx capable of dramatically increasing [Ca2+]i upon small depolarizations. Instead, our results suggest that hypoglossal motoneurones are selectively vulnerable in part because they display low calcium buffering capacities. Accordingly, a correlation between neuronal degeneration during motor neurone disease and cytosolic calcium binding ratios might be an interesting area for future investigation.
Acknowledgments
We thank D. Crzan for support with slice preparations and excellent technical assistance. We also thank Drs S. Titz, J. Brockhaus and K. Ballanyi for help with experiments and electrophysiological recordings, and Dr P. Lalley and D. Frermann for comments on the manuscript. This research was supported by DFG grants Ke 403/5-2, Ke 403/6-1, the Graduiertenkolleg ‘Organisation and Dynamics of Neuronal Nets’ and Sonderforschungsbereich 406.
References
- Alexianu ME, Ho BK, Mohamed AH, La BV, Smith RG, Appel SH. The role of calcium-binding proteins in selective motoneuron vulnerability in amyotrophic lateral sclerosis. Annals of Neurology. 1994;36:846–858. doi: 10.1002/ana.410360608. [DOI] [PubMed] [Google Scholar]
- Appel SH, Smith RG, Alexianu ME, Siklos L, Engelhardt J, Colom LV, Stefani E. Increased intracellular calcium triggered by immune mechanisms in amyotrophic lateral sclerosis. Clinical Neuroscience. 1995;3:368–374. [PubMed] [Google Scholar]
- Baimbridge KG, Celio MR, Rogers JH. Calcium-binding proteins in the nervous system. Trends in Neurosciences. 1992;15:303–308. doi: 10.1016/0166-2236(92)90081-i. [DOI] [PubMed] [Google Scholar]
- Bayliss DA, Umemiya M, Berger AJ. Inhibition of N- and P-type calcium currents and the after-hyperpolarization in rat motoneurones by serotonin. The Journal of Physiology. 1995;485:635–647. doi: 10.1113/jphysiol.1995.sp020758. [DOI] [PMC free article] [PubMed] [Google Scholar]
- Brockhaus J, Ballanyi K, Smith JC, Richter DW. Microenvironment of respiratory neurons in the in vitro brainstem-spinal cord of neonatal rats. The Journal of Physiology. 1993;462:421–445. doi: 10.1113/jphysiol.1993.sp019562. [DOI] [PMC free article] [PubMed] [Google Scholar]
- DePaul R, Abbs JH, Caligiuri M, Gracco VL, Brooks BR. Hypoglossal, trigeminal, and facial motoneuron involvement in amyotrophic lateral sclerosis. Neurology. 1988;38:281–283. doi: 10.1212/wnl.38.2.281. [DOI] [PubMed] [Google Scholar]
- Edwards FA, Konnerth A, Sakmann B, Takahashi T. A thin slice preparation for patch clamp recordings from neurones of the mammalian central nervous system. Pflügers Archiv. 1989;414:600–612. doi: 10.1007/BF00580998. [DOI] [PubMed] [Google Scholar]
- Fierro L, Llano I. High endogenous calcium buffering in Purkinje cells from rat cerebellar slices. The Journal of Physiology. 1996;496:617–625. doi: 10.1113/jphysiol.1996.sp021713. [DOI] [PMC free article] [PubMed] [Google Scholar]
- Frermann D, Richter DW, Keller BU. Intracellular calcium oscillations in spontaneously active respiratory neurons of mouse. Pflügers Archiv. 1997;433:R97. [Google Scholar]
- Greer JJ, Smith JC, Feldman JL. Respiratory and locomotor patterns generated in the fetal rat brain stem-spinal cord in vitro. Journal of Neurophysiology. 1992;67:996–999. doi: 10.1152/jn.1992.67.4.996. [DOI] [PubMed] [Google Scholar]
- Grynkiewicz G, Poenie M, Tsien RY. A new generation of Ca2+ indicators with greatly improved fluorescence properties. Journal of Biological Chemistry. 1985;260:3440–3450. [PubMed] [Google Scholar]
- Hamill O, Marty A, Neher E, Sakmann B, Sigworth FJ. Improved patch-clamp techniques for high resolution current recording from cells and cell-free membrane patches. Pflügers Archiv. 1981;391:85–100. doi: 10.1007/BF00656997. [DOI] [PubMed] [Google Scholar]
- Helmchen F, Borst GG, Sakmann B. Calcium dynamics associated with a single action potential in a CNS presynaptic terminal. Biophysical Journal. 1997;72:1458–1471. doi: 10.1016/S0006-3495(97)78792-7. [DOI] [PMC free article] [PubMed] [Google Scholar]
- Helmchen F, Imoto K, Sakmann B. Ca2+ buffering and action potential-evoked Ca2+ signaling in dendrites of pyramidal neurons. Biophysical Journal. 1996;70:1069–1081. doi: 10.1016/S0006-3495(96)79653-4. [DOI] [PMC free article] [PubMed] [Google Scholar]
- Jacquin TD, Borday V, Schneider-Maunoury S, Topilko P, Ghilini G, Kato F, Charnay P, Champagnat J. Reorganization of pontine rhythmogenetic neuronal networks in Krox-20 knockout mice. Neuron. 1996;17:747–758. doi: 10.1016/s0896-6273(00)80206-8. [DOI] [PubMed] [Google Scholar]
- Keller BU, Konnerth A, Yaari Y. Patch clamp analysis of excitatory synaptic currents in granule cells of rat hippocampus. The Journal of Physiology. 1991;435:275–293. doi: 10.1113/jphysiol.1991.sp018510. [DOI] [PMC free article] [PubMed] [Google Scholar]
- Krieger C, Lanius RA, Pelech SL, Shaw CA. Amyotrophic lateral sclerosis: the involvement of intracellular Ca2+ and protein kinase C. Trends in Pharmacological Sciences. 1996;17:114–120. doi: 10.1016/0165-6147(96)10004-3. [DOI] [PubMed] [Google Scholar]
- Lips MB, Keller BU. Simultaneous patch clamp and rapid microfluorometric calcium measurements in hypoglossal motoneurones of the mouse. Pflügers Archiv. 1997;433:R148. [Google Scholar]
- Llano I, DiPolo R, Marty A. Calcium-induced calcium release in cerebellar Purkinje cells. Neuron. 1994;12:663–673. doi: 10.1016/0896-6273(94)90221-6. [DOI] [PubMed] [Google Scholar]
- Lowe AA. The neural regulation of tongue movements. Progress in Neurobiology. 1980;15:295–344. doi: 10.1016/0301-0082(80)90008-8. [DOI] [PubMed] [Google Scholar]
- Neher E. The use of fura-2 for estimating Ca buffers and Ca fluxes. Neuropharmacology. 1995;34:1423–1442. doi: 10.1016/0028-3908(95)00144-u. [DOI] [PubMed] [Google Scholar]
- Neher E, Augustine GJ. Calcium gradients and buffers in bovine chromaffin cells. The Journal of Physiology. 1992;450:273–301. doi: 10.1113/jphysiol.1992.sp019127. [DOI] [PMC free article] [PubMed] [Google Scholar]
- Onimaru H, Homma I. Whole cell recordings from respiratory neurons in the medulla of brainstem-spinal cord preparations isolated from newborn rats. Pflügers Archiv. 1992;420:399–406. doi: 10.1007/BF00374476. [DOI] [PubMed] [Google Scholar]
- Reiner A, Medina L, Figueredo CG, Anfinson S. Brainstem motoneuron pools that are selectively resistant in amyotrophic lateral sclerosis are preferentially enriched in parvalbumin: evidence from monkey brainstem for a calcium-mediated mechanism in sporadic ALS. Experimental Neurology. 1995;131:239–250. doi: 10.1016/0014-4886(95)90046-2. [DOI] [PubMed] [Google Scholar]
- Rothstein JD, Kuncl RW. Neuroprotective strategies in a model of chronic glutamate-mediated motor neuron toxicity. Journal of Neurochemistry. 1995;65:643–651. doi: 10.1046/j.1471-4159.1995.65020643.x. [DOI] [PubMed] [Google Scholar]
- Schwiening CJ, Thomas RC. Relationship between intracellular calcium and its muffling measured by calcium iontophoresis in snail neurones. The Journal of Physiology. 1996;491:621–633. doi: 10.1113/jphysiol.1996.sp021244. [DOI] [PMC free article] [PubMed] [Google Scholar]
- Smith JC, Ellenberger HH, Ballanyi K, Richter DW, Feldman JL. Pre-Botzinger complex: a brainstem region that may generate respiratory rhythm in mammals. Science. 1991;254:726–729. doi: 10.1126/science.1683005. [DOI] [PMC free article] [PubMed] [Google Scholar]
- Stuenkel EL. Regulation of intracellular calcium and calcium buffering properties of rat isolated neurohypophysial nerve endings. The Journal of Physiology. 1994;481:251–271. doi: 10.1113/jphysiol.1994.sp020436. [DOI] [PMC free article] [PubMed] [Google Scholar]
- Tank DW, Regehr WG, Delaney KR. A quantitative analysis of presynaptic calcium dynamics that contribute to short-term enhancement. Journal of Neuroscience. 1995;15:7940–7952. doi: 10.1523/JNEUROSCI.15-12-07940.1995. [DOI] [PMC free article] [PubMed] [Google Scholar]
- Tatsami H, Katayama Y. Regulation of the intracellular free calcium concentration in acutely dissociated neurones from rat nucleus basalis. The Journal of Physiology. 1993;464:165–181. doi: 10.1113/jphysiol.1993.sp019628. [DOI] [PMC free article] [PubMed] [Google Scholar]
- Titz S, Keller BU. Rapidly deactivating AMPA receptors determine excitatory synaptic transmission to interneurones in the nucleus tractus solitarius from rat. Journal of Neurophysiology. 1997;78:82–91. doi: 10.1152/jn.1997.78.1.82. [DOI] [PubMed] [Google Scholar]
- Umemiya M, Berger AJ. Properties and function of low- and high-voltage-activated Ca2+ channels in hypoglossal motoneurons. Journal of Neuroscience. 1994;14:5652–5660. doi: 10.1523/JNEUROSCI.14-09-05652.1994. [DOI] [PMC free article] [PubMed] [Google Scholar]
- Umemiya M, Berger AJ. Single-channel properties of four calcium channel types in rat motoneurons. Journal of Neuroscience. 1995;15:2218–2224. doi: 10.1523/JNEUROSCI.15-03-02218.1995. [DOI] [PMC free article] [PubMed] [Google Scholar]
- Viana F, Bayliss DA, Berger AJ. Calcium conductances and their role in the firing behaviour of neonatal rat hypoglossal motoneurones. Journal of Neurophysiology. 1993;69:2137–2149. doi: 10.1152/jn.1993.69.6.2137. [DOI] [PubMed] [Google Scholar]
- Weigand E, Keller BU. Functional diveersity of synaptic AMPA/KA receptors from rat as revealed by subtype-specific antagonists. European Journal of Neuroscience. 1998;10:64–70. doi: 10.1046/j.1460-9568.1998.00014.x. [DOI] [PubMed] [Google Scholar]
- Withington-Wray DJ, Mifflin SW, Spyer KM. Intracellular analysis of respiratory-modulated hypoglossal motoneurons in the cat. Neuroscience. 1988;25:1041–1051. doi: 10.1016/0306-4522(88)90057-7. [DOI] [PubMed] [Google Scholar]
- Zhao M, Hollingworth S, Baylor SM. Properties of tri- and tetracarboxylate Ca2+ indicators in frog skeletal muscle fibers. Biophysical Journal. 1996;70:896–916. doi: 10.1016/S0006-3495(96)79633-9. [DOI] [PMC free article] [PubMed] [Google Scholar]
- Zhou Z, Neher E. Mobile and immobile calcium buffers in bovine adrenal cells. The Journal of Physiology. 1993;469:245–273. doi: 10.1113/jphysiol.1993.sp019813. [DOI] [PMC free article] [PubMed] [Google Scholar]