

Abstract
Native ciliary epithelial cells from the ciliary epithelium of the eye exhibit anti-P-glycoprotein (P-gp) immunofluorescence.
We have used an antisense ‘knock-down’ approach to investigate the relationship between P-gp and the volume-activated chloride current (ICl,swell) and its role in volume regulation.
An antisense oligonucleotide to the human multidrug resistance (MDR1) gene, taken up by the cells in a dose-dependent manner, reduced P-gp immunofluorescence, inhibited ICl,swell and significantly increased the latency of activation of ICl,swell.
Increasing the hypotonic stress did not result in an increased activation of ICl,swell. MDR1 antisense ‘knock-down’ also reduced the ability of the cells to volume regulate following a hypotonic challenge.
These cells are known to express at least two volume-activated chloride channels, and the data suggest that P-gp is involved in the activation pathway of a subset of channels that contribute to whole-cell ICl,swell and participate in volume regulation.
Previously we have demonstrated that P-glycoprotein, the multidrug resistance gene product, is involved in the modulation of a volume-activated chloride current (ICl,swell) in bovine non-pigmented ciliary epithelial cells (Wu et al. 1996). Four lines of evidence supported this involvement: firstly, the pharmacological sensitivity was the same as that reported for other instances of P-glycoprotein-regulated ICl,swell (Gill et al. 1992; Diaz et al. 1993; Valverde et al. 1993); secondly, the ATP dependence is characteristic of members of the ATP-binding cassette (ABC) transporter/channel superfamily (Higgins, 1995); thirdly, there is inhibition of ICl,swell by an antibody to P-glycoprotein (C219), also reported by Han et al. (1996); and, fourthly, membrane associated P-glycoprotein was detected by two different monoclonal antibodies (C219 and JSB-1). Single channel patch clamp studies have revealed the presence of two volume-activated chloride channels in both the non-pigmented cells and their companion cells, the pigmented ciliary epithelial cells (Zhang & Jacob, 1997). One channel, of low conductance (7-9 pS), is common to both cells, but the second channel is different in each cell type (19 pS in the non-pigmented cells; 105 pS in the pigmented cells). Since, in this latter study, it was only the ICl,swell activity in the non-pigmented cells that demonstrated the characteristic pharmacology of the P-glycoprotein associated ICl,swell, an observation that was confirmed by the whole-cell patch clamp studies of Mitchell et al. (1997), we decided to pursue our investigations in the non-pigmented cells using antisense technology in order to elucidate the role of P-glycoprotein in the modulation of volume-activated chloride currents.
METHODS
Preparation of cells
The non-pigmented ciliary epithelial cells were prepared from ciliary processes of bovine eyes obtained from a local abattoir by a method similar to that described previously (Jacob, 1991). The tips of the ciliary body were dissected from bovine eyes and dissociated using 0.25 % trypsin (Sigma) with 0.02 % EDTA in a Ca2+- and Mg2+-free buffer for 35-40 min at 37°C. The tissue was triturated in a solution of culture medium E199 (Sigma) with 10 % fetal calf serum, spun at 500 g for 5 min, and washed twice. The cells were suspended in medium (E199 plus 10 % fetal calf serum) and plated on 6 mm uncoated glass coverslips, which were then put into 24-well tissue culture plates and incubated overnight (14-18 h) at 37°C to allow the cells to attach and recover from trauma associated with enzymatic digestion.
Oligonucleotides
The two high performance liquid chromatography (HLPC)-purified oligonucleotides were synthesized by Severn Biotech Ltd (Milton Keynes, UK). One, 5′ ATC CAT CCC GAC CTC 3′, is complmentary to bases -9 to +6 of human MDR1 mRNA (Chen et al. 1986) and the second, 5′ CTC CAT CAC CAC CTC 3′, is complementary to bases -9 to +6 of a mouse mdr cDNA that confers multidrug resistance (Gros et al. 1986). The first three bases at either end in both antisense oligonucleotides were phosphorothioated. For the measurement of the antisense oligonucleotide uptake by cells, the mouse mdr antisense oligonucleotide was labelled with fluorescein at both ends (bases 1 and 15) and the human MDRI antisense oligonucleotide was labelled with fluorescein at the fourth and the eleventh bases.
The convention adopted in this study is to use MDR1 to represent human antisense oligonucleotide and mdr to represent mouse antisense oligonucleotide.
Oligonucleotide treatment of cells
The cells, attached to the coverslips and incubated overnight, were rinsed with serum-free E199. Serum-free E199 (0.5 ml) with or without antisense oligonucleotide and/or lipofectin (Gibco-BRL) was added to each well of a 24-multiwell plate, each well of which contained three 6 mm glass coverslips. The cells were then cultured for 24 or 48 h before fluorescence measurements or for 48 h before electrophysiological recordings. In special cases where we tried to increase cellular uptake of antisense oligonucleotide by using the cell swelling technique, we bathed the cells with hypotonic solution and antisense oligonucleotide for 40 min, then changed the solution back to serum-free E199 with antisense oligonucleotide and incubated the cells for 24 or 48 h before fluorescence measurements.
Whole-cell recording
Whole-cell currents were recorded using the patch clamp technique previously described (Jacob, 1991) with a List EPC-7 patch clamp amplifier (List Electronic). Electrodes were pulled from standard-walled borosilicate glass capillaries with inner filament (Clark Electromedical Instruments, Pangbourne, Reading, UK) on a two-stage vertical puller (PB-7, Narishige, Tokyo) and gave a resistance of 5-10 MΩ when filled with the electrode solution. The junction potential was corrected when the electrode entered the bath. Voltage and current signals from the amplifier together with synchronizing pulses were digitized using a laboratory interface (model 1401, Cambridge Electronic Design (CED), Cambridge, UK) with a sampling rate of 1 kHz and recorded on computer disks using a PC. The voltage pulse generation and current analysis were performed with the EPC software package (CED).
The following is the standard voltage protocol used to record currents. The cells were held at the chloride equilibrium potential (0 mV), and then polarized to ±40, 0 and ±80 mV, with 200 ms at each potential and 4 s at 0 mV between each step. The cells were continuously cycled through the voltage protocol. All current measurements were made 10 ms after the onset of each voltage pulse. All experiments were carried out at room temperature (20-24°C).
Solutions
Special solutions were used to record chloride currents. The pipette solution contained (mM): 105 N-methyl-D-glucamine chloride (NMDG-Cl), 1.2 MgCl2, 10 Hepes, 1 EGTA, 70 D-mannitol and 2 ATP. The isotonic bath solution contained (mM): 105 NaCl, 0.5 MgCl2, 2 CaCl2, 10 Hepes and 70 D-mannitol. The hypotonic bath solution (23 % hypotonic) was obtained by simply omitting the D-mannitol from the solution. The osmolarity either in the pipette solution or in the isotonic solution was adjusted to 300 mosmol l−1 with sucrose. The pH of the pipette and bath solution was adjusted to 7.25 and 7.4, respectively, with Tris base.
Fluorescence measurement
The cells were prepared as above. After 48 h incubation with or without fluorescein-labelled antisense oligonucleotide and/or lipofectin, the cells, attached to glass coverslips, were washed with bath solution twice, and then examined with an Odyssey real-time laser confocal microscope (Noran Instruments, Middleton, WI, USA). The focus was adjusted until the peak signal was obtained, the images were acquired and the grey level of the images of the cells was measured by using MetaMorph image analysis system (Universal Imaging Corporation, West Chester, PA, USA). The fluorescence (grey level) values are expressed in units on an 8-bit scale, where 0 = black and 255 = white.
Immunofluorescence
Cells from the ciliary epithelium were prepared and treated in exactly the same way as for electrophysiology. The cells, attached to the coverslips, were washed with phosphate-buffered saline (PBS) and fixed in 4 % paraformaldehyde (plus 0.12 M sucrose) in PBS. The cell membranes were permeabilized with 0.5 % Triton X-100 in PBS and blocked with sheep serum (Sigma). The cells were then incubated in the refrigerator overnight in the presence and absence of the primary antibody, P-gp antibody JSB-1 (Monosan, Sanbio, Netherlands), diluted 1:10. Next, they were washed with PBS and incubated for 1 h in the dark with sheep anti-mouse IgG conjugated with fluorescein isothiocyanate (FITC; Sigma), diluted 1:100. Finally, the coverslips were washed with PBS, inverted onto Vectashield mounting medium (Vector Laboratories, Inc., Burlingame, CA, USA) on glass slides, sealed with nail varnish and examined by confocal microscopy.
Volume measurements
The cells were prepared and treated with or without antisense oligonucleotide and lipofectin in exactly the same way as for the electrophysiological studies. The glass coverslips containing the cells were fixed in a special holder and then placed into a perfused cuvette in a luminescence spectrometer (Perkin-Elmer Analytical Instuments, Beaconsfield, Bucks, UK) at 45 deg to the incident beam of light. The cells were illuminated with an excitation beam of 345 nm and reflected light was collected by the detector. The emission wavelength was set to 392 nm to avoid saturating the detector. Under control conditions the monolayer of cells reflects a proportion of the incident beam of light onto the detector. When the cells swell, their shape changes, and more of the incident light is scattered and less is reflected onto the detector. Thus, when exposed to hypotonic solution the light received by the detector is reduced. The subsequent period of volume regulation, during which the cells return to their original shape, is represented by a return of the light intensity to its original level.
Statistics
Data are expressed as means ± standard error of the mean (number of observations) and where appropriate have been analysed using Student's t test.
RESULTS
Uptake of antisense oligonucleotide
Fluorescein-labelled oligonucleotides were added to the culture medium in the presence and absence of the transfection reagent lipofectin (20 μg ml−1). Two oligonucleotides were used: human MDR1 antisense, 5′ ATC CAT CCC GAC CTC 3′, and mouse mdr antisense, 5′ CTC CAT CAC CAC CTC 3′. These were synthesized to be complementary to the initiation codon region (-9 to +6) of the human MDR1 gene from multidrug-resistant human cells (Chen et al. 1986) and the same region of a mouse mdr cDNA capable of conferring the multidrug-resistant phenotype (Gros et al. 1986). The mouse sequence differed from the human in three bases at positions 1, 8 and 10. The mouse antisense oligonucleotide, although it was taken up by the cells, had no effect on the cell properties (see below) and was therefore used as a three-base mismatch control.
The uptake was facilitated by the transfection agent lipofectin and monitored by confocal fluorescence microscopy. The pairs of pictures in Fig. 1A represent the light (upper) and confocal (lower) images of cells incubated in control medium (left) and fluorescein-labelled antisense oligonucleotide (200 μg ml−1) for 24 h (centre) and 48 h (right). The pigmented and non-pigmented cells both took up antisense oligonucleotide but it is noticeable that the non-pigmented cells exhibited the stronger signal, perhaps because they do not contain pigment granules which occupy space in the cytoplasm and absorb the fluorescence.
Figure 1. Antisense oligonucleotide uptake.
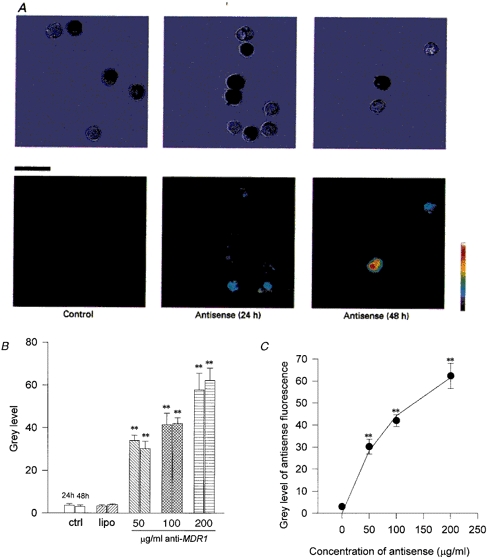
A, uptake of fluorescently labelled anti-human MDR1 antisense oligonucleotides. The upper row are light micrographs of the same images as the laser scanning confocal microscope images in the lower row. Pigmented and non-pigmented ciliary epithelial cells were incubated in control solution and for 24 and 48 h at 37 °C in antisense oligonucleotide against human MDR1 with the transfecting agent lipofectin (20 μg ml−1). Scale bar, 20 μm. Note the increase in uptake (fluorescence) particularly in the non-pigmented cells after 48 h. B, there was no significant difference in the fluorescence between control (ctrl, n= 7 cells) and lipofectin alone (lipo, 20 μg ml−1, n= 14), or antisense oligonucleotide alone at 100 or 200 μg ml−1, or antisense oligonucleotide and hypotonic solution (data not shown). However, at 50, 100 and 200 μg ml−1 antisense oligonucleotide with 20 μg ml−1 lipofectin there was a significantly increased fluorescence signal. The grey level value increased from 3.6 ± 0.7 units (24 h; n= 7) and 3.1 ± 0.7 units (48 h; n= 20) in control to 57.7 ± 7.9 units (24 h; n= 23) and 62.3 ± 5.7 units (48 h; n= 29) in 200 μg ml−1 antisense oligonucleotide with lipofectin (** P < 0.01). C, uptake of antisense oligonucleotide vs. external concentration. The uptake of fluorescently labelled antisense oligonucleotide after 48 h incubation in different concentrations of anti-human MDR1. The fluorescence was quantified using confocal microscopy and is represented as a grey level (0 = black, 255 = white). The graph shows a hyperbolic relationship between grey level and concentration suggesting that the cytoplasmic levels of antisense oligonucleotide are proportional to the external levels. The continuous line represents the fit of a Michaelis-Menten-type equation (y = Vmax[antisense oligonucleotide]/(Km+[antisense oligonucleotide])) to the data with Vmax= 101 grey level units and Km= 128 μg ml−1 (** P < 0.01 vs. control).
The histogram in Fig. 1B illustrates the increase in fluorescence on an 8-bit grey scale, from 0 to 255, following incubation of the cells under a range of conditions. The fluorescence increased from control levels of 3.6 ± 0.7 units (n= 7) and 3.1 ± 0.7 units (n= 20) at 24 and 48 h, respectively, to 57.7 ± 7.9 units (n= 23) after 24 h and 62.3 ± 5.8 units (n= 29) after 48 h. The mouse mdr antisense oligonucleotide was taken up to the same extent after 48 h (70.1 ± 7.1 units, n= 11, data not shown). There was only a small uptake of antisense oligonucleotide in the absence of lipofectin: 4.3 ± 3.5 units (n= 16) at 24 h, 11.3 ± 2.9 units (n= 7) at 48 h (data not shown) and lipofectin alone had no effect on the fluorescence (4.0 ± 0.4 units, n= 25, after 48 h; Fig. 1B). In addition, the exposure of cells to hypotonic solution in the presence of antisense oligonucleotide, a former method of transfection, caused no significant increase in uptake. Having achieved a satisfactory level of uptake of the antisense oligonucleotide after 48 h, this incubation period was adopted for the remainder of this study.
The data in Fig. 1C demonstrate the hyperbolic relationship between concentration of fluorescein-labelled antisense oligonucleotide added to the culture medium and cell fluorescence after 48 h incubation. The continuous line represents the fit of a Michaelis-Menten-type equation to the data and demonstrates the saturability of the uptake process (Vmax= 101 grey level units and Km= 128 μg ml−1).
Antisense ‘knock-down’ of P-glycoprotein immunofluorescence
Figure 2 demonstrates P-glycoprotein (P-gp) immunofluorescence in ciliary epithelial cells using the antibody JSB-1. The non-pigmented cells exhibited a higher level of immunofluorescence (89.0 ± 2.5 units on an 8-bit grey scale, n= 79) than the pigmented cells (48.5 ± 7.2 units, n= 21). This could be because either the pigmented cells contain less P-gp or their pigment absorbs the fluorescence. The remainder of this study will be confined to the non-pigmented cells.
Figure 2. P-glycoprotein (P-gp) immunofluorescence.

A, cells were incubated in the presence and absence of the P-gp antibody JSB-1. In the absence of the antibody there was little (autofluorescence) or no fluorescence. In the presence of the antibody P-gp immunofluorescence was detected in both pigmented and non-pigmented ciliary epithelial cells. Incubation of the cells for 48 h in the presence of human MDR1 (lower left panel), but not mouse mdr (lower right panel), antisense oligonucleotide caused a significant reduction in the immunofluorescence signal. Scale bar, 20 μm. B, quantification of the P-gp immunofluorescence by image analysis of the confocal image in the absence (ctrl 0) and presence (ctrl 1) of the primary antibody JSB-1. Incubation in 200 μg ml−1 human anti-MDR1 reduced the P-gp immunofluorescence by 64 % (from 89.0 ± 3.5 grey level units on an 8-bit scale, n= 79 cells, to 32.0 ± 2.9 units, n= 60 cells), whereas anti-mouse mdr had no effect (mean fluorescence = 96.1 ± 4.9 units, n= 23 cells). **P < 0.01vs. ctrl 1. Data are background subtracted. C, human anti-MDR1 antisense oligonucleotide reduced the P-gp immunofluorescence in a dose-dependent manner. The two control histobars represent the fluorescence in the absence (ctrl 0, n= 72 cells) and presence (ctrl 1, n= 24 cells) of the antibody. Number of cells = 24, 26, 28 and 60 for 10, 50, 100 and 200 μg ml−1 anti-MDR1, respectively. Anti-mouse mdr had no significant effect (n= 23 cells; ** P < 0.01 vs. ctrl 1). D, the correlation between P-gp immunofluorescence and antisense oligonucleotide fluorescence. Increasing the concentration of human MDR1 antisense oligonucleotide caused a decrease in P-gp immunofluorescence. The dotted line represents a linear regression fit to the data with a correlation coefficient (r) = 0.99 and P= 0.014.
The phase-contrast and confocal microscopic images (Fig. 2A) show that the levels of P-gp immunofluorescence in non-pigmented cells are decreased by 48 h incubation in human MDR1 antisense oligonucleotide but not mouse mdr antisense oligonucleotide (the three-base mismatch control). This is quantified in Fig. 2B. Increasing the medium concentration of anti-MDR1 caused a progressive decrease in P-gp immunofluorescence (Fig. 2C). The correlation between antisense oligonucleotide fluorescence (given in Fig. 1C) and P-gp immunofluorescence (Fig. 2C) is shown in Fig. 2D by the linear regression fit (r= 0.99, P= 0.014).
Antisense inhibition of volume-activated chloride current
Following incubation, cells were placed in a perfused recording chamber and voltage clamped at 0 mV in the whole-cell configuration, with NMDG-Cl in the patch pipette, and stepped between ±40 and ±80 mV. Volume-activated chloride currents were activated by exposing the cells to a bathing solution made 23 % hypotonic by the removal of mannitol. Under these conditions we have previously demonstrated that a current is activated which exhibits slight outward rectification, does not inactivate to any great extent at strong depolarizations, is ATP dependent and is carried by chloride (Wu et al. 1996).
The inclusion of human MDR1, but not mouse mdr, antisense oligonucleotides caused an inhibition of the volume-activated chloride current (Fig. 3A). Figure 3A illustrates the whole-cell currents in response to voltage steps of ±40 and ±80 mV, taken at the peak of activation of the volume-sensitive current in control, lipofectin alone, mouse mdr antisense oligonucleotide and human MDR1 antisense oligonucleotide. Only the latter caused any reduction in the current. The current values, recorded 10 ms after the start of the voltage step, are plotted as a function of time in Fig. 3B for each of the same experimental conditions. Note the delayed activation, which increases following incubation with human MDR1 antisense oligonucleotide, the peak current, which is likewise delayed, and the transient nature of the volume-activated current in each case.
Figure 3. Antisense inhibition of volume-activated chloride current.
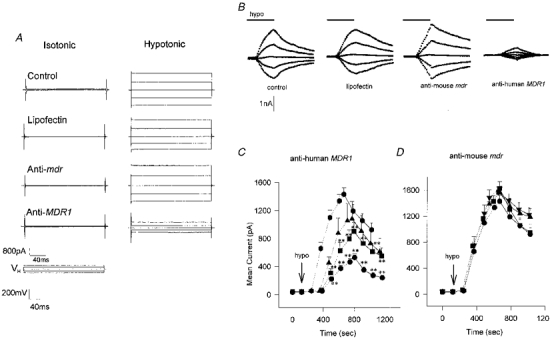
A, whole-cell voltage clamp recordings from single non-pigmented ciliary epithelial cells. The patch pipette contained a buffer designed for examining chloride current (see Methods). The cells were bathed in isotonic solution (≈10 min) before being exposed to a 23 % hypotonic solution followed by a wash in isotonic solution while being cycled through the voltage protocol (0, ±40, ±80 mV, see Methods). The isotonic (left) and peak hypotonic (right) traces are given for control (no additives), lipofectin alone (20 μg ml−1), and lipofectin with mouse mdr antisense oligonucleotide (200 μg ml−1) and human MDR1 antisense oligonucleotide (200 μg ml−1). Note that only in the latter case was there any inhibition of the hypotonic-activated current. B, whole-cell currents activated by 23 % hypotonic solution. The value of the whole-cell current taken 10 ms after the start of the voltage step (±40, ±80 mV) is plotted as a function of the following: time in isotonic conditions, the presence of the transfecting agent lipofectin (20 μg ml−1), lipofectin with 200 μg ml−1 anti-mouse mdr, and lipofectin with 200 μg ml−1 anti-human MDR1. In each case previous exposure to the test conditions was 48 h. The exposure to hypotonic solution is indicated by the bar (9 min). C, human MDR1 antisense oligonucleotide inhibition dose-response curves. The mean current, elicited by a +80 mV step is plotted as a function of time before and following exposure (dotted line) to hypotonic solution (↓) for cells that have been incubated for 48 h in lipofectin alone (20 μg ml−1; ♦), lipofectin with 50 μg ml−1 antisense oligonucleotide (▴), lipofectin with 100 μg ml−1 antisense oligonucleotide (▪) and lipofectin with 200 μg ml−1 antisense oligonucleotide (•). The peak currents in the figure were: lipofectin alone, 1431 ± 92 pA (n= 29); lipofectin with 50 μg ml−1 antisense oligonucleotide, 1080 ± 247 pA (n= 9); lipofectin with 100 μg ml−1 antisense oligonucleotide, 901 ± 129 pA (n= 14); and lipofectin with 200 μg ml−1 antisense oligonucleotide, 528 ± 53 pA (n= 27). These values compare with a control value (no additives) of 1599 ± 116 pA (n= 11), data not shown. ** P < 0.01 vs. lipofectin. D, anti-mouse mdr. The mean current, elicited by a +80 mV step is plotted as a function of time following exposure (dotted line) to hypotonic solution (↓) for cells that have been incubated for 48 h in lipofectin alone (20 μg ml−1, n= 29; •), lipofectin with 10 μg ml−1 antisense oligonucleotide (n= 13, ▪), lipofectin with 50 μg ml−1 antisense oligonucleotide (n= 4, ▴) and lipofectin with 200 μg ml−1 antisense oligonucleotide (n= 6, ▾). There was no significant difference between the currents under any of these conditions.
Antisense oligonucleotide dose response
Increasing concentrations of human MDR1 antisense oligonucleotide in the incubation medium caused an increasing inhibition of the volume-activated chloride current. Figure 3C shows the current response to a +80 mV step following activation by hypotonic solution. Lipofectin (20 μg ml−1) was present in each case and the human MDR1 antisense oligonucleotide was present at concentrations of 0, 50, 100 and 200 μg ml−1. With increasing antisense oligonucleotide the activation was delayed (see next section), and the current was reduced from a peak of 1.43 ± 0.1 nA (n= 29) in lipofectin alone to 0.53 ± 0.05 nA (n= 27; P < 0.01) in 200 μg ml−1 antisense oligonucleotide. Of the cells tested, 1/17 (6 %) showed no activation in 100 μg ml−1 antisense oligonucleotide and 6/23 (26 %) showed no activation in 200 μg ml−1 antisense oligonucleotide after 12 min in hypotonic solution. Increasing the antisense oligonucleotide concentration still further was found to be toxic and cause cell swelling. Prolonged exposure, or a double exposure, to hypotonic solution failed to activate ICl,swell further in three trials (cf. Discussion and Fig. 7).
Figure 7. Effect of increased hypotonic stress on P-gp ‘knock-down’ cells.
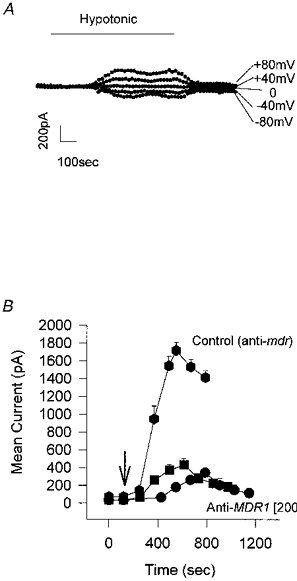
A, the whole-cell current in response to the voltage protocol of 0, ±40 and ±80 mV reaches a plateau following exposure to 23 % hypotonic solution. Cell incubated for 48 h in anti-MDR1 (200 μg ml−1). Increasing the exposure time (in this case to 13 min) did not increase the current elicited. Similar results were found in 3 experiments. B, effect of double exposure to hypotonic solution on the hypotonic-activated current. The mean current, elicited by a +80 mV step, is plotted as a function of time following exposure to hypotonic solution (↓) for cells that have been incubated for 48 h in lipofectin and antisense oligonucleotide to human MDR1 (•) or mouse mdr (♦), both at 200 μg ml−1. Following a 20 min wash, and complete recovery of the current to baseline levels, the cells were given a second exposure to hypotonic solution (▪). The data in anti-mouse mdr are given as a control. The peak current values in the figure are as follows: 200 μg ml−1 mouse mdr antisense oligonucleotide (control), 1716 ± 89 pA (n= 6); 200 μg ml−1 human MDR1 antisense oligonucleotide, first exposure to hypotonic solution, 386 ± 45 pA (n= 5), second exposure, 454 ± 84 pA (n= 5). The latency decreased from 255 ± 21 s (n= 5) following the first exposure to hypotonic solution to 125 ± 12 s (n= 5) following the second exposure. This latter value is not significantly different from the control value of 124 ± 29 s (n= 11; see Fig. 5).
The mouse mdr antisense oligonucleotide, on the other hand, had no effect at any of the applied concentrations (10-200 μg ml−1), either on the current or on the latency (Fig. 3D). Plotting the mean current (I+ 80 mV) at 7 min after the latency period (taken as the time from application of hypotonic solution to current activation) as a function of antisense oligonucleotide concentration further demonstrates the inhibitory effect of the human MDR1 antisense oligonucleotide (Fig. 4A). There was an increasing inhibition of the volume-activated chloride current with increasing anti-MDR1 oligonucleotide which was significant at 100 μg ml−1 (P < 0.01) and at 200 μg ml−1 (P < 0.01) at 7 min following activation. This inhibition was against an increase in current in the control cells (exposed to the anti-mouse mdr). There was a strong inverse correlation between antisense oligonucleotide fluorescence (from Fig. 1C) and mean volume-activated current (I+ 80 mV; r = -0.99; P= 0.0045) and a positive correlation between P-gp immunofluorescence (from Fig. 2D) and mean volume-activated current (I+ 80 mV; r= 0.95; P= 0.012).
Figure 4. Swelling-activated chloride current correlates with P-gp expression.

A, mean current following hypotonic activation. The mean current in response to a voltage clamp step of +80 mV was measured 7 min following the latency period; the latency was taken as the time for the current to activate following hypotonic exposure. The graph shows the mean current following activation in cells incubated for 48 h in different concentrations of either anti-mouse mdr (dotted lines) or anti-human MDR1 antisense oligonucleotide (continuous lines). Anti-mouse mdr had no inhibitory effect on the mean current at any concentration, whereas anti-human MDR1 decreased the mean current significantly at 100 and 200 μg ml−1 (n= 14 and 27, respectively; ** P < 0.01). B, the correlation between mean hypotonic-activated current and human MDR1 antisense oligonucleotide uptake (fluorescence). The mean current was measured as in A in cells that had been incubated for 48 h in lipofectin alone (control), and lipofectin with 50, 100 and 200 μg ml−1 human MDR1 antisense oligonucleotide. These current values were then compared with the mean grey level for each of these 4 treatment groups as measured by confocal microscopy (see legend to Fig. 1C). There is an inverse correlation between antisense oligonucleotide concentration and mean current indicating that increasing levels of antisense oligonucleotide cause an increasing block of the hypotonic-activated current. The dashed line is a linear regression fit to the data with a correlation coefficient of 0.99 (P= 0.0045). C, the correlation between mean hypotonic-activated current and P-gp immunofluorescence. The mean current, as above, and the level of P-gp fluorescence associated with the different concentrations of MDR1 antisense oligonucleotide (from Fig. 2D) are plotted. The dashed line represents a linear regression fit to the data (r= 0.95, P= 0.012).
Effect of human MDR1 antisense on latency of activation of chloride current
Latency was taken as the time between the exposure to hypotonic solution and the activation of the chloride current. The latency of activation in control was 124 ± 29 s (n= 11) and was unchanged in lipofectin alone at 126 ± 17 s (n= 29) but increased significantly to 265 ± 25 s (n= 27; P < 0.01) in 200 μg ml−1 antisense oligonucleotide (Fig. 5A). Mouse mdr antisense oligonucleotide (three-base mismatch control), on the other hand, had no effect. The degree of correlation between antisense oligonucleotide uptake (from Fig. 1C) and increase in latency is demonstrated by the linear regression fit (r= 0.96; P = 0.042; Fig. 5B). Similarly, there was a strong inverse correlation between the increase in P-gp immunofluorescence (from Fig. 2D) and the latency, illustrated by the linear regression fit (r = -0.96; P= 0.011; Fig. 4C).
Figure 5. Latency of activation of hypotonic-induced current.
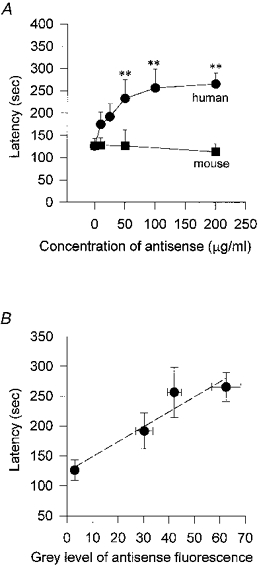
The latency was defined as the time taken for the whole-cell current to activate following exposure to hypotonic solution. In cells which had been incubated in anti-mouse mdr antisense oligonucleotide (▪) for 48 h there was no significant increase in the latency of activation; control latency was 124 ± 29 s (no additives; n= 11 cells) and 126 ± 17 s (lipofectin alone, 20 μg ml−1, n= 29) compared with 113 ± 19 s (n= 6) in 200 μg ml−1 anti-mouse mdr. On the other hand anti-human MDR1 (•) caused a progressive increase in latency with increasing concentrations, doubling the latency to 265 ± 25 s (n= 27) at a concentration of 200 μg ml−1 (** P < 0.01). B, latency of activation vs. antisense oligonucleotide uptake. The latency following hypotonic activation was measured for cells exposed to lipofectin alone (control), and lipofectin with 50, 100 and 200 μg ml−1 anti-human MDR1 for 48 h and these values are compared with the degree of fluorescence (measured by confocal microscopy, see legend to Fig. 1C) exhibited by cells exposed to the same treatment regime. There is a linear relationship between fluorescence and latency indicating that the more antisense oligonucleotide that enters the cell the greater the delay in the latency of activation of the hypotonic-activated current. The dashed line is a linear regression fit to the data with a correlation coefficient of 0.956 (P= 0.011).
Inhibition of regulatory volume decrease
Regulatory volume decrease (RVD) following hypotonic shock was monitored by a light scattering technique (see Methods). When cells swelled light was scattered, less light being reflected and therefore received by the detector but, as cells regained their normal volume by RVD, the light detected returned to control levels (Fig. 6A). The latency and rates of change of volume were compatible with those of the volume-activated Cl− current; the current latency was 1-3 min corresponding to a time to peak volume of 1-2 min, and the time to peak current following exposure to hypotonic solution was 240-270 s corresponding to a return time to control volume of 308 s. Incubation of the cells in 200 μg ml−1 anti-human MDR1 caused a significant reduction in their ability to volume regulate in ten experiments (Fig. 6B).
Figure 6. Regulatory volume decrease.
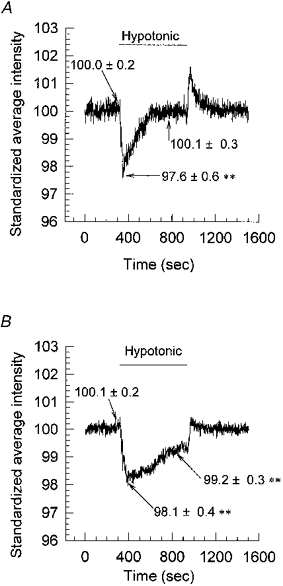
Volume changes were followed using a light reflection/scattering technique (see Methods). Cell swelling caused more scattering and less reflection, and thus the intensity (y-axis) decreased. A, as cells swelled following exposure to hypotonic solution the light intensity decreased. The light intensity returned to control levels as the cells underwent regulatory decrease and returned to normal volume. The data are the means of 10 experiments (**P < 0.01). B, incubation of cells in 200 μg ml−1 anti-human MDR1 for 48 h prior to testing caused a reduction in the cells’ ability to volume regulate, illustrated by the failure of the intensity signal to return to control levels during exposure to the hypotonic shock. The data are the means of 10 experiments (**P < 0.01).
DISCUSSION
This study demonstrates that an antisense oligonucleotide against the human multidrug resistance (MDR1) gene mRNA reduces P-glycoprotein (P-gp) expression and inhibits part of the volume-activated chloride current in non-pigmented ciliary epithelial cells. This antisense ‘knock-down’ of P-gp results in a reduction of the cells’ ability to volume regulate.
There has been much debate and some controversy about the role played by P-gp, the gene product of MDR1, in the activation of a volume-sensitive chloride channel (discussed in Higgins, 1995; Wu et al. 1996; Nilius et al. 1996). There are three possibilities open: firstly, that P-gp is a chloride channel; secondly, that P-gp is not a channel but a channel regulator (i.e. able to modify the function of the channel); and thirdly, that P-gp is both a channel and a channel regulator (the possibility that it is neither a channel nor a channel regulator is discounted by the volume of evidence that now exists confirming its role in this respect).
With regard to these possibilities our evidence shows that reducing the levels of P-gp by antisense ‘knock-down’ reduced the peak current and that continued hypotonic stress failed to activate the current further. In addition to reducing the available current, knocking down P-gp also increased the latency of activation. The simplest explanation that encompasses both these observations is that P-gp plays a role in the activation pathway of the volume-activated chloride current. To explore this further we exposed antisense-inhibited cells firstly to a prolonged hypotonic shock (Fig. 7A) and, secondly, to a second hypotonic challenge. Neither maneouvre was able to increase the total current activated but, with the double challenge, we obtained a more rapid response with the latency returning to control levels (Fig. 7B).
Anti-human MDR1 oligonucletotides knocked out (as opposed to knocked down) the volume-activated current in 26 % of cells (6/33). This can be interpreted as either P-gp controls all the volume-activated current in these cells and our knock-down was only 100 % effective in those 26 % of cases, or that P-gp controls one of a number of volume-activated chloride channels, which may include ICln (Paulmichl et al. 1992; Krapivinsky et al. 1994; Gschwentner et al. 1995), ClC-2 (Thiemann et al. 1992) and ClC-3 (Kawasaki et al. 1994; Duan et al. 1997). The findings of Zhang & Jacob (1997) of at least two separate volume-activated chloride channels in these cells, and those of Coca-Prados et al. (1995, 1996) who demonstrated, by reverse transcription-polymerase chain reaction (RT-PCR) and Northern blot analysis, the presence of the mRNA for ICln and ClC-3 in the transformed human non-pigmented ciliary epithelial cell line ODM-2, support the latter interpretation, as do the data in Fig. 7. However, the observation that all of the volume-activated chloride current can be inhibited by P-gp knock-down, albeit in a minority of cases, means that one cannot entirely rule out the possibility that P-gp is a channel and definitive proof of this will require further studies.
What of the considerable literature that has concluded there is no relationship between P-gp and volume-activated chloride currents? Firstly, almost all of the arguments are based on evidence from MDR1 over-expression studies, using either transfected or transformed cells, and many of these have found that the volume-activated currents do not correlate with MDR1 expression (Ehring et al. 1994; Rasola et al. 1994; Wang et al. 1994; Kunzelman et al. 1994; De Greef et al. 1995; Viana et al. 1995; Galietta et al. 1996; Weaver et al. 1996). We have performed all our studies on native cells expressing endogenous P-gp and, under these conditions, find a correlation between P-gp and volume-activated chloride channel activity. Secondly, in a number of negative studies, selection for cells expressing P-gp was achieved by exposure to cytotoxins such as colchine (Ehring et al. 1994; De Greef et al. 1995; Weaver et al. 1996), vinblastine (Viana et al. 1995) or doxorubicin (Altenberg et al. 1994; Rasola et al. 1994; Luckie et al. 1996). In such studies there may be considerable disturbances to cellular homeostasis which cause a change in phenotype.
In view of the considerable confusion regarding the role of P-gp in cell volume regulation we urge that due regard is paid to the experimental system and that over-expression studies be treated with caution. There are many possible explanations why such studies might not result in a correlation between levels of P-gp in the cell and volume-activated chloride current, for example: (1) the activation machinery may become saturated and additional P-gp will have no effect, (2) the increased levels of P-gp remain in the cytoplasm and are not transported to the membrane, (3) excess levels of P-gp may be transported to the membrane but do not link to the volume-sensing machinery, (4) necessary post-translational modifications do not occur in heterologous systems rendering the additional P-gp functionless, and (5) the excess P-gp may be switched to drug pump function and cannot therefore participate in chloride channel activation. Thus for any of these, or additional, reasons negative evidence from over-expression studies cannot be taken as conclusive. We demonstrate in this report on endogenously expressed P-gp in native cells, that P-gp does indeed play a role in the volume-activated chloride current and further studies are necessary to determine how this is mediated and the relationship between P-gp and the newly proclaimed candidate for the volume-activated chloride channel, ClC-3 (Duan et al. 1997).
Acknowledgments
We would like to thank the Royal National Institute for the Blind and the Medical Research Council for project grant support.
References
- Altenberg GA, Vanoye CG, Han ES, Deitmer JW, Reuss L. Relationships between rhodamine 123 transport, cell volume, and ion-channel function of P-glycoprotein. Journal of Biological Chemistry. 1995;269:7145–7149. [PubMed] [Google Scholar]
- Chen C-J, Chin JE, Ueda K, Clark DP, Pastan I, Gottesman MM, Roninson IB. Internal duplication and homology with bacterial transport proteins in the mdr1 (P-glycoprotein) gene from multidrug resistant human cells. Cell. 1986;47:381–389. doi: 10.1016/0092-8674(86)90595-7. [DOI] [PubMed] [Google Scholar]
- Coca-Prados M, Anguita J, Chalfant M, Civan MM. PKC-sensitive Cl− channels associated with ciliary epithelial homologue of pICln. American Journal of Physiology. 1995;268:C572–579. doi: 10.1152/ajpcell.1995.268.3.C572. [DOI] [PubMed] [Google Scholar]
- Coca-Prados M, Sanches-Torres J, Peterson-Yantorno K, Civan MM. Association of ClC-3 channel with Cl− transport by human nonpigmented ciliary epithelial cells. Journal of Membrane Biology. 1996;150:197–208. doi: 10.1007/s002329900044. [DOI] [PubMed] [Google Scholar]
- De Greef C, Van Der Heyden S, Viana F, Eggermont J, De Bruijin EA, Raeymaekers L, Droogmans G, Nilius B. Lack of correlation between mdr-1 expression and volume-activation of chloride currents in rat colon cancer cells. Pflügers Archiv. 1995;430:296–298. doi: 10.1007/BF00374662. [DOI] [PubMed] [Google Scholar]
- Diaz M, Valverde MA, Higgins CF, Rucareanu C, Sepulveda FV. Volume-activated chloride channels in HeLa cells are blocked by verapamil and dideoxyforskolin. Pflügers Archiv. 1993;422:347–353. doi: 10.1007/BF00374290. [DOI] [PubMed] [Google Scholar]
- Duan D, Winter C, Cowley S, Hume JR, Horowitz B. Molecular identification of a volume-regulated chloride channel. Nature. 1997;390:417–421. doi: 10.1038/37151. [DOI] [PubMed] [Google Scholar]
- Ehring GR, Ospichuk YV, Cahalan MD. Swelling-activated chloride channels in multidrug-sensitive and -resistance cells. Journal of General Physiology. 1994;104:1129–1161. doi: 10.1085/jgp.104.6.1129. [DOI] [PMC free article] [PubMed] [Google Scholar]
- Galietta LJV, Romeo G, Zegarra-Moran O. Volume regulatory taurine release in human trachael 9HTEo- and multidrug resistant 9HTEo-/Dx cells. American Journal of Physiology. 1996;271:C728–735. doi: 10.1152/ajpcell.1996.271.3.C728. [DOI] [PubMed] [Google Scholar]
- Gill DR, Hyde SC, Higgins CF, Valverde MA, Mintenig GM, Sepulveda FV. Separation of drug transport and chloride channel functions of the human multidrug resistance P-glycoprotein. Cell. 1992;71:23–32. doi: 10.1016/0092-8674(92)90263-c. [DOI] [PubMed] [Google Scholar]
- Gros P, Croop J, Housman D. Mammalian multidrug resistance gene: complete cDNA sequence indicates strong homology to bacterial transport proteins. Cell. 1986;47:371–380. doi: 10.1016/0092-8674(86)90594-5. [DOI] [PubMed] [Google Scholar]
- Gschwentner M, Nagl UO, Woll E, Schmarda A, Ritter M, Paulmichl M. Antisense oligonucleotides suppress cell-volume activation of chloride channels. Pflügers Archiv. 1995;430:464–470. doi: 10.1007/BF00373882. [DOI] [PubMed] [Google Scholar]
- Han EH, Vanoye CG, Altenberg GA, Ruess L. P-glycoprotein-associated chloride currents revealed by specific block by an anti-P-glycoprotein antibody. American Journal of Physiology. 1996;270:C1370–1378. doi: 10.1152/ajpcell.1996.270.5.C1370. [DOI] [PubMed] [Google Scholar]
- Higgins CF. Volume-activated chloride currents associated with multidrug resistance P-glycoprotein. The Journal of Physiology. 1995;482.P:31S–36S. doi: 10.1113/jphysiol.1995.sp020562. [DOI] [PMC free article] [PubMed] [Google Scholar]
- Jacob TJC. The identification of a low-threshold, T-type calcium channel in bovine ciliary epithelial cells. American Journal of Physiology. 1991;261:C808–813. doi: 10.1152/ajpcell.1991.261.5.C808. [DOI] [PubMed] [Google Scholar]
- Kawasaki M, Uchida S, Monkawa T, Miyawaki A, Mikoshiba K, Marumo F, Sasaki S. Cloning and expression of a protein kinase C-regulated chloride channel abundantly expressed in rat brain neuronal cells. Neuron. 1994;21:597–604. doi: 10.1016/0896-6273(94)90215-1. [DOI] [PubMed] [Google Scholar]
- Krapivinsky GB, Ackerman MJ, Gordon EA, Krapivinsky LD, Clapham DE. Molecular characterization of a swelling-induced chloride conductance regulatory protein, pI(Cln) Cell. 1994;76:439–448. doi: 10.1016/0092-8674(94)90109-0. [DOI] [PubMed] [Google Scholar]
- Kunzelmann K, Slotki IN, Koslowsky T, Ausiello DA, Greger R, Cabantchik ZI. Effects of P-glycoprotein expression on cAMP and volume-activated ion fluxes and conductances in HT-29 colon and adenocarcinoma cells. Journal of Cellular Physiology. 1994;161:393–406. doi: 10.1002/jcp.1041610302. [DOI] [PubMed] [Google Scholar]
- Luckie DB, Krouse ME, Law TC, Sikic BI, Wine JJ. Doxorubicin selection for MDR1/P-glycoprotein reduces swelling-activated K+ and Cl− currents in MES-SA cells. American Journal of Physiology. 1996;270:C1029–1036. doi: 10.1152/ajpcell.1996.270.4.C1029. [DOI] [PubMed] [Google Scholar]
- Mitchell CH, Zhang JJ, Wang L, Jacob TJC. Volume-sensitive chloride current in pigmented ciliary epithelial cells: role of phospholipases. American Journal of Physiology. 1997;272:C212–222. doi: 10.1152/ajpcell.1997.272.1.C212. [DOI] [PubMed] [Google Scholar]
- Nilius B, Eggermont J, Voets T, Droogmans G. Volume-activated Cl− channels. General Pharmacology. 1996;27:1131–1140. doi: 10.1016/s0306-3623(96)00061-4. [DOI] [PubMed] [Google Scholar]
- Nilius B, Sehrer J, Viana F, De Greef C, Raeymaekers L, Eggermont J, Droogmans G. Volume-activated Cl− currents in different mammalian non-excitable cell types. Pflügers Archiv. 1994;428:364–371. doi: 10.1007/BF00724520. [DOI] [PubMed] [Google Scholar]
- Paulmichl M, Li Y, Wickman K, Ackerman M, Peralta E, Clapham DE. New mammalian chloride channel identified by expression cloning. Nature. 1992;356:238–241. doi: 10.1038/356238a0. [DOI] [PubMed] [Google Scholar]
- Rasola A, Galietta L, Gruenert DC, Romeo G. Volume-sensitive chloride currents in four epithelial cell lines are not directly correlated to the expression of the MDR-1 gene. Journal of Biological Chemistry. 1994;269:1432–1436. [PubMed] [Google Scholar]
- Thiemann A, Grunder S, Pusch M, Jentsch TJ. A chloride channel widely expressed in epithelial and non-epithelial cells. Nature. 1992;356:57–60. doi: 10.1038/356057a0. [DOI] [PubMed] [Google Scholar]
- Valverde MA, Mintenig GM, Sepulveda FV. Differential effects of tamoxifen and I− on three distinguishable chloride currents activated in T84 intestinal cells. Pflügers Archiv. 1993;425:552–555. doi: 10.1007/BF00374885. [DOI] [PubMed] [Google Scholar]
- Viana F, Van Acker K, De Greef C, Eggermont J, Raymaekers L, Droogmans G, Nilius B. Drug-transport and volume-activated chloride channel functions in human erythroleukemia cells: relation to expression level of P-glycoprotein. Journal of Membrane Biology. 1995;145:87–98. doi: 10.1007/BF00233309. [DOI] [PubMed] [Google Scholar]
- Wang X, Wall DM, Parkin JD, Zalcberg JR, Kemm RE. P-glycoprotein expression in classical multi-drug resistant leukemia cells does not correlate with enhanced chloride channel activity. Clinical and Experimental Pharmacology and Physiology. 1994;21:101–108. doi: 10.1111/j.1440-1681.1994.tb02475.x. [DOI] [PubMed] [Google Scholar]
- Weaver JL, Aszalos A, McKinney L. MDR1/P-glycoprotein function. II. Effect of hypotonicity and inhibitors on Cl− efflux and volume regulation. American Journal of Physiology. 1996;270:C1453–1460. doi: 10.1152/ajpcell.1996.270.5.C1453. [DOI] [PubMed] [Google Scholar]
- Wu J, Zhang JJ, Koppel H, Jacob TJC. P-glycoprotein regulates a volume-activated chloride current in bovine non-pigmented ciliary epithelial cells. The Journal of Physiology. 1996;491:743–755. doi: 10.1113/jphysiol.1996.sp021254. [DOI] [PMC free article] [PubMed] [Google Scholar]
- Zhang JJ, Jacob TJC. Three different Cl− channels in the bovine ciliary epithelium activated by hypotonic stress. The Journal of Physiology. 1997;499:379–389. doi: 10.1113/jphysiol.1997.sp021935. [DOI] [PMC free article] [PubMed] [Google Scholar]