

Abstract
The role of endogenous nitric oxide (NO) generated by neuronal nitric oxide synthase (NOS-1) in the control of respiration during hypoxia and hypercapnia was assessed using mutant mice deficient in NOS-1.
Experiments were performed on awake and anaesthetized mutant and wild-type control mice. Respiratory responses to varying levels of inspired oxygen (100, 21 and 12 % O2) and carbon dioxide (3 and 5 % CO2 balanced oxygen) were analysed. In awake animals, respiration was monitored by body plethysmograph along with oxygen consumption (V̇O2), CO2 production (V̇CO2) and body temperature. In anaesthetized, spontaneously breathing mice, integrated efferent phrenic nerve activity was monitored as an index of neural respiration along with arterial blood pressure and blood gases. Cyclic 3′,5′-guanosine monophosphate (cGMP) levels in the brainstem were analysed by radioimmunoassay as an index of nitric oxide generation.
Unanaesthetized mutant mice exhibited greater respiratory responses during 21 and 12 % O2 than the wild-type controls. Respiratory responses were associated with significant decreases in oxygen consumption in both groups of mice, and the magnitude of change was greater in mutant than wild-type mice. Changes in CO2 production and body temperature, however, were comparable between both groups of mice.
Similar augmentation of respiratory responses during hypoxia was also observed in anaesthetized mutant mice. In addition, five of the fourteen mutant mice displayed periodic oscillations in respiration (brief episodes of increases in respiratory rate and tidal phrenic nerve activity) while breathing 21 and 12 % O2, but not during 100 % O2. The time interval between the episodes decreased by reducing inspired oxygen from 21 to 12 % O2.
Changes in arterial blood pressure and arterial blood gases were comparable at any given level of inspired oxygen between both groups of mice, indicating that changes in these variables do not account for the differences in the response to hypoxia.
Respiratory responses to brief hyperoxia (Dejours test) and to cyanide, a potent chemoreceptor stimulant, were more pronounced in mutant mice, suggesting augmented peripheral chemoreceptor sensitivity.
cGMP levels were elevated in the brainstem during 21 and 12 % O2 in wild-type but not in mutant mice, indicating decreased formation of nitric oxide in mutant mice.
The magnitude of respiratory responses to hypercapnia (3 and 5 % CO2 balanced oxygen) was comparable in both groups of mice in the awake and anaesthetized conditions.
These observations suggest that the hypoxic responses were selectively augmented in mutant mice deficient in NOS-1. Peripheral as well as central mechanisms contributed to the altered responses to hypoxia. These results support the idea that nitric oxide generated by NOS-1 is an important physiological modulator of respiration during hypoxia.
It is being increasingly recognized that endogenously generated nitric oxide (NO) is associated with many biological functions including vasodilatation, platelet inhibition, immune responses, cell adhesion and neurotransmission (Moncada et al. 1991; Faraci & Brian, 1994; Jaffrey & Snyder, 1995). Recent studies also suggest that NO is involved in the control of breathing during hypoxia and hypercapnia. Previous studies by us (Prabhakar et al. 1993) and by others (Wang et al. 1993, 1994; Grimes et al. 1995) have documented the presence of nitric oxide synthase (NOS), the enzyme responsible for generating NO, in the carotid bodies. These peripheral sensory organs mediate the majority of the respiratory responses to hypoxia. In the chemoreceptor tissue, NOS is localized primarily in the nerve fibres innervating the glomus tissue and to some extent in the blood vessels (Prabhakar et al. 1993; Wang et al. 1993; Hohler et al. 1994; Grimes et al. 1995). Furthermore, neurons of the nucleus of solitarii tract (NTS), which integrate the afferent inputs from the carotid bodies, also contain NOS (Vincent & Kimura, 1992; Haxhiu et al. 1995). In addition, there is some evidence for the presence of NOS in the neurons near the ventral surface of the medulla, the purported site for central chemoreceptors responsible for increasing respiration during hypercapnia (Iadecola et al. 1993; Prabhakar et al. 1995). From these studies it is evident that NOS is present in peripheral and central neuronal structures that are associated with the control of breathing during hypoxia and hypercapnia.
Physiological studies have shown that inhibitors of NOS affect the respiratory responses to hypoxia. For example, respiratory responses to hypoxia are potentiated following systemic administration of NOS inhibitors (Gozal et al. 1996b). This potentiation appears to be due to the actions of NOS inhibitors at both the carotid bodies and at the central neurons in the NTS. Inhibitors of NOS augment the sensory discharge of the carotid bodies (Prabhakar et al. 1993; Wang et al. 1994; Chugh et al. 1994; Sun & Reis, 1994), suggesting that NO exerts an inhibitory influence on carotid body activity. The inhibitory actions of NO seem in part to be due to its action on type I cells as well as to dilatation of blood vessels in the carotid body resulting in improved oxygenation. Microinjections of NOS inhibitors in the NTS neurons, on the other hand, attenuate the respiratory stimulation during hypoxia (Ogawa et al. 1995).
In contrast to the effects on the responses to hypoxia, the effects of NOS inhibitors on respiratory response to CO2 are less certain. Teppema et al. (1997) reported potentiation of the hypercapnic response after systemic NOS inhibition in cats, whereas Gozal et al. (1996b) found no effect of NOS inhibitors on the ventilatory response to CO2 in rats. These observations, taken together, suggest that NO generated by NOS regulates respiration during hypoxia and probably during hypercapnia.
Two isoforms of NOS, neuronal (NOS-1) and endothelial (NOS-3), are constitutively expressed in many cells including neurons (Jaffrey & Snyder, 1995, for references). Under physiological conditions, these two isoforms are primarily responsible for endogenous generation of NO. Interestingly, the biological effects of NO seem to depend on the source of its production. For example, during focal cerebral ischaemia, NO generated by NOS-1 has been shown to exert a toxic effect on neurons, whereas NO produced by NOS-3 confers toxic resistance to neurons (Huang et al. 1994). Whether the modulatory effects of endogenously generated NO on respiratory responses to hypoxia and/or to hypercapnia also depend on the source of NO production, however, is not known.
Much of the information on the role of endogenous NO in the control of breathing has come from observations using various NOS inhibitors. However, most of the NOS inhibitors cannot distinguish between the NOS-1 and NOS-3 isoforms. Recently, Huang et al. (1993) developed transgenic mice with targeted disruption of the NOS-1 isoform. These investigators cloned and mapped the mouse NOS-1 gene, and disrupted its function by replacing the first exon with a neomycin-resistant gene. The mutant mice are viable and have no histopathological abnormalities in the central nervous system (Huang et al. 1993). These mutant mice, deficient in NOS-1, offer an excellent animal model for assessing the physiological importance of NO generated by NOS-1. In the present study, we examined the respiratory responses to hypoxia and hypercapnia in NOS-1-deficient mice and compared them with the responses from age-matched wild-type (WT) mice. Our results show that the respiratory response to hypoxia is selectively altered in mutant mice deficient in NOS-1, relative to WT mice, and this effect appears to be due to enhanced sensory drive from peripheral chemoreceptors as well as decreased NO generation in the brainstem.
METHODS
General preparation of animals
Experiments were approved by the Institutional Animal Care and Use Committee of Case Western Reserve University and were performed on age-matched wild-type (WT) mice and NOS-1 mutant mice of either sex. The average weights of the animals were 22.6 ± 0.6 g for WT mice and 20.5 ± 0.5 g for mutant mice (P > 0.05, ANOVA). The NOS-1 mutant mice, a crossbreed between the 129/SV and C57BL/6 mouse strains, were developed as previously described (Huang et al. 1993). In the present study, hybrids of 129/SV and C57BL/6 strains of mice, which contained the NOS-1 protein, were used as WT controls. Experiments were performed on awake, unrestrained animals as well on anaesthetized mice.
Animals were anaesthetized with intraperitoneal injections of urethane (1.2 g kg−1, Sigma). The choice of urethane was based on the reports that acid-base status is well maintained in experimental animals (Buelke-Sam et al. 1978). Supplemental doses of anaesthesia were given when corneal reflexes and responses to toe pinch persisted. In anaesthetized animals, routine surgical procedures included tracheal intubation and catheterization of abdominal aorta and inferior vena cava near the iliac region. Care was taken that blood flow to major organs such as liver and kidney was not compromised. The aortic catheter was used to monitor arterial blood pressure and sample arterial blood for the analysis of blood gases. Systemic administration of fluids and/or drugs was accomplished through a catheter placed in the vena cava. Animals were allowed to breathe spontaneously. Core body temperature was monitored by a rectal thermistor probe and maintained at 37 ± 1°C by a heating pad. At the end of the experiment, the animals were killed by intracardiac injection (0.1 ml) of euthanasia solution (Beuthanasia-D Special, Schering-Plough Animal Health, Kenilworth, NJ, USA).
Measurements of respiratory variables
In unanaesthetized animals, respiration was monitored by a whole body plethysmograph originally described by Bartlett & Tenney (1970) and modified by Thomas et al. (1992). Animals were placed in a Lucite chamber (600 ml volume) containing an inlet port for the administration of test gases and an outlet port connected to a vacuum sufficient to create a flow of 300 ml min−1 through the chamber, as measured by a rotameter. The chamber was connected to one side of a pressure transducer (Valydine MP45, Validyne Engineering Corp., Northridge, CA, USA), with a sensitivity of ±2.25 cmH2O, and to a reference chamber of equal volume. As the animal breathed, small changes in pressure were converted to a signal representing tidal volume (Bartlett & Tenney, 1970). The respiratory signals were amplified (BMA 830, CWE Inc., Ardmore, PA, USA) and recorded on a strip chart recorder (Dash 10, Astro-Med, Inc., West Warwick, RI, USA). The signals were also stored in a computer with respiratory acquisition software (BGPLOT, Cleveland, OH, USA). Oxygen consumption (V̇O2) and carbon dioxide production (V̇CO2) were determined by the open-circuit method (Schlenker & Farkas, 1995) using Beckman OM-14 and LB-2 analysers. Body temperature was measured using an implantable temperature transponder (BioMedic Data Systems, Seaford, DE, USA).
In anaesthetized animals, integrated efferent phrenic nerve activity was monitored as an index of central respiratory neuronal output. For this purpose, the phrenic nerve was isolated unilaterally at the level of the C3 and 4 spinal segments. The nerve was cut distally and placed on bipolar stainless steel electrodes. The electrical activity was filtered (band pass 0.3-1.0 kHz), amplified and passed through Paynter filters (time constant 100 ms; CWE, Inc.) to obtain a moving average signal.
Analysis of NOS protein by immunoblot analysis
Brain tissues were removed from anaesthetized WT and mutant mice and homogenized in buffer containing 0.1 M NaCl, 0.01 M Tris-Cl (pH 7.6), 0.001 M EDTA (pH 8.0), 1 μg ml−1 aprotinin, 1 μg ml−1 pepstatin, 1 μg ml−1 leupeptin and 100 μg ml−1 phenylmethylsulphonyl fluoride (PMSF). After a 14 000 ×g spin for 15 min at 4°C, soluble proteins (100 μg) were separated on a non-reducing 6 % SDS-PAGE gel and stained with Coomassie Blue. For Western blots, separated proteins were transferred at 40 V m−2 for 2 h at 20°C to an Imobilon membrane (Millipore) using a Bio-Rad apparatus. After transfer, the membrane was blocked overnight at 4°C in 5 % BSA, 0.1 % Tween 20, and 20 mM Tris-buffered saline, pH 7.6 (TBS-T). The membrane was incubated with a primary antibody directed against NOS-1 (Transduction Laboratories, Lexington, KY, USA) for 1 h at 25°C, and washed three times in TBS-T for 5 min each. The membrane was incubated for 1 h in TBS-T plus 1 % BSA with goat anti-rabbit secondary antibody conjugated with HRP, washed three times for 5 min in TBS-T, detected with an enhanced chemiluminescence (ECL) detection system (Amersham) and exposed to Kodak XAR film.
Measurements of cGMP levels by radioimmunoassay
Anaesthetized mice (n = 9 each of WT and mutant mice) were exposed to 100, 21 or 12 % inspired oxygen for 5 min. At the end of the gas challenge, brainstems were removed and placed in 50 mM sodium acetate (pH 4.0), frozen in liquid nitrogen and kept at -80°C until further analysis. Tissues were homogenized in 0.75 ml sodium acetate and the homogenate was centrifuged at 10 000 ×g for 15 min at 4°C. cGMP levels were determined in 200 μl of supernatant by radioimmunoassay (RIA) as previously described (Chang et al. 1990). Briefly, cGMP was acetylated with 10 μl triethanolamine : acetic anhydride (2 :1), and then incubated with a primary antibody against cGMP (1: 5000 dilution) and [125I] cGMP (tracer) overnight. Bound fractions of cGMP were precipitated with ice-cold isopropanol and γ-globulin, and spun at 3000 ×g for 30 min. The supernatant was decanted and the pellet was dried and counted. Protein was assayed using a protein analysing kit (Bio-Rad Technologies) with bovine serum albumin (BSA) as standard. All assays were in duplicate and the values of cGMP are expressed as femtomoles per milligram of protein.
Experimental protocols
Series I: unanaesthetized mice
In the experiments involving unanaesthetized mice, all measurements were made between 09.00 and 12.30 h. Animals were placed in the plethysmograph chamber containing aspen bedding and allowed to acclimate to the environment for 60 min while room air flowed through the chamber. Subsequently, animals were challenged with varying levels of inspired O2 or CO2 as described below. In the first group of experiments, mice (n = 8 each of WT and mutant mice) were exposed to 100, 21 and 12 % O2 balanced nitrogen. Each gas challenge was given for 5 min. The protocols were repeated three times in each animal, with a 20 min interval between each protocol. O2 consumption, CO2 production and body temperature were measured at the end of each 5 min gas challenge. Respiratory responses to hyperoxic hypercapnia were determined in the second group of experiments (n = 12 WT, n = 9 mutant). Mice were allowed to breathe 100 % O2 for 5 min followed by 3 and 5 % CO2 balanced oxygen. The protocols were repeated three times, with a 20 min interval between each protocol.
Series II: anaesthetized mice
The effects of three levels of inspired oxygen (100, 21 and 12 % O2 balanced nitrogen) on efferent phrenic nerve activity and arterial blood pressure were determined in anaesthetized, spontaneously breathing mice (n = 14 each of WT and mutant mice). Baseline respiratory activity was monitored while the animals breathed 100 % O2. Subsequently, inspired gas was switched to 21 % O2 followed by 12 % O2. Each gas challenge was maintained for 5 min unless otherwise stated (see results with WT mice). Following 12 % O2, inspired air was switched back to 100 % O2. Gases were administered through a needle placed near the tracheal cannula and gas flow was controlled by a flow meter. Efferent phrenic nerve activity (integrated and raw action potentials) was recorded along with arterial blood pressure.
Mice have an average blood volume of 5.85 ml (100 g body weight)−1 (Jacoby & Fox, 1984). As a consequence, the blood volume of an average mouse weighing 20 g is approximately ∼1.2 ml. Due to this fact, in a given experiment, repeated withdrawal of arterial blood (200 μl per sample) was found to be lethal to the animal. Therefore, arterial blood gases were analysed at the end of each gas challenge in parallel experiments on WT (n = 16) and mutant (n = 19) mice. Arterial blood PO2, PCO2, and pH were analysed by a blood gas analyser (Laboratory Instruments).
The effects of hypercapnia on efferent phrenic activity were examined in another series of experiments (n = 7 each of WT and mutant mice). Baseline respiration was recorded for 5 min while the animals breathed 100 % O2. Hypercapnic challenge was induced by switching inspired gas to hyperoxic hypercapnic gas mixtures, i.e. 3 % followed by 5 % CO2 balanced oxygen. Each gas challenge was maintained for 5 min. Following the gas challenge with 5 % CO2, inspired air was switched back to 100 % O2.
Series III: peripheral chemoreceptor sensitivity
The effects of brief hyperoxic challenge on respiration (Dejours, 1962) were examined on anaesthetized WT (n = 12) and mutant (n = 20) mice. Baseline respiration was recorded during 21 % O2 for 5 min. 100 % O2 was added to the inspired air for 20 s. Respiration (respiratory rate and tidal phrenic activity) was analysed for 30 s during 21 % O2 and during the last 15 s of hyperoxia. Breathing during the initial 5 s of hyperoxia was excluded for analysis because of the dead space of the tubing.
The effects of intravenous administration of NaCN (Fisher Scientific Co.) on respiration was examined in anaesthetized WT and mutant mice (n = 7 of each). Cyanide challenges were performed while the animals breathed 21 % O2. The doses of cyanide were 12.5, 25, 50 and 100 μg kg−1 in 50 μl of saline (0.9 % NaCl) given in random order. The same volume of saline (50 μl) without cyanide served as controls. A 10 min interval was given between doses. Stock solutions of cyanide were prepared fresh in 0.9 % saline before each experiment. Respiration was measured 1 min prior, and 1 min immediately after the injection of NaCN. In four experiments, carotid sinus nerves were identified where they join the glossopharyngeal nerves and sectioned bilaterally during the experiments. Ten minutes after sectioning the sinus nerves, respiratory responses to cyanide (100 μg kg−1) were tested again.
Data analysis
The following variables were analysed in unanaesthetized mice: inspiratory tidal volume (VT, μl), respiratory rate (RR, breaths min−1), minute ventilation (V̇E, ml min−1, inspiratory tidal volume × respiratory rate), O2 consumption (V̇O2, ml min−1), CO2 production (V̇CO2, ml min−1), respiratory quotient (RQ, V̇CO2/V̇O2), and body temperature (Tb). Respiratory variables (respiratory rate and tidal volume) were averaged for fifteen consecutive breaths over 5 min of inspired O2 and CO2 challenge. Tidal volume and minute ventilation were normalized to the body weight of the animal. Sighs or sniffs were excluded in the analysis. Metabolic variables and body temperature were measured at the end of each 5 min inspired O2 challenge. Each data point in a given animal, for a given gas challenge, represents the average of three trials.
In anaesthetized mice, respiratory variables (respiratory rate and amplitude of the integrated phrenic nerve activity) were averaged over a 5 min period of each gas challenge. The following variables were analysed: respiratory rate (RR, number of phrenic bursts min−1), amplitude of the phrenic activity (a.u., arbitrary units), and minute neural respiration (arbitrary units (a.u.) min−1, respiratory rate × amplitude of tidal phrenic nerve activity).
All results are expressed as means ±s.e.m. Student's paired t tests were used to evaluate if each animal responded with significant increases in respiration during 21 and 12 % O2 compared with 100 % O2. Statistical significance of the magnitude of changes between WT and mutant mice was determined by one-way analysis of variance (ANOVA), with Tukey's or Dunn's post hoc test. P values less than 0.05 were considered significant.
RESULTS
Respiratory responses to changes in inspired oxygen
The effects of three levels of inspired oxygen on respiration were examined in awake and anaesthetized mice. In awake animals, in addition to respiration, metabolic variables (i.e. V̇O2, V̇CO2 and RQ) and body temperature were also recorded. In anaesthetized animals, efferent phrenic nerve activity was monitored as an index of respiration along with arterial blood pressure and arterial blood gases.
Respiratory responses in awake animals
An example illustrating the effects of changing inspired oxygen on respiration is shown in Fig. 1A. As can be seen, respiration increased in response to 12 % O2 in both mice. However, the magnitude of increase, especially respiratory rate, was more pronounced in mutant mice. Average results are summarized in Table 1A. In response to 21 % O2, respiration was unaffected in WT mice. Further lowering the inspired oxygen to 12 % O2 resulted in a significant increase in minute ventilation. This increase in respiration was due to increases in respiratory rate as well as tidal volume. In contrast, mutant mice responded with significant increases in minute ventilation during 21 % as well as during 12 % O2. Increases in respiratory rate as well as tidal volume contributed to stimulation of breathing in mutant mice. Comparison between mutant and WT mice revealed that the magnitudes of increases in minute ventilation, tidal volume and respiratory rate during 21and 12 % O2 were significantly greater in mutant than WT mice (Fig. 1B).
Figure 1. Respiratory responses to varying levels of inspired oxygen in unanaesthetized wild-type and mutant mice.
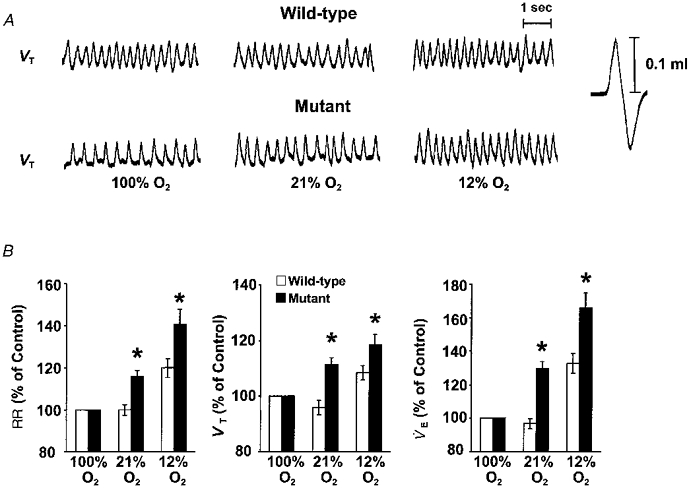
A, representative tracing of respiratory responses to three levels of inspired oxygen in an unanaesthetized, freely moving wild-type and mutant mouse. 100 % O2, 21 % O2 and 12 % O2 indicate inspired oxygen levels. Note the greater increases in respiration in the mutant mouse during 21 and 12 % O2. B, comparison of respiratory responses during 21 and 12 % O2 in wild-type and mutant mice. The results are presented as a percentage of 100 % O2. Data presented as means ±s.e.m. of eight each of wild-type and mutant mice. *P < 0.05 (ANOVA). Note the respiratory responses (RR, VT and V̇E) were greater in mutant than wild-type mice during 21 and 12 % O2.
Table 1.
Changes in respiratory variables in unanaesthetized (A) and anaesthetized (B) wild-type and mutant mice during 100, 21 and 12 % inspired O2
| A. Unanaesthetized | B. Anaesthetized | |||||||
|---|---|---|---|---|---|---|---|---|
| n | 100 % O2 | 21 % O2 | 12 % O2 | n | 100 % O2 | 21 % O2 | 12 % O2 | |
| Respiratory rate (breaths min−1) | Respiratory rate (phrenic bursts min−1) | |||||||
| Wild-type | 8 | 211 ± 5.6 | 210 ± 3.9 | 251 ± 6.9* | 10 | 207 ± 9.1 | 212 ± 6.6 | 165 ± 11.7* |
| Mutant | 8 | 166 ± 2.6 | 192 ± 6.0* | 231 ± 10.1* | 14 | 172 ± 10.3 | 199 ± 7.2* | 187 ± 8.0* |
| VT (μl (g BW)−1) | Amplitude of phrenic activity (a.u.) | |||||||
| Wild-type | 8 | 1.82 ± 0.07 | 1.73 ± 0.06 | 1.96 ± 0.09* | 10 | 1.2 ± 0.1 | 1.7 ± 0.1* | 2.0 ± 0.2* |
| Mutant | 8 | 2.06 ± 0.07 | 2.28 ± 0.07* | 2.43 ± 0.09* | 14 | 1.4 ± 0.1 | 2.3 ± 0.2* | 2.2 ± 0.2* |
| V̇E (ml min−1 (g BW)−1) | Minute neural respiration (a.u. min−1) | |||||||
| Wild-type | 8 | 0.38 ± 0.02 | 0.36 ± 0.02 | 0.50 ± 0.03* | 10 | 230.7 ± 11.2 | 350.3 ± 18.4* | 298.9 ± 24.0* |
| Mutant | 8 | 0.34 ± 0.01 | 0.44 ± 0.02* | 0.57 ± 0.03* | 14 | 247.0 ± 20.8 | 434.9 ± 35.5* | 396.0 ± 37.6* |
Data are means ± s.e.m.
P < 0.05 within each group between control (100 % O2) and 21 or 12 % O2 (paired ttest). BW, body weight.
Changes in O2 consumption, CO2 production and body temperature
It has been well established that hypoxia results in a reduction in oxygen consumption as well as body temperature (Gautier, 1996). To assess whether changes in these variables have contributed to the ventilatory responses to hypoxia, we monitored O2 consumption (V̇O2), CO2 production (V̇CO2) and body temperature during the fifth minute of each inspired oxygen level in the same animals as above. The results are summarized in Table 2. Mutant mice had significantly greater oxygen consumption during 100 % O2 than WT controls. V̇O2 decreased significantly in both groups of mice during 21 and 12 % O2, but the magnitude of decrease was significantly greater in mutant than WT mice (P < 0.05, ANOVA, Fig. 2). On the other hand, V̇CO2was unaffected by lowering the inspired oxygen to 21 and 12 % O2 in WT mice, whereas it decreased significantly in mutant mice during hypoxia (Table 2). The respiratory quotient (RQ) increased nearly to the same levels in both groups of mice during 21 and 12 % O2 (P < 0.05, ANOVA). Body temperature (Tb) tended to decrease in both groups of mice during 12 % O2, but changes were not significant (P > 0.05, paired t test).
Table 2.
Changes in oxygen consumption, carbon dioxide production and body temperature in wild-type and mutant mice during 100, 21 and 12 % inspired O2
| Wild-type | Mutant | |||||
|---|---|---|---|---|---|---|
| 100 % O2 | 21 % O2 | 12 % O2 | 100 % O2 | 21 % O2 | 12 % O2 | |
| V̇O2(ml min−1) | 2.30 ± 0.06 | 1.67 ± 0.07* | 0.9 ± 0.00* | 3.55 ± 0.13 | 1.83 ± 0.12* | 0.83 ± 0.09* |
| V̇CO2(ml min−1) | 1.28 ± 0.11 | 1.22 ± 0.07 | 1.05 ± 0.03 | 1.17 ± 0.06 | 1.29 ± 0.01 | 0.92 ± 0.02* |
| RQ | 0.63 ± 0.01 | 0.74 ± 0.01* | 1.53 ± 0.19* | 0.36 ± 0.05 | 0.72 ± 0.05 | 1.21 ± 0.16* |
| Tb (°C) | 36.95 ± 0.70 | 37.16 ± 0.54 | 36.81 ± 0.49 | 37.52 ± 0.38 | 37.48 ± 0.38 | 36.99 ± 0.48 |
Data are means ± s.e.m. from unanaesthetized mice in Table 1.
P < 0.05 within each group between control (100 % O2) and 21 or 12 % O2 (paired t test).
Figure 2. Comparison of changes in O2 consumption (V̇O2), CO2 production (V̇CO2) and respiratory quotient (RQ) during 21 and 12 % O2 in unanaesthetized wild-type and mutant mice.
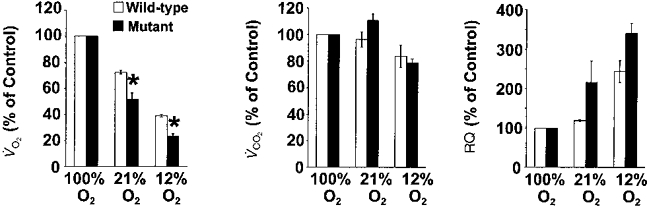
The results are presented as a percentage of 100 % O2. These data are analysed from the same mice as in Fig. 1 and presented as means ±s.e.m.*P < 0.05 (ANOVA). Note that the decrease in V̇O2 was significantly greater in mutant than wild-type mice during 21 and 12 % O2.
Respiratory responses in anaesthetized mice
In general, respiratory responses to changes in inspired oxygen in anaesthetized animals were qualitatively similar to those described in awake animals. A notable difference, however, is that WT mice showed respiratory depression during 12 % O2, whereas mutant mice tolerated hypoxia. Examples depicting the respiratory depression during hypoxia in anaesthetized WT mice, and the lack of such a response in mutant mice, are shown in Fig. 3A. Average results are summarized in Table 1B. Both groups of mice responded with significant increases in respiration during 21 % O2. In WT mice, respiratory stimulation was due to increases in tidal phrenic activity rather than increases in respiratory rate, whereas in mutant mice, increases in both the respiratory rate and the tidal phrenic activity contributed to the increases in respiration. During hypoxia, in four of the fourteen WT mice (29 %) there was apnoea followed by death. Respiration could not be restored in these animals by switching inspired gas to 100 % O2. In the remaining ten animals there was a marked decrease in respiratory rate (Table 1B). In contrast, all fourteen mutant mice tolerated the hypoxic challenge and none of them died. Furthermore, their respiratory rate remained elevated during hypoxia. Comparison of the respiratory responses between both groups of mice indicated that increases in respiratory rate and neural minute respiration during 21 and 12 % O2 were significantly greater in mutant than WT mice (Fig. 3B).
Figure 3. Respiratory responses to varying levels of inspired oxygen in anaesthetized wild-type and mutant mice.
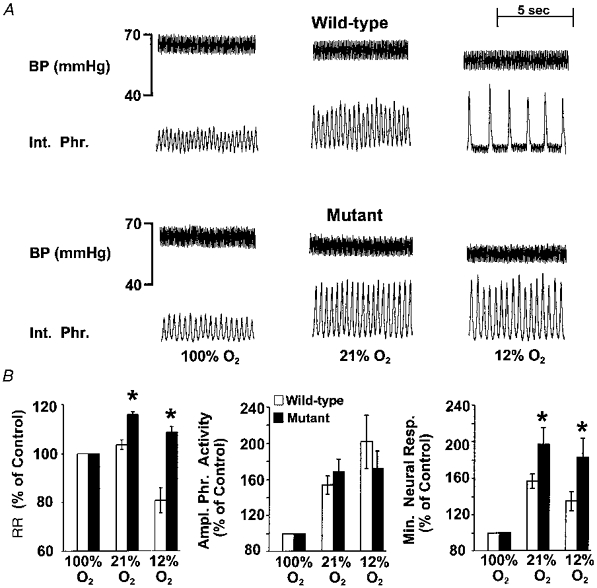
A, representative tracing of an experiment illustrating respiratory responses during 100, 21 and 12 % inspired oxygen in an anaesthetized wild-type and a mutant mouse deficient in NOS-1. BP (mmHg), arterial blood pressure; Int. Phr., integrated efferent phrenic nerve activity. 100 % O2, 21 % O2 and 12 % O2 indicate inspired oxygen levels. Respiration (respiratory rate and amplitude of tidal phrenic activity) increased in response to 21 % O2 in both mice. Respiration was depressed in the WT mouse during 12 % O2, whereas it remained elevated in the mutant mouse. B, comparison of respiratory responses during 21 and 12 % O2 in anaesthetized wild-type and mutant mice. The results are presented as a percentage of 100 % O2. Data presented as means ±s.e.m. of wild-type (n = 10) and mutant (n = 14) mice. *P < 0.05 (ANOVA). Note the respiratory rate (RR) and minute neural respiration (Min. Neural. Resp.) were greater in mutant than wild-type mice during 21 and 12 % O2. Ampl. Phr. Activity, amplitude of phrenic activity.
Respiratory oscillations in mutant mice
In five of the fourteen anaesthetized mutant mice described above we also observed periodic episodes of increases in respiratory rate and tidal phrenic activity during 21 and 12 % O2. Each such episode of breathing lasted only a few seconds and was seen in the absence of changes in blood pressure. An example illustrating this pattern of respiratory behaviour in an anaesthetized mutant mouse is shown in Fig. 4A. As can be seen, periodic increases in respiration were absent while breathing 100 % O2. Furthermore, the time interval between the episodes decreased by reducing the inspired oxygen from 21 to 12 % O2 (Fig. 4B). These episodes of respiratory behaviour were excluded in the analysis of respiratory rate and tidal phrenic nerve activities described above. On the other hand, WT mice did not exhibit this pattern of respiratory behaviour either during 21 or 12 % O2. In awake mice, occurrence of sniffs precluded systematic analysis of such a breathing pattern.
Figure 4. Respiratory oscillations in mutant mice.

A, representative tracing of an experiment illustrating the periodic increases in respiratory rate and tidal phrenic activity during inspired 21 and 12 % O2 in an anaesthetized, spontaneously breathing NOS-1-deficient mouse. BP (mmHg), arterial blood pressure; Int. Phr., integrated phrenic nerve activity; Raw Phr., action potentials recorded from the efferent phrenic nerve. 100 % O2, 21 % O2 and 12 % O2 indicate inspired oxygen levels. Note the periodic increases in respiratory rate during 21 and 12 % O2 breathing but not during 100 % O2. Because of the marked increases in respiratory rate, the integrator was not able to reset back to baseline. The oscillatory changes in respiration could be seen in the absence of oscillations in blood pressure. B, average data of the time interval between oscillations during two levels of inspired oxygen. Data presented are means ±s.e.m. from 5 mutant mice. *P < 0.05 (paired t test).
Changes in arterial blood pressure and blood gases
The changes in arterial blood pressure were analysed during three levels of inspired oxygen in both groups of mice and the results are summarized in Table 3A. Basal arterial blood pressure was comparable in both groups of mice (100 % O2 WT vs. mutant mice, P > 0.05, ANOVA). Arterial blood pressure decreased in both groups of mice during 21 and 12 % O2, but the magnitude of the change was not significantly different (P > 0.05, ANOVA). As can be seen from Table 3B, at any given level of inspired oxygen, changes in arterial PO2 and PCO2 were comparable between both groups of animals. One exception is that arterial pH during 100 % O2 was 0.064 units lower in mutant than WT mice.
Table 3.
Changes in arterial blood pressure and arterial blood gases during 100, 21 and 12 % inspired O2 in anaesthetized wild-type and mutant mice
| Wild-type | Mutant | |||||
|---|---|---|---|---|---|---|
| 100 % O2 | 21 % O2 | 12 % O2 | 100 % O2 | 21 % O2 | 12 % O2 | |
| A. Arterial blood pressure | ||||||
| BP (mmHg) | 42.4 ± 3.4 | 38.9 ± 3.3 | 33.1 ± 2.8 | 49.5 ± 5.3 | 43.8 ± 2.2 | 35.8 ± 2.4 |
| n | 10 | 10 | 10 | 14 | 14 | 14 |
| B. Arterial blood gas composition | ||||||
| PO2 (mmHg) | 237.0 ± 23.4 | 106.3 ± 6.3 | 73.7 ± 2.3 | 241.7 ± 24.4 | 107 ± 3.2 | 75.0 ± 7.1 |
| PCO2 (mmHg) | 23.1 ± 1.8 | 28.7 ± 1.8 | 24.5 ± 3.1 | 27.1 ± 1.7 | 26.2 ± 3.4 | 23.2 ± 1.9 |
| pH | 7.313 ± 0.02 | 7.27 ± 0.07 | 7.323 ± 0.02 | 7.249 ± 0.01* | 7.38 ± 0.15 | 7.292 ± 0.02 |
| n | 6 | 5 | 5 | 5 | 9 | 5 |
Data are means ± s.e.m.
P < 0.05 between wild-type and mutant mice (ANOVA).
Peripheral chemoreceptor sensitivity in mutant and WT mice
The results described thus far indicate that mutant mice exhibit enhanced respiratory responses to hypoxia. As NO is inhibitory to the carotid body activity (Prabhakar et al. 1993), the altered responses during hypoxia in mutant mice may in part be due to changes in peripheral chemoreceptor sensitivity. In order to assess this possibility the following experiments were performed on anaesthetized mice.
Effects of brief hyperoxia on respiration
It has been well documented that brief inhalation of 100 % O2 (∼30 s) decreases respiration, especially the respiratory rate (Dejours, 1962). This reduction in respiration elicited by brief hyperoxia has been attributed to decreased chemosensory drive from the carotid bodies (Dejours, 1962). Therefore, the magnitude of respiratory depression during hyperoxia is commonly used as an index of peripheral chemoreceptor sensitivity. If carotid body sensitivity is altered in NOS-1-deficient mice, it should be reflected in the magnitude of decrease in the respiratory rate during hyperoxia. To test this possibility, we compared the respiratory responses to brief hyperoxia in mutant and WT mice; 100 % O2 was added to the inspired air for 20 s while the animals breathed room air. As shown in Fig. 5A, hyperoxia resulted in a prompt reduction in respiratory rate in both mice. However, the decrease was more pronounced in mutant mice. Average results showed that respiratory rate decreased by 15 ± 1 % in mutant mice, whereas in WT mice it was 11 ± 2 % (WT vs. mutant mice; P < 0.05; ANOVA, Fig. 5B). Changes in the tidal phrenic nerve activity and minute neural respiration, however, were not significant during brief hyperoxia in both groups of mice (P > 0.05, ANOVA).
Figure 5. Respiratory responses to brief hyperoxia in anaesthetized wild-type and mutant mice.

A, representative tracing of an experiment illustrating the effect of brief hyperoxia (Dejours test) on efferent phrenic nerve activity in an anaesthetized, spontaneously breathing wild-type and mutant mouse. Int. Phr., integrated efferent phrenic nerve activity. Animals breathed room air. At arrow, 100 % O2 was added to the inspired air. 100 % O2 caused prompt decreases in respiration in both types of mice, but the response was more pronounced in mutant mice. B, average data for changes in respiratory responses. Respiratory variables were analysed during the last 15 s of hyperoxia (for details see text). Changes in respiratory variables are presented as a percentage of 21 % O2 controls. Data presented are means ±s.e.m. from 12 wild-type and 20 mutant mice. *P < 0.05 (ANOVA). Note the greater decreases in respiratory rate by hyperoxia in NOS-1-deficient mice.
Effects of sodium cyanide on respiration
In another series of experiments, we analysed the respiratory responses to different doses of sodium cyanide (NaCN), a potent stimulant of the carotid body, in mutant and WT mice. As shown in Fig. 6A, cyanide-induced respiratory stimulation was more pronounced in the mutant mouse. Average results showed that respiration was stimulated by cyanide in both groups of mice in a dose-dependent manner. Administration of the same volume of saline (i.e. vehicle), however, had no effect on respiration. Bilateral sectioning of the sinus nerves abolished the respiratory responses to NaCN (100 μg kg−1; n = 4), as well as to hypoxia, implying that the carotid bodies are responsible for respiratory stimulation induced by cyanide and hypoxia. Analysis of the respiratory response to cyanide showed that increases in respiratory rate and neural minute respiration resulting from 50 and 100 μg kg−1 cyanide were significantly greater in mutant than WT mice (P < 0.05; ANOVA, Fig. 6B).
Figure 6. Respiratory responses to sodium cyanide in anaesthetized wild-type and mutant mice.
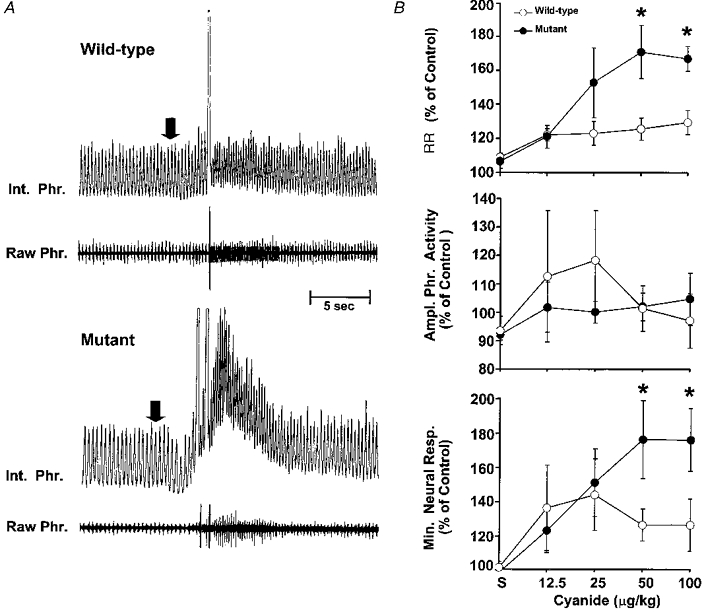
A, representative tracing of an experiment illustrating the effect of systemic administration of sodium cyanide on efferent phrenic nerve activity in anaesthetized, spontaneously breathing wild-type and NOS-1 deficient mice. Cyanide (50 μg kg−1i.v.) was injected at the arrow. Raw Phr., action potentials recorded from efferent phrenic nerve activity; Int. Phr., integrated phrenic nerve activity. NaCN caused prompt increases in respiration in both mice, but the response was more pronounced in mutant mice. Because of the marked increases in respiratory rate, the integrator was not able to reset back to baseline. B, average data for changes in respiratory variables. Results are presented as a percentage of pre-injection controls. ‘S’ denotes respiratory changes after saline (vehicle) injection. Data presented as means ±s.e.m. from 7 animals in each group. *P < 0.05 (ANOVA). Note the enhanced responses in respiratory rate and neural minute respiration at 50 and 100 μg kg−1 cyanide in mutant mice.
Analysis of cGMP levels and NOS-1 protein in the brainstem
Previous studies have indicated that NO modulates breathing during hypoxia by acting at brainstem neurons (Ogawa et al. 1995). The following experiments were performed to assess whether the augmented respiratory response to hypoxia seen in mutant mice was due to alterations in NO production in brainstem. It has been well established that NO increases cGMP levels by activating the enzyme soluble guanalyl cyclase (Bredt & Snyder, 1989). Given that NOS is present in the brainstem neurons, we reasoned that changes in cGMP levels should reflect NO generation in the brainstem. Therefore, we monitored cGMP levels in brainstem extracts as an index of endogenous NO production. Brainstems were removed from anaesthetized WT and mutant mice exposed to three levels of inspired oxygen for 5 min and cGMP levels were analysed in tissue extracts by radioimmunoassay as described in Methods. In WT mice there was a progressive increase in cGMP levels on reducing inspired oxygen to 21 and 12 % O2 (compared with 100 % O2, P < 0.05; paired t test, Fig. 7A). In contrast, in mutant mice, cGMP levels remained fairly constant during 21 and 12 % O2 (compared with 100 % O2, P > 0.05, paired t test). Western blot assay revealed no detectable NOS-1 protein in the brainstem extracts from mutant mice, whereas it could readily be detected in WT mice (Fig. 7B). These results suggest that NO generation is markedly impaired in the brainstem in mutant mice during hypoxia.
Figure 7. cGMP and Western blot analysis in wild-type and mutant mice.

A, analysis of cGMP levels in brainstem during three levels of inspired oxygen, i.e. 100, 21 and 12 % O2, in wild-type and mutant mice. Data presented as means ±s.e.m. from 9 animals in each group. Note the increases in cGMP levels during 21 and 12 % O2 in wild-type (WT) mice (P < 0.05, paired t test), whereas they remained fairly constant in mutant mice (P > 0.05, paired t test). B, representative autoradiogram illustrating the absence of NOS-1 protein in tissue extracts of the brainstem from mutant mice. NOS-1 protein was analysed in the brainstem extracts by Western blot analysis using an antibody directed against NOS-1. The antibody recognizes the 155 kDa NOS-1 protein. Rat pituitary lysate was used as a positive control (Control). Note the presence of the NOS-1 protein in WT mice, but not in mutant mice.
Respiratory responses to hypercapnia
To assess whether the alterations in respiratory responses are confined to low oxygen or if they extend to hypercapnic stimulus, respiratory responses to 3 and 5 % CO2 balanced O2 were recorded in both awake and anaesthetized mice. Minute ventilation increased significantly in response to 3 % and 5 % CO2 in awake mutant and WT mice. These increases in respiration were due to increases in respiratory rate as well as tidal volume (Table 4A). On the other hand, anaesthetized animals (both WT and mutant mice) responded with increases in respiratory rate only during hypercapnia. As a consequence, overall changes in minute ventilation were not significant in both groups of anaesthetized mice (Table 4B). As shown in Fig. 8, the magnitude of respiratory responses to hypercapnia was the same in both awake and anaesthetized groups of mice (P > 0.05, ANOVA).
Table 4.
Changes in respiratory variables in unanaesthetized (A) and anaesthetized (B) wild-type and mutant mice during 100 % O2 and 3 % and 5 % CO2 balanced O2
| A. Unanaesthetized | B. Anaesthetized | |||||||
|---|---|---|---|---|---|---|---|---|
| n | 100 % O2 | 3 % CO2 | 5 % CO2 | n | 100 % O2 | 3 % CO2 | 5 % CO2 | |
| Respiratory rate (breaths min−1) | Respiratory rate (phrenic bursts min−1) | |||||||
| Wild-type | 12 | 211 ± 10.1 | 244 ± 11.6* | 278 ± 12.9* | 7 | 218 ± 17.5 | 233 ± 15.0* | 231 ± 16.3* |
| Mutant | 9 | 195 ± 11.5 | 216 ± 11.7 | 272 ± 13.7* | 7 | 162 ± 10.9 | 171 ± 10.6* | 181 ± 9.0* |
| VT (μl (g BW)−1) | Amplitude of phrenic activity (a.u.) | |||||||
| Wild-type | 12 | 1.81 ± 0.13 | 2.36 ± 0.17* | 2.67 ± 0.17* | 7 | 1.3 ± 0.1 | 1.5 ± 0.2 | 1.9 ± 0.5 |
| Mutant | 9 | 2.04 ± 0.11 | 2.62 ± 0.09* | 3.05 ± 0.18* | 7 | 1.7 ± 0.2 | 1.7 ± 0.2 | 1.9 ± 0.3 |
| V̇E (ml min−1 (g BW)−1) | Minute neural respiration (a.u. min−1) | |||||||
| Wild-type | 12 | 0.40 ± 0.04 | 0.57 ± 0.05* | 0.74 ± 0.04* | 7 | 272.2 ± 33.1 | 351.7 ± 57.3 | 450.9 ± 131.9 |
| Mutant | 9 | 0.39 ± 0.02 | 0.56 ± 0.04* | 0.84 ± 0.09* | 7 | 282.4 ± 43.8 | 296.9 ± 35.2 | 353.1 ± 58.4 |
Data are means ± S.E.M.
Pvalues < 0.05 within each group between control (100 % O2) and 3 or 5 % CO2 (paired t test).
Figure 8. Comparison of hypercapnic (3 and 5 % CO2 balanced oxygen) respiratory responses in unanaesthetized (A) and anaesthetized (B) wild-type and mutant mice.
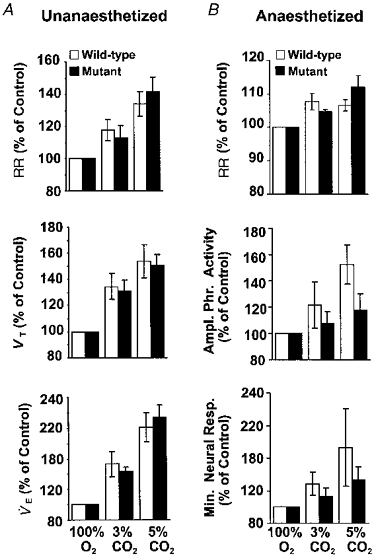
The results are presented as percentage of 100 % O2. A, in unanaesthetized mice, data are presented as means ±s.e.m. of 12 wild-type and 9 mutant mice. B, in anaesthetized mice, data are presented as means ±s.e.m. of 7 of each group. Note the magnitude of increase in respiratory variables in unanaesthetized and anaesthetized mice was similar in both groups of mice (P > 0.05, ANOVA).
DISCUSSION
In the present study, we examined the role of endogenous NO generated by the neuronal isoform of NOS (NOS-1) in the control of respiration during hypoxia and hypercapnia. For this purpose we used mutant mice deficient in NOS-1. The advantage of using mutant mice over pharmacological inhibition of NOS activity is that it allows the study of NO produced by NOS-1 only, independently of other NOS isoforms. Our results provide evidence that NO derived from NOS-1 modulates respiration during hypoxia, but not during hypercapnia. Further, the results provide evidence for enhanced peripheral chemoreceptor sensitivity in mutant mice.
Respiratory responses to hypoxia are augmented in mutant mice
The advantages of studying awake as well as anaesthetized mice are that the former alleviates the effects anaesthesia may have on breathing, as well as allowing us to monitor changes in body metabolism and temperature, which are known to occur during hypoxia (Frappell et al. 1992; Gautier, 1996). On the other hand, because of technical difficulties, changes in blood pressure and blood gases could not be monitored in this preparation and this was accomplished in the anaesthetized animal.
It is clear from the results from both types of preparations that mutant mice exhibited significantly greater respiratory responses during 21 and 12 % O2 than WT control mice. Neither the changes in body temperature nor arterial blood pressure nor blood gases seem to account for the augmented respiratory response to hypoxia, because changes in these variables were comparable in both groups of mice. Furthermore, the PO2 and PCO2 obtained in the present study were comparable with those reported by other investigators in anaesthetized mice (Lahiri, 1975; Siemann et al. 1980). Significant differences in body metabolism, especially V̇O2 during 21 and 12 % O2, were noticed between WT and mutant mice. V̇O2 decreased in both groups of mice on changing the inspired oxygen from 100 % to 21 and 12 % O2. However, the magnitude of decrease was significantly greater in mutant mice. Since the increases in V̇E were also greater in mutant mice during 21 and 12 % O2, the ratio of V̇E:V̇O2 is expected to be substantially higher in mutant mice under these conditions. This suggests that the increases in the ventilatory response to 21 and 12 % O2 in mutant mice is much more substantial than the observed increases in V̇E alone.
Evidence for enhanced peripheral chemoreceptor sensitivity in mutant mice
Peripheral chemoreceptors, especially the carotid bodies, are necessary for stimulation of breathing during hypoxia. It is now well established that NOS-1 is present in the carotid body (Prabhakar et al. 1993; Wang et al. 1993; Grimes et al. 1995) and NO is inhibitory to the chemosensory activity (Prabhakar et al. 1993; Wang et al. 1994; Chugh et al. 1994; Trzebski et al. 1995). Since mutant mice are deficient in NOS-1, it is conceivable that NO production in the carotid body is either markedly reduced or absent. As a consequence, it is to be expected that the carotid body sensitivity will be enhanced in mutant mice. The following lines of evidence suggest that carotid body sensitivity is indeed increased in mutant mice. Firstly, the magnitude of respiratory depression caused by brief hyperoxia (i.e. the Dejours test) is more pronounced in mutant mice. Secondly, mutant mice have significantly greater respiratory responses to cyanide, a potent carotid body stimulant.
Gozal et al. (1996a) reported that respiratory responses to cyanide were unaffected following systemic administration of S-methyl-l-thiocitrulline (SMTC), a putative NOS-1 blocker, whereas Nω-nitro-l-arginine methyl ester (l-NAME), which inhibits all three isoforms of NOS, potentiated the cyanide response. Based on these results, Gozal et al. (1996a) suggested that NO derived from NOS-1 may not function as an inhibitory messenger in the carotid body. However, our results showed a clear potentiation of cyanide responses in mutant mice. It may be that the relative contribution of NOS-1-derived NO may vary from rats to mice. Alternatively, acute effects of NOS-1 blockade may differ from chronic deficiency of NOS-1.
Evidence for impaired NO production in the brainstem during hypoxia in mutant mice
Previously, Ogawa et al. (1995) reported that l-citrulline levels in the brainstem increase during hypoxia in awake rats, and NOS inhibitors attenuate the ventilatory stimulation during hypoxia. Based on these results, these authors concluded that NO acting at the central neurons stimulates breathing in awake rats. Our findings that cGMP levels (index of NO production) are increased during hypoxia in WT mice are consistent with the notion that hypoxia increases NO generation in the brainstem neurons. In contrast to the results in WT mice, cGMP levels during hypoxia were unaffected in mutant mice. The fact that NOS-1 protein is absent in mutant mice suggests that NO generation during hypoxia is impaired. These results suggest that NO from NOS-1 may function as an inhibitory chemical messenger in the brainstem neurons. Such a notion seem supported by studies from Vitagliano et al. (1996) who reported that microinjections of NO donors (sodium nitroprusside (SNP) and 3-morpholinosydnonimine (SIN-1)) into the NTS neurons inhibits breathing in a dose-dependent manner. Thus our results with mutant mice do not support the idea that NO is an excitatory chemical messenger in the brainstem neurons during hypoxia as suggested by Ogawa et al. (1995). The lack of inhibitory effects of NO peripherally, at the carotid body chemoreceptors, and centrally, in the brainstem neurons, contributed to the augmented respiratory response to hypoxia seen in mutant mice.
Respiratory oscillations in mutant mice
It is interesting to note that mutant mice deficient in NOS-1 displayed periodic oscillations in respiratory activity and this pattern of breathing was enhanced during hypoxia (Fig. 4). Cherniack et al. (1978) proposed that breathing instability may appear whenever controller gain is increased sufficiently due to increased chemoreceptor drive, and/or by damping the controller system. Our results suggest that carotid body sensitivity is enhanced in mutant mice. Thus, the respiratory oscillations in mutant mice may in part be due to increased peripheral chemoreceptor sensitivity, i.e. controller gain. Such a notion is further supported by the finding that respiratory oscillations were absent during 100 % O2, which is known to reduce peripheral chemoreceptor activity. In addition, Ogawa et al. (1995) suggested that NO might contribute to the stabilization of ventilation via its action on the brainstem neurons associated with the integration of afferent information from the peripheral chemoreceptors (controller). Thus, increased chemoreceptor sensitivity (increased controller gain), as well as altered activity of NTS neurons (controller), may have contributed to the respiratory oscillations in mutant mice.
NO derived from NOS-1 in CO2 chemoreception
Unlike hypoxia, hypercapnic respiratory responses were found to be comparable in mutant and WT mice in awake and anaesthetized conditions. In the latter preparation, hypercapnic responses were relatively modest perhaps due to depressant effects of anaesthesia. Our findings are consistent with those by Gozal et al. (1996b) who reported that respiratory responses to CO2 were unaffected by NOS inhibitors. It is well established that respiratory responses to CO2 are primarily mediated by central chemoreceptors located near the ventral surface of medulla oblongata (Loeschcke, 1982). Whether NO derived from NOS-1 plays a role in CO2 chemoreception at the central chemoreceptors, however, needs further investigation. Nonetheless, it is clear from the present results that the respiratory response to hypoxia, but not to hypercapnia, is selectively affected in mice deficient in NOS-1.
Physiological significance of NOS-1-generated NO
How might NOS-1 contribute to the control of breathing during hypoxia? It has long been postulated that a haem-containing protein(s) are involved in sensing arterial blood oxygen. Relevant to this idea is the fact that the NOS-1 enzyme is a haem-containing protein and molecular oxygen is essential for its activity (Leone et al. 1991). We have previously reported that NOS activity in the carotid bodies is markedly reduced during hypoxia (Prabhakar et al. 1993) and Rengasamy & Johns (1991) obtained similar results in brain extracts. Furthermore, NOS-1 has been shown to have the highest Km value for oxygen compared with the other NOS isoforms (Rengasamy & Johns, 1996), suggesting that NOS-1 is most sensitive to oxygen. In addition, Abu-Soud et al. (1996) recently made a detailed biochemical analysis of NOS-1 with regard to its sensitivity to oxygen. These investigators provided evidence that NO synthesis from NOS-1 is coupled to physiological oxygen concentrations. The fact that the respiratory responses to hypoxia are selectively altered in NOS-1-deficient mice is consistent with the idea that NO derived from NOS-1 plays an integral role in the respiratory response to hypoxia, acting peripherally at the sensor (carotid body) as well as centrally at the brainstem neurons.
In summary, the results of the present study demonstrate that respiratory responses to low oxygen are selectively augmented in mutant mice deficient in NOS-1, suggesting that NO generated by NOS-1 is an important physiological modulator of respiration during hypoxia. Our observations further suggest that NOS-1-deficient mice offer an excellent animal model to delineate the role of NO generated from NOS-1 in the regulation of respiration.
Acknowledgments
We are grateful to Drs Daniel R. D. Premkumar, Rangnath Mishra and Chung-Ho-Chang for their help with immunoblot analysis and cGMP radioimmunoassay. Our sincere thanks to Dr Jeffrey Overholt for his valuable suggestions. This work is supported by grants from the National Institutes of Health, Heart, Lung and Blood Institute, HL-2580 (N. R. P) and a training grant HL-07714-05 (D. D. K.).
References
- Abu-Soud HM, Rousseau DL, Stuehr DJ. Nitric oxide binding to the heme of neuronal nitric-oxide synthase links its activity to changes in oxygen tension. Journal of Biological Chemistry. 1996;271:32515–32518. doi: 10.1074/jbc.271.51.32515. 10.1074/jbc.271.51.32515. [DOI] [PubMed] [Google Scholar]
- Bartlett D, Tenney SM. Control of breathing in experimental anemia. Respiration Physiology. 1970;10:384–395. doi: 10.1016/0034-5687(70)90056-3. [DOI] [PubMed] [Google Scholar]
- Bredt DS, Snyder SH. Nitric oxide mediates glutamate-linked enhancement of cGMP levels in the cerebellum. Proceedings of the National Academy of Sciences of the USA. 1989;86:9030–9033. doi: 10.1073/pnas.86.22.9030. [DOI] [PMC free article] [PubMed] [Google Scholar]
- Buelke-Sam J, Holson JF, Bazare JJ, Young JF. Comparative stability of physiological parameters during sustained anesthesia in rats. Laboratory Animal Science. 1978;28:157–162. [PubMed] [Google Scholar]
- Chang CH, Kohse KP, Chang B, Hirata M, Jiang B, Douglas JE, Murad F. Characterization of ATP-stimulated guanylate cyclase activation in rat lung membranes. Biochimica et Biophysica Acta. 1990;1052:159–165. doi: 10.1016/0167-4889(90)90071-k. [DOI] [PubMed] [Google Scholar]
- Cherniack NS, Euler CV, Homma I, Kao FF. Effects of increased respiratory controller gain during hypoxia and hypercapnia on periodic breathing in cats. Advances in Experimental Medicine and Biology. 1978;99:423–431. doi: 10.1007/978-1-4613-4009-6_45. [DOI] [PubMed] [Google Scholar]
- Chugh DK, Katayama M, Mokashi A, Bebout DE, Ray DK, Lahiri S. Nitric oxide-related inhibition of carotid chemosensory nerve activity in the cat. Respiration Physiology. 1994;97:147–156. doi: 10.1016/0034-5687(94)90022-1. [DOI] [PubMed] [Google Scholar]
- Dejours P. Chemoreceptors in breathing. Physiological Reviews. 1962;42:335–358. doi: 10.1152/physrev.1962.42.3.335. [DOI] [PubMed] [Google Scholar]
- Faraci FM, Brian JE., Jr Nitric oxide and the cerebral circulation. Stroke. 1994;25:692–703. doi: 10.1161/01.str.25.3.692. [DOI] [PubMed] [Google Scholar]
- Frappell P, Lanthier C, Baudinette RV, Mortola JP. Metabolism and ventilation in acute hypoxia: a comparative analysis in small mammalian species. American Journal of Physiology. 1992;262:R1040–1046. doi: 10.1152/ajpregu.1992.262.6.R1040. [DOI] [PubMed] [Google Scholar]
- Gautier H. Interactions among metabolic rate, hypoxia, and control of breathing. Journal of Applied Physiology. 1996;81:521–527. doi: 10.1152/jappl.1996.81.2.521. [DOI] [PubMed] [Google Scholar]
- Gozal D, Gozal E, Gozal YM, Torres JE. Nitric oxide synthase isoforms and peripheral chemoreceptor stimulation in conscious rats. NeuroReport. 1996a;7:1145–1148. doi: 10.1097/00001756-199604260-00009. [DOI] [PubMed] [Google Scholar]
- Gozal D, Torres JE, Gozal YM, Littwin SM. Effect of nitric oxide synthase inhibition on cardiorespiratory responses in the conscious rat. Journal of Applied Physiology. 1996b;81:2068–2077. doi: 10.1152/jappl.1996.81.5.2068. [DOI] [PubMed] [Google Scholar]
- Grimes PA, Mokashi A, Stone RA, Lahiri S. Nitric oxide synthase in autonomic innervation of the cat carotid body. Journal of the Autonomic Nervous System. 1995;54:80–86. doi: 10.1016/0165-1838(95)00006-j. 10.1016/0165-1838(95)00006-J. [DOI] [PubMed] [Google Scholar]
- Haxhiu MA, Chang CH, Dreshaj IA, Erokwu B, Prabhakar NR, Cherniack NS. Nitric oxide and ventilatory response to hypoxia. Respiration Physiology. 1995;101:257–266. doi: 10.1016/0034-5687(95)00020-e. 10.1016/0034-5687(95)00020-E. [DOI] [PubMed] [Google Scholar]
- Hohler B, Mayer B, Kummer W. Nitric oxide synthase in the rat carotid body and carotid sinus. Cell and Tissue Research. 1994;276:559–564. doi: 10.1007/BF00343953. 10.1007/s004410050118. [DOI] [PubMed] [Google Scholar]
- Huang PL, Dawson TM, Bredt DS, Snyder SH, Fishman MC. Targeted disruption of the neuronal nitric oxide synthase gene. Cell. 1993;75:1273–1286. doi: 10.1016/0092-8674(93)90615-w. [DOI] [PubMed] [Google Scholar]
- Huang Z, Huang PL, Panahian N, Dalkara T, Fishman MC, Moskowitz MA. Effects of cerebral ischemia in mice deficient in neuronal nitric oxide synthase. Science. 1994;265:1883–1885. doi: 10.1126/science.7522345. [DOI] [PubMed] [Google Scholar]
- Iadecola C, Faris PL, Hartman BK, Xu X. Localization of NADPH diaphorase in neurons of the rostral ventral medulla: possible role of nitric oxide in central autonomic regulation and oxygen chemoreception. Brain Research. 1993;603:173–179. doi: 10.1016/0006-8993(93)91318-m. 10.1016/0006-8993(93)91318-M. [DOI] [PubMed] [Google Scholar]
- Jacoby RO, Fox JG. Biology and diseases of mice. In: Fox JG, Cohen BJ, Loew FM, editors. Laboratory Animal Medicine. New York: Academic Press; 1984. pp. 31–89. [Google Scholar]
- Jaffrey SR, Snyder SH. Nitric oxide: a neural messenger. Annual Review of Cell and Developmental Biology. 1995;11:417–440. doi: 10.1146/annurev.cb.11.110195.002221. 10.1146/annurev.cb.11.110195.002221. [DOI] [PubMed] [Google Scholar]
- Lahiri S. Blood oxygen affinity and alveolar ventilation in relation in body weight in mammals. American Journal of Physiology. 1975;229:529–536. doi: 10.1152/ajplegacy.1975.229.2.529. [DOI] [PubMed] [Google Scholar]
- Leone AM, Palmer RM, Knowles RG, Francis PL, Ashton DS, Moncada S. Constitutive and inducible nitric oxide synthases incorporate molecular oxygen into both nitric oxide and citrulline. Journal of Biological Chemistry. 1991;266:23790–23795. [PubMed] [Google Scholar]
- Loeschcke HH. Central chemosensitivity and the reaction theory. The Journal of Physiology. 1982;332:1–24. doi: 10.1113/jphysiol.1982.sp014397. [DOI] [PMC free article] [PubMed] [Google Scholar]
- Moncada S, Palmer RM, Higgs EA. Nitric oxide: physiology, pathophysiology, and pharmacology. Pharmacological Reviews. 1991;43:109–141. [PubMed] [Google Scholar]
- Ogawa H, Mizusawa A, Kikuchi Y, Hida W, Miki H, Shirato K. Nitric oxide as a retrograde messenger in the nucleus tractus solitarii of rats during hypoxia. The Journal of Physiology. 1995;486:495–504. doi: 10.1113/jphysiol.1995.sp020828. [DOI] [PMC free article] [PubMed] [Google Scholar]
- Prabhakar NR, Cherniack NS, Haxhiu MA. Inhibitory and excitatory effects of nitric oxide in respiratory responses to hypoxia. In: Trouth OC, Millis RM, Kiwull-Schone HF, Schlafke ME, editors. Ventral Brainstem Mechanisms and Control of Respiration and Blood Pressure. Vol. 82. New York: M. Dekker; 1995. pp. 393–404. [Google Scholar]
- Prabhakar NR, Kumar GK, Chang CH, Agani FH, Haxhiu MA. Nitric oxide in the sensory function of the carotid body. Brain Research. 1993;625:16–22. doi: 10.1016/0006-8993(93)90132-7. 10.1016/0006-8993(93)90132-7. [DOI] [PubMed] [Google Scholar]
- Rengasamy A, Johns RA. Characterization of endothelium-derived relaxing factor/nitric oxide synthase from bovine cerebellum and mechanism of modulation by high and low oxygen tensions. Journal of Pharmacology and Experimental Therapeutics. 1991;259:310–316. [PubMed] [Google Scholar]
- Rengasamy A, Johns RA. Determination of Km for oxygen of nitric oxide synthase isoforms. Journal of Pharmacology and Experimental Therapeutics. 1996;276:30–33. [PubMed] [Google Scholar]
- Schlenker EH, Farkas GA. Endogenous opioids modulate ventilation in the obese Zucker rat. Respiration Physiology. 1995;99:97–103. doi: 10.1016/0034-5687(94)00085-e. 10.1016/0034-5687(94)00085-E. [DOI] [PubMed] [Google Scholar]
- Siemann DW, Hill RP, Bush RS. Analysis of blood gas values in mice following pulmonary irradiation. Radiation Research. 1980;81:303–310. [PubMed] [Google Scholar]
- Sun MK, Reis DJ. Dopamine or transmitter release from rat carotid body may not be essential to hypoxic chemoreception. American Journal of Physiology. 1994;267:R1632–1639. doi: 10.1152/ajpregu.1994.267.6.R1632. [DOI] [PubMed] [Google Scholar]
- Teppema L, Berkenbosch A, Olievier C. Effect of Nω-nitro-L-arginine on ventilatory response to hypercapnia in anesthetized cats. Journal of Applied Physiology. 1997;82:292–297. doi: 10.1152/jappl.1997.82.1.292. [DOI] [PubMed] [Google Scholar]
- Thomas AJ, Austin W, Friedman L, Strohl KP. A model of ventilatory instability induced in the unrestrained rat. Journal of Applied Physiology. 1992;73:1530–1536. doi: 10.1152/jappl.1992.73.4.1530. [DOI] [PubMed] [Google Scholar]
- Trzebski A, Sato Y, Suzuki A, Sato A. Inhibition of nitric oxide synthesis potentiates the responsiveness of carotid chemoreceptors to systemic hypoxia in the rat. Neuroscience Letters. 1995;190:29–32. doi: 10.1016/0304-3940(95)11492-f. 10.1016/0304-3940(95)11492-F. [DOI] [PubMed] [Google Scholar]
- Vincent SR, Kimura H. Histochemical mapping of nitric oxide synthase in the rat brain. Neuroscience. 1992;46:755–784. doi: 10.1016/0306-4522(92)90184-4. 10.1016/0306-4522(92)90184-4. [DOI] [PubMed] [Google Scholar]
- Vitagliano S, Berrino L, D'Amico M, Maione S, DeNovellis V, Rossi F. Involvement of nitric oxide in cardiorespiratory regulation in the nucleus tractus solitarii. Neuropharmacology. 1996;35:625–631. doi: 10.1016/0028-3908(96)84633-8. 10.1016/0028-3908(96)84633-8. [DOI] [PubMed] [Google Scholar]
- Wang ZZ, Bredt DS, Fidone SJ, Stensaas LJ. Neurons synthesizing nitric oxide innervate the mammalian carotid body. Journal of Comparative Neurology. 1993;336:419–432. doi: 10.1002/cne.903360308. [DOI] [PubMed] [Google Scholar]
- Wang ZZ, Stensaas LJ, Bredt DS, Dinger B, Fidone SJ. Localization and actions of nitric oxide in the cat carotid body. Neuroscience. 1994;60:275–286. doi: 10.1016/0306-4522(94)90221-6. 10.1016/0306-4522(94)90221-6. [DOI] [PubMed] [Google Scholar]