

Abstract
The activity of Ca2+ channels is regulated by a number of mechanisms including direct allosteric modulation by intracellular ATP. Since ATP derived from glycolysis is preferentially used for membrane function, we hypothesized that glycolytic ATP also preferentially regulates cardiac L-type Ca2+ channels.
To test this hypothesis, peak L-type Ca2+ currents (ICa) were measured in voltage-clamped rabbit cardiomyocytes during glycolytic inhibition (2-deoxyglucose + pyruvate), oxidative inhibition (cyanide + glucose) or both (full metabolic inhibition; FMI).
A 10 min period of FMI resulted in a 40·0 % decrease in peak ICa at +10 mV (-5·1 ± 0·6 versus -3·1 ± 0·4 pA pF−1; n= 5, P < 0·01). Similar decreases in peak ICa were observed during glycolytic inhibition using 2-deoxyglucose (-6·2 ± 0·2 versus -3·7 ± 0·2 pA pF−1; n= 5, P < 0·01) or iodoacetamide (-6·7 ± 0·3 versus -3·7 ± 0·2 pA pF−1; n= 7, P < 0·01), but not following oxidative inhibition (-6·2 ± 0·4 versus -6·4 ± 0·3 pA pF−1; n= 5, n.s.). The reduction in ICa following glycolytic inhibition was not mediated by phosphate sequestration by 2-deoxyglucose or changes in intracellular pH.
Reductions in ICa were still observed when inorganic phosphate and creatine were included in the pipette, confirming a critical role for glycolysis in ICa regulation.
With 5 mM MgATP in the pipette during FMI, peak ICa decreased by only 18·4 % (-6·8 ± 0·6 versus -5·5 ± 0·3 pA pF−1; n= 4, P < 0·05), while inclusion of 5 mM MgAMP-PCP (β,γ-methyleneadenosine 5′-triphosphate, Mg2+ salt) completely prevented the decrease in peak ICa (-6·9 ± 0·3 versus -6·5 ± 0·3 pA pF−1; n= 5, n.s.).
Together, these results suggest that ICa is regulated by intracellular ATP derived from glycolysis and does not require hydrolysis of ATP. This regulation is expected to be energy conserving during periods of metabolic stress and myocardial ischaemia.
In the myocardium, as well as other tissues, ATP synthesis and utilization are subcellularly localized (Lynch & Paul, 1987). Glycolytic enzymes are known to be associated with the cardiac sarcolemma (Pierce & Philipson, 1985; Hazen et al. 1994) and sarcoplasmic reticulum (Pierce & Philipson, 1985). Accordingly, ATP derived from glycolysis has been shown to preferentially support membrane function while ATP generated from oxidative phosphorylation supports contractile function (Weiss & Hiltbrand, 1985). For instance, glycolytic ATP has been shown to preferentially regulate cardiac, as well as skeletal, sarcoplasmic reticular Ca2+ transport (Xu et al. 1995). Furthermore, glycolytic ATP regulates the activity of both the sarcolemmal Ca2+ pump (Paul et al. 1989; Hardin et al. 1992) and the Na+-K+ pump (Lynch & Balaban, 1987; Campbell & Paul, 1992) in smooth muscle cells.
Preferential regulation of ATP-sensitive K+ channels by glycolysis has been demonstrated in guinea-pig cardiac myocytes (Weiss & Lamp, 1987, 1989). Regulation of the ATP-sensitive K+ channel by ATP is the prototype for a putative metabolic feedback of cellular excitability and contractility. As intracellular ATP concentrations decrease, ATP-sensitive K+ channels open in a dose-dependent fashion in guinea-pig myocytes (Deutsch & Weiss, 1993) resulting in K+ efflux, shortening of the action potential and reduced excitability (Deutsch et al. 1991; Weiss et al. 1992). Ultimately, reduction of excitability reduces contractility preserving intracellular ATP and conferring protection against metabolic stress (Critz et al. 1997).
Like ATP-sensitive K+ channels, L-type Ca2+ channels are also regulated by ATP. Intracellular injection of ATP in whole-cell patch-clamp studies of guinea-pig myocytes resulted in a 40-60 % prolongation of action potential duration (Taniguchi et al. 1983), which correlated with a corresponding increase in L-type Ca2+ current (ICa) (Irisawa & Kokubun, 1983). One potential mechanism for this regulation is that intracellular ATP acts as a substrate for phosphorylation of the Ca2+ channel by protein kinases (for a review see Hilgemann, 1997). Alternatively, intracellular ATP also regulates Ca2+ channel activity directly via an allosteric mechanism not requiring ATP hydrolysis (O'Rourke et al. 1992; Yazawa et al. 1997; Yokoshiki et al. 1997) as originally proposed by Reuter & Scholtz (1977). In contrast to the regulation of ATP-sensitive K+ channels by free ATP, direct regulation of ICa requires MgATP (Backx et al. 1991; O'Rourke et al. 1992). Direct phosphorylation-independent regulation of ICa has also been demonstrated in smooth muscle cells from rat mesenteric artery (Yokoshiki et al. 1997) and this regulation appeared to rely preferentially on ATP derived from glycolysis (Lorenz & Paul, 1997).
Given that cardiac L-type Ca2+ channels are regulated by ATP and that glycolytic ATP has been shown to preferentially influence membrane proteins, we hypothesized that ATP derived from glycolysis would have a more direct influence on cardiac L-type Ca2+ channels compared with oxidative phosphorylation. In addition, we hypothesized that this regulation may involve a direct phosphorylation-independent mechanism. We tested these hypotheses in whole-cell voltage-clamped rabbit ventricular myocytes, which were exposed to glycolytic inhibition, oxidative inhibition or both glycolytic and oxidative inhibition (full metabolic inhibition; FMI). Our results establish that peak ICa is preferentially regulated by glycolytic ATP via a direct allosteric pathway.
METHODS
Preparation of single cells
Single ventricular cells were obtained from rabbit hearts (New Zealand White, 2-3 kg) using a modification of a previously described technique (Backx & Marban, 1993). All experiments were carried out with the approval of the Animal Care Committee at the Toronto General Hospital in accordance with the guidelines set by the Canadian Council for Animal Care. Briefly, each rabbit was anaesthetized with a mixed solution of pentobarbitone (60 mg kg−1) and heparin (200 i.u. kg−1) given as two intravenous bolus doses separated by 5 min. Before respiratory arrest occurred, the chest was opened through a mid-line sternotomy and the heart was quickly excised, mounted by the aortic root onto a cannula and retrogradely perfused with a modified Hepes-Tyrode solution with 1.0 mM Ca2+ and bubbled with 100 % O2 at 37°C for 2-3 min to wash out all blood residue. The heart was then perfused with a nominally Ca2+-free Hepes-Tyrode solution for 10 min and finally with the same Ca2+-free solution containing 200 U ml−1 collagenase Type II (Worthington Biochemical Corporation, Lakewood, NJ, USA) for 25-30 min. The enzyme solution was subsequently washed out with a high-K+ solution for 5 min. The ventricles were then removed and dissected into small pieces and single cells were isolated by gentle mechanical agitation. Cells were filtered through a nylon mesh, resuspended in high-K+ solution with 2 % bovine serum albumin (Sigma-Aldrich) and used within 8 h. Calcium-tolerant, rod-shaped cells with clear, regular cross-striations and no visible blebs were used for electrophysiological recordings.
Solutions and drugs
The modified Hepes-Tyrode solution for cell isolation contained (mM): NaCl, 140; MgCl2, 1; Hepes, 10; KCl, 4; CaCl2, 1; D-glucose, 5; pH adjusted to 7.4 with NaOH. The high-K+ cell storage solution contained (mM): potassium glutamate, 120; KCl, 20; Hepes, 20; MgCl2, 1; D-glucose, 10; and K-EGTA, 0.3; pH 7.4. The control bath (external recording) solution contained (mM): NaCl, 145; MgCl2, 1; CsCl, 5; Hepes, 10; CaCl2, 1.8; pH adjusted to 7.4 with NaOH. D-Glucose (10 mM) and pyruvic acid (2 mM) were added to the control bath solution as substrate for glycolysis and oxidative phosphorylation, respectively. The control pipette (internal recording) ATP-free solution contained (mM): CsCl, 145; Hepes, 10; MgCl2, 1; EGTA, 5; pH adjusted to 7.2 with CsOH; the calculated free Mg2+ concentration under these conditions was 0.79 mM (CHELATOR Version 1.00; Schoenmakers et al. 1992).
FMI was achieved by the addition of 10 mM 2-deoxyglucose to inhibit glycolysis and 2 mM sodium cyanide to inhibit oxidative phosphorylation, in the absence of substrate (i.e. glucose and pyruvate). Inhibition of glycolysis alone was achieved by inclusion in the bath solution of 10 mM 2-deoxyglucose and 2 mM pyruvic acid (substrate for oxidative phosphorylation). In addition to competitively inhibiting glucose utilization, 2-deoxyglucose also inhibits glycogen phosphorylase (Dringen & Hamprecht, 1993; Oikonomakos et al. 1995) and activates glycogen synthase (Carabaza et al. 1992). To determine the specificity of 2-deoxyglucose we used 100 μM iodoacetamide (IAA), a known inhibitor of glyceraldehyde-3-phosphate dehydrogenase, to inhibit glycolysis. Inhibition of oxidative phosphorylation alone was achieved by inclusion of 2 mM sodium cyanide in the control bath solution containing 10 mM glucose as substrate for glycolysis. In a separate set of experiments 5 mM ATP or 5 mM β,γ-methyleneadenosine 5′-triphosphate (AMP-PCP) complexed as Mg2+ salts was included in the control pipette solution. The estimated free Mg2+ concentration in the pipette solutions was 1.1 mM for MgATP or MgAMP-PCP (CHELATOR Version 1.00). To investigate the role of the creatine kinase, experiments were conducted with either 1.2 mM NaH2PO4 in the bath and 3.0 mM NaH2PO4 in the pipette solution, or the same concentrations of NaH2PO4 and 20 mM creatine in the pipette solution.
Glibenclamide (1 μM) was added to the bath solution (from a 10 mM stock dissolved in 100 % DMSO) to inhibit ATP-sensitive K+ channels during metabolic inhibition. R(+)-methylindazone (IAA94; 10 μM) or 5-nitro-2-(3-phenylpropylamino) benzoic acid (NPPB; 1 μM) were added to the bath solution to block Cl− channels (from a 50 mM stock dissolved in 100 % ethanol). IAA94 and NPPB were purchased from Research Biochemicals International. Glibenclamide, creatine, ATP, AMP-PCP, iodoacetamide, cyanide, 2-deoxyglucose and all other analytical grade chemicals were purchased from Sigma-Aldrich.
Electrophysiological recording
Cells were transferred into a 1 ml perfusion bath placed on the stage of an inverted microscope and superfused with control bath solution containing glucose and pyruvate at a rate of 1-2 ml min−1. All experiments were performed at room temperature (20-22°C). The gigaseal, whole-cell voltage-clamp configuration of the patch-clamp technique (Hamill et al. 1981) using an Axopatch 200A or 200B amplifier (Axon Instruments) was utilized. A ground silver-silver chloride wire enclosed in an agar bridge (Backx & Marban, 1993) was used to avoid oxidation of the silver upon wash-in of cyanide and subsequent junction potential shifts. Recording pipettes were prepared from thin-walled borosilicate glass (1.5 mm diameter; World Precision Instruments) using a Flaming-Brown micropipette puller (model P-87; Sutter Instruments). The pipette tip was heat polished with a heating filament (model MF-83; Narishige, Japan) and when filled with internal solution, tip resistance was typically 2-3 MΩ. Uncompensated series resistance was typically 2-6 MΩ and compensation was 60-70 %. After membrane rupture, the cell capacitance was estimated automatically by custom-designed computer software and by integrating the area under the capacity transient generated from a 20 mV depolarization from a holding potential of -40 mV. Currents were digitized at 10 kHz, filtered at 2 kHz and stored off-line for analysis.
To isolate ICa, internal and external K+ was replaced by Cs+, Cl− currents were blocked with 10 μM IAA94 or 1 μM NPPB, potent inhibitors of Cl− channels (Pope et al. 1991), and Na+ channels were inactivated by a 100 ms depolarizing prepulse to -40 mV. After completion of metabolic inhibition, nifedipine (10 μM) or Cd2+ (300 μM) was added to the bath solution to obtain nifedipine- or Cd2+-sensitive ICa. Peak ICa was sampled every 5 s by 200 ms depolarizing pulses to 0 mV from a holding potential of -80 mV, after 100 ms prepulses to -40 mV. Peak ICaI-V relationships were measured between -40 and +80 mV in 10 mV increments. During the time course of our metabolic inhibition experiments, leak currents were estimated by measuring the current recorded at the holding potential (-80 mV) and the prepulse potential (-40 mV).
Experimental protocols and data analysis
This study consisted of eight groups of cells each representing different metabolic interventions in the absence or presence of ATP or AMP-PCP in the pipette solution and each cell was used as its own control. After making a gigaseal, gaining access into the myocytes and compensating for cell capacitance and series resistance, myocytes were repeatedly depolarized to 0 mV from a holding potential of -80 mV with a 100 ms prepulse to -40 mV. This was done for 5 min while the cells were superfused with external control solution containing glucose and pyruvate in order to allow complete cellular dialysis and endogenous run-down of ICa. Following the 5 min equilibration period, a control peak ICaI-V relationship (depolarizations from -40 to +80 mV) was recorded. This was followed immediately by application of bath solution containing the desired metabolic substrates and inhibitors, while the myocyte was again depolarized every 5 s. After a 10 min exposure to the metabolic inhibitors, a test I-V relationship was recorded and compared with the control I-V relationship. At the end of the protocol a nifedipine (10 μM) or Cd2+ (300 μM) current was collected.
The first group of cells was exposed to 2-deoxyglucose and sodium cyanide (FMI) in the absence of the metabolic substrates glucose and pyruvate. In the second group of myocytes, addition of 2-deoxyglucose in the continued presence of pyruvate to maintain oxidative phosphorylation exclusively inhibited glycolysis. The third group of cells was exposed to sodium cyanide to inhibit oxidative phosphorylation in the continued presence of glucose to support glycolysis. In a fourth and fifth group of myocytes, inorganic phosphate alone or inorganic phosphate and creatine, respectively, were utilized under control conditions and during glycolytic inhibition with 2-deoxyglucose. In a sixth group of cells IAA (100 μM) was used to inhibit glycolysis as opposed to 2-deoxyglucose. The above experiments on cells from groups one to six were conducted in the absence of exogenous ATP. The seventh group of cells was exposed to FMI while exogenous ATP was provided via the pipette. The eighth group of cells was also exposed to FMI but with AMP-PCP complexed with Mg2+ in the pipette solution.
Curve fitting
Custom-designed and commercially available Microcal Origin (Microcal Software Inc., Northampton, MA, USA) software was used to analyse data. Limiting maximal slope conductances were calculated by fitting the I-V data below +40 mV with the Boltzmann distribution function. The time of half ICa inactivation was calculated from the ratio of ICa at +10 mV (peak) and ICa at the end of the depolarizing step and is referred to as time to half ICa inactivation (t½). All data are presented as means ±s.e.m. and Student's t test for paired data was used for statistical analysis. An experimental α-level of P < 0.05 was considered statistically significant.
RESULTS
Metabolic inhibition in the absence of exogenous ATP
Figure 1A and B summarizes the changes in ICa due to endogenous run-down. In these experiments, myocytes were initially superfused with an external Tyrode solution (see Methods) containing 10 mM glucose and 2 mM pyruvate as substrates for glycolysis and oxidative phosphorylation, respectively, with no ATP added to the pipette. After gaining access, myocytes were dialysed for 2-3 min while series resistance was compensated. Next, from a holding potential of -80 mV, ICa was then recorded following prepulses to -40 mV followed by depolarizations to 0 mV applied every 5 s for a period of 5 min. This period allowed complete cell dialysis, equilibration and endogenous run-down of ICa. Figure 1A indicates that, under our conditions, ICa decreased by 10-20 % within the first 3-4 min of recording. After 3-4 min, peak ICa remained relatively constant for at least 20 min as shown by the raw traces in Fig. 1A (inset). In fact, no significant difference was observed between mean peak ICa recorded at 0 mV 7-8 min after the whole-cell configuration was established (open circle; 6.3 ± 0.4 pA pF−1) and 20 min later (filled circle; 5.8 ± 0.5 pA pF−1) as illustrated in Fig. 1B. In all experiments in this study, we allowed the myocytes to equilibrate for 7-8 min prior to recording a control I-V relationship. Thereafter the effects of metabolic interventions were measured during the subsequent period, which was 10 min in duration.
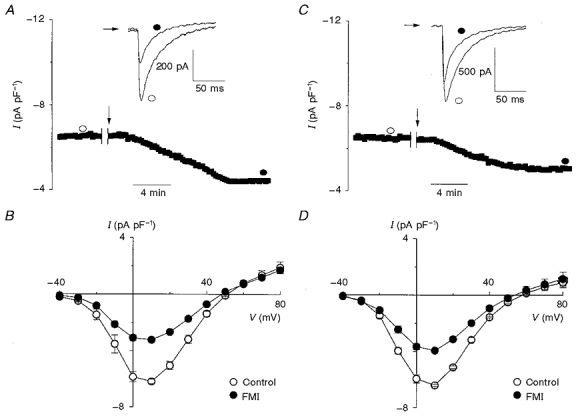
Figure 1. Effect of full metabolic inhibition on L-type Ca2+ current.
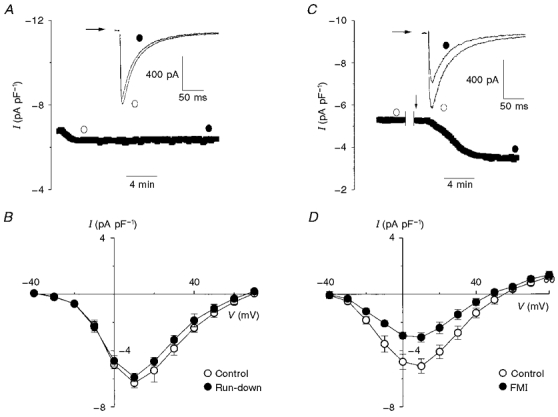
A, once the whole-cell configuration was achieved, ICa was sampled at 0.2 Hz and I-V relationships were recorded at the times indicated by the open and filled circles. The typical raw traces (inset) indicate that ICa run-down was minor over the 10 min sampling period. B, mean I-V relationships showing that sampling ICa at 0.2 Hz for 10 min did not significantly reduce ICa under our conditions (n= 4). C, ICa was sampled for 5 min before the indicated interruption in order to record a control I-V relationship. This was followed by external wash-in (arrow) of 2-deoxyglucose (10 mM) and sodium cyanide (2 mM) (full metabolic inhibition, FMI). The raw traces (inset) demonstrate that ICa prior to FMI (open circle) was larger than ICa after FMI (filled circle). D, mean I-V relationships which show that, on average, 10 min of FMI resulted in a 40 % reduction of ICa at +10 mV (n= 5, P < 0.01).
Figure 1C shows the peak ICa amplitude before and after (indicated by the arrow) application of an external solution containing 10 mM 2-deoxyglucose and 2 mM sodium cyanide (FMI), inhibitors of glycolysis and oxidative phosphorylation, respectively. Note that a 10 min period of FMI (filled circle) resulted in a nearly twofold decrease in ICa compared with control (open circle). FMI did not affect current inactivation (i.e. t½= 33.2 ± 1.3 ms for control versus 30.5 ± 2.6 ms for FMI; n= 5, n.s.) as illustrated by the raw traces in Fig. 1C (inset). Figure 1D shows the mean I-V relationships taken before and 10 min after FMI. On average, FMI reduced ICa compared with control from -5.1 ± 0.6 to -3.1 ± 0.4 pA pF−1 (P < 0.01, n= 5) at +10 mV, while mean maximum slope conductance (see Methods) was decreased from 159 pS in control to 108 pS.
In all the experiments shown in Fig. 1 and subsequent experiments, ICa is reported as the nifedipine- or Cd2+-subtracted current, where nifedipine or Cd2+ was added at the end of the experimental protocol. This procedure is a valid measure of ICa provided that metabolic inhibition does not activate time-dependent leak currents. We used currents measured at -80 and -40 mV as indicators of the magnitude of leak currents during the time course of our experiments. A summary of leak currents for control, FMI, glycolytic and oxidative inhibition at -80 and -40 mV is shown in Fig. 2A. After a 10 min period of metabolic intervention, current at -80 mV was -314.1 ± 44.5 pA for FMI, -278.7 ± 52.8 pA for glycolytic inhibition and -334.8 ± 35.3 pA for oxidative inhibition, compared with -339.4 ± 22.6 pA for control at the same time point (n= 5, n.s.). Current at -40 mV was -117.2 ± 7.8 pA for FMI, -129.0 ± 35.1 pA for glycolytic inhibition and -146.2 ± 21.8 pA for oxidative phosphorylation compared with -137.6 ± 29.2 pA for control (n= 5, n.s.). Figure 2B illustrates currents recorded in the presence of 10 μM nifedipine from control and after metabolic inhibition. Following a 10 min period with control bath solution the mean current at +10 mV in the presence of nifedipine was -39.1 ± 12.2 pA compared with -35.4 ± 9.8 pA for FMI, -34.2 ± 9.8 pA for glycolytic inhibition and -36.2 ± 2.4 pA for oxidative inhibition (n= 5, n.s.). Therefore, under our experimental conditions metabolic inhibition did not activate time-dependent leak currents.
Figure 2. Holding current in control and after various metabolic interventions.
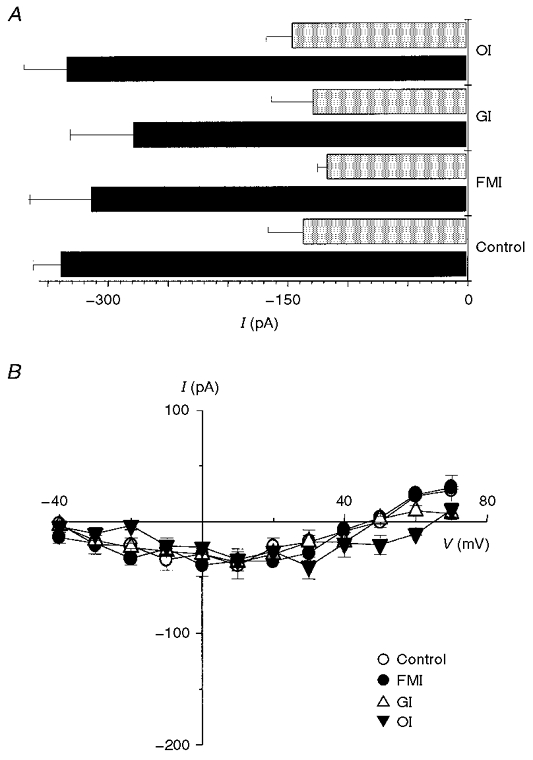
A, summary of holding current at -80 mV (▪) and -40 mV ( ) for control, full metabolic inhibition (FMI), glycolytic inhibition (GI) and oxidative inhibition (OI). It is clearly evident that the holding current was similar at both -80 and -40 mV regardless of metabolic intervention (n= 5 for all groups). B, mean I-V relationships recorded 10 min after control conditions, FMI, GI and OI in the presence of 10 μM nifedipine were not significantly different (n= 5 for all groups).
Figure 3A illustrates the changes in peak ICa before and after (indicated by the arrow) application of the glycolytic inhibitor 2-deoxyglucose (10 mM) in the presence of pyruvate as substrate for oxidative phosphorylation, without ATP added to the pipette solution. The protocols used in these experiments were the same as those described in Fig. 1. For the representative cell shown in Fig. 3A, a 10 min 2-deoxyglucose exposure period reduced ICa recorded at 0 mV by almost twofold. The raw traces in Fig. 3A (inset) demonstrate that exposure to 2-deoxyglucose (filled circle) caused a decrease in peak ICa compared with control (open circle). Similar to FMI, glycolytic inhibition reduced ICa without significantly affecting the time course of inactivation (t½= 30.4 ± 1.2 ms in control versus 30.4 ± 0.8 ms following glycolytic inhibition; n= 5, n.s.).
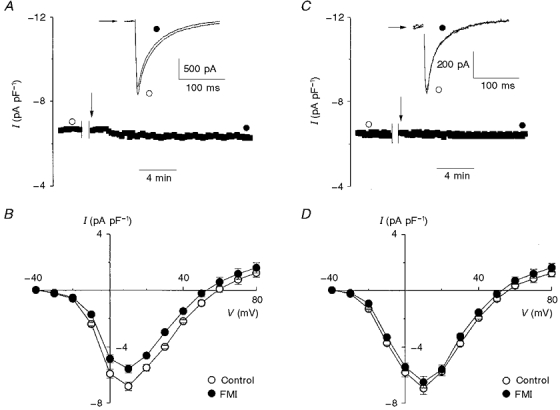
Figure 3. Effect of glycolytic and oxidative inhibition on L-type Ca2+ current.
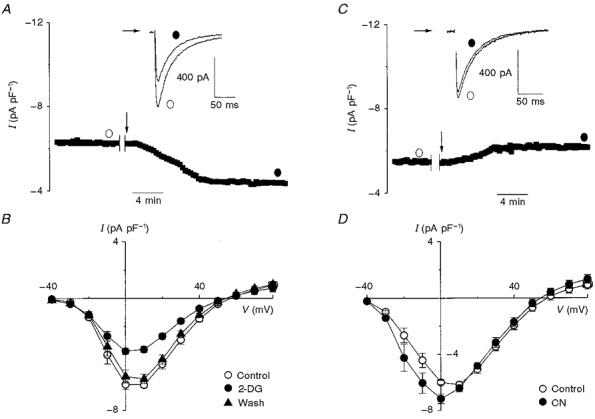
A and C, in the whole-cell configuration, ICa was initially sampled for 5 min prior to the indicated interruption, in order to record a control I-V relationship. This was immediately followed by external wash-in (arrow) of 2-deoxyglucose (2-DG; 10 mM; A) or sodium cyanide (CN; 2 mM; C). The raw traces in A and C (insets) indicate that ICa was larger prior to (open circle) than after (filled circle) glycolytic inhibition and was not altered by oxidative phosphorylation, respectively. B and D, mean I-V relationships indicating that, on average, 10 min of glycolytic inhibition resulted in a 43 % reduction of ICa at +10 mV (n= 11, P < 0.01) and was completely reversed by 30 min wash-out of 2-deoxyglucose (n= 6) (B). On the other hand, 10 min of oxidative inhibition (n= 5) increased ICa by 16 % at 0 mV (P < 0.05) and did not alter ICa at +10 mV and more positive membrane potentials (D).
The mean I-V relationships shown in Fig. 3B establish that 10 min of glycolytic inhibition resulted in a 43.3 % reduction of ICa at +10 mV from -6.2 ± 0.2 to -3.7 ± 0.2 pA pF−1 (n= 11, P < 0.01). In addition, Fig. 3B demonstrates that following a 30 min 2-deoxyglucose wash-out period ICa returned to control levels (-6.2 ± 0.2 pA pF−1 for control versus -5.8 ± 0.3 pA pF−1 after wash-out of 2-deoxyglucose; n= 6, n.s.). Similar to FMI, glycolytic inhibition resulted in a reduced mean slope conductance from 187 to 103 pS, which was completely reversed by wash-out of 2-deoxyglucose.
On the other hand, after 10 min of oxidative inhibition ICa increased modestly at 0 mV as shown in Fig. 3C. Examination of the raw traces in Fig. 3C (inset) showed that, as in the previous experiments, inactivation was not changed by oxidative inhibition (i.e. t½= 32.2 ± 1.3 ms in control (open circle) versus 30.5 ± 1.6 ms following oxidative inhibition (closed circle); n= 5, n.s.). Figure 3D shows the mean I-V relationships before and after application of cyanide. Clearly, the effect of cyanide was limited to a modest increase in peak ICa between -30 and 0 mV with no difference recorded at more positive voltages. At +10 mV, mean peak ICa was not altered by cyanide application (-6.2 ± 0.4 pA pF−1 in control versus -6.4 ± 0.3 pA pF−1 following oxidative inhibition; n= 5, n.s.) while the mean maximum slope conductances were virtually unchanged (i.e. 168 pS in control versus 161 pS after cyanide).
Like glucose, 2-deoxyglucose is phosphorylated to 2-deoxyglucose-6-phosphate (Oikonomakos et al. 1995). Due to the inability to metabolize 2-deoxyglucose-6-phosphate, the addition of 2-deoxyglucose could in principle sequester the pool of inorganic phosphate. This phosphate sequestration by 2-deoxyglucose could indirectly inhibit ATP production by the mitochondria and contribute to the reduction of ICa. Therefore, we conducted experiments in which we added 1.2 mM inorganic phosphate (NaH2PO4) to the bath solution and 3 mM NaH2PO4 to the pipette solution. The mean I-V relationships shown in Fig. 4A demonstrate that, following a 10 min exposure to 2-deoxyglucose in the presence of NaH2PO4, ICa decreased by 25.0 % (-6.4 ± 0.3 pA pF−1 for control versus -4.8 ± 0.1 pA pF−1 after 2-deoxyglucose; n= 8, P < 0.05) at +10 mV. Unlike previous experiments where steady-state current levels were established with 10 min of exposure to 2-deoxyglucose, the inclusion of NaH2PO4 slowed the rate of decline of ICa (data not shown), so that steady state was achieved after 15 min with ICa being reduced by 38.4 % (-6.2 ± 0.1 pA pF−1 for control versus -3.8 ± 0.1 pA pF−1 for 2-deoxyglucose; n= 4, P < 0.01) as shown in Fig. 4B. This degree of ICa reduction at steady state was quantitatively similar to that observed following application of 2-deoxyglucose in the absence of NaH2PO4 (compare Fig. 4B with Fig. 3B).
Figure 4. Effect of glycolytic inhibition on Ca2+ current with 2-deoxyglucose or iodoacetamide.
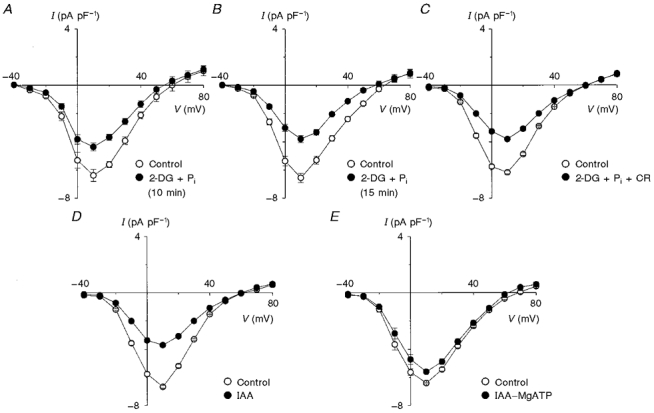
A, a 10 min episode of glycolytic inhibition with 2-deoxyglucose (2-DG; 10 mM) in the presence of NaH2PO4 (Pi; 1.2 mM in bath and 3.0 mM in pipette) reduced ICa by 25.0 % (n= 4, P < 0.05). B, however, a 15 min exposure to 2-deoxyglucose in the presence of NaH2PO4 (1.2 mM in bath and 3.0 mM in pipette) resulted in a greater reduction of ICa (38.4 %, n= 4, P < 0.01). C, a functional creatine kinase shuttle (20 mM creatine (CR) in pipette) did not prevent reduction of ICa. D, when myocytes were exposed for 10 min to iodoacetamide (IAA; 100 μM) a 44.8 % reduction of ICa was observed (n= 7, P < 0.01), which was similar to the reduction observed following glycolytic inhibition by 2-deoxyglucose (Fig. 3B). E, reduction of ICa by IAA was greatly attenuated by the inclusion of 5 mM MgATP in the pipette solution (IAA-MgATP), as was also observed when 2-deoxyglucose was used to inhibit glycolysis.
The mitochondrial and cytosolic (i.e. myofibrils) creatine kinase catalyses the transfer of high energy phosphate between ATP, ADP, creatine and creatine phosphate, shuttling ATP from the mitochondria to the cytosol. Therefore, it is possible that during glycolytic inhibition under our conditions (i.e. in the absence of creatine) the mitochondria were able to synthesize ATP but this ATP was not able to reach the Ca2+ channels. To test for this possibility, we conducted experiments in the presence of 20 mM creatine and 3 mM NaH2PO4 in the pipette solution and 1.2 mM NaH2PO4 in the bath solution. The mean I-V relationships shown in Fig. 4C indicate that ICa at +10 mV decreased by 41.8 % from -6.7 ± 0.3 pA pF−1 for control to -3.9 ± 0.6 pA pF−1 (n= 5, P < 0.01) following 10 min of glycolytic inhibition with creatine and inorganic phosphate. This result was similar to that observed in the absence of creatine and inorganic phosphate, establishing that the mitochondria are unable to sustain ICa when glycolysis is inhibited.
Given the significant reduction of ICa following application of 2-deoxyglucose, we sought to use another inhibitor of glycolysis to confirm the role of glycolytic derived ATP in modulating ICa. The mean I-V relationships in Fig. 4D demonstrate that the application of 100 μM IAA for 10 min caused ICa to decrease by 44.8 % (-6.7 ± 0.3 pA pF−1 for control versus -3.7 ± 0.2 pA pF−1 after application of IAA; n= 7, P < 0.01) at +10 mV. The similarity in the degree of reduction of ICa with 2-deoxyglucose and IAA suggests that the reduction of ICa is indeed the result of glycolytic inhibition (compare Fig. 3B with 4D). The effects of IAA on ICa were not due to direct effects of IAA on Ca2+ channels since, as illustrated in Fig. 4E, the inclusion of 5 mM MgATP in the pipette solution largely prevented the reduction of ICa by IAA (12.5 % reduction of ICa from -6.4 ± 0.1 pA pF−1 for control to -5.6 ± 0.2 pA pF−1 at +10 mV for IAA-MgATP; n= 6, P < 0.05).
Previous studies have shown that ICa is sensitive to pH (Chen et al. 1996; Schuhmann et al. 1997) and that changes in intracellular pH can occur following the application of 2-deoxyglucose and cyanide (Allue et al. 1996). Therefore, to determine whether the reduction of ICa observed following metabolic inhibition was due to changes in pH, we conducted FMI experiments with increased proton buffering conditions. Figure 5A shows that, after a 10 min FMI period in the presence of 50 mM Hepes in the bath and pipette solutions, ICa decreased by almost twofold, similar to the reduction observed after FMI with only 10 mM Hepes (see Fig. 1C and D). The mean I-V relationships shown in Fig. 5B demonstrate that following a 10 min period of FMI in the presence of 50 mM Hepes ICa at +10 mV decreased by 47.6 % (-6.2 ± 0.1 pA pF−1 for control versus -3.2 ± 0.2 pA pF−1 after FMI; n= 6, P < 0.01). Since HCO3− is a more physiological buffer than Hepes and since Allue et al. (1996) successfully clamped pH during metabolic inhibition in isolated myocytes with HCO3−, we conducted a set of experiments with 50 mM Hepes plus 25 mM NaHCO3 in the bath solution. The NaHCO3 solution was continuously bubbled with a mixture of 95 % O2 and 5 % CO2 (pH 7.4). The representative myocyte shown in Fig. 5C illustrates that 10 min of FMI with high Hepes and HCO3− still decreased ICa. The mean I-V relationships in Fig. 5D show that 10 min of FMI reduced ICa at +10 mV on average by 38.6 %, from -6.4 ± 0.1 pA pF−1 for control to -3.9 ± 0.2 pA pF−1 after FMI in the presence of high Hepes and HCO3− (n= 4, P < 0.01). This result was also similar to the reduction of ICa observed during FMI with 10 mM Hepes (Fig. 1D).
Figure 5. Effect of full metabolic inhibition on Ca2+ current in the presence of high Hepes and/or NaHCO3.
To determine whether the reduction of ICa after FMI is related to alterations in pHi, proton buffering conditions were improved; 50 mM Hepes was present in the bath and pipette solutions in A-D, plus 25 mM NaHCO3 in the bath solution in C and D. A and C, in the whole-cell configuration, ICa was initially sampled for 5 min before the indicated interruption to record a control I-V relationship. This was followed with external wash-in (arrow) of 2-deoxyglucose (10 mM) and sodium cyanide (2 mM) (FMI). In A, it is evident that 50 mM Hepes in the bath and pipette solution did not prevent the reduction of ICa upon wash-in of metabolic inhibitors. C shows that 50 mM Hepes in the bath and pipette and 25 mM NaHCO3 in the bath did not prevent the reduction of ICa upon wash-in of metabolic inhibitors. B and D, mean I-V relationships showing that, on average, metabolic inhibition with 50 mM Hepes only resulted in a 47.6 % reduction of ICa (B; n= 6, P < 0.01) compared with a 38.6 % reduction with 50 mM Hepes and 25 mM NaHCO3 (D; n= 4, P < 0.01).
Full metabolic inhibition in the presence of exogenous ATP or ATP analogue
In order to test whether the effects of full metabolic or glycolytic inhibition on ICa resulted from depletion of intracellular ATP, as opposed to other effects of metabolic inhibition, we repeated the full metabolic and glycolytic inhibition experiments but included either ATP or AMP-PCP (a non-hydrolysable analogue of ATP) in the pipette solution. Figure 6A shows typical results when the pipette solution contained MgATP (i.e. 5 mM ATP together with 6.2 mM total MgCl2). After superfusion with a bath solution containing 2-deoxyglucose and sodium cyanide (arrow) for 10 min, ICa was reduced by 16 % (see also Fig. 6A, inset) without change in the time course of current inactivation (i.e. t½= 33.0 ± 1.3 ms in control versus 31.4 ± 1.4 ms following FMI; n= 4, n.s.). The mean I-V relationships in Fig. 6B show that ICa decreased by 18.4 % (-6.8 ± 0.6 versus -5.5 ± 0.3 pA pF−1, n= 5, P < 0.05) at +10 mV, compared with a 40 % reduction in the absence of ATP in the pipette (Fig. 1D). Associated with this modest reduction of ICa with ATP, the mean maximum slope conductance was also reduced by 15 % from 163 to 142 pS.
Figure 6. Effect of full metabolic inhibition on L-type calcium current in the presence of MgATP or MgAMP-PCP.
MgATP (5 mM) or MgAMP-PCP (5 mM) was included in the pipette solution in A and B, and C and D, respectively. A and C, in the whole-cell configuration, ICa was initially sampled for 5 min before the indicated interruption in order to record a control I-V relationship. This was immediately followed by external wash-in (arrow) of 2-deoxyglucose (10 mM) and sodium cyanide (2 mM). The raw traces (insets) demonstrate that in the presence of MgATP (A) ICa prior to (open circle) was larger than ICa after (filled circle) FMI. However, when MgAMP-PCP was included in the pipette (C) FMI did not alter ICa. B and D, mean I-V relationships which show that, on average, 10 min of FMI resulted in a moderate but significant reduction of ICa at +10 mV with MgATP (B; n= 5, P < 0.05) and was unaltered with MgAMP-PCP (D; n= 5, n.s.).
Intracellular ATP regulates Ca2+ channel activity by phosphorylation-dependent (Hilgemann, 1997) and phosphorylation-independent (O'Rourke et al. 1992; Yazawa et al. 1997; Yokoshiki et al. 1997) pathways. In order to distinguish between these regulatory pathways, experiments were also performed with the non-hydrolysable ATP analogue, AMP-PCP, in the pipette solution. Figure 6C shows that 5 mM MgAMP-PCP (i.e. 5 mM AMP-PCP plus 6.2 mM total MgCl2) in the patch pipette completely prevented the reduction of ICa associated with FMI. With MgAMP-PCP in the pipette, the mean I-V relationships illustrated in Fig. 6D were unaffected by FMI The peak ICa at +10 mV was not significantly altered by FMI (-6.9 ± 0.3 pA pF−1 in control versus -6.5 ± 0.3 pA pF−1 following FMI; n= 5, n.s.). Similar to MgATP, inclusion of MgAMP-PCP in the pipette had little effect on the maximum slope conductance (194 pS in control versus 191 pS following FMI; n= 5) and rate of current inactivation (t½= 43.7 ± 4.5 ms in control versus 41.4 ± 4.1 ms following FMI; n= 5, n.s.).
DISCUSSION
The present study shows that a 10 min period of FMI with 2-deoxyglucose and sodium cyanide reduced peak ICa at +10 mV by 40 %, while inhibition of glycolysis alone resulted in a comparable 43 % decrease in peak ICa. On the other hand, inhibition of oxidative phosphorylation alone using cyanide did not have a significant effect on peak ICa, suggesting that glycolytic derived ATP preferentially regulates ICa. This reduction of ICa by 2-deoxyglucose did not result from non-specific sequestration of inorganic phosphate since inclusion of NaH2PO4 could not prevent the inhibitory effects of this non-hydrolysable glucose analogue. This result is consistent with a previous finding in isolated rat hearts where 2-deoxyglucose reduced ATP levels without affecting inorganic phosphate concentration (Kupriyanov et al. 1991). The rate of ICa decline was altered, however, when NaH2PO4 was included suggesting that the levels of phosphate may influence the kinetics of ICa inhibition.
To further establish the role of glycolytic derived ATP in the regulation of ICa, we also blocked glycolysis with 100 μM IAA, which at this low concentration is a relatively specific inhibitor of glyceraldehyde-3-phosphate dehydrogenase (Sabri & Ochs, 1971). However, unlike 2-deoxyglucose, IAA should not create a sink for inorganic phosphate. Nevertheless, IAA significantly reduced ICa at +10 mV, similar to 2-deoxyglucose. Taken together these data suggest that substrate metabolism by the mitochondria is unable to maintain ICa. However, the mitochondrial creatine kinase is required to shuttle energy from the mitochondria to the cytosol (Aliev & Saks, 1997). Therefore, it is possible that, when creatine kinase is functional, the mitochondria could prevent ICa reduction during glycolytic inhibition. However, even in the presence of creatine and phosphate the application of 2-deoxyglucose still caused a significant decrease in ICa. These results establish that glycolysis and not oxidative phosphorylation is involved in the ATP-dependent reduction of ICa. The above results are consistent with preferential regulation of cardiac ICa by glycolysis as previously observed in rat portal vein smooth muscle cells (Lorenz & Paul, 1997). Our results are also consistent with the lack of effect of 1 mM cyanide on ICa measured in feline cardiomyocytes (Furukawa et al. 1994). Preferential regulation of cardiac L-type Ca2+ channels by glycolytic ATP is also expected from the sensitivity of other cardiac membrane proteins to glycolytic inhibition (Weiss & Lamp, 1987, 1989; Xu et al. 1995).
Since biphasic changes in intracellular pH occur following metabolic inhibition with cyanide and 2-deoxyglucose and since protons modulate ICa, we tested whether increasing intracellular pH buffering capacity with the addition of 50 mM Hepes and 25 mM NaHCO3 would affect the changes in ICa observed with metabolic inhibition. Increasing the pH buffering capacity with high levels of HCO3−, previously shown to prevent changes in intracellular pH (Allue et al. 1996), had no effect on the magnitude or rate of ICa reduction following metabolic inhibition. Thus, the changes in ICa are unlikely to be mediated by changes in intracellular pH.
Prevention of ICa reduction following metabolic inhibition by MgATP or MgAMP-PCP in the pipette solution (Fig. 6B and D; cf. Fig. 1D) suggests that metabolic regulation by glycolysis involves direct allosteric phosphorylation-independent effects of ATP on L-type Ca2+ channels. These observations are consistent with previous studies in guinea-pig myocytes (O'Rourke et al. 1992; Yazawa et al. 1997) and vascular smooth muscle cells (Yokoshiki et al. 1997) where it was shown that Mg2+ must be complexed with ATP or its analogues (AMP-PCP or AMP-PNP (adenylyl imidophosphate)) to modulate ICa. We found that MgAMP-PCP completely prevented the reduction of ICa associated with FMI.
The more potent effect of MgAMP-PCP compared with MgATP (compare Fig. 6B with Fig. 6D) in preventing ICa reduction during FMI might be related to local ATP concentrations. With ATP in the pipette, local ATP concentrations could be reduced by cellular ATPases, which utilize ATP at a rate comparable to the rate of ATP diffusion into the cell from the pipette. This local consumption would not be expected for non-hydrolysable analogues of ATP, like AMP-PCP. In addition, local cellular ATPases may enhance the intracellular ADP concentration locally and thereby compete with ATP for the allosteric binding site, as has been reported for the ATP-sensitive K+ channel (Terzic et al. 1995) and CFTR (cystic fibrosis transmembrane conductance regulator) Cl− channel (Anderson & Welsh, 1992; Gadsby et al. 1995).
In this study the effect of FMI on intracellular ATP concentration was not measured. However, depletion of the global intracellular ATP concentration to below 20 μM is associated with rigor cross-bridge formation and square-shaped cell morphology (Fabiato & Fabiato, 1975; Allue et al. 1996). In our studies, when ATP was not included in the pipette, FMI and inhibition of oxidative phosphorylation consistently caused cells to shorten by 50-60 % and become square shaped within 3-5 min of exposure to the inhibitors, suggesting that the intracellular ATP concentration was reduced to less than 20 μM (Allue et al. 1996). However, inhibition of glycolysis and inclusion of MgATP or MgAMP-PCP during FMI was not associated with cell shortening, suggesting that a global reduction of ATP to less than 20 μM did not occur and was not required for ICa reduction. These results are expected since contractile proteins have been previously shown to be preferentially supported by oxidative phosphorylation (Weiss & Lamp, 1987, 1989).
It is conceivable that the reduction of ICa during FMI is related to the substantial changes in myocyte shape that occur as a result of rigor cross-bridge development. For instance, cell shrinkage as a result of hyperosmotic perfusion has been shown to decrease, while cell swelling has been shown to increase, peak Ba2+ currents through Ca2+ channels in smooth muscle (Xu et al. 1996). Similarly, cell shrinkage reduces the amplitude of ICa and slows its rate of inactivation in guinea-pig ventricular myocytes, secondary to rapid elevation of intracellular Ca2+ (Ogura et al. 1997). On the other hand, it has also been demonstrated in guinea-pig cardiomyocytes that ICa is not altered by 20 % stretch or hyposmotic stress (Sasaki et al. 1992) in rat cardiomyocytes (Hongo et al. 1996). In our study it is unlikely that the reduction of ICa is due to cell shortening since the reductions of ICa were observed after glycolytic inhibition (with 2-deoxyglucose or IAA), where cell shortening was not observed. Furthermore, allosteric regulation by MgATP has been shown to occur in the presence of 5 mM intracellular ATP, where rigor and cell shape changes are prevented (O'Rourke et al. 1992; Yokoshiki et al. 1997).
In summary, we have shown that cardiac L-type ICa is preferentially regulated by MgATP derived from glycolysis as opposed to oxidative phosphorylation and that regulation by ATP does not require hydrolysis. This preferential utilization of glycolytic ATP by L-type Ca2+ channels could reflect the observation that glycolytic enzymes are colocalized with skeletal Ca2+ channels (Brandt et al. 1990), similar to A-kinase anchoring proteins (Goa et al. 1997). This regulatory mechanism may be extremely important under both physiological and pathophysiological conditions. Under physiological conditions this phosphorylation-independent mechanism may operate separate from the phosphorylation-dependent mechanisms. It has been demonstrated that the Kd for 50 % potentiation of L-type Ca2+ channel activity by internal perfusion of 5 mM ATP is 0.53 mM (Yokoshiki et al. 1997), which is much higher than the Kd (i.e. 15 μM) for phosphorylation (Francis & Corbin, 1994; Hilgemann, 1997). Therefore, this phosphorylation-independent pathway represents an important regulatory control mechanism for ICa activity operating at relatively high levels of intracellular ATP. This regulatory mechanism of ICa would be expected to work in concert with a shortening of the action potential duration to reduce excitability and contractility, thereby conserving energy during metabolic stress.
Acknowledgments
This study was supported by a Heart and Stroke Foundation of Ontario grant no. B-3536 (G. J. W. and P. H. B.) and a Canadian Heart and Stroke Foundation Junior Traineeship (V. A. L.). G. J. W. is the recipient of a Career Investigator Award from the Heart and Stroke Foundation of Ontario and P. H. B. is a Medical Research Council of Canada Scholar. We would also like to thank the Tiffin Trust for providing resources used to purchase equipment and Meredith Ford for involvement with myocyte isolation.
References
- Aliev MK, Saks VA. Compartmentalized energy transfer in cardiomyocytes: use of mathematical modeling for analysis of in vivo regulation of respiration. Biophysical Journal. 1997;73:428–445. doi: 10.1016/S0006-3495(97)78082-2. [DOI] [PMC free article] [PubMed] [Google Scholar]
- Allue I, Gandelman O, Dementieva E, Ugarova N, Cobbold P. Evidence for rapid consumption of millimolar concentrations of cytoplasmic ATP during rigor-contracture of metabolically compromised single cardiomyocytes. Biochemical Journal. 1996;319:463–469. doi: 10.1042/bj3190463. [DOI] [PMC free article] [PubMed] [Google Scholar]
- Anderson MP, Welsh MJ. Regulation by ATP and ADP of CFTR chloride channels that contain mutant nucleotide-binding domains. Science. 1992;257:1701–1704. doi: 10.1126/science.1382316. [DOI] [PubMed] [Google Scholar]
- Backx PH, Marban E. Background potassium current active during the plateau of the action potential in guinea pig ventricular myocytes. Circulation Research. 1993;72:890–900. doi: 10.1161/01.res.72.4.890. [DOI] [PubMed] [Google Scholar]
- Backx PH, O'Rourke B, Marban E. Flash photolysis of magnesium-DM-nitrophen in heart cells: a novel approach to probe magnesium- and ATP-dependent regulation of calcium channels. American Journal of Hypertension. 1991;4:416–421S. doi: 10.1093/ajh/4.7.416s. [DOI] [PubMed] [Google Scholar]
- Brandt NR, Caswell AH, Wen SR, Talvenheimo JA. Molecular interactions of the junctional foot protein and dihydropyridine receptor in skeletal muscle triads. Journal of Membrane Biology. 1990;113:237–251. doi: 10.1007/BF01870075. [DOI] [PubMed] [Google Scholar]
- Campbell JD, Paul RJ. The nature of fuel provision for the Na+,K+-ATPase in porcine vascular smooth muscle. The Journal of Physiology. 1992;447:67–82. doi: 10.1113/jphysiol.1992.sp018991. [DOI] [PMC free article] [PubMed] [Google Scholar]
- Carabaza A, Ciudad CJ, Baque S, Guinovart JJ. Glucose has to be phosphorylated to activate glycogen synthase, but not to inactivate glycogen phosphorylase in hepatocytes. FEBS Letters. 1992;296:211–214. doi: 10.1016/0014-5793(92)80381-p. [DOI] [PubMed] [Google Scholar]
- Chen XH, Bezprozvanny I, Tsien RW. Molecular basis of proton block of L-type Ca2+ channels. Journal of General Physiology. 1996;180:363–374. doi: 10.1085/jgp.108.5.363. [DOI] [PMC free article] [PubMed] [Google Scholar]
- Critz SD, Liu GS, Chujo M, Downey JM. Pinacidil but not nicorandil opens ATP-sensitive K+ channels and protects against simulated ischemia in rabbit myocytes. Journal of Molecular and Cellular Cardiology. 1997;29:1123–1130. doi: 10.1006/jmcc.1996.0335. [DOI] [PubMed] [Google Scholar]
- Deutsch N, Klitzner TS, Lamp ST, Weiss JN. Activation of cardiac ATP-sensitive K+ current during hypoxia: correlation with tissue ATP levels. American Journal of Physiology. 1991;261:H671–676. doi: 10.1152/ajpheart.1991.261.3.H671. [DOI] [PubMed] [Google Scholar]
- Deutsch N, Weiss JN. ATP-sensitive K+ channel modification by metabolic inhibition in isolated guinea-pig ventricular myocytes. The Journal of Physiology. 1993;465:163–179. doi: 10.1113/jphysiol.1993.sp019671. [DOI] [PMC free article] [PubMed] [Google Scholar]
- Dringen R, Hamprecht B. Inhibition by 2-deoxyglucose and 1,5-gluconolactone of glycogen mobilization in astroglia-rich primary cultures. Journal of Neurochemistry. 1993;60:1498–1504. doi: 10.1111/j.1471-4159.1993.tb03313.x. [DOI] [PubMed] [Google Scholar]
- Fabiato A, Fabiato F. Effects of magnesium on contractile activation of skinned cardiac cells. The Journal of Physiology. 1975;249:497–517. doi: 10.1113/jphysiol.1975.sp011027. [DOI] [PMC free article] [PubMed] [Google Scholar]
- Francis SH, Corbin JD. Structure and function of cyclic nucleotide-dependent protein kinases. Annual Review of Physiology. 1994;56:237–272. doi: 10.1146/annurev.ph.56.030194.001321. 10.1146/annurev.ph.56.030194.001321. [DOI] [PubMed] [Google Scholar]
- Furukawa T, Myerburg RJ, Furukawa N, Kimura S, Bassett AL. Metabolic inhibition of ICa,L and IK differs in feline left ventricular hypertrophy. American Journal of Physiology. 1994;266:H1121–1131. doi: 10.1152/ajpheart.1994.266.3.H1121. [DOI] [PubMed] [Google Scholar]
- Gadsby DC, Nagel G, Hwang TC. The CFTR chloride channel of mammalian heart. Annual Review of Physiology. 1995;57:387–416. doi: 10.1146/annurev.ph.57.030195.002131. 10.1146/annurev.ph.57.030195.002131. [DOI] [PubMed] [Google Scholar]
- Goa T, Yatani A, Dell'Acqua ML, Sako H, Green SA, Dascal N, Scott JD, Hosey MM. cAMP-dependent regulation of cardiac L-type Ca2+ channels requires membrane targeting of PKA and phosphorylation of channel subunits. Neuron. 1997;19:185–196. doi: 10.1016/s0896-6273(00)80358-x. 10.1016/S0896-6273(00)80358-X. [DOI] [PubMed] [Google Scholar]
- Hamill OP, Marty A, Neher E, Sakmann B, Sigworth FJ. Improved patch-clamp techniques for high-resolution current recording from cells and cell-free membrane patches. Pflügers Archiv. 1981;391:85–100. doi: 10.1007/BF00656997. [DOI] [PubMed] [Google Scholar]
- Hardin CD, Raeymaekers L, Paul RJ. Comparison of endogenous and exogenous sources of ATP in fueling Ca2+ uptake in smooth muscle plasma membrane vesicles. Journal of General Physiology. 1992;99:21–40. doi: 10.1085/jgp.99.1.21. [DOI] [PMC free article] [PubMed] [Google Scholar]
- Hazen SL, Wolf MJ, Ford DA, Gross RW. The rapid and reversible association of phosphofructokinase with myocardial membranes during myocardial ischemia. FEBS Letters. 1994;339:213–216. doi: 10.1016/0014-5793(94)80418-4. [DOI] [PubMed] [Google Scholar]
- Hilgemann DW. Cytoplasmic ATP-dependent regulation of ion transporters and channels: mechanisms and messengers. Annual Review of Physiology. 1997;59:193–220. doi: 10.1146/annurev.physiol.59.1.193. [DOI] [PubMed] [Google Scholar]
- Hongo K, White E, Le Guennec J-Y, Orchard CH. Changes in [Ca2+]i, [Na+]i and Ca2+ current in isolated rat ventricular myocytes following an increase in cell length. The Journal of Physiology. 1996;491:609–619. doi: 10.1113/jphysiol.1996.sp021243. [DOI] [PMC free article] [PubMed] [Google Scholar]
- Irisawa H, Kokubun S. Modulation by intracellular ATP and cyclic AMP of the slow inward current in isolated single ventricular cells of the guinea-pig. The Journal of Physiology. 1983;338:321–337. doi: 10.1113/jphysiol.1983.sp014675. [DOI] [PMC free article] [PubMed] [Google Scholar]
- Kupriyanov VV, Lakomkin VL, Korchazhkina OV, Steinschneider AYa, Kapelko VI, Saks VA. Control of cardiac energy turnover by cytoplasmic phosphates: 31P-NMR study. American Journal of Physiology. 1991;261(suppl.):45–53. doi: 10.1152/ajplung.1991.261.4.L45. [DOI] [PubMed] [Google Scholar]
- Lorenz JN, Paul RJ. Dependence of Ca2+ channel currents on endogenous and exogenous sources of ATP in portal vein smooth muscle. American Journal of Physiology. 1997;272:H987–994. doi: 10.1152/ajpheart.1997.272.2.H987. [DOI] [PubMed] [Google Scholar]
- Lynch RM, Balaban RS. Coupling of aerobic glycolysis and Na+-K+-ATPase in renal cell line MDCK. American Journal of Physiology. 1987;252:C269–276. doi: 10.1152/ajpcell.1987.253.2.C269. [DOI] [PubMed] [Google Scholar]
- Lynch RM, Paul RJ. Compartmentation of carbohydrate metabolism in vascular smooth muscle. American Journal of Physiology. 1987;252:C328–334. doi: 10.1152/ajpcell.1987.252.3.C328. [DOI] [PubMed] [Google Scholar]
- Ogura T, You Y, McDonald TF. Membrane currents underlying the modified electrical activity of guinea-pig ventricular myocytes exposed to hyperosmotic solution. The Journal of Physiology. 1997;504:135–151. doi: 10.1111/j.1469-7793.1997.135bf.x. [DOI] [PMC free article] [PubMed] [Google Scholar]
- Oikonomakos NG, Zographos SE, Johnson LN, Papageorgiou AC, Acharya KR. The binding of 2-deoxy-D-glucose 6-phosphate to glycogen phosphorylase b: kinetic and crystallographic studies. Journal of Molecular Biology. 1995;254:900–917. doi: 10.1006/jmbi.1995.0665. [DOI] [PubMed] [Google Scholar]
- O'Rourke B, Backx PH, Marban E. Phosphorylation-independent modulation of L-type calcium channels by magnesium-nucleotide complexes. Science. 1992;257:245–248. doi: 10.1126/science.1321495. [DOI] [PubMed] [Google Scholar]
- Paul RJ, Hardin CD, Raeymaekers L, Wuytack F, Casteels R. Preferential support of Ca2+ uptake in smooth muscle plasma membrane vesicles by an endogenous glycolytic cascade. FASEB Journal. 1989;3:2298–2301. doi: 10.1096/fasebj.3.11.2528493. [DOI] [PubMed] [Google Scholar]
- Pierce GN, Philipson KD. Binding of glycolytic enzymes to cardiac sarcolemmal and sarcoplasmic reticular membranes. Journal of Biological Chemistry. 1985;260:6862–6870. [PubMed] [Google Scholar]
- Pope AJ, Richardson SK, Ife RJ, Keeling DJ. Characterisation of the effects of anthranilic and (indanyloxy) acetic acid derivatives on chloride transport in membrane vesicles. Biochimica et Biophysica Acta. 1991;1067:51–63. doi: 10.1016/0005-2736(91)90025-4. [DOI] [PubMed] [Google Scholar]
- Reuter H, Scholtz H. The regulation of the calcium conductance of cardiac muscle by adrenaline. The Journal of Physiology. 1977;264:49–62. doi: 10.1113/jphysiol.1977.sp011657. [DOI] [PMC free article] [PubMed] [Google Scholar]
- Sabri MI, Ochs S. Inhibition of glyceraldehyde-3-phosphate dehydrogenase in mammalian nerve by iodoacetic acid. Journal of Neurochemistry. 1971;18:1509–1514. doi: 10.1111/j.1471-4159.1971.tb00013.x. [DOI] [PubMed] [Google Scholar]
- Sasaki N, Mitsuiye T, Noma A. Effects of mechanical stretch on membrane currents of single ventricular myocytes of guinea-pig heart. Japanese The Journal of Physiology. 1992;42:957–970. doi: 10.2170/jjphysiol.42.957. [DOI] [PubMed] [Google Scholar]
- Schoenmakers TJM, Visser GJ, Flik G, Theuvenet APR. CHELATOR: An improved method for computing metal ion concentrations in physiological solutions. Biotechniques. 1992;12:870–874. [PubMed] [Google Scholar]
- Schuhmann K, Voelker C, Hofer GF, Pflugelmeier H, Klugbauer N, Hofmann F, Romanin C, Groschner K. Essential role of the beta subunit in modulation of C-class L-type Ca2+ channels by intracellular pH. FEBS Letters. 1997;408:75–80. doi: 10.1016/s0014-5793(97)00391-8. [DOI] [PubMed] [Google Scholar]
- Taniguchi J, Noma A, Irisawa H. Modification of the cardiac action potential by intracellular injection of adenosine triphosphate and related substances in guinea pig single ventricular cells. Circulation Research. 1983;53:131–139. doi: 10.1161/01.res.53.2.131. [DOI] [PubMed] [Google Scholar]
- Terzic A, Jahangir A, Kurachi Y. Cardiac ATP-sensitive K+ channels: regulation by intracellular nucleotides and K+ channel-opening drugs. American Journal of Physiology. 1995;269:C525–545. doi: 10.1152/ajpcell.1995.269.3.C525. [DOI] [PubMed] [Google Scholar]
- Weiss J, Hiltbrand B. Functional compartmentation of glycolytic versus oxidative metabolism in isolated rabbit heart. Journal of Clinical Investigation. 1985;75:436–447. doi: 10.1172/JCI111718. [DOI] [PMC free article] [PubMed] [Google Scholar]
- Weiss JN, Lamp ST. Glycolysis preferentially inhibits ATP-sensitive K+ channels in isolated guinea pig cardiac myocytes. Science. 1987;238:67–69. doi: 10.1126/science.2443972. [DOI] [PubMed] [Google Scholar]
- Weiss JN, Lamp ST. Cardiac ATP-sensitive K+ channels: Evidence for preferential regulation by glycolysis. Journal of General Physiology. 1989;94:911–935. doi: 10.1085/jgp.94.5.911. [DOI] [PMC free article] [PubMed] [Google Scholar]
- Weiss JN, Venkatesh N, Lamp ST. ATP-sensitive K+ channels and cellular K+ loss in hypoxic and ischaemic mammalian ventricle. The Journal of Physiology. 1992;447:649–673. doi: 10.1113/jphysiol.1992.sp019022. [DOI] [PMC free article] [PubMed] [Google Scholar]
- Xu KY, Zweier JL, Becker LC. Functional coupling between glycolysis and sarcoplasmic reticulum Ca2+ transport. Circulation Research. 1995;77:88–97. doi: 10.1161/01.res.77.1.88. [DOI] [PubMed] [Google Scholar]
- Xu WX, Kim SJ, Kim SJ, So I, Kang TM, Rhee JC, Kim KW. Effect of stretch on calcium channel currents recorded from the antral circular myocytes of guinea-pig stomach. Pflügers Archiv. 1996;432:159–164. doi: 10.1007/s004240050119. [DOI] [PubMed] [Google Scholar]
- Yazawa K, Kameyama A, Yasui K, Li J-M, Kameyama M. ATP regulates cardiac Ca2+ channel activity via a mechanism independent of protein phosphorylation. Pflügers Archiv. 1997;433:557–562. doi: 10.1007/s004240050314. [DOI] [PubMed] [Google Scholar]
- Yokoshiki H, Katsube Y, Sperelakis N. Regulation of Ca2+ channel currents by intracellular ATP in smooth muscle cells of rat mesenteric artery. American Journal of Physiology. 1997;272:H814–819. doi: 10.1152/ajpheart.1997.272.2.H814. [DOI] [PubMed] [Google Scholar]