

Abstract
In single frog skeletal muscle fibres, we utilized supercharging voltage clamp command pulses to boost the rate of depolarization in the transverse tubular system (T-system) such that 95% of steady-state potential is achieved in < 2 ms (as indicated by fluorescent potentiometric dye signals detected from a global illumination region). Signals detected near the edge of muscle fibres indicate that peripheral regions of the T-system are not significantly overcompensated under these conditions.
We explored the impact of accelerating T-system depolarization on voltage-dependent events of excitation-contraction (E-C) coupling by measuring charge movement currents (CMCs) and Ca2+ fluorescence transients in response to both supercharging and conventional step pulses.
When compared with CMCs elicited by step pulses, supercharging CMCs are larger, and their kinetics more closely resemble those of gating current records reported for ionic channels. Furthermore, they decay bi-exponentially (τfast range, 1.3-1.8 ms; τslow range, 7.3-11.9 ms), whereas step CMCs fall with a single exponential time course (τ range, 12.5-26.7 ms).
Similarly, supercharging produces a distinct acceleration in Ca2+ release transients, which show little evidence of the voltage-dependent onset latencies previously encountered using step pulses.
The use of this novel methodology in skeletal muscle unveils a previously undetected component of charge movement, the rapid, voltage-dependent recruitment of which may provide the basis for understanding the fast gating of physiological E-C coupling.
In skeletal muscle, depolarization of the transverse tubular system (T-system) by an action potential initiates a voltage-sensitive mechanism that, within a few milliseconds, triggers intracellular Ca2+ release from adjacent sarcoplasmic reticulum (SR) (Palade & Vergara, 1982; Vergara & Delay, 1986). It is currently believed that non-ionic currents (charge movement currents, CMCs) reflect movement of the voltage sensor that links changes in T-system membrane potential to SR Ca2+ release (Schneider & Chandler, 1973; Rios & Pizarro, 1991). Although many studies have recorded CMCs and Ca2+ release in response to voltage clamp steps applied to the surface membrane (Kovacs et al. 1979; Vergara & Caputo, 1983; Melzer et al. 1986; Pape et al. 1996), the T-system sees voltage changes significantly slower than a step (Vergara & Bezanilla, 1981; Heiny & Vergara, 1982, 1984) under these conditions because it is an electrically restricted membrane compartment (Falk & Fatt, 1964; Adrian et al. 1969a; Adrian & Peachey, 1973; Ashcroft et al. 1985).
The T-system is an extensive membrane system composed of small tubules that invaginate from the surface membrane (Peachey, 1965). These morphological features are represented electrically by a large distributed capacitance isolated from the surface by an access resistance (Adrian & Peachey, 1973) and a distributed T-tubule lumen resistivity (Falk & Fatt, 1964; Adrian et al. 1969a; Ashcroft et al. 1985). Physiologically, the active Na+ conductance in the T-system ensures the rapid charging of this capacitance during action potential propagation (Adrian et al. 1969b; Adrian & Peachey, 1973; Vergara & Bezanilla, 1981; Heiny & Vergara, 1982). The average rate of T-system depolarization is ∼50 mV ms−1 in the presence of the Na+ conductance, but only ∼5 mV ms−1 in the absence of external Na+ or the presence of tetrodotoxin (Vergara & Bezanilla, 1981; Heiny & Vergara, 1982; Vergara et al. 1983). Consequently, a conundrum in skeletal muscle research is that experimental conditions necessary to investigate the voltage dependence of SR Ca2+ release (e.g. blocking ionic conductances) actually hinder the ability to rapidly establish a steady voltage in the T-system (Vergara & Bezanilla, 1981; Heiny & Vergara, 1982).
In this study, we present a technique utilizing supercharging voltage clamp command pulses (Armstrong & Chow, 1987) that allows the study of the voltage dependence of E-C coupling on the physiological (millisecond) time scale. Through measurements of T-system membrane potential, Ca2+ fluorescence transients and CMCs, we present a new portrait of the voltage gating of Ca2+ release that characterizes the rapid time course of signal transduction in this tissue.
METHODS
Solutions
All experiments were carried out using solutions of the following compositions. Internal solution: 90 mM caesium aspartate, 20 mM TEA-OH, 20 mM Cs-Mops, 5 mM creatine phosphate (sodium salt), 5 mM Na2-ATP, 1 mM MgSO4, 0.1 mg ml−1 creatine phosphokinase (Sigma) and 1–5 mM EGTA. Titrated to pH 7.0 with CsOH; osmolality, 264 mosmol kg−1. External solution: 160 mM TEA-OH, 10 mM Mops, 5 mM Cs-Mops, 3.25 mM CaSO4, 2 mM CdCl2 and 0.5 mM TTX. Titrated to pH 7.0 with H2SO4; osmolality, 260 mosmol kg−1.
General procedure
The experiments were performed using cut single muscle fibres isolated from the semitendinosus muscle (dorsal head) of Rana catesbeiana. The frogs were killed by rapid transection of the cervical spinal cord followed quickly by pithing first in the cranial and then in the caudal direction. These procedures were carried out in accordance with the animal care guidelines established by the University of California. Individual fibres were mounted on a triple Vaseline-gap chamber as described previously (Vergara et al. 1978), and the solutions in the cut end pools (E and C) were replaced by the internal solution listed above. Fibres were then repolarized by exchanging the experimental pool solution with the external solution described above.
For potentiometric studies, fibres were stained for 1–2 h with 0.1-5 μM di-8-ANEPPS (Molecular Probes) dissolved in high-K+ solution before mounting them on the chamber. This combination of staining time and dye concentration was found to give optimal signal with low toxicity. Di-8-ANEPPS was selected because of its good signal-to-noise ratio and its ability to track potential changes as fast as 100 V s−1 (Rohr & Salzberg, 1994). For Ca2+ detection studies, fibres were mounted on the chamber and the end-pool solutions were exchanged for internal solution containing 200 μM Oregon Green 488 BAPTA 5N (OGB-5N; Molecular Probes). The dye was allowed to equilibrate for 45–90 min before optical detection was initiated. All experiments were performed at 15°C.
Voltage clamp protocol and data acquisition
Voltage clamping was performed as described previously (Vergara et al. 1978). The holding potential for all experiments was −90 mV. Supercharging command pulses were digitally created with custom-made software (AKLAMP 1.4; A. M. Kim & J. L. Vergara, unpublished software) written in the LabVIEW G environment (LabVIEW 4.01; National Instruments, Austin, TX, USA). The pulses consisted of a step voltage pulse summed with a tri-exponential decay waveform according to the following formulas:
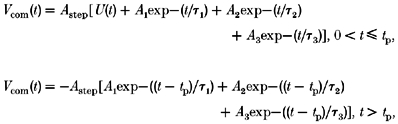 |
where Vcom(t) is the voltage clamp command voltage, Astep is the amplitude of the step pulse in millivolts, U(t) is the Heaviside step function, A1-A3 are the amplitudes of the three exponential functions in fractions of Astep, τ1-τ3 are the time constants of the three exponential functions in milliseconds, and tp is the pulse length in milliseconds.
Values for τ1-τ3 and A1-A3 of the exponential components were adjusted such that a quasi-step would be applied in the globally detected T-system (95% of steady-state value in < 2 ms without overcompensating edge segments) as verified empirically in potentiometric dye experiments (e.g. Figs 2 and 3). Since A1-A3 and τ1-τ3 were optimized and then fixed for each fibre, supercharging waveforms were automatically scaled as Astep was varied to generate a family of voltage pulses. In blind control potentiometric dye experiments, it was determined that the supercharging parameter values necessary to impose a quasi-step in global transients were similar for fibres of comparable diameter, capacitance and leak when dissected from a given muscle. Hence, fibres were selected in pairs such that supercharging parameter values were first obtained in potentiometric dye experiments and applied identically in subsequent Ca2+ dye experiments. This protocol also applied when CMCs were recorded simultaneously with Ca2+ transients. Alternatively, when CMCs were obtained in fibres stained with di-8-ANEPPS, supercharging pulse parameters were selected using potentiometric transients as a control.
Figure 2. Voltage clamp command waveforms and di-8-ANEPPS potentiometric fluorescence signals for short (10 ms) pulses.
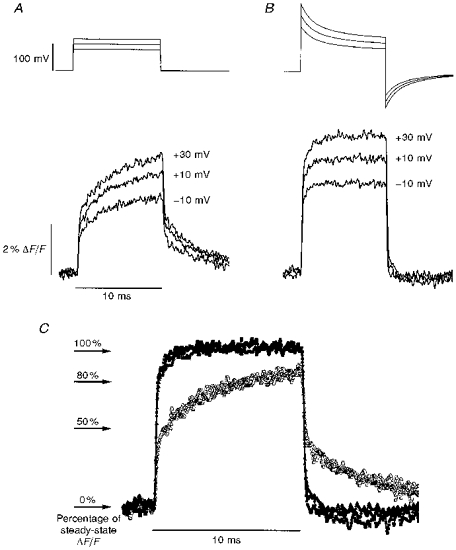
A and B, digitally generated waveforms (upper traces) applied to a voltage-clamped fibre, and fluorescence responses (lower traces) elicited. Pulses were initiated from a holding potential of −90 mV and depolarized the fibre to the potentials shown. C, superimposed fluorescence records from A and B normalized to steady-state fluorescence. Each fluorescence trace was signal averaged (n = 4), and obtained using global illumination (see Methods). Fibre diameter, 73 μm; capacitance, 13.4 μF cm−2. Time constants and weighting factors for supercharging pulses in B: τ1 = 1.0 ms, 50%; τ2 = 4.2 ms, 60%; τ3 = 41.0 ms, 5% (see Methods).
Figure 3. Di-8-ANEPPS potentiometric fluorescence signals for global and edge-tangent illumination regions.
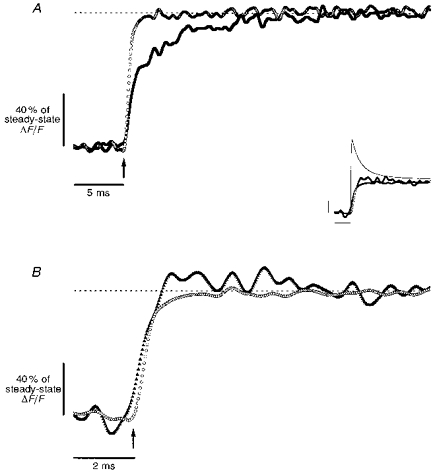
A, global illumination fluorescence transients recorded in response to step (filled squares) and supercharging (open circles) command pulses. Traces are signal averaged, n = 5. B, expanded time scale view of fluorescence transients elicited by supercharging pulses and recorded from global (open circles, same trace as in A) and edge-tangent (filled triangles) regions (see Methods for definitions of illumination regions). Edge-tangent trace is signal averaged with n = 20. Inset, recorded transmembrane voltage (continuous line, pool A of the triple Vaseline-gap configuration) superimposed with fluorescence records from B. Scale bars same as in B. Dotted lines in A and B represent 100% of steady-state fluorescence recorded at 30 ms after the pulse; arrows indicate start of command pulse application. Fibre diameter, 138 μm; capacitance, 13.0 μF cm−2. Time constants and weighting factors for supercharging pulses: τ1 = 1.0 ms, 100%; τ2 = 3.2 ms, 30%; τ3 = 40.0 ms, 5%.
In obtaining CMCs, linear leak and capacitance components of current records were subtracted on-line using a P/-4 protocol from a subtracting holding potential of −130 mV. Application of command pulses and acquisition of data were performed via a multifunction PC AT board with 16-bit D/A and A/D converters (AT-MIO16 XE-10; National Instruments). Unless otherwise indicated, signals were filtered before acquisition as follows: voltage signals at 20 kHz with a 6-pole Bessel filter, current signals at 1 kHz with an 8-pole Bessel filter (Frequency Devices 902, Haverhill, MA, USA), and fluorescence signals at 2 kHz with an 8-pole Bessel filter.
The procedure for isolating surface membrane Na+ channel gating current contributions from CMC records was as follows. Families of command waveforms consisting of 1 ms step prepulses to +10 mV followed by step or supercharging pulses to incremental test voltages were applied. The CMCs recorded after the prepulses were subtracted from the CMCs in response to step and supercharging waveforms without prepulses to obtain the isolated gating current components of CMCs.
Optical signal detection
The triple Vaseline-gap chamber was mounted on the stage of a non-inverting microscope as described previously (Heiny & Vergara, 1982). Fluorescence was excited using a 150 W tungsten lamp and Koehler epi-illumination. The area of specimen illumination was adjusted by focusing the luminous field diaphragm onto the preparation with a × 20 objective (Fluo20, NA 0.75; Nikon, Japan). The functional definitions for our illumination protocols (Fig. 1) are characterized as follows: global — a roughly ellipsoid region of the fibre with a width of ∼100 μm, resulting in a weighted average signal similar to that defined previously (Ashcroft et al. 1985); edge - a semicircular region at the edge of the fibre with a short diameter of ∼15 μm and a long diameter of ∼30 μm, resulting in a region that represents 10–20% of the focal plane fibre area; edge-tangent - a circular region ∼30 μm in diameter with its perimeter at a tangent to the fibre border such that the contribution of surface membrane fluorescence was minimized. These regions were selected by adjusting the aperture of the field diaphragm and the position of the muscle fibre relative to the illuminating beam.
Figure 1. Schematic diagram of illumination protocols.
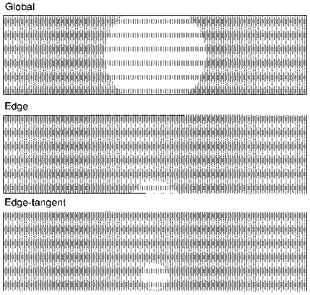
The regions were created by moving the location of the muscle fibre with respect to the illuminating beam and/or adjusting the diaphragm in the epifluorescence light path. Fibre diameter ≈100 μm. Not drawn precisely to scale.
For potentiometric studies, fluorescence was excited using a 480DF60 filter (Omega Optical, Brattleboro, VT, USA), selected with a 560DCLPO2 dichroic mirror (Omega Optical), and collected through a 610LP filter. For Ca2+ studies, the standard Nikon B2E filter set was used. Fluorescence emission was detected with a PIN photodiode (HR-020; UDT, Hawthorne, CA, USA) with the output signal connected to the headstage of a standard patch clamp amplifier (Axopatch-1B, Axon Instruments).
RESULTS
We applied supercharging command waveforms (see Methods), and recorded changes in the average T-system voltage (Vergara & Bezanilla, 1981) with the potentiometric fluorescent indicator di-8-ANEPPS (Rohr & Salzberg, 1994; Vergara & Kim, 1997). Figure 2 illustrates the kinetic differences seen in T-system response to step (Fig. 2A, upper panel) and supercharging (Fig. 2B, upper panel) command pulses. Step pulses produce fluorescence changes (ΔF/F) characterized by an early, fast jump followed by a slower rising phase over the remainder of the pulse (Fig. 2A, lower panel). In contrast, application of tuned supercharging pulses quickly establishes a steady-state plateau in the T-system voltage (Fig. 2B, lower panel). Longer pulses (50 ms, data not shown) in the same fibre confirmed that steady-state fluorescence converged to the same amplitude for both step and supercharging pulses (cf. Fig. 4C). Normalizing the fluorescence traces at each potential illustrates that, whereas with step pulses the T-system voltage achieved only 80% of steady state by the end of the 10 ms pulse (Fig. 2C, open symbols), with supercharging pulses the T-system reaches steady-state depolarization in 1.8 ms (Fig. 2C, filled symbols). On average, the T-system depolarization reached 95% of steady-state value within 1.6 ± 0.1 ms (mean ±s.d., n = 9 from 3 fibres) in response to supercharging pulses, and 13.1 ± 3.1 ms (mean ±s.d., n = 7 from 3 fibres) in response to step depolarizations. Superposition of traces at different voltages (Fig. 2C) also shows that the effects of the supercharging protocol on the kinetics and amplitudes of T-system depolarizations are scalable. The parameters of the supercharging waveforms were not found to be sensitive to membrane potential. Step and supercharging waveforms elicited scalable quasi-step transients at depolarizing or hyperpolarizing potentials of any amplitude in the range −190 to +30 mV (data not shown).
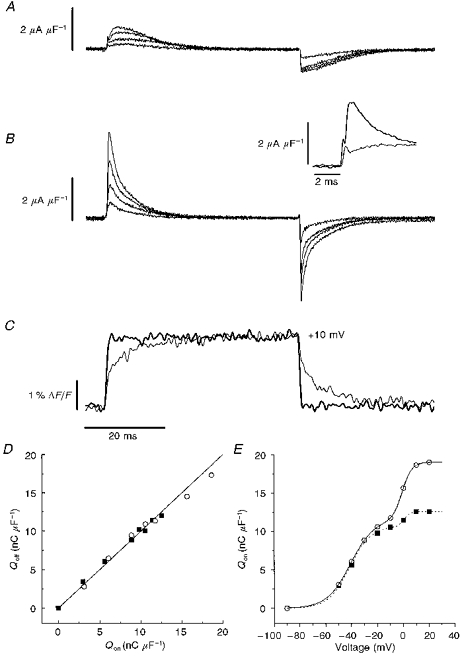
Figure 4. Intramembranous CMCs and di-8-ANEPPS fluorescence signals for step and supercharging pulses.
A notable concern was that although supercharging command waveforms can rapidly establish a quasi-step in the average T-system voltage, the peripheral regions of the T-system under these conditions might be severely overcompensated. Edge-tangent illumination experiments (Fig. 3; see also Kim & Vergara, 1997; Vergara & Kim, 1997) demonstrate that this is not the case. Figure 3A shows results similar to those shown in Fig. 2C, but obtained from another fibre in response to 100 mV step and supercharging command pulses. In comparing global with edge-tangent illumination records (Fig. 3B), it can be observed that the normalized features are not substantially different. When referenced to percentage of steady-state ΔF/F, the amplitude of the edge-tangent trace slightly exceeds (by ≤ 5%) that of the global trace during the first 4–7 ms of the pulse. However, as the inset of Fig. 3 illustrates, the recorded voltage rises faster and is considerably larger than either of the potentiometric signals (scaled such that 100% steady state = 100 mV).
Measurement of CMCs is a widely used approach to investigate T-system voltage sensor behaviour in skeletal muscle E-C coupling (Schneider & Chandler, 1973; Rios & Pizarro, 1991). Figure 4A and B portray how rapid stepping of T-system potential influences CMC kinetics. The family of currents in response to conventional step depolarizations (Fig. 4A) are similar in amplitude and time course to those reported previously (Schneider & Chandler, 1973; Kovacs et al. 1979; Huang, 1982; Vergara & Caputo, 1983; Melzer et al. 1986; Hui & Chandler, 1990; Shirokova et al. 1995). As seen in Fig. 4B, supercharging CMCs from the same fibre are larger (mean IQ,max, 8.8 vs. 4.4 μA μF−1; n = 5, P < 0.01, Student's 2-tailed t test) than their counterparts in Fig. 4A, and peak in < 1 ms. Figure 4, inset, compares the early features of a supercharging CMC (thick line) and the equivalent step CMC (thin line) on an expanded time scale. The former rises and begins to decay ∼2 ms before the latter peaks. Both current records also display an early spike that represents surface membrane Na+ gating current (Collins et al. 1982; Campbell, 1983). The currents in Fig. 4B decay bi-exponentially (τfast range, 1.3-1.8 ms; τslow range, 7.3-11.9 ms), whereas those in Fig. 4A fall with a single exponential time course (τ range, 12.5-26.7 ms). Potentiometric records for the same fibre (Fig. 4C) verify that the supercharging pulse protocol was optimized to produce a quasi-step in T-system voltage with an amplitude identical to that achieved at steady state by a step waveform. The superimposed traces again demonstrate the kinetic improvement achieved over traditional step pulses.
A steady-state comparison of on (Qon) and off (Qoff) charge movements (Fig. 4D) shows a linear relationship over the range of voltages tested. On average, the maximum charge mobilized (Qmax) at 50 ms was 23 ± 8 nC μF−1 (±s.d., n = 5) for step pulses and 30 ± 9 nC μF−1 (±s.d., n = 5) for supercharging pulses. The charge contributions of surface membrane Na+ gating currents were not subtracted, but represent < 5% of the total Qon and Qoff in both step and supercharging cases. When the ratios of the maximum charge mobilized with supercharging versus step pulses (Qmax,super/Qmax,step) were computed for each experiment, an average of 37 ± 18% (±s.d., n = 5) more charge was recruited when supercharging pulses were used (P < 0.01). Figure 4E shows that this gain in charge manifests itself mostly at higher test voltages. Both sets of data are well fitted by double Boltzmann functions, suggesting the presence of at least two voltage-sensing charge components (Hui & Chandler, 1990; Shirokova et al. 1995). However, the relative contribution of the higher voltage charge component is larger in the supercharging versus the step case (Qmax2, 7.4 versus 1.9 nC μF−1, respectively).
The kinetics of T-system depolarization also distinctly influences SR Ca2+ release transients (Fig. 5). In response to step pulses, Ca2+ transients (Fig. 5A) have an onset latency (Palade & Vergara, 1982; Zhu et al. 1986) that diminishes with increasing voltage (range, 11–2.5 ms; from −40 to +30 mV, respectively). This latency is dramatically reduced by supercharging (Fig. 5B), and instead transients at all voltages share an initial, irreducible delay (Vergara & Delay, 1986) of 1.5 ms. Figure 5C and D shows that supercharging-evoked Ca2+ transients rise earlier and faster than their step-evoked counterparts at high as well as at low voltages. In this fibre, the time between peak rates of Ca2+ release for supercharging versus step transients is 6.0 ms at −40 mV (Fig. 5C) and 2.8 ms at +30 mV (Fig. 5D), intervals that are consistently observed (6.2 ± 0.6 ms at −40 mV; 2.1 ± 0.7 ms at +30 mV; mean ±s.d., n = 3). These findings demonstrate how sensitive the initial phase of Ca2+ release is to temporal variance in T-system depolarization.
Figure 5. OGB-5N fluorescence transients in response to 20 ms step and supercharging pulses (edge illumination, see Methods).
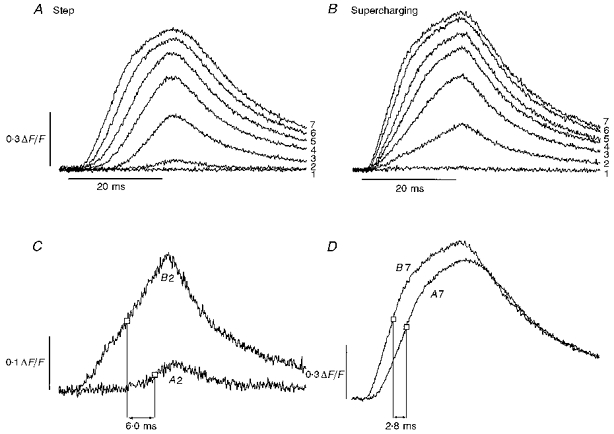
A, family of seven Ca2+ transients induced by step depolarizations from a holding potential of −90 mV to −50, −40, −30, −20, −10, +10 and +30 mV (labelled 1–7, respectively). B, family of Ca2+ transients obtained in response to supercharging pulses corresponding to the depolarizations in A (labelled 1–7). C, superimposed transients from A and B elicited by step and supercharging pulses to −40 mV. Open squares denote the point where half-maximal ΔF/F is achieved in each transient and the difference in time between these points is labelled. D, same comparison as in C, but with transients from A and B corresponding to step and supercharging pulses to +30 mV. Fibre diameter, 110 μm; capacitance, 15.2 μF cm−2. Dye concentration, 200 μM. Time constants and weighting factors for supercharging pulses in B: τ1 = 1.0 ms, 100%; τ2 = 3.0 ms, 70%; τ3 = 40.0 ms, 5%.
A comparison of the early time courses of simultaneously recorded CMCs and Ca2+ transients is shown on an expanded time scale in Fig. 6. Panels A-C illustrate that when supercharging pulses are applied and the surface membrane Na+ gating current (dotted lines) is subtracted, a rapid CMC component (Iρ, thin continuous lines) remains which precedes the onset of the Ca2+ transient at every voltage. Moreover, as larger supercharging pulses recruit more of this early component, steeper rising phase slopes are evident in corresponding Ca2+ transients. In contrast, step pulses produce rounded CMCs (Fig. 6D -F, thin continuous lines, surface membrane Na+ gating currents subtracted) which are associated with slower Ca2+ transients that have prolonged latencies.
Figure 6. Simultaneous records of CMCs (thin lines) superimposed with OGB-5N fluorescence transients (thick lines) for supercharging and step pulses.
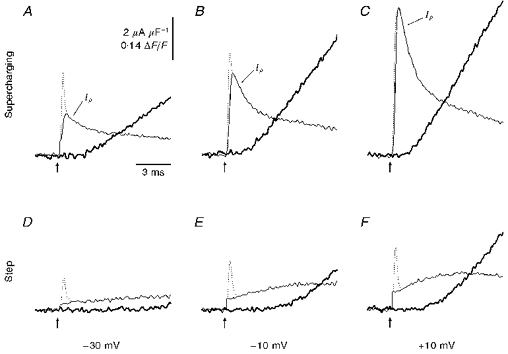
A-C, traces elicited by supercharging pulses to −30, −10 and +10 mV. D-F, analogous records in response to step-depolarizing pulses. The Na+ gating current contributions (dotted lines in A-F) were obtained in separate trials using 1 ms pulses and subtracted from each record. Arrows indicate start of stimulus pulse. Same fibre as in Fig. 5.
DISCUSSION
We present here a refined portrait of skeletal muscle E-C coupling wherein the kinetics of gating and Ca2+ release are distinctly accelerated. Our experiments address those events that occur on the time scale of an action potential and provide the first set of measurements uninhibited by the slow charging of the T-system. The results illustrate that by quickly (in < 2 ms) establishing a steady-state potential in the T-system, supercharging pulses reveal a Ca2+ release process virtually free of voltage-dependent latencies, and a fast CMC component, Iρ.
The development of supercharging waveforms (Fig. 2, described in Methods) that could properly boost the rate of T-system depolarization was a critical step in overcoming the kinetic limitations encountered when applying step command waveforms. Pulse waveforms that generated quasi-step T-tubule depolarizations during experiments (fast peaks exponentially decaying to steps) were found to induce similar kinetic improvement in radial cable model (Adrian et al. 1969a) simulations (A. M. Kim & J. L. Vergara, unpublished observations). Although these waveforms can cause overcharging of the average (globally recorded) T-system potential when applied improperly (Vergara & Kim, 1997), care was taken in all experiments reported here to choose waveform parameters so that such overcompensation was avoided. As documented in Fig. 3, it is interesting to note that correct compensation of the average T-system potential did not result in severe overcompensation of peripheral regions of the T-system. This finding is compatible with the existence of an access resistance to the T-system with an effective magnitude that is larger than the lumen resistivity (Adrian & Peachey, 1973).
The scalable kinetics of di-8-ANEPPS transients (Fig. 2C) demonstrates that potentiometric dye response to both step and supercharging pulses was linear over the range of voltages tested. Step pulse-evoked global fluorescence transients achieved 95% of steady state in 13.1 ms, a time similar to the ∼15-20 ms observed previously in studies using several potentiometric indicators (Vergara & Bezanilla, 1981; Heiny & Vergara, 1982, 1984; Heiny et al. 1983), but slower than the 3.7 ms reported by Heiny & Jong (1990) using the absorbance dye WW375. This discrepancy may be based on the fact that WW375 exhibits prominent wavelength-dependent dichroic absorbance properties that can bias signals towards surface membrane contributions (Vergara & Bezanilla, 1981; Heiny & Vergara, 1984).
Step-elicited CMCs (e.g. Fig. 4A) are typical of those seen in amphibian skeletal muscle in that they evidence amplitude and kinetic features characteristic of the previously reported intramembranous charge components Qβ and Qγ (Huang, 1982; Vergara & Caputo, 1983; Melzer et al. 1986; Hui & Chandler, 1990; Rios & Pizarro, 1991; Shirokova et al. 1995; Pape et al. 1996). In comparison, the supercharging CMCs in Fig. 4B (also Fig. 4, inset) reflect the more rapid mobilization of charge components afforded by quasi-step T-system depolarizations. These CMC records closely resemble gating current records reported for ionic channels in other preparations (Armstrong & Bezanilla, 1973; Bezanilla & Stefani, 1994), whereas the CMCs observed in response to conventional step pulses (e.g. Fig. 4A) do not. From the results in Fig. 4C (cf. Fig. 2), it can be inferred that the rounded appearance of classical step CMCs is probably a direct consequence of rate-limited depolarization of the T-system.
The linear relationship between Qon and Qoff in the steady state (Fig. 4D) indicates that CMCs elicited by both step and supercharging pulses probably reflect true charge movements rather than ionic current contributions (Armstrong & Bezanilla, 1973; Schneider & Chandler, 1973; Melzer et al. 1986). Although the average values of Qmax for both step and supercharging cases are within the range of those reported previously in the literature for step pulses (Schneider & Chandler, 1973; Kovacs et al. 1979; Vergara & Caputo, 1983; Melzer et al. 1986; Shirokova et al. 1995; Pape et al. 1996), the charge-voltage (Q-V) relationships (Fig. 4E) differ for supercharging versus step pulses. Surprisingly, significantly more Qmax (37 ± 18%, on average) is mobilized in the former case than in the latter. Although the ultimate implications of this finding will require further exploration, there are manifestations of step versus supercharging T-system membrane depolarization that may be responsible for differences in steady-state Qmax. For example, slower depolarization rates may limit the detection of non-linear, multiple-component CMC contributions from intrinsically slow voltage sensors. Our results suggest that the rapid depolarization rates attained through supercharging provide enough acceleration of charge mobilization such that CMCs previously masked in the noise of the detection system become evident. This is analogous to how squid giant axon K+ gating current charge movements were resolved above the background noise when their kinetics were accelerated by increasing temperature (Bezanilla et al. 1982). Furthermore, model simulations show that by compensating for the access resistance, supercharging pulses effect a more uniform voltage distribution along the T-system than step pulses (A. M. Kim & J. L. Vergara, unpublished observations). Thus it should also be the case that supercharging pulses better probe CMC contributions from the innermost elements of the T-system.
Ca2+ release transients show accelerations as dramatic as those seen in T-system voltage and CMC records. Interestingly, Fig. 5B shows that supercharging synchronizes the voltage gating of Ca2+ release over the family of voltages applied. That is, the Ca2+ release appears to emanate from a single point in time, regardless of the voltage applied. In contrast, the onset of Ca2+ release in the equivalent step-induced family of transients (Fig. 5A) is smeared over time. This suggests that the previously reported voltage-dependent latency in the onset of Ca2+ transients (Zhu et al. 1986) is probably not an inherent property of Ca2+ release in skeletal muscle, but rather a reflection of the time course of depolarization in the T-system when using step pulses.
As portrayed in Fig. 6, the E-C coupling kinetic scheme unveiled by supercharging is markedly faster than the step pulse scheme. On this expanded time scale, it was necessary to exclude the contribution of the fast surface membrane Na+ gating current (Collins et al. 1982; Campbell, 1983) in order to obtain solely transverse tubular CMCs. The resulting supercharging CMCs include a charge component that responds swiftly (Iρ, Fig. 6A-C; cf. Fig. 4B) to quasi-steps in T-system voltage and is associated with the gating of an accelerated, more synchronized Ca2+ release process. Although vastly reduced, it can be seen that a variable delay still exists in the onset of Ca2+ release elicited in response to the supercharging pulses at different voltages. This imperfect synchronization may reflect delays in the transduction process itself (e.g. the triadic delay, Vergara & Delay, 1986) in combination with a still rate-limited charging of the T-system capacitance. Nevertheless, the tight kinetic correlation between Iρ and Ca2+ release suggests that the rapid, voltage-dependent movement of membrane charges contributing to Iρ actually gates Ca2+ release on the physiological time scale. A corollary to this finding is that the long latencies in Ca2+ release observed with step depolarizations (Figs 5 and 6) may simply reflect slower mobilization of the gating charges. Furthermore, it is likely that Iρ includes contributions from previously reported charge components (e.g. Qβ and Qγ) that, via supercharging, are mobilized more quickly.
Since electrically restricted membrane compartments are not unusual in biology (e.g. cardiac muscle or extended neuronal processes; Rall et al. 1995), the experimental methodology developed for this work may be used as a template for studying signal transduction in other preparations.
Acknowledgments
We thank F. Bezanilla, S. Krasne, J. R. Monck and D. DiGregorio for their helpful comments and discussions. A. M. K. was partially supported by NIH training grant GM08042 (UCLA MSTP). This work was supported by NIH grant AR25201 to J. L. V.
References
- Adrian RH, Chandler WK, Hodgkin AL. The kinetics of mechanical activation in frog muscle. The Journal of Physiology. 1969a;204:207–230. doi: 10.1113/jphysiol.1969.sp008909. [DOI] [PMC free article] [PubMed] [Google Scholar]
- Adrian RH, Costantin LL, Peachey LD. Radial spread of contraction in frog muscle fibres. The Journal of Physiology. 1969b;204:231–257. doi: 10.1113/jphysiol.1969.sp008910. [DOI] [PMC free article] [PubMed] [Google Scholar]
- Adrian RH, Peachey LD. Reconstruction of the action potential of frog sartorius muscle. The Journal of Physiology. 1973;235:103–131. doi: 10.1113/jphysiol.1973.sp010380. [DOI] [PMC free article] [PubMed] [Google Scholar]
- Armstrong CM, Bezanilla F. Currents related to movement of the gating particles of the sodium channels. Nature. 1973;242:459–461. doi: 10.1038/242459a0. [DOI] [PubMed] [Google Scholar]
- Armstrong CM, Chow RH. Supercharging: a method for improving patch-clamp performance. Biophysical Journal. 1987;52:133–136. doi: 10.1016/S0006-3495(87)83198-3. [DOI] [PMC free article] [PubMed] [Google Scholar]
- Ashcroft FM, Heiny JA, Vergara J. Inward rectification in the transverse tubular system of frog skeletal muscle studied with potentiometric dyes. The Journal of Physiology. 1985;359:269–291. doi: 10.1113/jphysiol.1985.sp015585. [DOI] [PMC free article] [PubMed] [Google Scholar]
- Bezanilla F, Stefani E. Voltage-dependent gating of ionic channels. Annual Review of Biophysics and Biomolecular Structure. 1994;23:819–846. doi: 10.1146/annurev.bb.23.060194.004131. [DOI] [PubMed] [Google Scholar]
- Bezanilla F, White MM, Taylor RE. Gating currents associated with potassium channel activation. Nature. 1982;296:657–659. doi: 10.1038/296657a0. [DOI] [PubMed] [Google Scholar]
- Campbell DT. Sodium channel gating currents in frog skeletal muscle. Journal of General Physiology. 1983;82:679–701. doi: 10.1085/jgp.82.5.679. [DOI] [PMC free article] [PubMed] [Google Scholar]
- Collins CA, Rojas E, Suarez-Isla BA. Fast charge movements in skeletal muscle fibres from Rana temporaria. The Journal of Physiology. 1982;324:319–345. doi: 10.1113/jphysiol.1982.sp014115. [DOI] [PMC free article] [PubMed] [Google Scholar]
- Falk G, Fatt P. Linear electrical properties of striated muscle fibres observed with intracellular electrodes. Proceedings of the Royal Society B. 1964;160:69–123. doi: 10.1098/rspb.1964.0030. [DOI] [PubMed] [Google Scholar]
- Heiny JA, Ashcroft FM, Vergara J. T-system optical signals associated with inward rectification in skeletal muscle. Nature. 1983;301:164–166. doi: 10.1038/301164a0. [DOI] [PubMed] [Google Scholar]
- Heiny JA, Jong DS. A nonlinear electrostatic potential change in the T-system of skeletal muscle detected under passive recording conditions using potentiometric dyes. Journal of General Physiology. 1990;95:147–175. doi: 10.1085/jgp.95.1.147. 10.1085/jgp.95.1.147. [DOI] [PMC free article] [PubMed] [Google Scholar]
- Heiny JA, Vergara J. Optical signals from surface and T system membranes in skeletal muscle fibers. Experiments with the potentiometric dye NK2367. Journal of General Physiology. 1982;80:203–230. doi: 10.1085/jgp.80.2.203. 10.1085/jgp.80.2.203. [DOI] [PMC free article] [PubMed] [Google Scholar]
- Heiny JA, Vergara J. Dichroic behavior of the absorbance signals from dyes NK2367 and WW375 in skeletal muscle fibers. Journal of General Physiology. 1984;84:805–837. doi: 10.1085/jgp.84.5.805. 10.1085/jgp.84.5.805. [DOI] [PMC free article] [PubMed] [Google Scholar]
- Huang CL-H. Pharmacological separation of charge movement components in frog skeletal muscle. The Journal of Physiology. 1982;324:375–387. doi: 10.1113/jphysiol.1982.sp014118. [DOI] [PMC free article] [PubMed] [Google Scholar]
- Hui CS, Chandler WK. Intramembranous charge movement in frog cut twitch fibers mounted in a double vaseline-gap chamber. Journal of General Physiology. 1990;96:257–297. doi: 10.1085/jgp.96.2.257. 10.1085/jgp.96.2.257. [DOI] [PMC free article] [PubMed] [Google Scholar]
- Kim AM, Vergara JL. Voltage gating kinetics of skeletal muscle calcium release investigated with supercharging pulses. Biophysical Journal. 1997;72:A119. [Google Scholar]
- Kovacs L, Rios E, Schneider MF. Calcium transients and intramembrane charge movement in skeletal muscle fibres. Nature. 1979;279:391–396. doi: 10.1038/279391a0. [DOI] [PubMed] [Google Scholar]
- Melzer W, Schneider MF, Simon BJ, Szucs G. Intramembrane charge movement and calcium release in frog skeletal muscle. The Journal of Physiology. 1986;373:481–511. doi: 10.1113/jphysiol.1986.sp016059. [DOI] [PMC free article] [PubMed] [Google Scholar]
- Palade P, Vergara J. Arsenazo III and antipyrylazo III calcium transients in single skeletal muscle fibers. Journal of General Physiology. 1982;79:679–707. doi: 10.1085/jgp.79.4.679. 10.1085/jgp.79.4.679. [DOI] [PMC free article] [PubMed] [Google Scholar]
- Pape PC, Jong DS, Chandler WK. A slow component of intramembranous charge movement during sarcoplasmic reticulum calcium release in frog cut muscle fibers. Journal of General Physiology. 1996;107:79–101. doi: 10.1085/jgp.107.1.79. 10.1085/jgp.107.1.79. [DOI] [PMC free article] [PubMed] [Google Scholar]
- Peachey LD. The sarcoplasmic reticulum and transverse tubules of the frog's sartorius. Journal of Cell Biology. 1965;25:209–231. doi: 10.1083/jcb.25.3.209. 10.1083/jcb.25.3.209. [DOI] [PubMed] [Google Scholar]
- Rall W. In: The Theoretical Foundation of Dendritic Function: Selected Papers of Wilfrid Rall With Commentaries. Segev I, Rinzel J, Shepherd GM, editors. Cambridge, MA, USA: MIT Press; 1995. p. 456. [Google Scholar]
- Rios E, Pizarro G. Voltage sensor of excitation-contraction coupling in skeletal muscle. Physiological Reviews. 1991;71:849–908. doi: 10.1152/physrev.1991.71.3.849. [DOI] [PubMed] [Google Scholar]
- Rohr S, Salzberg BM. Multiple site optical recording of transmembrane voltage. Biophysical Journal. 1994;67:1301–1315. doi: 10.1016/S0006-3495(94)80602-2. [DOI] [PMC free article] [PubMed] [Google Scholar]
- Schneider MF, Chandler WK. Voltage dependent charge movement of skeletal muscle: a possible step in excitation-contraction coupling. Nature. 1973;242:244–246. doi: 10.1038/242244a0. [DOI] [PubMed] [Google Scholar]
- Shirokova N, Gonzalez A, Ma J, Shirokov R, Rios E. Properties and roles of an intramembranous charge mobilized at high voltages in frog skeletal muscle. The Journal of Physiology. 1995;486:385–400. doi: 10.1113/jphysiol.1995.sp020820. [DOI] [PMC free article] [PubMed] [Google Scholar]
- Vergara J, Bezanilla F, Salzberg BM. Nile blue fluorescence signals from cut single muscle fibers under voltage or current clamp conditions. Journal of General Physiology. 1978;72:775–800. doi: 10.1085/jgp.72.6.775. 10.1085/jgp.72.6.775. [DOI] [PMC free article] [PubMed] [Google Scholar]
- Vergara J, Caputo C. Effects of tetracaine on charge movements and calcium signals in frog skeletal muscle fibers. Proceedings of the National Academy of Sciences of the USA. 1983;80:1477–1481. doi: 10.1073/pnas.80.5.1477. [DOI] [PMC free article] [PubMed] [Google Scholar]
- Vergara J, Delay M. A transmission delay and the effect of temperature at the triadic junction of skeletal muscle. Proceedings of the Royal Society B. 1986;229:97–110. doi: 10.1098/rspb.1986.0077. [DOI] [PubMed] [Google Scholar]
- Vergara JL, Bezanilla F. Optical studies of E-C coupling with potentiometric dyes. In: Grinnell A, Brazier M, editors. The Regulation of Muscle Contraction: Excitation-contraction Coupling. New York: Academic Press; 1981. pp. 66–77. [Google Scholar]
- Vergara JL, Delay M, Heiny JA, Ribalet B. Optical studies of T-system potential and calcium release in skeletal muscle fibers. In: Grinnell A, Moody W, editors. The Physiology of Excitable Cells. New York: Alan R. Liss, Inc.; 1983. pp. 343–355. [Google Scholar]
- Vergara JL, Kim AM. Supercharging command pulses permit rapid voltage stepping of t-tubule membranes in skeletal muscle fibers. Biophysical Journal. 1997;72:A274. [Google Scholar]
- Zhu PH, Parker I, Miledi R. Minimal latency of calcium release in frog twitch muscle fibres. Proceedings of the Royal Society B. 1986;229:39–46. doi: 10.1098/rspb.1986.0073. [DOI] [PubMed] [Google Scholar]