

Abstract
The mechanisms underlying hemispheric asymmetry of the inositol 1,4,5-trisphosphate (InsP3)-calcium signalling pathway in Xenopus oocytes were examined by fluorescence imaging of calcium signals and recording calcium-activated Cl− currents (ICl,Ca) evoked by intracellular calcium injections and photorelease of InsP3.
The maximal ICl,Ca evoked by strong photorelease of InsP3 was 8 times greater in the animal than the vegetal hemisphere, but the average threshold amounts of InsP3 required to evoke detectable currents were similar in each hemisphere.
Currents evoked by injections of calcium were about 2.5 times greater near the animal pole than near the vegetal pole, whereas fluorescence signals evoked by injections were similar in each hemisphere.
Calcium waves were evoked by photolysis flashes of similar strengths in both hemispheres of albino oocytes, but peak calcium levels evoked by supramaximal stimuli were 70% greater in the animal hemisphere.
Elementary calcium release events (puffs) in the animal hemisphere had amplitudes about double that in the vegetal hemisphere, and more often involved coupled release from adjacent sites. Calcium release sites were more closely packed in the animal hemisphere, with a mean spacing of about 1.5 μm compared with 2.25 μm in the vegetal hemisphere.
The larger amplitude of currents mediated by InsP3 in the animal hemisphere, therefore, involves an increased flux of calcium at individual release units, a more dense packing of release units and a higher density of Cl− channels.
Oocytes of Xenopus laevis are polarized, non-excitable cells that display marked structural and functional hemispheric asymmetry. Morphological differences include a striking pigmentation of the animal versus vegetal hemisphere, a greater number of microvilli in the animal hemisphere, the location of the germinal vesicle (nucleus) near the animal pole, and a higher density of yolk granules in the vegetal hemisphere (Dascal, 1987). Electrophysiologically, extracellular applications of calcium-mobilizing agonists evoke larger membrane currents (Kusano et al. 1982; Miledi & Parker, 1989) and fluorescence calcium signals (Parker & Yao, 1994) in the animal hemisphere than in the vegetal hemisphere. These responses arise through a phosphoinositide second messenger pathway in which agonist binding to G protein-linked cell surface receptors generates inositol 1,4,5-trisphosphate (InsP3) which, in turn, evokes calcium release from intracellular stores (Berridge, 1993), leading finally to activation of a Ca2+-dependent Cl− conductance (ICl,Ca) (Miledi & Parker, 1984; Dascal, 1987; Hartzell, 1996). Developmentally, the animal-vegetal polarity predetermines the anterior-posterior axis of the embryo, and disruptions of inositol phosphate messenger pathway by Li+ produce teratogenic effects (Berridge et al. 1989).
Inter-hemispheric differences in sensitivities to extracellular application of agonists could arise at many steps in the phosphoinositide pathway. It has been shown, however, that intracellular injection (Berridge, 1988; Lupu-Meiri et al. 1988) or photorelease (Callamaras & Parker, 1998) of InsP3 in the animal hemisphere elicits much larger Cl− currents than in the vegetal hemisphere, suggesting that much of the asymmetry can be attributed to stages subsequent to InsP3 formation. There is evidence that the animal hemisphere shows both an increased liberation of calcium by InsP3 and a greater activation of ICl,Ca by a given free [Ca2+]; but the relative weights to be ascribed to each factor remain unclear. Lupu-Meiri et al. (1988) found that, whereas InsP3 injection evoked much larger currents in the animal hemisphere, there was little difference between the hemispheres in response to intracellular injection of calcium. They thus concluded that chloride channel densities were similar in both hemispheres, but that the animal hemisphere contains a larger InsP3-sensitive calcium store. Consistent with a larger InsP3-sensitive pool, immunolocalization of InsP3 receptors in oocytes shows staining in a narrow sub-plasmalemmal band that is more intense in the animal hemisphere (Parys et al. 1992; Kume et al. 1993; Callamaras & Parker, 1994). On the other hand, a recent study (Gomez-Hernandez et al. 1997) reports a 10-fold greater density of Cl− channels in membrane patches excised from the animal hemisphere, suggesting that asymmetric distribution of Cl− channels may yet contribute substantially to the overall hemispheric sensitivity to InsP3 (Gomez-Hernandez et al. 1997).
Improvements in calcium imaging techniques have revealed that calcium liberation from intracellular stores can be functionally deconstructed into elementary units (Yao et al. 1995; Parker et al. 1996a; Lipp & Niggli, 1996; Berridge, 1997), whereby high levels of InsP3 generate propagating waves, while lower levels evoke localized, transient calcium signals (calcium puffs) at discrete release sites spaced several micrometres apart (Parker & Yao, 1991; Yao et al. 1995). These calcium puffs are thought to arise through the concerted opening of several InsP3 receptor-channels clustered at functional release sites (Parker et al. 1996a; Berridge, 1997), so that the greater overall calcium response in the animal hemisphere might then arise through a higher density of release sites and/or a greater calcium liberation during individual events. In the light of these new findings on the functional organization of InsP3-sensitive release sites and the asymmetric distribution of chloride channels, we were interested to re-examine the factors underlying hemispheric differences in InsP3 signalling in the oocyte and, in particular, to extend these studies to the microscopic level of elementary calcium release events.
METHODS
Preparation of oocytes, intracellular microinjection and electrophysiological recording
Immature (stage V and VI) oocytes of Xenopus laevis were obtained and defolliculated as previously described (Sumikawa et al. 1989). In brief, frogs were anaesthetized by immersion in a 0.17% aqueous solution of MS-222 (3-aminobenzoic acid ethyl ester) for 15 min and a small portion of the ovary removed surgically through an abdominal incision, after which the wound was sutured and animals were allowed to recover. All recordings were made at room temperature, with oocytes bathed in normal Ringer solution (composition in mM: NaCl, 120; KCl, 2; CaCl2, 1.8; Hepes, 5; pH ∼7.2). Measurements of Cl− membrane currents were obtained using a two-electrode voltage clamp, at a holding potential of −60 mV. Intracellular microinjections were made by applying pneumatic pressure pulses to micropipettes with tips broken to diameters of a few micrometres. The amounts injected were controlled by varying the pressure and duration of pulses, and were calculated from the diameters of fluid droplets expelled with the pipette tip raised in the air.
Normally pigmented oocytes were used when possible, as identification of the hemispheres is obvious and unequivocal. However, attenuation of photolysis light by pigment in the animal hemisphere complicates quantitative analysis of results obtained using photorelease of InsP3. Oocytes obtained from albino frogs were therefore used for most experiments involving flash photolysis. The animal-vegetal axis is more difficult to identify in albino oocytes, but the germinal vesicle could be visualized as a translucent bright spot when oocytes were transilluminated by a small (200 μm) spot of light or by the laser spot used for confocal imaging.
Photorelease of InsP3 and calcium imaging
Oocytes were loaded about 30–60 min before recording with 5 μM caged InsP3 (myo-inositol 1,4,5-trisphosphate, P4(5)−1-(2-nitrophenyl) ethyl ester), either alone (for measurements of Cl− current), or together with calcium indicator. Final intracellular concentrations of caged InsP3 and indicator were, respectively, about 5 and 50 μM. Flashes of UV (340–400 nm) light were used to evoke photorelease of InsP3 within defined subcellular regions. The relative amounts of InsP3 formed were varied by controlling the duration and intensity of photolysis flashes. Photolysis systems used in conjunction with voltage clamp recording of ICl,Ca are described in detail by Parker (1992) and in conjunction with confocal linescan imaging by Callamaras & Parker (1998).
Images of calcium release evoked by photoreleased InsP3 were obtained using a ‘home-made’ confocal linescan system interfaced to an Olympus IX70 inverted microscope (Parker et al. 1997). In brief, a spot of light formed by the 488 nm line of an argon ion laser was scanned repeatedly along a fixed line in the specimen every 8 ms, and calcium-dependent fluorescence was monitored at wavelengths > 510 nm by an avalanche diode photon counting module. Recordings of fluorescence along successive scans were then stacked to form linescan images in which the vertical dimension represents distance along the scan line, and time runs from left to right. The scan line was 50 μm long, and the UV light for photolysis was focused as a uniform spot of about 150 μm diameter centred around the scan line. The point spread function of the confocal system, measured using 90 nm fluorescent beads, was < 300 nm lateral and < 500 nm axial. Fluorescence is shown as a ratio (F/Fo) relative to the average fluorescence at each pixel prior to stimulation. All recordings were obtained with the scan line focused at the depth of the pigment granules in the oocyte (roughly 6 μm below the surface), where InsP3-sensitive release sites are concentrated (Yao et al. 1995). Because of this location of release sites and the ‘optical sectioning’ capability of the confocal microscope, it was possible to image in the animal hemisphere of pigmented oocytes without difficulty. Paired measurements from each hemisphere of a given oocyte were obtained by manually rolling the cell to visualize the animal or vegetal poles through the inverted microscope. Oregon Green 488 BAPTA-1 (Oregon Green-1) was used as the indicator in most experiments, as its high affinity (a few hundred nanomolar) allows good visualization of calcium puffs and waves. However, free calcium levels evoked by maximal stimulation saturate this dye, and the low affinity (ca 12 μM) indicator Oregon Green BAPTA-5 N (Oregon Green-5N) was used instead for quantitative comparisons of peak free [Ca2+] in each hemisphere.
Reagents
Fluo-3 and Oregon Green indicators were obtained from Molecular Probes Inc. Caged InsP3 was from Calbiochem or Molecular Probes. All other reagents were from Sigma Chemical Co.
RESULTS
Currents evoked by photoreleased InsP3
We first wished to confirm and extend earlier studies showing that InsP3 evokes much larger currents in the animal hemisphere than in the vegetal hemisphere (Berridge, 1988; Lupu-Meiri et al. 1988; Callamaras & Parker, 1998). To avoid complications of locally high InsP3 concentrations resulting from direct microinjection of InsP3, we loaded albino oocytes with caged InsP3, and then photoreleased free InsP3 by delivering flashes of UV light focused as a square of 50 μm × 50 μm that could be positioned over either hemisphere. Figure 1 shows measurements of peak membrane currents evoked by photolysis flashes of varying duration applied to both hemispheres of a single albino oocyte. The maximal currents evoked by flashes greater than 10 times threshold in the animal hemisphere were 440% of those in the vegetal hemisphere, and similar experiments in a total of eleven oocytes gave a value of 830 ± 101% (mean ±s.e.m.) Saturation of the currents with strong flashes did not result from consumption of caged InsP3, since the flash intensity was such that only a tiny fraction (ca 1%) of the caged InsP3 would have been photolysed, and formation of InsP3 is expected to vary linearly with flash duration (Callamaras & Parker, 1998). The threshold amounts of InsP3 (i.e. flash durations) required to evoke a detectable current were not appreciably different between the hemispheres (Fig. 1). Also, no differences were apparent in the time course of currents evoked in each hemisphere (decay time constants: animal = 260 ± 22 ms; vegetal = 256 ± 17 ms; means ±s.e.m. of 8 observations in each hemisphere).
Figure 1. ICl,Ca evoked by photoreleased InsP3 is larger in the animal hemisphere, but the threshold for activation is similar in both hemispheres.

Data from a single albino oocyte show peak amplitudes of ICl,Ca evoked by photolysis flashes of varying durations, focused as a 50 μm × 50 μm square positioned on the animal (▪) and vegetal (□) hemispheres. Clamp potential was −60 mV.
Currents evoked by injections of calcium in the animal and vegetal hemispheres
As described in the Introduction, reports in the literature give widely varying values for the relative chloride currents activated by a given increase in cytosolic free [Ca2+] in each hemisphere. Regional variations in calcium sensitivity were investigated by recording currents evoked by injecting fixed amounts of calcium from an injection pipette filled with 100 mM CaCl2(Fig. 2A). The size of the fluid droplet expelled by the pressure pulse was monitored each time the pipette was withdrawn and re-inserted at a new site to ensure that the pipette did not become plugged, and impalement sites were selected in random order. Mean currents near the vegetal pole were about one-half the amplitude of those in the animal hemisphere, but were of similar size across the entire animal hemisphere as well as in the vegetal hemisphere near the equator (Fig. 2B). In contrast to the brief time course of currents evoked by photoreleased InsP3 in both hemispheres, the duration (at half-maximal amplitude) of calcium-evoked currents decreased progressively from about 8 s near the vegetal pole to about 1.5 s at the equator, and then remained roughly constant across the animal hemisphere (Fig. 2C).
Figure 2. Variation in ICl,Ca evoked by intracellular microinjection of calcium at various positions along the animal-vegetal axis of the oocyte.
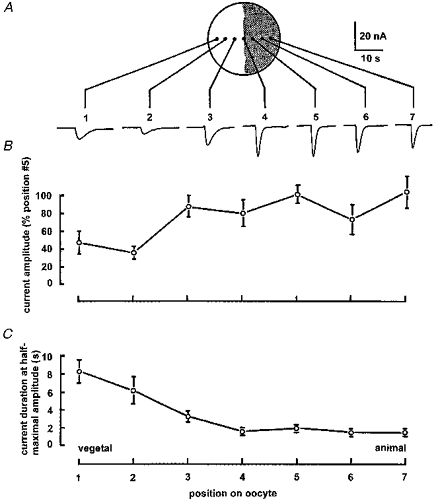
A, membrane currents evoked by repeated injections of about 300 fmol calcium, recorded at a clamp potential of −60 mV in a single oocyte. Each trace was obtained with the pipette inserted at the corresponding position shown on the diagram, and sites were selected in random order. B, mean peak sizes of ICl,Ca evoked by calcium injections at various positions. Numbers along the abscissa correspond to numbered sites in A. Data were obtained from 5 oocytes, and error bars indicate ± 1 s.e.m. from between 3 and 13 observations. Measurements are normalized by expressing values in each oocyte as a percentage of that at position 5 in that oocyte. C, variation in mean half-duration of ICl,Ca at different locations across the oocyte.
The larger currents in the animal hemisphere might arise through activation of a greater conductance by a given elevation of free cytosolic [Ca2+], or because calcium buffering was less effective in that hemisphere, so that a given amount of calcium produced a larger increase in free [Ca2+]. To test the latter possibility, we used the fluorescent calcium indicator fluo-3 to monitor free [Ca2+] changes associated with injections of similar amounts of calcium into each hemisphere of albino oocytes. Mean peak fluorescence signals evoked by calcium injections in the vegetal hemisphere were 88 ± 4% of that in the animal hemisphere (mean ±s.e.m.; 9 paired trials in 3 oocytes, injecting 100–200 fmol Ca2+).
InsP3-evoked calcium waves
To examine differences in calcium signals between the hemispheres, we began by studying calcium waves evoked by strong photorelease of InsP3, and then imaged the elementary calcium release events evoked by lower [InsP3]. The relative threshold concentrations of InsP3 required to sustain wave propagation in each hemisphere were determined by recording linescan calcium images following photolysis flashes of varying durations. The threshold was defined as the minimum flash duration required to evoke a calcium wave extending across the entire imaging line. Oocytes from albino frogs were used for this experiment, so that light absorption by pigment would not lead to an artifactually high threshold in the animal hemisphere. Figure 3A summarizes results from paired measurements from nine oocytes (3 donor frogs). For each cell, mean threshold durations were determined at four or more regions at the animal pole and are presented as a percentage of similar measurements at the vegetal pole. Threshold flash strengths in the animal hemispheres of individual cells varied from about one-half to twice that in the vegetal hemispheres, and relative sensitivities of the hemispheres appeared more consistent within oocytes from a given donor frog than between different donors. The overall mean from nine oocytes examined showed little systematic difference in sensitivity between the hemispheres. Nevertheless, it is clear that the animal and vegetal hemispheres of individual cells often show consistently different sensitivities, and that the order of sensitivity can vary.
Figure 3. Differences in thresholds and amplitudes of calcium waves in the two hemispheres.
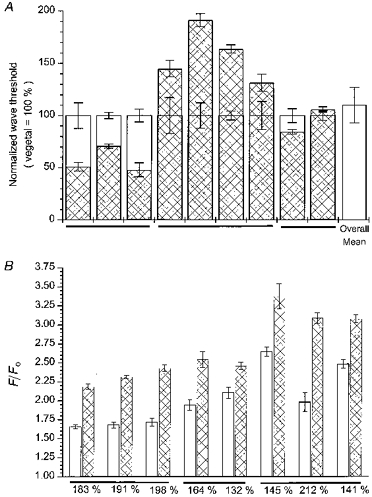
A, histogram bars show mean durations of photolysis flashes required to just evoke calcium waves in the animal hemisphere ( ), as a percentage of that in the vegetal hemisphere of the same cells (□). Data were obtained from 9 albino oocytes loaded with caged InsP3 and Oregon Green-1, and horizontal lines group oocytes obtained from the same donor frogs. Calcium signals were visualized by linescan imaging, and the threshold flash durations required to just evoke calcium waves propagating across the entire recording line were determined at 4–7 locations within roughly 100 μm regions around the vegetal and animal poles of each cell. Error bars show ±1 s.e.m. of measurements in each hemisphere. The rightmost bar shows the overall mean of the 9 oocytes. B, maximal Oregon Green-5N fluorescence signals are greater in the animal hemisphere. Data were obtained from 8 oocytes (3 frogs; indicated by horizontal lines) and show paired measurements of peak fluorescence ratios (F/FO) evoked by supra-maximal photolysis flashes (10 times wave threshold) delivered to the animal () and vegetal (□) hemispheres of pigmented oocytes. Error bars represent ±1 s.e.m. of 4–9 measurements in each hemisphere, and percentage values indicate mean responses in the animal hemisphere relative to the vegetal hemisphere for each cell.
In other experiments, we determined the relative peak concentrations of free calcium attained following strong photorelease of InsP3. Oregon Green-5N was used as the calcium indicator for this purpose, as its low affinity (about 12 μM) provides a signal about linearly proportional to free [Ca2+] over the range found in the oocyte, whereas Oregon Green-1 signals become saturated during large responses (Parker et al. 1996b). Flash strengths were set to about 10 times the wave threshold in each hemisphere, which is sufficient to obtain an almost maximal calcium response (Parker et al. 1996b). Figure 3B shows results from eight oocytes, plotting the mean peak fluorescence ratios measured from several regions (6 μm across) in each hemisphere. Paired measurements showed that the signals in the animal hemisphere were on average 171 ± 11% of those in the vegetal hemisphere of the same oocytes. The durations of calcium signals were similar in each hemisphere, with mean durations (5 oocytes) at half-maximal amplitude of 2.32 ± 0.14 s (animal) and 2.19 ± 0.10 s (vegetal).
Calcium puffs in the animal and vegetal hemispheres
To examine the mechanisms of calcium release at finer resolution, we used the confocal linescan microscope to image the elementary calcium release events (puffs) evoked by photolysis flashes weaker than the wave threshold. Figure 4A illustrates representative puffs in the animal and vegetal hemispheres of the same oocyte, and Fig. 4B shows averaged images formed from selected puffs in other records obtained in each hemisphere. Two differences are readily apparent between the hemispheres. Firstly, the amplitudes of puffs in the animal hemisphere were over twice that in the vegetal hemisphere. Figure 5 shows distributions of peak fluorescence signals (F/Fo) during puffs recorded in each hemisphere of two oocytes. In both animal and vegetal hemispheres the puff amplitudes followed skewed Gaussian distributions, with respective mean fluorescence ratios of 2.70 ± 0.065 (mean ±s.e.m.; n = 82 events) and 1.80 ± 0.031 (n = 141).
Figure 4. Calcium puffs and waves evoked by photoreleased InsP3.
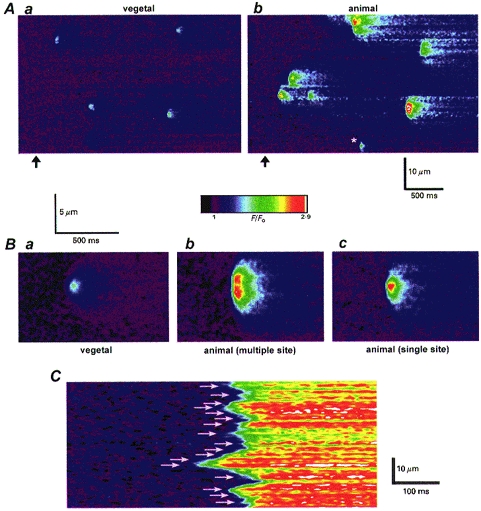
A, confocal linescan images illustrating typical patterns of calcium puffs evoked in the vegetal (a) and animal (b) hemispheres of a single, pigmented oocyte. In each image, distance along the laser scan line is depicted vertically, and time runs from right to left. Fluorescence of the calcium indicator Oregon Green-1 is shown as a ratio relative to the resting level at each pixel before stimulation (F/Fo), and increasing fluorescence ratios correspond to increasingly ‘warm’ colours, as indicated by the colour bar. Data were acquired at resolutions of 8 ms per line and 0.139 μm per pixel. Photolysis flashes of fixed intensity were delivered when marked by the arrows, and had durations that evoked similar frequencies of puffs in each hemisphere (of 42 ms (a) and 72 ms (b)). B, averaged images showing representative puffs in the vegetal hemisphere (a) and selected puffs in the animal hemisphere that appeared to arise at double (b) or single (c) sites. Each average was formed from 7 individual events selected from records like those in A, all in the same oocyte. Fluorescence ratios are scaled as depicted by the colour bar. C, image from the vegetal hemisphere of a different oocyte showing abrupt calcium liberation evoked by a strong photolysis flash. Arrows mark the locations of presumptive calcium release sites, identified by short latency responses and bright fluorescence signals. The pseudo-colour scale in this image was enhanced.
Figure 5. Puffs are of greater amplitude in the animal hemisphere.
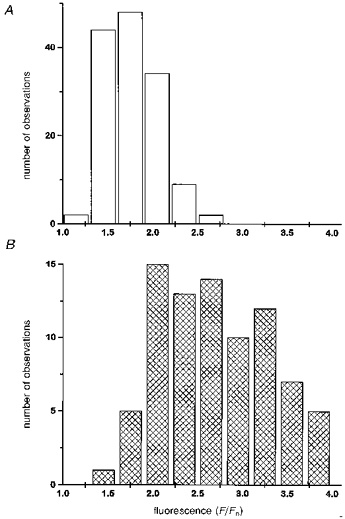
Histograms show distributions of peak fluorescence signals (F/Fo; Oregon Green-1) during puffs recorded in the vegetal (A; □) and animal (B; ) hemispheres. Paired measurements were obtained from each hemisphere of two oocytes. Events that appeared to involve paired release sites were excluded.
Secondly, puffs in the animal hemisphere often presented a more ‘blunt’ appearance, with a greater spatial spread (Fig. 4B b) than those in the vegetal hemisphere (Fig. 4B a). This did not appear to result simply because more calcium was released, or because calcium diffused more readily, since other puffs in the animal hemisphere showed a more restricted spread (Fig. 4B c and event marked by asterisk in Fig. 4Ab). Instead, many puffs in the animal hemisphere appeared to involve near-synchronous calcium release from adjacent sites (Yao et al. 1995). Consistent with this, the averaged multiple-site puff in Fig. 4Bb showed two distinct peaks of fluorescence along the scan line about 1.6 μm apart, and instances were observed where successive puffs evoked at a given location by repeated photolysis flashes involved release from either single or paired sites (not shown).
Calcium puffs in the animal hemisphere more frequently involve multiple sites
To estimate the proportions of puffs involving release from individual or multiple sites, we measured the full widths of puffs at their half-maximal amplitudes (FWHM in μm) at the time of peak fluorescence. The puff width estimated in this way will, therefore, include both the diffusive spread of calcium and, for multiple-site events, the separation between release sites along the scan line. Data are shown in Fig. 6A and B from measurements in four albino oocytes, using photolysis flashes of strengths that evoked similar frequencies of puffs in each hemisphere. Measurements from puffs in the animal hemisphere (Fig. 6B) showed a wide distribution of puff widths, which could be fitted by the sum of two Gaussian components with means of 3.4 and 5.2 μm and respective relative areas of 1: 2.9. We interpret these components as arising from, respectively, puffs involving single and double release sites along the scan line. The spacing between the components (1.8 μm) is expected to correspond to spacings between release sites, and is in reasonable agreement with the spacing of 1.6 μm between the two peaks in the averaged double-site puff in Fig. 4B b. The relative areas of the Gaussian components indicate that double-site puffs were observed nearly 3 times as often as single-site events. Furthermore, this probably underestimates the true proportion of multiple-site events, because the linescan images provide only a single (x) dimension of spatial information and would not resolve synchronous release at adjacent sites displaced in the y and z axes. Puffs in the vegetal hemisphere (Fig. 6A), on the other hand, could largely be described by a single Gaussian distribution, with the same mean (3.4 μm) as the smaller component in the animal hemisphere, whereas there was evidence for only a small proportion (< 20%) of puffs corresponding to the larger component. Thus, almost all puffs in the vegetal hemisphere appear to involve calcium release from individual sites, which diffuses across a mean width (at half-maximal amplitude) of 3.4 μm. Similar results were obtained also in two pigmented oocytes, which showed a mean spacing between single- and double-site components in the animal hemisphere of 1.7 μm.
Figure 6. Puffs in the animal hemisphere are of greater width, and calcium release sites are packed more closely.

A and B, histograms show the spatial spread of calcium during puffs in, respectively, the vegetal and animal hemispheres, measured as the full width at half-maximal peak amplitude (FWHM). Data are from 4 albino oocytes. C and D, measurements of spacings between adjacent calcium release sites in, respectively, the vegetal and animal hemispheres of 2 pigmented oocytes. Data were obtained by identifying release sites activated during abrupt calcium liberation, as illustrated in Fig. 4C.
Density of calcium release sites in the animal and vegetal hemispheres
The greater proportion of multiple-site puffs in the animal hemisphere might arise because the larger amounts of calcium released are more effective in triggering neighbouring sites, and/or because release sites are more densely packed. To examine the latter point we evoked abrupt calcium liberation by stimulating with stronger photolysis flashes (> 20 times those evoking puffs). Under this condition, calcium release begins independently with short latency at many release sites, rather than being sequentially triggered by calcium diffusion during a wave (Callamaras et al. 1998). Active release sites could then be identified as bright, rapidly responding regions along the serrated rising front of calcium in linescan images (Fig. 4C). Figure 6C and D shows measurements derived in this way of spacings between release sites in the animal and vegetal hemispheres. In both hemispheres there was a wide variability, suggesting an irregular packing of release sites, but the mean spacing in the animal hemisphere (1.5 μm) was closer than in the vegetal hemisphere (2.25 μm).
DISCUSSION
An understanding of the basis of the polarization of the InsP3-calcium signalling pathway in Xenopus oocytes (Kusano et al. 1982; Dascal, 1987; Lupu-Meiri et al. 1988; Berridge, 1988; Miledi & Parker, 1989) is important both for studies of the physiological functioning and development of the oocyte (Berridge et al. 1989) and for interpreting results obtained using the oocyte as a tool for expression of calcium-mobilizing receptors (Dascal, 1987; Miledi et al. 1989) that, themselves, may be asymmetrically distributed (Peter et al. 1991). We found that maximal photorelease of InsP3 evoked Cl− currents that were about 8 times greater in the animal hemisphere than in the vegetal hemisphere, a ratio that falls within the range (5.5-22) obtained earlier with injections of InsP3 (Berridge, 1988; Lupu-Meiri et al. 1988) or the 6- to 20-fold greater currents evoked by calcium-mobilizing agonists applied to the animal hemisphere (Miledi & Parker, 1989). It appears, therefore, that the increased response in the animal hemisphere can largely be accounted for by stages downstream from InsP3 production, rather than from upstream events involving activation of phospholipase-C by cell surface receptors. Our results implicate at least two stages in the pathway. Firstly, currents evoked by a given amount of calcium microinjected into the oocyte were about twice as large near the animal pole as near the vegetal pole. Secondly, the magnitudes of calcium waves and elementary events as reported by fluorescent indicators were greater in the animal hemisphere in response to photoreleased InsP3. A similar conclusion was made in a recent report (Machaca & Hartzell, 1998) that appeared after submission of the present paper. In that study InsP3-evoked chloride currents (ICl-1) were found to be about 5-fold higher in the animal versus the vegetal hemisphere, which could be accounted for in part by a 2-fold greater release of calcium.
The hemispheric variation in sensitivity to calcium injections does not appear to arise primarily through differences in calcium buffering or pumping, since fluorescence calcium signals evoked by injections of calcium into the animal hemisphere were only about 14% greater than in the vegetal hemisphere. Instead, the results suggest a slightly greater density of Cl− channels in the membrane of the animal hemisphere or a population of channels with greater conductance or higher sensitivity. Gomez-Hernandez et al. (1997) recently reported that membrane patches excised from the animal pole of oocytes exhibited about 10-fold larger ICl,Ca than patches from the vegetal pole, even after normalizing for pipette resistance and patch capacitance. Because the properties of ICl,Ca were similar in each hemisphere, they considered it likely that the asymmetry in current arose through an asymmetrical distribution of channels. The difference in current amplitude between patches excised from each hemisphere was, however, much greater than the 2-fold larger currents we observed following intracellular calcium injections near the animal pole, and the even more modest (12%) asymmetry in calcium-activated currents reported by Lupu-Meiri et al. (1988). Reasons for this discrepancy are not clear, but it may be that calcium injections activate channels with a higher affinity than those seen in excised patches, which required > 27 μM free [Ca2+] for half-maximal activation (Gomez-Hernandez et al. 1997). An alternative explanation, proposed by Lupu-Meiri et al. (1988) on the basis of their findings that currents evoked by calcium injections decayed more rapidly in the animal hemisphere, is that there may be two hemisphere-specific, calcium-activated chloride currents with different kinetic properties. Our results showing that calcium injections evoke chloride currents of longer duration in the animal hemisphere than in the vegetal hemisphere (8 s vs. 2 s) confirm those of Lupu-Meiri et al. (1988), but the further finding that photorelease of InsP3 evokes similarly rapid (250 ms half-decay) currents in each hemisphere does not support the idea of kinetically distinguishable Cl− channels in each hemisphere. Instead, the different time courses following calcium injections may arise from differences in spatio-temporal spread and uptake of calcium ions introduced as a bolus at a virtual point source.
InsP3-mediated calcium liberation in the oocyte occurs at discrete release sites. At low [InsP3] these function autonomously to generate transient, localized elementary events, whereas they become sensitized at higher [InsP3] to support calcium wave propagation as calcium ions diffusing from one site trigger calcium-induced calcium release (CICR) at adjacent sites (Lechleiter & Clapham, 1992; Yao et al. 1995). The larger overall currents evoked by InsP3 in the animal hemisphere might then arise, in part, because more calcium is liberated during puffs at individual sites, and/or because the spacings between sites are closer in the animal than in the vegetal hemisphere. Peak fluorescence signals during puffs were 2.1 times greater in the animal hemisphere, indicating a greater rate of local calcium liberation. A likely explanation is that release sites in the animal hemisphere contain more InsP3 receptor-channels, since immunolocalization studies of InsP3 receptors show a greater overall staining in the animal hemisphere (Parys et al. 1992; Kume et al. 1993; Callamaras & Parker, 1994), although it is also possible that the calcium content of the stores may be greater in the animal hemisphere.
The mean lateral spacing between release sites was about 1.5 μm near the animal pole and 2.25 μm near the vegetal pole. These values are smaller than we had previously estimated using video-rate confocal imaging (about 6 μm: Yao et al. 1995), probably because the poorer spatial and temporal resolution of the video-rate system would not have allowed discrimination of separate events arising within a few micrometres of one another. Because functional release sites and InsP3 receptors are arranged as a thin, essentially two dimensional sheet a few micrometres under the surface membrane of the oocyte (Parys et al. 1992; Callamaras & Parker, 1994; Yao et al. 1995), spacings of 1.5 and 2.25 μm in the animal and vegetal hemispheres correspond to a packing density about 2.25 times greater in the animal hemisphere. The greater calcium release per puff, together with the closer packing of release sites in the animal hemisphere, is expected to enhance functional coupling between sites due to triggering of CICR by calcium diffusing from neighbouring active sites. Consistent with this, puffs in the animal hemisphere showed a much higher proportion of events involving synchronous release at adjacent sites than in the vegetal hemisphere. On the other hand, these factors might also be expected to reduce the threshold amount of InsP3 required to sustain calcium wave propagation in the animal hemisphere, but we did not find any consistent difference in sensitivities between the hemispheres.
A rough accounting, multiplying the effects of the 2.1 times greater amplitude of calcium puffs in the animal hemisphere, the 2.2 times greater packing density of puff sites and the 2 times greater currents evoked by calcium injections into the animal hemisphere, indicates that InsP3-evoked currents should be about 9 times greater in the animal hemisphere than in the vegetal. This agrees well with our observation of 8-fold greater currents evoked by photoreleased InsP3 in the animal hemisphere. However, an anomalous result is that maximal fluorescence signals during calcium waves were only about 70% greater in the animal hemisphere, compared with the 4.6-fold enhancement expected on the basis of the greater puff amplitude and packing density. A possible explanation is that the macroscopic calcium signal during waves is limited by depletion of store contents or by calcium-inhibition of InsP3 receptors (Berridge, 1993), rather than by the maximal rate of calcium flux. The substantially larger ICl,Ca evoked by InsP3 in the animal hemisphere may then arise if the chloride channels are situated close to InsP3 receptor-channels and sense the very high local gradients of [Ca2+] during the initial phase of calcium release (cf. Rizzuto et al. 1993). In that case, the overall magnitude of ICl,Ca should be determined by the number of release sites activated and the local [Ca2+] gradient at each site (proportional to calcium flux), rather than being proportional to the spatially averaged cytosolic free [Ca2+].
Such a mechanism would also resolve two further puzzling features of ICl,Ca. Firstly, whereas reported values of the calcium concentrations needed for activation of chloride channels (Neely et al. 1994; Gomez-Hernandez et al. 1997) are high compared with overall cytosolic free calcium levels during InsP3 signalling, they are in the range of concentrations expected at nanometre distances from an open channel pore (Stern, 1992). Secondly, the time course of ICl,Ca is much briefer than that of corresponding fluorescence calcium measurements (260 ms vs. 2.3 s; and see Parker & Yao, 1994). We had originally proposed that this might arise through ‘adaptation’ of the Cl− channels (Parker & Yao, 1994), but Gomez-Hernandez et al. (1997) subsequently reported that excised Cl− channels showed sustained responses to calcium. Instead, the chloride channels may be activated only transiently while InsP3 receptor-channels are open, and then shut rapidly as the local calcium gradients collapse after termination of release, even though the spatially averaged calcium level in the cytosol remains elevated for much longer.
Acknowledgments
This work was supported by grants GM39831 and GM48071 from the United States Public Health Services.
References
- Berridge MJ. Inositol-trisphosphate-induced membrane potential oscillations in Xenopus oocyte. The Journal of Physiology. 1988;403:589–599. doi: 10.1113/jphysiol.1988.sp017266. [DOI] [PMC free article] [PubMed] [Google Scholar]
- Berridge MJ. Inositol trisphosphate and cell signalling. Nature. 1993;361:315–325. doi: 10.1038/361315a0. [DOI] [PubMed] [Google Scholar]
- Berridge MJ. Elementary and global aspects of calcium signalling. The Journal of Physiology. 1997;499:291–306. doi: 10.1113/jphysiol.1997.sp021927. [DOI] [PMC free article] [PubMed] [Google Scholar]
- Berridge MJ, Downes CP, Hanley MR. Neural and developmental actions of lithium: A unifying hypothesis. Cell. 1989;59:411–419. doi: 10.1016/0092-8674(89)90026-3. [DOI] [PubMed] [Google Scholar]
- Callamaras N, Marchant JS, Sun X-P, Parker I. Activation and co-ordination of InsP3-mediated elementary Ca2+ events during global Ca2+ signals in Xenopus oocytes. The Journal of Physiology. 1998;509:81–91. doi: 10.1111/j.1469-7793.1998.081bo.x. [DOI] [PMC free article] [PubMed] [Google Scholar]
- Callamaras N, Parker I. Inositol 1,4,5-trisphosphate receptors in Xenopus laevis oocytes: localization and modulation by Ca2+ Cell Calcium. 1994;15:66–78. doi: 10.1016/0143-4160(94)90105-8. [DOI] [PubMed] [Google Scholar]
- Callamaras N, Parker I. Caged InsP3 for studying release of Ca2+ from intracellular stores. Methods in Enzymology. 1998;291:380–403. doi: 10.1016/s0076-6879(98)91024-2. [DOI] [PubMed] [Google Scholar]
- Dascal N. The use of Xenopus oocytes for the study of ion channels. CRC Critical Reviews in Biochemistry. 1987;22:317–387. doi: 10.3109/10409238709086960. [DOI] [PubMed] [Google Scholar]
- Gomez-Hernandez J-M, Stuhmer W, Parekh AB. Calcium dependence and distribution of calcium-activated chloride channels in Xenopus oocytes. The Journal of Physiology. 1997;502:569–574. doi: 10.1111/j.1469-7793.1997.569bj.x. [DOI] [PMC free article] [PubMed] [Google Scholar]
- Hartzell HC. Activation of different Cl currents in Xenopus oocytes by Ca liberated from stores and by capacitative Ca influx. Journal of General Physiology. 1996;108:157–175. doi: 10.1085/jgp.108.3.157. 10.1085/jgp.108.3.157. [DOI] [PMC free article] [PubMed] [Google Scholar]
- Kume S, Muto A, Aruga J, Nakagawa T, Michikawa T, Furuichi T, Nakade S, Okano H, Mikoshiba K. The Xenopus IP3 receptor: structure, function, and localization in oocytes and eggs. Cell. 1993;73:555–570. doi: 10.1016/0092-8674(93)90142-d. [DOI] [PubMed] [Google Scholar]
- Kusano K, Miledi R, Stinnakre J. Cholinergic and catecholaminergic receptors in the Xenopus oocyte membrane. The Journal of Physiology. 1982;328:143–170. doi: 10.1113/jphysiol.1982.sp014257. [DOI] [PMC free article] [PubMed] [Google Scholar]
- Lechleiter JD, Clapham DE. Molecular mechanisms of intracellular calcium excitability in X. laevis oocytes. Cell. 1992;69:283–294. doi: 10.1016/0092-8674(92)90409-6. [DOI] [PubMed] [Google Scholar]
- Lipp P, Niggli E. A hierarchical concept of cellular and subcellular Ca2+ signaling. Progress in Biophysics and Molecular Biology. 1996;65:265–296. doi: 10.1016/s0079-6107(96)00014-4. 10.1016/S0079-6107(96)00014-4. [DOI] [PubMed] [Google Scholar]
- Lupu-Meiri M, Shapira H, Oron Y. Hemispheric asymmetry of rapid chloride responses to inositol trisphosphate and calcium in Xenopus oocytes. FEBS Letters. 1988;240:83–87. doi: 10.1016/0014-5793(88)80344-2. 10.1016/0014-5793(88)80344-2. [DOI] [PubMed] [Google Scholar]
- Machaca K, Hartzell HC. Asymmetrical distribution of Ca-activated Cl channels in Xenopus oocytes. Biophysical Journal. 1998;74:1286–1295. doi: 10.1016/S0006-3495(98)77842-7. [DOI] [PMC free article] [PubMed] [Google Scholar]
- Miledi R, Parker I. Chloride current induced by injection of calcium into Xenopus oocytes. The Journal of Physiology. 1984;357:173–183. doi: 10.1113/jphysiol.1984.sp015495. [DOI] [PMC free article] [PubMed] [Google Scholar]
- Miledi R, Parker I. Latencies of membrane currents evoked in Xenopus oocytes by receptor activation, inositol trisphosphate and calcium. The Journal of Physiology. 1989;415:189–210. doi: 10.1113/jphysiol.1989.sp017718. [DOI] [PMC free article] [PubMed] [Google Scholar]
- Miledi R, Parker I, Sumikawa K. Transplanting receptors from brains into oocytes. In: Smith J, editor. Fidia Neuroscience Award Lectures. Vol. 3. New York: Raven Press; 1989. pp. 57–90. [Google Scholar]
- Neely A, Olese R, Wei X, Birnbaumer L, Stefani E. Ca2+-dependent inactivation of a cloned cardiac Ca2+channel alpha-1 subunit (alpha-1-c) expressed in Xenopus oocytes. Biophysical Journal. 1994;66:1895–1903. doi: 10.1016/S0006-3495(94)80983-X. [DOI] [PMC free article] [PubMed] [Google Scholar]
- Parker I. Use of caged intracellular messengers for studying the inositol trisphosphate pathway. In: Boulton AA, Baker GB, Taylor CW, editors. Neuromethods, Intracellular Messengers. Vol. 20. New Jersey: Humana; 1992. pp. 369–393. [Google Scholar]
- Parker I, Callamaras N, Wier WG. A high resolution confocal laser scanning microscope and flash photolysis system for physiological studies. Cell Calcium. 1997;21:441–452. doi: 10.1016/s0143-4160(97)90055-5. 10.1016/S0143-4160(97)90055-5. [DOI] [PubMed] [Google Scholar]
- Parker I, Choi J, Yao Y. Elementary events of InsP3-induced Ca2+ liberation in Xenopus oocytes: Hot spots, puffs and blips. Cell Calcium. 1996a;20:105–121. doi: 10.1016/s0143-4160(96)90100-1. 10.1016/S0143-4160(96)90100-1. [DOI] [PubMed] [Google Scholar]
- Parker I, Yao Y. Regenerative release of calcium from functionally discrete subcellular stores by inositol trisphosphate. Proceedings of the Royal Society B. 1991;246:269–274. doi: 10.1098/rspb.1991.0154. [DOI] [PubMed] [Google Scholar]
- Parker I, Yao Y. Relation between intracellular Ca2+ signals and Ca2+-activated Cl− current in Xenopus oocytes. Cell Calcium. 1994;15:276–288. doi: 10.1016/0143-4160(94)90067-1. 10.1016/0143-4160(94)90067-1. [DOI] [PubMed] [Google Scholar]
- Parker I, Yao Y, Ilyin V. Fast kinetics of calcium liberation induced in Xenopus oocytes by photoreleased inositol trisphosphate. Biophysical Journal. 1996b;70:222–237. doi: 10.1016/S0006-3495(96)79565-6. [DOI] [PMC free article] [PubMed] [Google Scholar]
- Parys JB, Sernett SW, De Lisle S, Snyder PM, Welsh MJ, Campbell KP. Isolation, characterization and localization of the inositol 1,4,5-trisphosphate receptor in Xenopus laevis oocytes. Journal of Biological Chemistry. 1992;267:18776–18782. [PubMed] [Google Scholar]
- Peter AB, Schittny JC, Niggli E, Reuter H, Sigel E. The polarized distribution of poly (A+)-mRNA-induced functional ion channels in the Xenopus oocyte is prevented by anticytoskeletal drugs. Journal of Cell Biology. 1991;114:455–464. doi: 10.1083/jcb.114.3.455. 10.1083/jcb.114.3.455. [DOI] [PMC free article] [PubMed] [Google Scholar]
- Rizzuto R, Brini M, Murgia M, Pozzan T. Microdomains with high Ca2+ close to IP3-sensitive channels that are sensed by neighboring mitochondria. Science. 1993;262:744–747. doi: 10.1126/science.8235595. [DOI] [PubMed] [Google Scholar]
- Stern MD. Buffering of calcium in the vicinity of a channel pore. Cell Calcium. 1992;13:183–192. doi: 10.1016/0143-4160(92)90046-u. 10.1016/0143-4160(92)90046-U. [DOI] [PubMed] [Google Scholar]
- Sumikawa K, Parker I, Miledi R. Expression of neurotransmitter receptors and voltage-activated channels from brain mRNA in Xenopus oocytes. Methods in Neuroscience. 1989;1:30–45. [Google Scholar]
- Tigyi G, Dyer D, Matute C, Miledi R. A serum factor that activates the phosphatidylinositol phosphate signaling system in Xenopus oocytes. Proceedings of the National Academy of Sciences of the USA. 1990;87:1521–1525. doi: 10.1073/pnas.87.4.1521. [DOI] [PMC free article] [PubMed] [Google Scholar]
- Yao Y, Choi J, Parker I. Quantal puffs of intracellular Ca2+ evoked by inositol trisphosphate in Xenopus oocytes. The Journal of Physiology. 1995;482:533–553. doi: 10.1113/jphysiol.1995.sp020538. [DOI] [PMC free article] [PubMed] [Google Scholar]