Abstract
Whole-cell and single-channel Na+ currents were recorded from small (ca. 20 μm diameter) cells isolated from adult rat dorsal root ganglia (DRG). Currents were classified by their sensitivity to 0.3 μm tetrodotoxin (TTX), electrophysiological properties and single-channel amplitude. Cells were classified according to the types of current recorded from them.
Type A cells expressed essentially pure TTX-sensitive (TTX-S) currents. Availability experiments with prepulse durations between 50 ms and 1 s gave a half-available voltage (Vh) of around -65 mV but the availability curves often had a complex shape, consistent with multiple inactivation processes. Measured inactivation time constants ranged from less than 1 ms to over 100 s, depending on the protocol used.
Cell types B and C each had, in addition to TTX-S currents, substantial and different TTX-resistant (TTX-R) currents that we have designated TTX-R1 and TTX-R2, respectively. TTX-R1 currents had a 1 s Vh of -29 mV, showed little 1 Hz use dependence at -67 mV and recovered from the inactivation induced by a 60 ms depolarizing pulse with time constants of 1.6 ms (91 %) and 908 ms. They also exhibited slow inactivation processes with component time constants around 10 and 100 s. TTX-R2 currents activated and inactivated at more negative potentials (1 s Vh= -46 mV), showed substantial 1 Hz use dependence and had inactivation (60 ms pulse) recovery time constants at -67 mV of 3.3 ms (58 %) and 902 ms.
Type D cells had little or no current in 0.3 μm TTX at a holding potential of -67 mV. Current amplitude increased on changing the holding potential to -107 mV. Type D cell currents had more hyperpolarized availability and I-V curves than even TTX-R2 currents and suggest the existence of TTX-R3 channels.
In outside-out patches with 250 mM external NaCl, the single-channel conductance (γ) of TTX-S channels was 19.5 pS and the potential for half-maximal activation (Va) was -45 mV. One population of TTX-R channels had a γ of 9.2 pS and a Va of -27 mV. A second population had a γ of 16.5 pS and a more negative Va of -42 mV. The latter population may underlie the type D cell current.
Small DRG cells express multiple Na+ currents with varied time constants and voltage dependences of activation and inactivation. Nociceptive cells still fire when chronically depolarized by an increased external K+ concentration. TTX-R1 and TTX-R2 Na+ channels may support that firing, while the range of inactivation time constants described here would increase the repertoire of DRG cell burst firing behaviour generally.
Sensory neurones with their cell bodies in dorsal root ganglia (DRG neurones) transmit various types of sensory information from the periphery to the spinal cord. DRG neurones are a physically and functionally heterogeneous population, with cell bodies in adult rats ranging in size from less than 20 to over 50 μm diameter. During the last 20 years there has been increasing acceptance that cells of different size and sensory modality also express different mixes of voltage-gated ion channels, including pharmacologically and electrophysiologically distinct subtypes of voltage-gated Na+ channels. The initial DRG Na+ channel classification related to the effects of the Na+ channel blocker tetrodotoxin (TTX) and included TTX-sensitive (TTX-S) and TTX-resistant (TTX-R) currents (Kostyuk et al. 1981).
The first TTX-R currents to be described were slower to activate and inactivate than their TTX-S counterparts and had higher voltage thresholds for both activation and inactivation (Kostyuk et al. 1981; Schwartz et al. 1990; Caffrey et al. 1992; Roy & Narahashi, 1992; Elliott & Elliott, 1993; Ogata & Tatebayashi, 1993; Yoshimura et al. 1996). They also appeared to be preferentially expressed in smaller neurones, possibly those involved in nociception or pain physiology (Arbuckle & Docherty, 1995; Villière & McLachlan, 1996). Single-channel studies showed distinct current amplitudes of TTX-S and TTX-R channels (Roy et al. 1994; Motomura et al. 1995) and clones encoding peripheral neurone TTX-R Na+ channels have been identified (Akopian et al. 1996; Sangameswaran et al. 1996; Souslova et al. 1997). The activation threshold of some TTX-R Na+ channels was found to be lowered by agents which sensitize nociceptors and thus lower pain thresholds (Gold et al. 1996b; England et al. 1996). These observations on cell bodies prompted further study of axons, and C fibre compound action potentials resistant to both TTX and chronic depolarization have now been reported in frog (Buchanan et al. 1996) and human (Quasthoff et al. 1995) nerves. C fibres are associated with slow or burning pain, reinforcing the putative link between TTX-R Na+ channels and nociception.
The existing literature describes TTX-R and TTX-S currents from various types of DRG preparation (neonatal versus adult, acutely isolated or short-term (hours) culture versus long-term (days) culture) and in some cases there is a lack of agreement concerning major functional properties. For example, Elliott & Elliott (1993) concluded that the TTX-R currents they recorded recovered from short-pulse inactivation at -67 mV more quickly than the TTX-S currents and would therefore be likely to support repetitive firing (see also Cummins & Waxman, 1997; Schild & Kunze, 1997). By contrast, Ogata & Tatebayashi (1993), using a different experimental protocol, described TTX-R currents that recovered from inactivation much more slowly than TTX-S currents and hence could not support repetitive firing. Repetitive firing from a depolarized baseline is likely to be involved in both ‘normal’ (see e.g. the capsaicin-induced firing of isolated human DRG neurones in McLean et al. (1988)) and pathological (see e.g. Rizzo et al. 1996) sensory signalling, so identification of the channels responsible is an important aim.
The purpose of this paper is to present a view of DRG cell Na+ channel heterogeneity developed from over six years' work on small DRG cells from adult rats. Our data suggest one type of TTX-S current and three types of TTX-R current. These groupings are quite distinct and do not approach the ‘virtual continuum’ of properties described by Rizzo et al. (1994). However, this collection could in theory support a wide range of firing behaviour, with our TTX-R1 current appearing particularly well-suited to sustained firing at depolarized potentials. There remains the question as to how much of this diversity results from molecularly distinct channel subtypes (see e.g. Black et al. (1996)) and how much is caused by different gating modes and/or different subunit associations.
Preliminary reports of this work have been given to The Physiological Society (Bräu et al. 1995; Rush et al. 1995).
METHODS
Cell isolation
Cells were isolated from the dorsal root ganglia of adult (ca. 250 g) female Wistar rats. Rats were killed by concussion with subsequent cervical dislocation and ganglia dissected from the full length of the vertebral column. Cells were then prepared either as described by Elliott & Elliott (1993) or using the following shortened procedure. Trimmed ganglia were incubated for 30–40 min, in a shaking water bath at 37°C, in phosphate-buffered saline containing collagenase (2.5 mg ml−1, type XI) and trypsin (2.5 mg ml−1, type III-S). Following extensive washing in plating medium (PM), the ganglia were then triturated in a solution of trypsin inhibitor (100 μg ml−1, type I-S) and DNAse (80 μg ml−1, type IV) in PM. The cells were then suspended in normal PM and plated onto 35 mm tissue culture dishes, sometimes pre-coated with poly-l-lysine. Cells were kept at 37°C in a humidified atmosphere of 95 % air-5 % CO2 until use between 2 and 30 h after isolation. The plating medium was Eagle's minimal essential medium (with Earle's salts, NaHCO3 and no glutamine) plus freshly added glutamine (4 mM), penicillin (50 i.u. ml−1), streptomycin (0.5 mg ml−1) and 10 % (v/v) fetal calf serum (Myoclone Super Plus). Medium and enzymes were from Sigma; supplements were from Gibco or Sigma.
Solutions
The pipette solution for all whole-cell recordings (I1) contained (mM): CsF, 110 (total Cs+, 140); MgCl2, 5; EGTA, 11; NaCl, 10; Hepes, 10; pH 7.2 with CsOH. Our original whole-cell external solution (E1, Elliott & Elliott (1993)) contained (mM): NaCl, 65; choline chloride, 50; TEA chloride, 20; KCl, 5; CaCl2, 0.01; MgCl2, 5; glucose, 5; Na-Hepes, 5; Hepes, 5; pH 7.4 with NaOH. External solution E2 was a modification in which NaCl was lowered to 32.5 mM and choline chloride raised to 82.5 mM. External solution E3 was a further modification in which the 5 mM KCl in E2 was replaced by 5 mM CsCl. Most E3 solutions also contained 0.15-0.5 % dimethyl sulphoxide, with no apparent effect on current properties. Whole-cell voltages were corrected for a measured junction potential of -7 mV (as in Elliott & Elliott, 1993). The low calcium concentration (10 μm) in solutions E1-3 was required for the best inhibition of voltage-gated calcium currents. With higher external calcium levels (e.g. 1 mM) we often saw a prolonged inward current component that was small relative to the peak transient (sodium) current and which declined with time. We presume this to be a sustained calcium current. However, the seal instability frequently observed at more negative holding potentials in 10 μm external calcium made routine experiments with a holding potential of e.g. -100 mV virtually impossible.
For outside-out patch recordings the intracellular solution (I2) contained (mM): CsF, 240; NaCl, 10; EGTA, 3; Hepes, 10; pH adjusted to 7.2 with CsOH. The extracellular solution (E4) contained (mM): NaCl, 250; TEA chloride, 10; CsCl, 5; CaCl2, 1; MgCl2, 1; glucose, 6; Hepes, 10; pH adjusted to 7.4 with NaOH. The high external Na+ concentration enlarged single-channel events and the higher external Ca2+ concentration was required for stable patches. No correction was made to isolated patch voltages.
To record TTX-R currents in isolation, 0.3 μm TTX was applied externally to block TTX-S Na+ currents.
Electrophysiology
The main experimental details were as in Elliott & Elliott (1993). Only healthy-looking cells surrounded by a bright halo when viewed under phase contrast illumination were chosen for patching. Currents were recorded using either a List EPC-7 (Darmstadt, Germany) or an Axopatch 200A (Axon Instruments, Inc.) patch-clamp amplifier. The experiment was controlled, and data recorded, using pCLAMP 5 or 6 software in conjunction with IBM AT-compatible microcomputers and a TL-1 DMA or Digidata 1200 interface (Axon Instruments, Inc.). The sampling rate was at least twice, and usually four to five times, the low-pass filter frequency of 3 or 5 kHz. In whole-cell experiments, series resistance compensation was at least 60 % when using the List EPC-7 and at least 70 % with the Axopatch 200A. Analogue transient cancellation was used and the pre-compensation access resistance obtained from the amplifier was around 2.5 MΩ. Seventy per cent compensation would reduce this to 0.75 MΩ, giving a potential error of 4 mV for a 5 nA current. Pipettes used for single-channel experiments were made from thick-walled borosilicate glass coated with Sylgard; whole-cell pipettes were uncoated. Experiments were performed at room temperature (22 ± 2°C). The whole-cell leak current produced by a 10 mV depolarizing step was normally less than 10 pA.
The main whole-cell voltage protocols were as follows. Standard current-voltage (I-V) families were obtained using 30 ms pulses from Vhold (-67 mV) to voltages between -42 and 43 mV at a repetition frequency of 0.2 Hz. The voltage that gave the peak current, Vp, was noted for use in other protocols. Twenty or fifty current traces produced by a 10 mV depolarizing step were averaged, scaled appropriately and used for leak and transient subtraction. For the construction of mean I-V curves, individual leak-subtracted families were first normalized with respect to the peak (with voltage and time) current in that family and the maximum (with time) currents then measured at each voltage. Mean I-V curves were then made from the normalized data. Availability protocols consisted of prepulses from the holding potential (Vhold) to Vprepulse (appropriate voltages in the range -157 to -7 mV) followed by 30 ms at Vp. The maximum (with time) current during the pulse was then plotted against Vprepulse, either as raw data (non-normalized) or normalized to the maximum (with Vprepulse) value. The repetition frequency was usually 0.2 Hz for prepulses between 50 ms and 1 s, lower for longer prepulses. The time course of recovery at -67 mV from short-pulse (60 ms) inactivation was assessed by first giving a 60 ms pulse to Vp (pulse 1) followed after a variable interval (delay) by a 30 ms pulse, also to Vp (pulse 2). The membrane potential was set at -67 mV except during the two pulses. Pulse 2 current amplitude was expressed as a fraction of the maximum and plotted against delay. Repetition frequency was 0.1 Hz for protocols in which delay extended to 5 s. Use dependence runs of 1 Hz consisted of twenty pulses to Vp. Slow inactivation protocols are described in Results.
In outside-out patch experiments the holding potential was set to -100 mV. After a 20 ms prepulse to -120 mV, sodium channels were activated by 20 ms test pulses to different potentials between -70 and +20 mV. The single-channel current was determined from point amplitude histograms, constructed from 100 to 200 single-channel traces at each of the different test potentials. Fitting the histograms to double or triple Gaussian functions identified the peaks of closed and open states and the single-channel amplitude was determined as the difference between the peaks. Further, at each test potential all traces (100-200) were averaged and the peak sodium current of the averaged trace was determined to construct current-voltage relationships. For each trace, the averaged current responses during the 20 ms prepulse were used to produce leak- and transient-subtracted test pulse currents.
Whole-cell data analysis
Functions were fitted to data using the non-linear regression facilities of pCLAMP or PSI-Plot (Poly Software International, Salt Lake City, UT, USA). Normalized availability curves were fitted using single or double Boltzmann functions:
| (1) |
| (2) |
where Vpp is the prepulse potential, Vh is the mid-point potential and kh is the corresponding slope factor for single Boltzmann functions. Double Boltzmann fits were used to describe the shape of the curve, not to imply the existence of separate channel populations. Subscripts 1 and 2 thus simply indicate first and second mid-points, etc. and f1 is a fitting parameter, not a physical fraction of type 1 channels. I-V curves were fitted by:
| (3) |
where a is a scaling factor with the dimensions of a conductance, V is the pulse potential, b is the potential for zero current, Va the half-activation voltage and ka the corresponding slope factor. Sixty millisecond recovery curves were fitted by single or double rising exponential functions:
| (4) |
| (5) |
where f1 is the fractional contribution made by system 1, t is time (here the delay between pulse 1 and pulse 2) and τ is time constant. The current decay phase was fitted using a falling exponential function:
| (6) |
where the amplitude is (a1+a2+c) at time t = 0 and c at time t =∞. Curves showing the development of slow inactivation were also fitted by eqn (6). Recovery from slow inactivation was fitted using:
| (7) |
where amplitude is d at t = 0 and (a1+a2+d) at t =∞.
Errors and error bars are given for the s.e.m. unless otherwise stated. Lines on figures that are not identified as fits simply join the points.
RESULTS
Na+ currents in DRG cells
Figure 1 gives three examples of currents recorded without TTX using I-V (A) and 1 s availability protocols (B). The first cell shows uniformly fast currents with maintained kinetics even following prepulses down to -127 mV. Note the large increase in peak current amplitude of the availability family compared with the I-V family. The second cell was more complex, with mixed kinetics evident in the I-V family and the appearance of a fast component in the availability family with prepulses more negative than -77 mV. The third cell also had mixed currents but with a much smaller fast component. In this cell the availability protocol produced little more current than could be produced from -67 mV. The currents in the availability families were not leak subtracted. The small currents visible just before the transient give an indication of the low level of leak current observed during the prepulse.
Figure 1. Examples of currents recorded from small DRG cells in the absence of TTX.
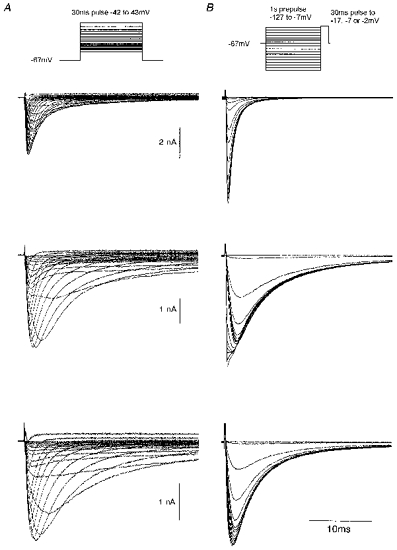
I-V families (A) and 1 s availability families (B) are shown for cells chosen to demonstrate: top, a pure fast current (cell E6410); middle, a mix with a substantial fast component (cell L6410); and bottom, a mix with a small fast component (cell C6429). Solution E3/I1.
Using TTX and additional voltage protocols we have devised a classification system for the cells and currents we record. For simplicity, we will use this system in this Results section and delay consideration of potential exceptions or complications until the Discussion. Small cells that express solely TTX-S currents are called type A cells. Cell types B, C and D all express different types of TTX-R current, termed TTX-R1, 2 and 3, respectively. These were initially identified using cells bathed in 0.3 μm TTX to block TTX-S currents, but TTX-R1 and 2 currents at least can be co-expressed with TTX-S currents.
TTX-sensitive currents in type A cells
Figure 2 shows the current-voltage relationship, recovery from short-pulse inactivation and 1 Hz use dependence of TTX-sensitive currents in cells with no TTX-resistant current at a -67 mV holding potential (Vhold). Figure 2A shows a leak-subtracted control family of currents produced by twenty 30 ms pulses to voltages between -42 and 43 mV. The next family shows unsubtracted traces with the same potentials and 0.3 μm TTX in the bathing solution. The inward current was totally abolished by TTX. Figure 2B shows an averaged I-V curve constructed using normalized data from eight cells. The half-activation voltage (Va) obtained by fitting eqn (3) to this curve was -25 mV. The mean time to peak of the maximum current was 0.66 ± 0.04 ms (n = 27). That maximum current exhibited a double-exponential decay with f1= 0.70 ± 0.02, τ1= 0.80 ± 0.04 ms and τ2= 3.0 ± 0.2 ms. Figure 2C demonstrates the kinetics of recovery at -67 mV from the inactivation induced by a 60 ms first pulse to the voltage for peak current (Vp), while Fig. 2D shows the related parameter of decline in peak current with a 1 Hz train of 30 ms pulses to Vp. The main panel of Fig. 2C shows meaned data from thirteen experiments where recovery of second-pulse amplitude was followed up to delays (time from the end of the first pulse) of 1000 ms. The time course is well fitted by a double-exponential function (eqn (5)) with f1= 0.55, τ1= 20 ms and τ2= 111 ms. The inset shows meaned data from three experiments in which the maximum delay was 5 s. This prolongation did not uncover a slower phase of recovery as the fitted parameters were f1= 0.66, τ1= 18 ms and τ2= 137 ms. These recovery kinetics are consistent with the small level of use dependence at 1 Hz (Fig. 2D). The current amplitude produced by the 20th pulse in the train was 92 % that of the first pulse.
Figure 2. Characteristics of TTX-S currents in type A cells.
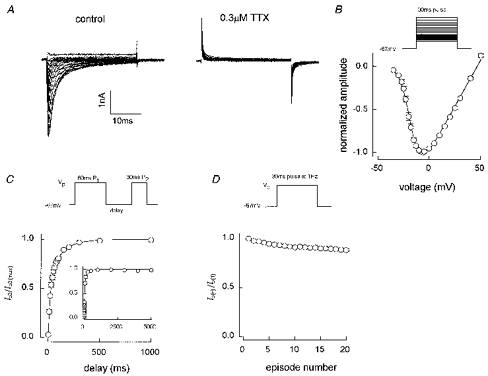
A, an I-V family before and after application of 0.3 μm TTX (cell G4531) and B, an I-V curve constructed from meaned normalized data (n = 8, all data recorded between 5 and 7 min after going whole-cell). The fit shown gave Va= -25 mV. Meaned data from 13 short-pulse inactivation recovery experiments are shown in the main panel of C with 1 Hz use dependence data from the same 13 cells given in D. The inset to C shows the mean of 3 recovery experiments followed to 5 s rather than 1 s. The double-exponential fit in the main panel of C gave: f1= 0.55, τ1= 19.6 ms, τ2= 110.7 ms, r2= 0.999. The inset fit gave: f1= 0.66, τ1= 18.0 ms, τ2= 137.4 ms, r2= 0.999. The 20th current in a 1 Hz train was 92 % of the first pulse current amplitude (D). Solution E2/I1 except for the inset to C, which was E3/I1.
Figure 3 shows prepulse availability or inactivation experiments on three different A type cells. In Fig. 3A and B the holding potential was -67 mV and the prepulse duration was 1 s. Figure 3A shows an availability curve that was well fitted by a single Boltzmann relationship (eqn (1)), with Vh= -70 mV. By contrast, Fig. 3B shows a curve that requires a double Boltzmann expression (eqn (2)), with fitted Vh1 and Vh2 values of -65 and -122 mV, respectively. In a sample of twenty-seven type A cells, ten 1 s availability curves were well fitted by a single Boltzmann function, with Vh= -66 ± 2 mV and kh= 9.2 ± 0.5 mV. The remaining seventeen were fitted by double Boltzmann functions with f1= 0.8 ± 0.02, Vh1= -65 ± 2 mV, kh1= 8.4 ± 0.3 mV, Vh2= -118 ± 2 mV and kh2= 11.4 ± 0.8 mV. One possibility is that type A cells express two types of TTX-S channel, one with a Vh of around -65 mV and the other with a much more negative Vh of -118 mV. However, we do not think that is the most likely explanation, and prefer an alternative based on one channel type with multiple inactivation processes.
Figure 3. Type A cell availability curves.
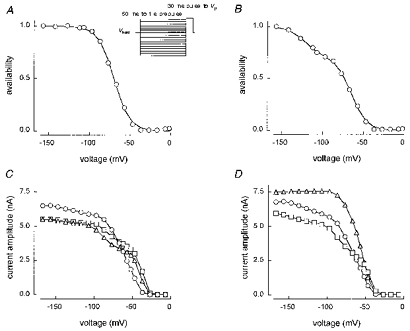
A and B: normalized 1 s availability curves from cell F4531 and G4531, respectively. Vhold was -67 mV. The single Boltzmann fit shown to F4531 gave: Vh= -70 mV, kh= 9.7 mV, r2= 0.999. The double Boltzmann fit to G4531 gave: f1= 0.71, Vh1= -65 mV, kh1= 9.4 mV, Vh2= -122 mV, kh2= 10.1 mV, r2= 0.999. C, non-normalized 50 ms (▵), 1 s (○) and 50 ms (□) availability curves from ARAT19, Vhold= -67 mV. D, non-normalized 100 ms (□) and 1 s (○), Vhold= -67 mV and 200 ms (▵), Vhold= -107 mV curves from ARAT19. Solution E2/I1 (A and B) and E3/I1 (C and D).
Figure 3C shows three non-normalized availability curves from another type A cell (ARAT19). Two curves with a prepulse duration of 50 ms bracketed in time a 1 s prepulse curve and all had a holding potential of -67 mV. During the prepulse, channels move from the level of inactivation at -67 mV (Vhold) towards the level of inactivation associated with the prepulse potential (Vpp). At prepulse potentials around -50 mV, inactivation develops more fully during the 1 s prepulse than during a 50 ms prepulse. The 50 ms curves therefore show higher current values (less inactivation) and a hump in the availability curve around -50 mV. At very negative potentials, more current is produced by the 1 s prepulse, suggesting additional recovery from inactivation (with respect to the initial level at the -67 mV holding potential) during the 1 s prepulse relative to the 50 ms prepulses. Figure 3D shows three more non-normalized availability curves from cell ARAT19. Both the 100 ms and 1 s prepulse curves with Vhold= -67 mV have an inflection around -120 mV (also seen in Fig. 3C) and the peak current achieved with a 1 s prepulse is higher than that with the 100 ms prepulse. However, with a holding potential of -107 mV (applied for 3 min before taking the dataset), a prepulse duration of only 200 ms produces a curve that is well fitted by a single Boltzmann function (i.e. no inflection around -120 mV) and has the highest peak current. This behaviour is broadly consistent with a single type of channel and two kinetically distinct processes (each with its own voltage dependence) that for simplicity we will call fast and slow inactivation. At a holding potential of -107 mV, we presume that all channels are in the resting state. A 200 ms prepulse to potentials more negative than Vhold then gives no extra current during the pulse because it moves no additional channels into the resting state (no relief from fast or slow inactivation). Two hundred millisecond prepulses to potentials more positive than -107 mV cause progressive development of fast inactivation with little contamination by slow inactivation. When Vhold= -67 mV, we suggest there is a mix of resting channels and both fast and slow inactivated channels. Prepulses to potentials more negative than -67 mV then cause progressive relief from fast inactivation and some relief from slow inactivation. A 1 s prepulse causes more relief from slow inactivation, and thus higher pulse currents, than a 100 ms prepulse. The shape (voltage dependence) of the experimental curve is a function of the underlying separate voltage dependences of the fast and slow processes. Some experimental curves have a simple shape (Fig. 3A), others are more complex (Fig. 3B). The effect of Vhold on the inflection at around -120 mV shown for a single experiment in Fig. 3D is supported by others on rat cells patched in solutions containing 1 mM external Ca2+, and by similar experiments on chick DRG cells (A. A. Elliott, A. M. Rush & J. R. Elliott, unpublished observations).
Figure 4 shows that TTX-S currents do indeed exhibit slow inactivation. Cells were pulsed to Vp for 30 ms, but with a 100 ms prepulse to -167 mV that would allow recovery from fast inactivation. After three such baseline pulses at a holding potential of -67 mV, Vhold was switched to either -47 mV (Fig. 4A) or -27 mV (Fig. 4B) for 400 s, and twenty pulses at a maximum frequency of 0.1 Hz were used to monitor peak current amplitude. Vhold was then returned to -67 mV and the current monitored for another 400 s. Seal instability sometimes cut short the experiment. Following the change in holding potential, very slow changes in pulse current amplitude took place with component time constants exceeding 100 s. Some experiments (no-use protocols, indicated by filled symbols in Fig. 4B) were performed with no current-monitoring pulses during the development phase and only one at the start of the recovery phase. The decline in current seen with no-use protocols was similar to that produced by the standard protocol, indicating that the short prepulse/pulse combinations did not affect the development of slow inactivation. The smooth lines in Fig. 4B show double-exponential fits to the development and recovery phases of the mean of four experiments with good recovery. For the development curve, the fitted time constants were τ1= 5 s (a1= 0.08) and τ2= 357 s (a2= 0.61). The extrapolated current at infinite time was 0.31 (shown by ♦). The corresponding recovery curve had τ1= 33.8 s (a1= 0.14), τ2= 140.3 s (a2= 0.22) and an extrapolated amplitude at infinite time of 0.94. The durations of development and recovery phases were chosen to maximize the chances of demonstrating substantial recovery of current, and thus distinguishing the effects of slow inactivation (reversible) from ‘run-down’ (irreversible), rather than to give the best possible quantitative time constant measurements. Note that slow protocol currents do not appear to decline to zero at -27 mV, in contrast to the ‘fast inactivation’ availability curves in Fig. 3.
Figure 4. Slow inactivation of TTX-S currents.
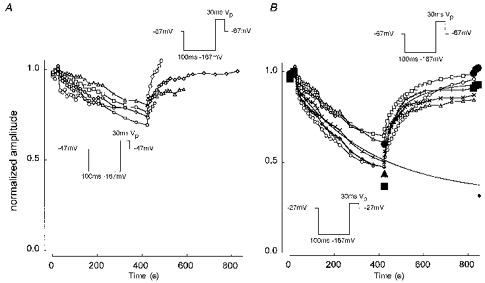
A, development of slow inactivation at -47 mV with recovery at -67 mV. Cells were prepulsed to -167 mV for 100 ms to remove ‘fast’ inactivation and pulsed to Vp for 30 ms to measure the available current. Vhold was switched from -67 to -47 mV after 3 pulses (taking 20 s in total) and left at -47 mV for 400 s (20 pulses) before returning to -67 mV for a further 400 s (20 pulses). Cells ARAT42 (○), 52 (□), 64 (▵), 71 (⋄) and 73 (○). Currents were normalized with respect to the largest of the first three (Vhold -67 mV). B, development of slow inactivation at -27 mV with recovery at -67 mV. The open symbols show experiments that followed a similar protocol to that in A. Cells ARAT52 (○), 56 (□), 64 (▵), 67 (⋄) and 69 (○). The smooth lines are double-exponential fits to the development and recovery phases of the mean of ARAT52, 56, 71 and 73. The fitting parameters are given in the text. The development phase is shown extended to 850 s; the amplitude at infinite time was 0.31 (i.e. 31 % of the initial amplitude) and is shown by the small ♦. Large filled symbols indicate ‘no-use’ procotols where no pulses were applied during the development phase and only one at the start of the recovery phase. Cells ARAT74 (•), 75 (▪) and 78 (▴). Solution E3/I1.
TTX-resistant currents in type B cells
The fast currents of Fig. 2A may be contrasted with the slower, and TTX-resistant, currents presented in Fig. 5A. In the experiment shown a fast-activating component can be identified in the pre-TTX family, indicating that this type B cell also had a TTX-sensitive component. Two fits are shown to the meaned I-V curve in Fig. 5B (from families recorded in 0.3 μm TTX), one in which all voltages are included and one in which voltages above 23 mV were excluded. This made no significant difference to the value for Va, which was -12 mV for the second fit. The mean time to peak for the maximum current was 2.2 ± 0.1 ms and that current decayed with f1= 0.7 ± 0.04, τ1= 3.7 ± 0.5 ms and τ2= 10.3 ± 0.8 ms (n = 17). These TTX-R currents demonstrate a very fast phase of recovery from short-pulse inactivation at -67 mV. The main part of Fig. 5C shows the mean of nine experiments in which recovery was followed up to 5 s. A double-exponential fit gave f1= 0.91, τ1= 1.6 ms and τ2= 908 ms. The inset shows the mean of five experiments in which recovery was followed up to 200 ms. Recovery over this shortened time scale was fitted by a single exponential function with a τ of 4.1 ms. TTX-R1 currents show a faster initial phase of recovery than the TTX-S currents in type A cells but have a slower second phase. Consistent with this, TTX-R1 currents exhibit slightly more use-dependent inhibition than the TTX-S currents. In Fig. 5D the current produced by pulse 20 in a 1 Hz train is 83 % of the first pulse current amplitude.
Figure 5. Characteristics of TTX-R currents in type B cells.
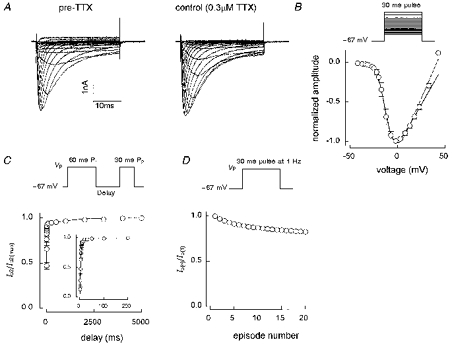
A, an I-V family before and after application of 0.3 μm TTX (cell D6422) and B, an I-V curve constructed from meaned normalized data (n = 4, all data recorded between 4 and 6 min after going whole-cell). Fits are shown to all voltages (dashed line, Va= -11 mV) and up to 23 mV (continuous line, Va= -12 mV). Meaned data from 9 short-pulse inactivation recovery experiments are shown in the main panel of C with 1 Hz use dependence data from the same 9 cells given in D. The inset to C shows the mean of 5 recovery experiments with a shorter time scale (200 ms rather than 5 s). The double-exponential fit shown in the main panel of C gave: f1= 0.91, τ1= 1.6 ms, τ2= 908 ms, r2= 0.994. The single exponential fit in the inset gave: τ= 4.1 ms, r2= 0.982. The 20th current in a 1 Hz train was 83 % of the first pulse current amplitude. Solution E3/I1 except for the inset to C, which was E2/I1.
Type B cells, or TTX-R1 currents, are characterized by very depolarized availability curves. The curves shown in Fig. 6A (not normalized) and B (normalized) were obtained using (in order of recording) 200 ms, 500 ms, 1 s and 50 ms prepulses. Figure 6C and D gives corresponding curves for 1 s, 5 s, 30 s and 1 s prepulses from a separate cell. These examples are each representative of three to four cells. Single Boltzmann fits are shown to the normalized curves. Using solutions E2/I1, four out of twenty-six type B cells gave single Boltzmann fits to 1 s availability curves with Vh= -25 ± 2 mV and kh= 3.1 ± 0.1 mV. The remaining twenty-two gave f1= 0.86 ± 0.01, Vh1= -29 ± 1 mV, kh1= 3.0 ± 0.1 mV, Vh2= -44 ± 2 mV and kh2= 9.3 ± 1.1 mV. In solutions E3/I1, two out of eighteen cells produced single fits with Vh= -26 ± 3 mV and kh= 3.3 ± 0.2 mV. The remaining sixteen gave f1= 0.92 ± 0.01, Vh1= -29 ± 1 mV, kh1= 3.1 ± 0.1 mV, Vh2= -48 ± 3 mV and kh2= 12.1 ± 1.2 mV. As Fig. 6 shows, the position of the curve depended to a certain extent on the prepulse duration, with longer prepulses shifting the curve to the left. However, even with a 30 s prepulse, there is little inactivation of these channels at -67 mV.
Figure 6. Type B cell availability curves with prepulse durations between 50 ms and 30 s.
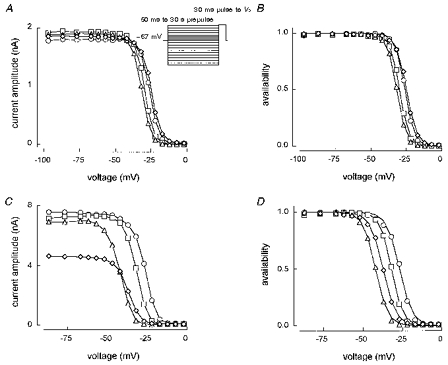
Vhold= -67 mV. A and B, cell A5O26: 200 ms dataset (9.38 min, ○), 500 ms dataset (13.01 min, □), 1 s dataset (15.52 min, ▵), 50 ms dataset (19.48 min, ⋄). Single Boltzmann fits are shown in B with Vh= -26, -30, -32 and -25 mV and kh= 3.3, 3.3, 3.4 and 3.7 mV (r2= 0.999). C and D, cell F4621: first 1 s dataset (10.11 min, ○), 5 s dataset (12.48 min, □), 30 s dataset (21.30 min, ▵), second 1 s dataset (38.57 min, ⋄). Single Boltzmann fits are shown in D with Vh= -27, -32, -42 and -37 mV and kh= 4.1, 3.6, 3.9 and 4.1 mV (r2= 0.998-0.999). Solution E2/I1.
The 30 s prepulse availability experiments caused long-lasting suppression of current amplitude (note the reduced maximum current amplitude of the final (1 s prepulse) curve in Fig. 6C), suggestive of a slow inactivation process. Figure 7 shows the results of slow inactivation protocols on currents identified as TTX-R1 currents by their electrophysiological properties but recorded without TTX. Here, a 100 ms prepulse to -127 mV was used to reprime the fast inactivation system. These currents showed faster and more complete inactivation at -27 mV than the TTX-S currents in type A cells. The fitted lines in Fig. 7B for development and recovery from inactivation have the following characteristics. For development, τ1= 10.1 s (a1 = 0.43), τ2= 101.9 s (a2 = 0.53) and c = 0.03. For recovery, τ1= 14.0 s (a1 = 0.22), τ2= 171.2 s (a2 = 0.44) and d = 0.05, predicting recovery of 71 % of the starting amplitude.
Figure 7. Slow inactivation of essentially TTX-R1 currents recorded without 0.3 μm TTX.
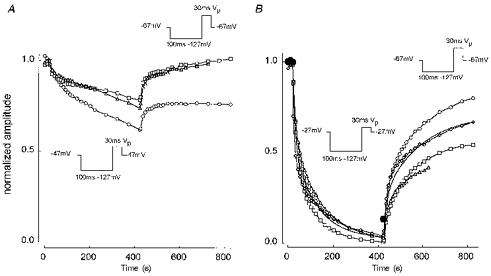
Protocols similar to Fig. 4 except prepulse to -127 mV sufficient to remove ‘fast’ inactivation. A, development at -47 mV and recovery at -67 mV. Cells ARAT41 (○), 61 (□) and 68 (▵). B, development at -27 mV and recovery at -67 mV. Standard protocols, cells ARAT41 (○), 53 (□), 55 (▵) and 61 (⋄). No-use protocol, ARAT76 (•). The smooth lines in B show double-exponential fits to meaned development and recovery phases, with parameters given in the text. Solution E3/I1.
TTX-resistant currents in type C cells
As our collection of whole-cell TTX-R current recordings grew we began to suspect the existence of a second class of cell (type C) with substantial TTX-R current expression. Figure 8 demonstrates the properties of putative TTX-R2 currents in type C cells. Analysis of the meaned I-V curve in Fig. 8B gave a Va of -21 mV, distinctly more negative than the -12 mV seen with TTX-R1 currents (Fig. 5B). The mean time to peak for the maximum current was 1.9 ± 0.1 ms, with decay parameters: f1= 0.72 ± 0.05, τ1= 3.1 ± 0.4 ms and τ2= 13.2 ± 2.4 ms (n = 12). The recovery, use dependence and availability curves shown in Fig. 8C-E reinforces the separate identity of TTX-R2 currents. Figure 8C and D shows that currents in type C cells have a much larger slow component of recovery from inactivation and a concomitantly higher level of 1 Hz use dependence than their type B counterparts. The meaned recovery curve was fitted by: f1= 0.58, τ1= 3.3 ms and τ2= 902 ms. The 20th current in a 1 Hz train was only 46 % of the first current amplitude. In twelve 1 s availability experiments, one was fitted by a single Boltzmann expression with Vh= -46 mV and kh= 4.8 mV. The other eleven were better fitted by a double Boltzmann expression and gave f1= 0.74 ± 0.03, Vh1= -46 ± 2 mV, kh1= 3.8 ± 0.2 mV, Vh2= -75 ± 3 mV and kh2= 12.0 ± 1.0 mV. The main Vh was thus -46 mV as compared with -29 mV for TTX-R1 currents.
Figure 8. Characteristics of TTX-R currents in type C cells.
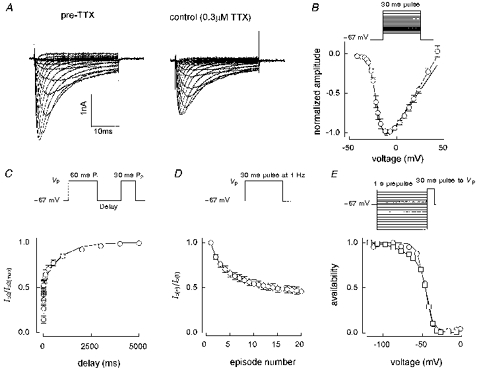
A, an I-V family before and after application of 0.3 μm TTX (cell B6401) and B, an I-V curve constructed from meaned normalized data (n = 4, all data recorded between 5 and 7 min after going whole-cell). Fits are shown to all voltages (dashed line, Va= -21 mV) and up to 23 mV (continuous line, Va= -21 mV). Meaned data from 9 short-pulse inactivation recovery experiments are shown in C with 1 Hz use dependence data from the same 9 cells given in D. The double-exponential fit in C gave: f1= 0.58, τ1= 3.3 ms, τ2= 902 ms, r2= 0.994. The fast and slow time constants are similar to those for type B cells but the contribution of the slow time constant is much greater in type C cells. The 20th current in a 1 Hz train was 46 % of the first pulse current amplitude. E, 1 s availability curves from cell I6311 (○) and B6325 (□). The single Boltzmann fit shown to I6311 gave: Vh= -46 mV, kh= 4.8 mV, r2= 0.995. The double Boltzmann fit to B6325 gave: f1= 0.77, Vh1= -44 mV, kh1= 3.9 mV, Vh2= -71 mV, kh2= 11.5 mV, r2= 0.999. Solution E3/I1. Vhold -67 mV throughout.
Figure 9 shows graphically the degree of scatter in our availability curve data and further addresses the question of the distinct nature of currents in type C cells. Figure 9A compares Vh1 values from samples of type A, B and C cells. The initial grouping of TTX-R cells into types B and C was based on a combination of Vh1 values and the degree of 1 Hz use dependence. The standard deviations of Vh1 values from two samples of type B cells (with solutions E2/I1, n = 26 and E3/I1, n = 17) were 5.1 and 4.8 mV, respectively, very similar to the 5.7 mV given by the sample of type A cells (E2/I1, n = 25). The type C cells (E3/I1, n = 12) gave a standard deviation of 6.7 mV. However, while the data from type C cells were slightly more variable, they nevertheless formed a distinct population and showed little overlap with type B cell currents. This is reinforced by Fig. 9B in which cells are grouped according to use dependence and Vh1.
Figure 9. Comparison of Vh1 data from type A, B and C cells.
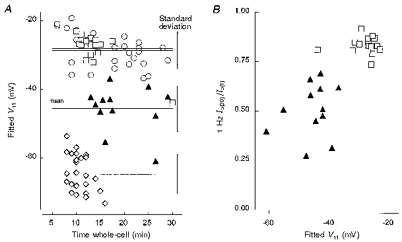
A, scatterplots showing fitted Vh1 values against time after going whole-cell for TTX-S currents in type A cells (E2/I1, ⋄) and TTX-R currents in type B (E2/I1, ○; E3/I1, □) and type C cells (E3/I1, ▴). The horizontal lines show the mean value for each sample while the vertical bars to the right give the standard deviation. These are similar for each sample but largest for the type C cells. There is little overlap between putative TTX-R type 1 and type 2 currents. B, a scatterplot showing the level of 1 Hz use dependence of TTX-R currents in type B (E3/I1, □) and type C (E3/I1, ▴) cells.
Our observations of TTX-R2 currents have been less frequent than those of TTX-R1 currents (or of pure TTX-S currents in type A cells). The greatest frequency of occurrence was between March and May 1996, when TTX-R2 currents made ca. 40 % of total TTX-R recordings. There was no obvious significant feature of the animals or methods used at that time. As with TTX-R1 currents, TTX-R2 may also be co-expressed with TTX-S currents, giving mixed cells. It would be very difficult to tell from whole-cell recordings if TTX-R1 and R2 currents were expressed in the same cell.
Type D cells
Figure 10 shows the final type of whole-cell current to be considered. In the example given in Fig. 10A, no inward current was seen with 0.3 μm TTX in the bath and a holding potential of -67 mV. However, inward current quickly became apparent when Vhold was lowered to -107 mV. A return to -67 mV abolished the current but it reappeared on returning to -107 mV. In other cells some inward current was apparent with a -67 mV holding potential but it was substantially increased when Vhold was more negative. Figure 10B shows that these currents (with Vhold= -107 mV) also activated at very negative potentials. The fitted Va was -36 mV. Two examples of 1 s availability curves recorded with Vhold= -67 mV are shown in Fig. 10C. Currents in these cells are very small (typically 0.5 nA or less) and we do not wish to over-interpret our data. However, it is clear that very little current is available at potentials more positive than -50 mV and the increase in current produced by 1 s hyperpolarizing prepulses indicates that the changes in amplitude seen in Fig. 10A are not merely the result of recovery from or development of slow inactivation. Double Boltzmann analysis of seven cells yielded: f1= 0.56 ± 0.13, Vh1= -68 ± 5 mV, kh1= 5.8 ± 1.2 mV, Vh2= -116 ± 6 mV and kh2= 9.8 ± 1.2 mV. Two other cells had curves which did not plateau at -157 mV. The time to peak for the maximum current was 1.7 ± 0.1 ms (n = 11) and that current decayed with a time constant of 3.3 ± 0.4 ms. These putative TTX-R3 currents would, therefore, be classed as slow.
Figure 10. Characteristics of TTX-R currents in type D cells.
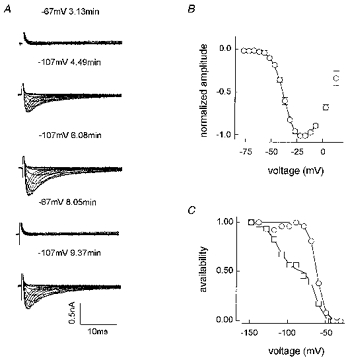
A, I-V families at Vhold= -67 and -107 mV from cell G6311 (not leak subtracted, solution E3/I1). The starting time for collection of each dataset is shown next to Vhold (3.13 min = 3 min 13 s). A 20 s leak dataset at the same Vhold followed each dataset shown, so the time between changing Vhold and initiating recording was actually ca. 30 s. B, a meaned normalized I-V curve (n = 8, Vhold= -107 mV, solution E3/I1). The fit shown up to -7 mV gave Va= -36 mV. C, 1 s availability curves for cell 278916 (○) and 208912 (□), Vhold= -67 mV. The single Boltzmann fit shown to 278916 gave: Vh= -63 mV, kh= 5.1 mV, r2= 0.997. The double Boltzmann fit to 208912 gave: f1= 0.50, Vh1= -73 mV, kh1= 5.0 mV, Vh2= -113 mV, kh2= 8.3 mV, r2= 0.997 (solution E1/I1).
Single-channel experiments
To study TTX-resistant Na+ currents at the molecular level, single-channel events were recorded from twenty-one outside-out patches. To augment the single-channel current, 250 mM Na+ was used in the external solution (E4) for these experiments. To record TTX-R single-channel events, patches were formed from small cells (20-30 μm in diameter) and 0.3 μm TTX was added to the external solution. Figure 11 displays examples of single-channel traces at three different test potentials. In fourteen patches from twelve cells, small single-channel currents were observed (Fig. 11A) while in four patches the currents had larger amplitudes (Fig. 11B). To quantify single-channel current amplitude, point amplitude histograms were constructed from 100 to 200 traces at each test potential. Fitting double and triple Gaussian functions to the histograms revealed current levels for open and closed states of the channels and thus, by subtraction, the single-channel current (Fig. 11A and B). In some patches mixes of the two channel amplitudes seemed to exist. These patches were not used for analysis but indicate the presence of the two TTX-R Na+ channel subtypes in one cell. Linear regression of the single-channel current I-V relationship from the above histograms (Fig. 11C) revealed single-channel conductance values of 9.2 ± 0.2 and 16.5 ± 1.5 pS for the two TTX-R channels. The reversal potential of 73 and 75 mV, respectively, is close to the calculated Nernst potential for Na+ (81.7 mV) and indicates that the currents under investigation were carried by Na+ ions. Three patches were formed from large DRG cells to record TTX-S single-channel currents (not shown). Sensitivity to TTX was tested by application of 0.3 μm TTX at the end of each experiment. The I-V relationship revealed a single-channel conductance of 19.5 ± 0.7 pS and a reversal potential of 76 mV (Fig. 11C).
Figure 11. Properties of two different types of TTX-R Na+ channels in dorsal root ganglion neurones.
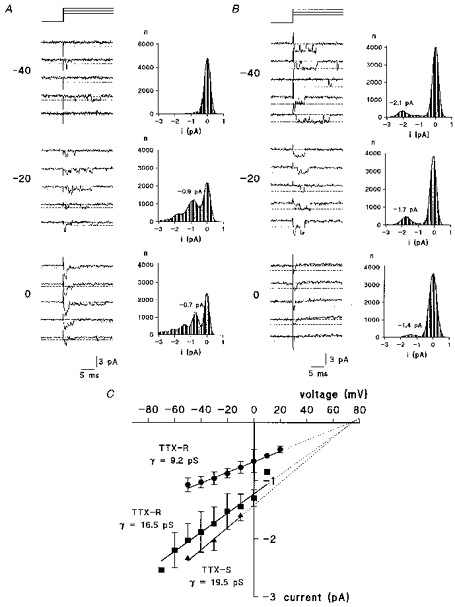
A and B, traces of single channels recorded from two different cells in 250 mM extracellular Na+ solution (E4/I2) and 0.3 μm TTX at 3 different test potentials as given to the left of the traces. Dotted lines represent closed and first open level as obtained from point amplitude histograms. Filter frequency was 2 kHz. Point amplitude histograms were constructed from recordings at various test potentials during the first 10 ms from onset of stimulus. Single-channel amplitude was determined as the amplitude difference in Gaussian fits of the closed and the first open level. In histograms where no peak could be detected, e.g. in A at -40 mV, single-channel amplitude was measured by eye. Bin width is 0.05 pA in all histograms. C, plot of single-channel amplitude versus test potential. Single-channel conductance is calculated from the slope of the linear regression lines.
Averaging 100 to 200 single-channel traces at each test potential revealed the slow activation and inactivation kinetics of both TTX-R channels (Fig. 12A and B). The potential dependence of activation was determined using I-V relationships constructed using the peak current of the averaged traces. Half-maximal activation potentials evaluated from non-linear least-squares fits to a single Boltzmann equation were -27 ± 2 mV (n = 14) for the low conductance TTX-R channel, -42 ± 3 mV (n = 4) for the high conductance counterpart and -45 ± 2 mV for the TTX-S Na+ channel (not shown).
Figure 12. Kinetics and activation voltage dependence of averaged single-channel currents.
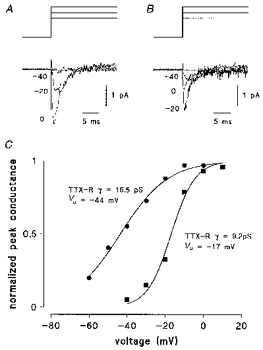
A and B, averaged currents of 200 single-channel recordings as shown in Fig. 11, demonstrating the time course of the current. C, activation curve of the peak Na+ current as measured from averaged traces in A and B. Fitting the data points to a single Boltzmann equation gives half-maximal activation potentials, Va.
DISCUSSION
TTX-S currents
All whole-cell TTX-S currents analysed in detail in this paper and by Elliott & Elliott (1993) were from small cells, with diameters in the range 14–18 μm (pre-1993) and 12–20 μm (post-1993), that effectively expressed only fast current (type A cells). We did not analyse the fast component of mixed currents in other small cells. These are important points when comparing our findings and conclusions with those of other workers. For example, Ogata & Tatebayashi (1993) compared the properties of TTX-R currents in small cells (20.5 μm diameter) with those of TTX-S currents in larger cells (39.4 μm diameter) from neonatal rats. Caffrey et al. (1992) suggested that large (> 50 μm diameter), medium (30-50 μm diameter) and small (< 30 μm diameter) DRG cells from adult rats express two types of TTX-S current. A fast TTX-S current was found in small and medium cells while a TTX-S current with intermediate kinetics was found in medium and large cells. We consistently find that in our ganglia, taken from the full length of the vertebral column, type A cells form a major population, accounting for roughly half of the hundreds of small cells investigated. This is in contrast to the report by Cummins & Waxman (1997) that in small (18-25 μm diameter) cells taken specifically from L4 and L5 ganglia, only five out of 113 cells expressed pure TTX-S currents. One conclusion from our work is that there is a population of adult rat small DRG cells in which TTX-S channels that will be > 95 % inactivated at potentials more positive than -40 mV are the sole (or vastly preponderant) carriers of Na+ current.
The availability curves for TTX-S currents can have complex shapes (see Fig. 3) and may be fitted with double Boltzmann functions to give a Vh1 of -65 mV and a Vh2 of -118 mV. By analogy with cells expressing mixes of TTX-S and TTX-R channels (see Fig. 2E of Cummins & Waxman (1997) for a good example) it is tempting to assume that double Boltzmann availability curves from type A cells suggest the existence of two distinct TTX-S channels (see Rush et al. 1995). Schwartz et al. (1990) show complex availability curves from neonatal rat TTX-S currents and propose that TTX-S currents they term FA have a Vh of -75 mV, while FN TTX-S currents have a Vh of -139 mV. However, a single population of channels can produce complex availability curves, particularly if those channels undergo multiple inactivation processes, including ones with very long time constants. We have shown the influence of holding potential on availability curves in Fig. 3 and now propose that a single major population of TTX-S channels produces the current in type A cells, but those channels undergo slow inactivation, with time constants up to hundreds of seconds. Ogata & Tatebayashi (1992) suggested that TTX-S currents in rat DRG neurones do not exhibit slow inactivation, but did not test this at potentials around -20 mV. We have now demonstrated clear slow inactivation of TTX-S currents at -47 mV (Fig. 4A) and, in particular, -27 mV (Fig. 4B).
Motomura et al. (1995) also recorded TTX-S (and TTX-R) single channels in outside-out patches with 250 mM extracellular Na+. Their slope conductance of 16.3 pS for TTX-S channels is in reasonable agreement with our value of 19.5 pS. The conductance of 6.3 pS quoted by Roy et al. (1994) is for cell-attached patches. All three groups agree that the main population of TTX-R channels has a smaller conductance. The ratio TTX-S: TTX-R is 1.9 (Roy et al. 1994), 1.9 (Motomura et al. 1995) and 2.1 (present work using the smaller TTX-R channel).
Type D cells
Type D cells were defined in the presence of 0.3 μm TTX, sufficient to block all TTX-S currents. Therefore, we do not know if the channels responsible for the small TTX-R currents found in these cells are co-expressed with TTX-S channels. We can be reasonably certain that type A cells did not have substantial type D cell TTX-R currents because we did not see a slower component in the availability protocol currents. TTX-R3 currents in type D cells are characterized at the whole-cell level by their relatively low thresholds for both activation and inactivation.
TTX-R currents in type B and C cells
The most significant proposal in this paper is that of multiple TTX-R current subtypes in small DRG cells, particularly the putative TTX-R1 and -R2 currents in type B and C cells, respectively. Each of these can produce substantial currents from a -67 mV holding potential (contrast with type D cells). The division between them is based on most of the whole-cell electrophysiological protocols used here (I-V, 1 s availability, recovery from inactivation and 1 Hz use dependence) plus a differential sensitivity to the anticonvulsant and pain-management drugs carbamazepine and phenytoin (Rush & Elliott, 1997). Type B cells have always provided the majority of TTX-R currents recorded in our laboratory. The contribution of type C cells varied from a high of around 40 % to lows of less than 10 % (sample size, 20–35 cells).
Vh values for rat DRG cell TTX-R currents reported by other workers are (prepulse duration given in parentheses): -52 mV (Kostyuk et al. 1981; 0.3 s), -24 mV (Schwartz et al. 1990; 0.04 s), -40 mV (Roy & Narahashi, 1992; 1 s), -45 mV (Caffrey et al. 1992; 30–120 s), -40 mV (Ogata & Tatebayashi, 1993; 0.5 s), -24 to -32 mV (England et al. 1996; 0.2 s), ca. -20 mV (Gold et al. 1996b; 0.5 s) and -25 mV (Yoshimura et al. 1996; 1 s). Values are thus clustered around -25 and -45 mV. The Vh1 value for type B and type C cells was -29 and -46 mV, respectively. More recently, Scholz et al. (1998) described two types of TTX-R current found in small and medium sized neurones from neonatal rat dorsal root ganglia. Their TTXr-f current activated and inactivated at more negative potentials than their TTXr-s current, similar to our TTX-R2 currents. Scholz et al. (1998) do not report use dependence or recovery from short-pulse inactivation.
TTX-R currents in type C cells have a very marked slow phase of recovery from short-pulse inactivation (Fig. 8C). The brief (60 ms) depolarization used in these short-pulse inactivation protocols was sufficient to induce a substantial component of inactivation with a recovery time constant of around 900 ms. This explains the high degree of use dependence (or cumulative inactivation) seen with these currents. In this respect, TTX-R2 currents are similar to the TTX-S currents of Myxicola giant axons (Rudy, 1981).
Functional implications
Table 1 gives a summary of the main electrophysiological properties of each type of current and Fig. 13 a comparison amongst cell types A, B and C.
Table 1.
Electrophysiological properties of Na+ current subtypes
| Recovery from short-pulse inactivation | |||||||
|---|---|---|---|---|---|---|---|
| Main 1 s Vh (mV) | τ1 (ms) | τ2 (ms) | % 1st component | 1 Hz use dependence (Ip(20)/Ip(1)) | Va (mV) | Slow inactivation demonstrated? | |
| Cell type A (TTX-S) | −65 | 18 | 137 | 66 | 0.92 | −25 | Yes |
| Cell type B (TTX-R1) | −29 | 2 | 908 | 91 | 0.83 | −12 | Yes |
| Cell type C (TTX-R2) | −46 | 3 | 902 | 58 | 0.46 | −21 | n.a. |
| Cell type D (TTX-R3) | −68 | n.a. | n.a. | n.a. | n.a. | −36 * | n.a. |
Holding potential, −67 mV.
Holding potential, −107 mV
Figure 13. Characteristics of currents in cell types A-C.
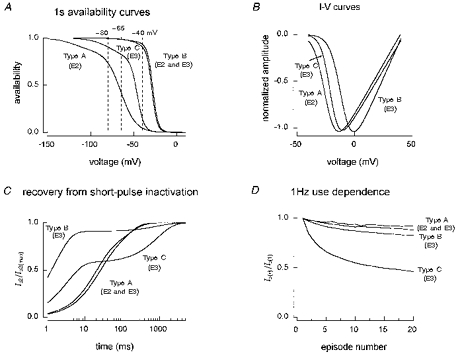
1 s availability (A), I-V (B) and inactivation recovery (C) curves plotted from the functions that best fit the experimental data. D, experimental 1 Hz use dependence. TTX-R1 channels in type B cells are the most resistant to inactivation (A) but also have the highest threshold for activation (B). TTX-R2 channels in type C cells have the largest slow component of recovery from inactivation and the highest use-dependent block at 1 Hz. TTX-R1 channels largely recover quickly from inactivation at -67 mV but do exhibit a small slow component. TTX-R1 currents therefore have a slightly higher degree of 1 Hz use dependence than TTX-S currents. However, TTX-R1 currents are 91 % recovered after 10 ms, at which time TTX-S currents are only 26 % recovered.
Before suggesting possible roles for the various currents described it is necessary to consider how the voltage of an unclamped DRG neurone is likely to behave. Resting membrane potentials of DRG cells in intact ganglia impaled with sharp microelectrodes or of patch-clamped dissociated cells are in the range -50 to -70 mV (Harper & Lawson, 1985; McLean et al. 1988; Caffrey et al. 1992; Villière & McLachlan, 1996; Yoshimura et al. 1996). Safronov et al. (1996) found a more negative value of -80 mV in patch-clamped DRG cells in isolated slice preparations. Even taking -80 mV as the resting membrane potential it seems unlikely that the putative TTX-R3 current in type D cells would have a major role.
Type A cell TTX-S currents are kinetically fast and 50 % inactivated at potentials between -75 and -80 mV. This is very similar to the TTX-S currents in rat myelinated axons (Neumcke & Stämpfli, 1982). They have a lower activation threshold than TTX-R currents in type B and C cells and, in a mixed cell, could provide part of the initial depolarization required to activate TTX-R1 and R2 currents. But all TTX-S currents would be 95 % or more inactivated at potentials more positive than -40 mV. TTX-R1 currents, however, would be more than 90 % available at -40 mV, as judged by the 1 s availability curves. Even assuming a 10 mV hyperpolarizing shift for longer prepulses (30 s prepulse availability protocols gave curves 5–6 mV to the left of subsequent 1 s prepulse curves - see Fig. 6) TTX-R1 current availability would only drop to 62 %. Furthermore, TTX-R1 currents recover quickly from inactivation. The fitted time courses in Fig. 5C are for recovery at -67 mV but Elliott & Elliott (1993) showed recovery kinetics at a number of potentials. Recovery time constants obtained from single exponential fits for delays up to 80 ms were: 22 ± 6 ms at -37 mV (98 ± 6 % recovery of first pulse amplitude); 6.9 ± 0.8 ms at -47 mV (94 ± 1 % recovery) and 2.7 ± 0.4 ms at -67 mV (96 ± 1 % recovery, n = 4). However, slow inactivation means that even TTX-R1 currents will eventually (over tens of seconds) switch off at e.g -27 mV (Fig. 7B).
Jeftinija (1994; Fig. 1A therein) shows voltage recordings from a DRG soma under current clamp. Application of 50 mM K+ depolarized the soma by 25 mV from a resting potential of -58 mV. In the absence of TTX, action potentials fired during the rising phase of the K+-induced depolarization and during the plateau phase. With 0.5 μm TTX in the bath, action firing was only seen at much higher potentials but that firing persisted for ca. 60 s from a baseline of -33 mV. We suggest that TTX-R1 channels drove that firing. Extracellular K+ concentrations may rise substantially following injury. For example, Chesler et al. (1994) found 44 mM extracellular K+ in contusion-damaged rat spinal cords and the average half-time for K+ clearance was 17 min. Only TTX-R Na+ channels would remain available for activation under such conditions.
TTX-R2 currents in type C cells are less resistant to inactivation than TTX-R1 currents and have a substantial slow recovery phase. They are closer to the ‘slow’ TTX-R currents described by Ogata & Tatebayashi (1993). We would expect type C cells to accommodate to stimuli much more quickly than type B cells.
DRG cells contain other ion channels that will affect the firing properties of cell bodies and axons. Six types of voltage-gated K+ current have been reported in adult rat DRG neurones (Gold et al. 1996a) and Safronov et al. (1996) observed five types in small DRG neurones of neonatal rats. Scroggs & Fox (1992) describe various voltage-gated calcium currents while Scroggs et al. (1994) consider the distribution of leak and inward rectifier conductances, all in cells from adult rats. Yoshimura et al. (1996) correlate Na+ and K+ channel characteristics in identified rat bladder afferents. Schild & Kunze (1997) have modelled various channels in nodose neurone cell bodies and present a number of interesting conclusions regarding interactions between voltage-gated Na+ and K+ channels and their influence on firing rate. A complete analysis of the firing properties of soma, receptor area, axon and central terminal for these cells will require detailed knowledge of the gating properties and distribution of many types of channel.
Molecular identity
Akopian et al. (1996) reported a 1957 amino acid Na+ channel protein (named SNS) that was expressed solely by small diameter neurones in neonatal and adult rat DRG and trigeminal ganglia. When expressed in Xenopus oocytes the current through these channels was resistant to TTX and had a 1 s prepulse Vh of -30 mV. Vp was 10–20 mV. The clone reported by Sangameswaran et al. (1996) was 1 amino acid shorter and is called PN3. PN3 currents in Xenopus oocytes were also TTX-R and had a high activation threshold. The published sequences of SNS and PN3 differ in seven positions, the extra amino acid in the SNS sequence and six substitutions. We note that one substitution falls within the putative S4 region of domain 2 (leucine in SNS, phenylalanine in PN3) and may influence channel gating. A detailed comparison of the gating properties of SNS and PN3 may reveal significant differences and could support the hypothesis of multiple TTX-R subtypes. Toledo-Aral et al. (1997) and Sangameswaran et al. (1997) provide sequences for the PN1 clone, which is suggested to be a major TTX-S peripheral nervous system Na+ channel and presumably corresponds with our TTX-S current.
Sangameswaran et al. (1996) also reported the presence in DRG cells of mRNA corresponding to rat brain I and III, rat heart I, peripheral nerve Na+ channel type 1 (PN1), SCP6 and ‘other novel sodium channel α-subunits’. It is possible that the TTX-R3 current is produced by rat heart I channels. Black et al. (1996) provide further evidence for the expression of multiple Na+ channel mRNA species in DRG cells. There is a general consensus that DRG neurones express a wide variety of Na+ channel ‘messages’ so our observation of multiple subtypes in small cells is not surprising.
Conclusion
We have presented our evidence that small DRG cells from the adult rat express multiple (i.e. more than two) Na+ channel subtypes, but that these are amenable to classification and do not comprise a continuum of properties. We suggest that TTX-R1 currents are best able to support firing under conditions of chronic depolarization, such as those likely to exist following physical damage to tissue (Chesler et al. 1994). A somatal TTX-S current subtype appears to be upregulated, and TTX-R currents downregulated, following nerve transection (Cummins & Waxman, 1997) but Novakovic et al. (1998) suggest that the TTX-R channel PN3 is redistributed following axonal chronic constriction injury, with subsequent accumulation at the injury site. Both TTX-R and TTX-S DRG Na+ channels may, therefore, be involved in ectopic electrogenesis and neuropathic pain. Given the specific pharmacological profiles, electrophysiological properties and structures of DRG Na+ channel subtypes, plus the localization of PN1 and PN3/SNS isoforms within the peripheral nervous system, there is now the possibility of new therapeutic approaches to the treatment of neuropathic pain.
Acknowledgments
We wish to thank the Medical Research Council (project grant to J. R. E., scholarship to A. M. R.), The Wellcome Trust (fellowship to A. A. E.), the Royal Society (equipment grant to J. R. E.) and the Zeneca Fellowship committee of the European Academy of Anaesthesia (fellowship to M. E. B.) for financial support of this work. We also gratefully acknowledge the suggestion by two referees of a previous version of this paper that we consider the possible influence of slow inactivation on the shape of availability curves.
References
- Akopian AN, Sivilotti L, Wood JN. A tetrodotoxin-resistant voltage-gated sodium channel expressed by sensory neurones. Nature. 1996;379:257–262. doi: 10.1038/379257a0. 10.1038/379257a0. [DOI] [PubMed] [Google Scholar]
- Arbuckle JB, Docherty RJ. Expression of tetrodotoxin-resistant sodium channels in capsaicin-sensitive dorsal root ganglion neurones of adult rats. Neuroscience Letters. 1995;185:70–73. doi: 10.1016/0304-3940(94)11227-a. 10.1016/0304-3940(94)11227-A. [DOI] [PubMed] [Google Scholar]
- Black JA, Dib-Hajj S, McNabola K, Jeste S, Rizzo MA, Kocsis JD, Waxman SG. Spinal sensory neurons express multiple sodium channel α-subunit mRNAs. Molecular Brain Research. 1996;43:117–131. doi: 10.1016/s0169-328x(96)00163-5. [DOI] [PubMed] [Google Scholar]
- Bräu ME, Rush AM, Elliott JR. Single channel analysis of two types of tetrodotoxin-resistant sodium channels (TTX-r INa) in small cells isolated from adult rat (200-350 g) dorsal root ganglia (DRG) The Journal of Physiology. 1995;487.P:184. P. [Google Scholar]
- Buchanan S, Harper AA, Elliott JR. Differential effects of tetrodotoxin (TTX) and high external K+ on A and C fibre compound action potential peaks in frog sciatic nerve. Neuroscience Letters. 1996;219:131–134. doi: 10.1016/s0304-3940(96)13189-x. [DOI] [PubMed] [Google Scholar]
- Caffrey JM, Eng JA, Black SG, Waxman SG, Kocsis JD. Three types of sodium channels in adult rat dorsal root ganglia. Brain Research. 1992;592:283–297. doi: 10.1016/0006-8993(92)91687-a. [DOI] [PubMed] [Google Scholar]
- Chesler M, Young W, Hassan AZ, Sakatani K, Moriya T. Elevation and clearance of extracellular K+ following graded contusion of the rat spinal cord. Experimental Neurology. 1994;125:93–98. doi: 10.1006/exnr.1994.1011. [DOI] [PubMed] [Google Scholar]
- Cummins TR, Waxman SG. Downregulation of tetrodotoxin-resistant sodium currents and upregulation of a rapidly repriming tetrodotoxin-sensitive sodium current in small spinal sensory neurons following nerve injury. Journal of Neuroscience. 1997;17:3503–3514. doi: 10.1523/JNEUROSCI.17-10-03503.1997. [DOI] [PMC free article] [PubMed] [Google Scholar]
- Elliott AA, Elliott JR. Characterization of TTX-sensitive and TTX-resistant sodium currents in small cells from adult rat dorsal root ganglia. The Journal of Physiology. 1993;463:39–56. doi: 10.1113/jphysiol.1993.sp019583. [DOI] [PMC free article] [PubMed] [Google Scholar]
- England S, Bevan S, Docherty RJ. PGE2 modifies the tetrodotoxin-resistant sodium current in neonatal rat dorsal root ganglion neurones via the cyclic AMP-protein kinase A cascade. The Journal of Physiology. 1996;495:429–440. doi: 10.1113/jphysiol.1996.sp021604. [DOI] [PMC free article] [PubMed] [Google Scholar]
- Gold MS, Shuster MJ, Levine JD. Characterization of six voltage-gated K+ currents in adult rat sensory neurons. Journal of Neurophysiology. 1996a;75:2629–2646. doi: 10.1152/jn.1996.75.6.2629. [DOI] [PubMed] [Google Scholar]
- Gold MS, Reichling DB, Shuster MJ, Levine JD. Hyperalgesic agents increase a tetrodotoxin-resistant Na+ current in nociceptors. Proceedings of the National Academy of Sciences of the USA. 1996b;93:1108–1112. doi: 10.1073/pnas.93.3.1108. 10.1073/pnas.93.3.1108. [DOI] [PMC free article] [PubMed] [Google Scholar]
- Harper AA, Lawson SN. Electrical properties of rat dorsal root ganglion neurones with different peripheral nerve conduction velocities. The Journal of Physiology. 1985;359:47–63. doi: 10.1113/jphysiol.1985.sp015574. [DOI] [PMC free article] [PubMed] [Google Scholar]
- Jeftinija S. The role of tetrodotoxin-resistant sodium channels of small primary afferent fibers. Brain Research. 1994;639:125–134. doi: 10.1016/0006-8993(94)91772-8. 10.1016/0006-8993(94)91772-8. [DOI] [PubMed] [Google Scholar]
- Kostyuk PG, Veselovsky NS, Tsyndrenko AY. Ionic currents in the somatic membrane of rat dorsal root ganglion neurones - I. Sodium currents. Neuroscience. 1981;6:2423–2430. doi: 10.1016/0306-4522(81)90088-9. 10.1016/0306-4522(81)90088-9. [DOI] [PubMed] [Google Scholar]
- McLean MJ, Bennett PB, Thomas RM. Subtypes of dorsal root ganglion neurons based on different inward currents as measured by whole-cell voltage clamp. Molecular and Cellular Biochemistry. 1988;80:95–107. doi: 10.1007/BF00231008. [DOI] [PubMed] [Google Scholar]
- Motomura H, Fujikawa S, Tashiro N, Ito Y, Ogata N. Single-channel analysis of two types of Na+ currents in rat dorsal root ganglia. Pflügers Archiv. 1995;431:221–229. doi: 10.1007/BF00410194. [DOI] [PubMed] [Google Scholar]
- Neumcke B, Stämpfli R. Sodium currents and sodium-current fluctuations in rat myelinated nerve fibres. The Journal of Physiology. 1982;329:163–184. doi: 10.1113/jphysiol.1982.sp014296. [DOI] [PMC free article] [PubMed] [Google Scholar]
- Novakovic SD, Tzoumaka E, McGivern JG, Haraguchi M, Sangameswaran L, Gogas KR, Eglen RM, Hunter JC. Distribution of the tetrodotoxin-resistant sodium channel PN3 in rat sensory neurons in normal and neuropathic conditions. Journal of Neuroscience. 1998;18:2174–2187. doi: 10.1523/JNEUROSCI.18-06-02174.1998. [DOI] [PMC free article] [PubMed] [Google Scholar]
- Ogata N, Tatebayashi H. Slow inactivation of tetrodotoxin-insensitive Na+ channels in neurons of rat dorsal root ganglia. Journal of Membrane Biology. 1992;129:71–80. doi: 10.1007/BF00232056. [DOI] [PubMed] [Google Scholar]
- Ogata N, Tatebayashi H. Kinetic analysis of two types of Na+ channels in rat dorsal root ganglia. The Journal of Physiology. 1993;466:9–37. [PMC free article] [PubMed] [Google Scholar]
- Quasthoff S, Grosskreutz J, Schröder JM, Schneider U, Grafe P. Calcium potentials and tetrodotoxin-resistant sodium potentials in unmyelinated C fibres of biopsied human sural nerve. Neuroscience. 1995;69:955–965. doi: 10.1016/0306-4522(95)00307-5. [DOI] [PubMed] [Google Scholar]
- Rizzo MA, Kocsis JD, Waxman SG. Slow sodium conductances of dorsal root ganglion neurones: intraneuronal homogeneity and interneuronal heterogeneity. Journal of Neurophysiology. 1994;72:2796–2815. doi: 10.1152/jn.1994.72.6.2796. [DOI] [PMC free article] [PubMed] [Google Scholar]
- Rizzo MA, Kocsis JD, Waxman SG. Mechanisms of paresthesiae, dysesthesiae, and hyperesthesiae: role of Na+ channel heterogeneity. European Neurology. 1996;36:3–12. doi: 10.1159/000117192. [DOI] [PubMed] [Google Scholar]
- Roy ML, Narahashi T. Differential properties of tetrodotoxin-sensitive and tetrodotoxin-resistant sodium channels in rat dorsal root ganglion neurons. Journal of Neuroscience. 1992;12:2104–2111. doi: 10.1523/JNEUROSCI.12-06-02104.1992. [DOI] [PMC free article] [PubMed] [Google Scholar]
- Roy ML, Reuveney E, Narahashi T. Single-channel analysis of tetrodotoxin-sensitive and tetrodotoxin-resistant sodium channels in rat dorsal root ganglion neurons. Brain Research. 1994;650:341–346. doi: 10.1016/0006-8993(94)91803-1. [DOI] [PubMed] [Google Scholar]
- Rudy B. Inactivation in Myxicola giant axons responsible for slow and accumulative inactivation phenomena. The Journal of Physiology. 1981;312:531–549. doi: 10.1113/jphysiol.1981.sp013642. [DOI] [PMC free article] [PubMed] [Google Scholar]
- Rush AM, Elliott AA, Elliott JR. Contribution of two channel populations to fast sodium currents (INa) recorded from small cells isolated from adult rat dorsal root ganglia. The Journal of Physiology. 1995;481.P:44. P. [Google Scholar]
- Rush AM, Elliott JR. Phenytoin and carbamazepine: differential inhibition of sodium currents in small cells from adult rat dorsal root ganglia. Neuroscience Letters. 1997;226:95–98. doi: 10.1016/s0304-3940(97)00258-9. [DOI] [PubMed] [Google Scholar]
- Safronov BV, Bischoff U, Vogel W. Single voltage-gated K+ channels and their functions in small dorsal root ganglion neurones of rat. The Journal of Physiology. 1996;493:393–408. doi: 10.1113/jphysiol.1996.sp021391. [DOI] [PMC free article] [PubMed] [Google Scholar]
- Sangameswaran L, Delgado SG, Fish LM, Koch BD, Jakeman LB, Stewart GR, Sze P, Hunter JC, Eglen RM, Herman RC. Structure and function of a novel voltage-gated tetrodotoxin-resistant sodium channel specific to sensory neurons. Journal of Biological Chemistry. 1996;271:5953–5956. doi: 10.1074/jbc.271.11.5953. [DOI] [PubMed] [Google Scholar]
- Sangameswaran L, Fish LM, Koch BD, Rabert DK, Delgado SG, Ilnicka M, Jakeman LB, Novakovic S, Wong K, Sze P, Tzoumaka E, Stewart GR, Herman RC, Chan H, Eglen RM, Hunter JC. A novel tetrodotoxin-sensitive, voltage-gated sodium channel expression in rat and human dorsal root ganglia. Journal of Biological Chemistry. 1997;272:14805–14809. doi: 10.1074/jbc.272.23.14805. [DOI] [PubMed] [Google Scholar]
- Schild JH, Kunze DL. Experimental and modeling study of Na+ current heterogeneity in rat nodose neurons and its impact on neuronal discharge. Journal of Neurophysiology. 1997;78:3198–3209. doi: 10.1152/jn.1997.78.6.3198. [DOI] [PubMed] [Google Scholar]
- Scholz A, Appel N, Vogel W. Two types of TTX-resistant and one type of TTX-sensitive Na+ channel in rat DRG neurones and their blockade by halothane. European Journal of Neuroscience. 1998;10:2547–2556. [PubMed] [Google Scholar]
- Schwartz A, Palti Y, Meiri H. Structural and developmental differences between three types of Na channels in dorsal root ganglion cells of newborn rats. Journal of Membrane Biology. 1990;116:117–128. doi: 10.1007/BF01868670. [DOI] [PubMed] [Google Scholar]
- Scroggs RS, Fox AP. Calcium current variation between acutely isolated adult rat dorsal root ganglion neurons of different size. The Journal of Physiology. 1992;445:639–658. doi: 10.1113/jphysiol.1992.sp018944. [DOI] [PMC free article] [PubMed] [Google Scholar]
- Scroggs RS, Todorovic SM, Anderson EG, Fox AP. Variation in IH, IIR and ILEAK in acutely isolated adult rat dorsal root ganglion neurons of different size. Journal of Neurophysiology. 1994;71:271–279. doi: 10.1152/jn.1994.71.1.271. [DOI] [PubMed] [Google Scholar]
- Souslova VA, Fox M, Wood JN, Akopian AN. Cloning and characterization of a mouse sensory neuron tetrodotoxin-resistant voltage-gated sodium channel gene, Scn10a. Genomics. 1997;41:201–209. doi: 10.1006/geno.1997.4669. [DOI] [PubMed] [Google Scholar]
- Toledo-Aral JJ, Moss BL, He Z-J, Koszowski AG, Whisenand T, Levinson SR, Wolf JJ, Silos-Santiago I, Halegoua S, Mandel G. Identification of PN1, a predominant voltage-dependent sodium channel expressed principally in peripheral neurons. Proceedings of the National Academy of Sciences of the USA. 1997;94:1527–1532. doi: 10.1073/pnas.94.4.1527. [DOI] [PMC free article] [PubMed] [Google Scholar]
- Villière V, McLachlan EM. Electrophysiological properties of neurons in intact rat dorsal root ganglia classified by conduction velocity and action potential duration. Journal of Neurophysiology. 1996;76:1924–1941. doi: 10.1152/jn.1996.76.3.1924. [DOI] [PubMed] [Google Scholar]
- Yoshimura N, White G, Weight FF, de Groat WC. Different types of Na+ and A-type K+ currents in dorsal root ganglion neurones innervating the rat urinary bladder. The Journal of Physiology. 1996;494:1–16. doi: 10.1113/jphysiol.1996.sp021471. [DOI] [PMC free article] [PubMed] [Google Scholar]


