

Abstract
Low-frequency light-sensitive membrane current noise in isolated rod photoreceptors of the larval tiger salamander was recorded using suction electrodes, in the dark, and during light adaptation by backgrounds or by bleaching visual pigment.
In background light, noise variance increases and then decreases. For rods desensitized to similar levels by bleaching visual pigment, the noise variance either does not change (weak adaptation) or decreases (with stronger adaptation).
The power spectral density of the current noise in dark-adapted rods shows a component with half-power cut-off frequency at about 0.1 Hz, attributed to spontaneous single events and continuous noise from dark phosphodiesterase activity. A second component, with half-power cut-off frequency at about 1 Hz, may be due to slow components in the light-sensitive channel gating.
The power spectral density of the noise in background light is dominated by noise generated by the background. Background light adapts at least the first component of the noise seen in dark-adapted cells. For cells desensitized by bleaching, light adaptation of both components of the dark-adapted noise is observed.
The results confirm that the low-frequency noise in dark-adapted cells arises from the transduction mechanism of the rod, in that both components can be light adapted, and show that, for rods permanently desensitized by bleaching, the desensitization is not due to the presence of active visual pigment molecules similar to those produced by background light.
The various types of light-sensitive membrane current noise seen in rod photoreceptors were recently categorized by Rieke & Baylor (1996). Their measurements were made on truncated rods from the toad using suction electrodes, but the noise appears to be similar in other preparations. Noise from biochemical steps of the phototransduction mechanism was found predominantly at frequencies below 1 Hz. This corresponds to the noise previously described in more intact toad rods: a ‘continuous’ noise, and noise due to spontaneous ‘dark events’ (similar to the single photon events produced by dim light), the power spectral densities of which largely overlap (Baylor et al. 1980). Rieke & Baylor (1986) also describe components at low frequencies that appeared to be noise from the light-sensitive channels, with half-power cut-off frequencies at about 0.1 and 2 Hz, but the most characteristic noise from the channels was found at much higher frequencies, with half-power cut-off frequencies at 50 and 900 Hz, corresponding reasonably well to the characteristics of channel noise seen in isolated membrane patches from toad and salamander rods (Haynes et al. 1986; Matthews, 1986; Torre et al. 1992). The first of these higher frequency components has also been detected in cell-attached patch recordings and whole-cell recordings from lizard, frog (Bodoia & Detwiler, 1984) and salamander rods (Gray & Attwell, 1985).
The present paper describes the low-frequency components of light-sensitive membrane current noise recorded with suction electrodes and isolated rods of the tiger salamander. The use of suction electrodes meant that high-frequency components were obscured by noise in the relatively low seal resistances obtained, but did allow for long-term stable recordings in intact cells so that the noise could be studied in both dark-adapted and light-adapted rods. The rods were light adapted both by applying background light and by bleaching significant fractions of the visual pigment. The latter procedure produces rod cells that are permanently light adapted, and where the light adaptation appears as an ‘equivalent background’ that can be closely matched to real background light (Jones et al. 1996).
Two components of the noise at low frequencies in dark-adapted salamander rods appear similar to those seen previously in other preparations. The noise in background light is related quantitatively to the background light intensity here, whereas previous work (Baylor et al. 1979; Bodoia & Detwiler, 1984) provided only a qualitative description of the changes in noise in background adapted cells. Previously, a transient increase in noise, with characteristics similar to light-induced noise, has been detected after weak bleaches in toad rods (Lamb, 1980; Leibrock et al. 1994). In contrast, preliminary studies have already indicated no change in light-sensitive membrane current noise in cells permanently desensitized by bleaching (Fain & Cornwall, 1993; Jones, 1995a). The present report provides a full description of the membrane current noise in cells permanently desensitized by bleaching. The noise in bleached cells differs radically from the noise in cells desensitized by backgrounds.
METHODS
Medium size larval tiger salamanders were obtained from Charles D. Sullivan, Inc. (Nashville, TN, USA), maintained at 15°C on an 11 h light/13 h dark cycle, and fed with ‘feeder goldfish’ from a local pet store. Before each experiment, an animal was dark adapted at room temperature, usually for about 5 h, starting approximately 2 h after lights on. After killing by decapitation and pithing, retinae from the rear of both eyes were removed, under infrared illumination, into physiological saline solution and disrupted using miniature scissors and gentle trituration. The physiological saline solution contained (mM): 108 NaCl, 2.4 KCl, 1.0 CaCl2, 1.2 MgCl2, 1.6 NaH2PO4, 0.5 NaHCO3, 10 glucose and 10 Hepes (adjusted to pH 7.4-7.5 with NaOH) and 100 mg l−1 bovine serum albumin. Suction electrodes were made by fire-polishing the squarely broken tips of fine microelectrodes pulled from thin-walled glass (KG-33) capillaries to a diameter of about 12 μm. The suction electrodes were silanized, filled with the above saline solution, and they and the reference electrode (a saline-agar bridge) were connected to the input stage of an L/M EPC-7 amplifier using identical electrode holders with Ag/AgCl pellets (WPI, Saratoga, FL, USA; selected for low noise and stability). The recording circuit was made as symmetrical as possible to avoid large offset currents. For the duration of each experiment, the cells were continuously superfused with saline solution. All experiments were at room temperature, maintained between 20 and 22°C.
Light stimuli were large focussed spots, from a dual beam optical bench. Flash stimuli were at a wavelength of 537 nm, and background stimuli at 533 nm, both beams being conditioned by interference filters (full width at half maximum, 10 nm), and neutral density filters (calibrated in place). Bleaching light steps in early experiments were at a wavelength of 579 nm, using the background beam. In later experiments, the flash stimulus beam was used for bleaching. No differences in salamander rods bleached at different wavelengths with the fairly brief bleaching steps used in the present experiments have so far been detected (at most bleaches for several seconds; for longer bleaching steps, there might be differences due to different effects on photoproducts). Light intensities, neutral density filter attenuation and beam polarization were regularly measured using a calibrated photometer. These were converted to isomerizations per flash or isomerization rates in background light using the results of an unpublished series of experiments in the same experimental set-up, in which the collecting area of the salamander rod outer segment was measured from the average and variance of responses to a large number of dim flashes (cf. Baylor et al. 1979). The mean (±s.d.) collecting area, for nineteen rods, corrected to an absorption wavelength of 520 nm and for perfect alignment with a non-polarized stimulus was 18 ± 4 μm2. A confirmation of this measurement was obtained during the present work (see Results).
Experimental procedures
Reliable measurement of noise at low frequencies requires long stable recordings. For the experiments described here, each noise recording required at least 17 min. Measurement of the background noise contributed by the Johnson noise of the seal resistance and noise from the headstage of the amplifier was made during exposure of the rods to a bright light (to eliminate light-sensitive current) for a similar period, or longer. This effectively terminated each experiment, but it was not desirable to do this too long after an experimental measurement because of the possibility of amplifier instability and, especially, of changes in the suction electrode seal resistance. Apart from the overall time required, it was therefore impractical to make noise measurements in the same cell at a series of backgrounds, and after large fractional bleaches (which can each require tens of minutes for a steady state to be reached). A further complication arose from slow changes in the responsivity of the cells after isolation, which often increased markedly during the first 30 min or more of recordings, and sometimes slowly for even longer periods. A typical experiment therefore lasted some 4–5 h, during which recordings of responses to flashes and of noise were made in the dark, after a wait for apparent stability, followed by recordings in one or two backgrounds, a large fractional bleach followed by recordings of responses to flashes and noise after stabilization, and then a period in bright light to measure system noise. The characteristics of responses and noise in backgrounds and after bleaches were then obtained by combining data from different cells. This protocol was not always adhered to. Thus in a couple of cells, measurements were made only in the dark and after bleaching. In one cell, three backgrounds were tested, there was no bleach, but measurements in the dark were repeated. Measurements of seal resistance were not made during an experiment, but at the end; however, any large changes would have been apparent from the power spectral densities of the membrane current noise, which were dominated by the seal resistance noise at high frequencies (e.g. Fig. 7A). In none of the experiments was any change in seal resistance sufficiently large to warrant rejecting the results; the mean seal resistance was 4.9 ± 1.3 MΩ (n = 10), and the largest changes were increases or decreases of 30–40 %, which produced negligible changes in the difference noise spectra.
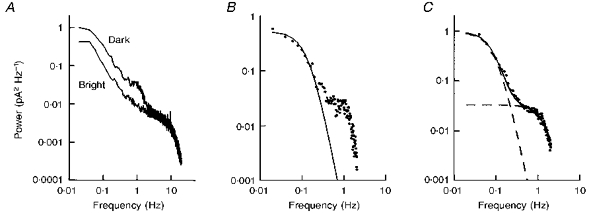
Figure 7. Membrane current noise power spectral densities in the dark and in background light.
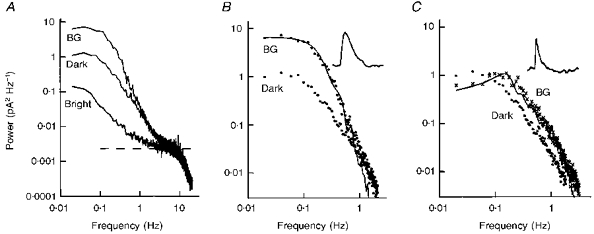
A, raw power spectra in a dark-adapted cell, in a weak background light (BG, 2.3 R * s−1) and in a bright light that suppressed all light-sensitive membrane current. B, difference spectra from A. The line is the power spectral density of the estimated single photon response in the background (inset), after scaling for a least-squares fit. Duration of the trace in the inset is 7.5 s, and the peak amplitude was 0.61 pA. C, difference spectra in the dark (•) and in a moderate background (BG, 260 R * s−1, ×), from the same cell. The line shows the power spectral density of the estimated single photon response in the background (inset), after appropriate scaling. The trace in the inset has a duration of 7.5 s, and the peak amplitude was 0.068 pA. The fitted curve in C was smoothed using a 5-point running average. These results are from the same cell as in Fig. 1.
Data acquisition and analysis
The voltage output (10 mV pA−1) from the L/M EPC-7 amplifier was archived on a chart recorder at bandwidth 0–5 Hz and on an FM analog tape recorder at a bandwidth of 0–500 Hz for later playback as necessary. At the same time, the signal was filtered at 0–10 Hz (8-pole Butterworth filter) before being amplified and sent to an A/D converter for computer recording. All data acquisition was done using the menu-driven ASYSTANT+ software, with hardware timing from a pulse generator. Subsequent analysis and plotting was done with the same software or after transfer to SIGMAPLOT, with a few calculations done using routines written in the ASYST programming language. Digital filtering employed a Blackman window low-pass routine. Noise recordings were made at an acquisition rate of 40 Hz. Responses to flashes were recorded at an acquisition rate of 120 Hz (necessary to record the timing of the 10 ms flashes), but were subsequently digitally filtered at 0–5 Hz and truncated to 40 Hz using software.
Current noise variance during periods in the dark or in background light, or in the dark after bleaching, were calculated from blocks of 2048 data points acquired at a rate of 40 Hz, after removal of any linear trend, digital filtering at 0–5 Hz, and truncation to every other data point. These parameters were chosen because power spectral density analysis showed that any noise above 5 Hz was dominated by seal resistance noise, and because any contribution of interference at very low frequencies, which appeared to arise in the amplifier headstage, seemed to be minimized by selecting these (51.2 s) blocks of data for linear trend removal. Power spectral densities were calculated according to the schema outlined by Bendat & Piersol (1986, chapter 11), from the same blocks of data, without digital filtering, but with linear trend removal, cosine tapering, overlapping, conversion to one-sided spectral densities, and averaging. Usually data from twenty or so blocks were used for averaging, though with favourable stability considerably more data were available, and averaged. In some early experiments, fewer data were recorded, and flash responses were recorded at an acquisition rate of 100 Hz, which made comparison of spectral power densities of responses and background noise difficult. For these experiments, therefore, the data were first digitally filtered at 0–5 Hz, and then appropriately truncated using software before power spectral densities were computed.
RESULTS
The results presented are collected from thirteen separate successful experiments. As described in Methods, a variety of different protocols were used so that a full characterization of noise in background light and after desensitization by bleaching could be made using results from different cells. During each experiment, the cells were repeatedly tested with bright flashes to measure the circulating current, which usually remained remarkably stable over the long periods of recording or decreased slightly, whereas responsivity to dim flashes often increased slightly. This last effect was present in the one experiment where reversibility was tested by measuring the dark noise both before and after a series of backgrounds. Flash sensitivity and noise variance were slightly higher after the backgrounds than before. In what follows, the dark values for this experiment were averaged. Reversibility of the effects of bleaching desensitization on membrane current noise was not tested. It has been shown elsewhere, however, that the desensitization can be reversed by supplying 11-cis retinal to bleached isolated salamander rods (Jones et al. 1989).
One experiment involving only a single bleaching desensitization was successfully completed but, inexplicably, any components of low-frequency membrane current noise in the dark or after bleaching in this cell were too small to be detectable above the system noise (backgrounds were not tested). The results from this experiment are being omitted from consideration.
Membrane current noise variance
Background adaptation
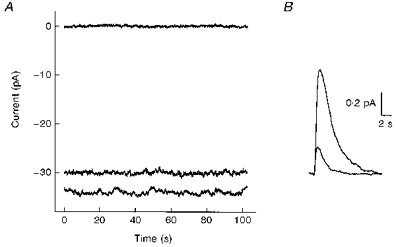
Figure 1 illustrates the membrane current noise seen in one cell, for which noise measurements were made at three background levels. The lowest trace in Fig. 1A shows a continuous recording of membrane current in the dark. The middle traces are recordings in a dim background, and in two brighter backgrounds, 10-fold and approximately 100-fold brighter. The top trace shows the membrane current subsequently recorded in bright light. The noise here is presumed to be due only to the recording system, since it is assumed that this light completely suppressed the light-sensitive current. The traces clearly show a pattern that is long established for such experiments: an increase in noise in dim backgrounds followed by a decrease at brighter backgrounds (Baylor et al. 1979). The traces in Fig. 1B are from the same experiment, and show average responses to dim flashes recorded in the dark and in the backgrounds. These responses were scaled down according to the flash intensities so that they estimate the responses to single photons, and illustrate the characteristic diminution of response amplitude and speeding up of the falling phases as the rod adapted to the background light.
Figure 1. Membrane current noise and flash responses in the dark and during background adaptation.
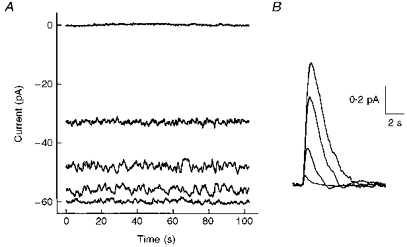
A, current recordings in the dark (bottom trace), during background light (middle traces) and in a bright light (top trace). The traces were positioned according to the amplitude of responses to bright flashes applied in the dark or during the background light. Background light intensities were 2.3, 23 and 260 R * s−1 (R *, excited rhodopsin). B, estimated single photon responses obtained from responses to dim flashes applied in the dark or during the background light, after scaling down according to the flash intensities and the collecting area of salamander rod outer segments. Traces are averages of 25–50 responses.
Measurements of membrane current variance in the dark and in background light, obtained after subtracting the variance of the current recorded in bright light, are collected in Fig. 2A. The points on the left show membrane current variance in the dark, which varied quite widely (some 5-fold) across cells, and the other points confirm the general pattern of an increase in noise in dim backgrounds and a decrease in brighter backgrounds.
Figure 2. Increase and decrease of membrane current noise variance with backgrounds.
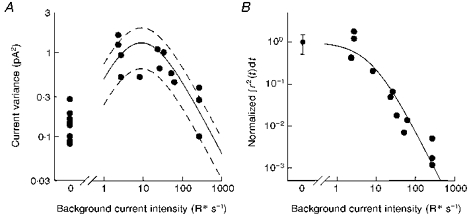
A, each data point on the right shows the sample current variance at different backgrounds. The points on the left show values of the current variance in the dark. The lines were drawn as follows: B, shows the fall-off in the integral of the square of estimated single photon responses with intensity of background light. The data points were normalized to values of this integral for dark-adapted responses in the same cell. The curve is an empirical function, eqn (2), drawn with A = 8 R * s−1, and c = 1.9. This curve was multiplied by the background intensity (in R * s−1) and the mean value of the integral in the dark across cells to give the continuous curve shown in A; see eqn (1). The mean value of the integral in the dark was 0.61 pA2 s, with 95 % confidence limits ± 0.31 pA2 s. These confidence limits were used to generate the dashed lines in A.
What explains this increase and decrease? In principal, the noise variance should increase because the rate of photon events increases with higher backgrounds, but it will decrease if these events become smaller, which occurs as the cells light adapt to the brighter backgrounds (Fig. 1B). Quantitatively, if the noise arises simply as a summation of individual stochastic events, according to Campbell's theorem (Rice, 1954), the noise variance should be equal to the product of the event rate and a ‘variance shape factor’ for each event. In the current context,
| (1) |
where, σ2i is the current variance, ν is the event rate and r (t) is the response to a single event. Thus if this holds for noise in background light, the variance will first rise with an increase in event rate, but then fall if the integral on the right of eqn (1) decreases more quickly than the event rate increases.
Figure 2B shows that this scenario is indeed the case for salamander rods. Here, for each background level, the square of the estimated responses to single photons was integrated, and normalized to the same integral for the dark-adapted cell. For dim backgrounds, this variance shape factor for the single photon events does not change (i.e. the cells do not light adapt). For backgrounds 100-fold brighter, however, the changes in amplitude and time course of single photon events decreases their variance shape factor by almost 1000-fold. The curve in Fig. 2B is the empirical equation:
| (2) |
where y is the normalized variance shape factor and IB is background light intensity (expressed as R * s−1); the curve was drawn with A = 8 R * s−1, and c = 1.9, and this curve was used to draw the continuous line in Fig. 2A, using the mean value of the variance shape factor for dark-adapted single events, according to the predictions of Campbell's theorem (eqn (1)). The dashed curves in Fig. 2A represent the same calculation using the 95 % confidence limits on the mean dark-adapted variance shape factor. These calculations ignored the variance of individual events themselves (see Katz & Miledi, 1972), but, at least in dark-adapted toad rods, the coefficient of variation for dark-adapted responses is only about 5 % (Baylor et al. 1979), which would make an insignificant correction.
Several inferences may be drawn from the results shown in Fig. 2, on the basis of this model: first, the light calibrations appear to be about right (though the wide variations in variance between cells mean that this is a poor test - a more strict test is described below, see Fig. 8); second, although no account was taken of dark-adapted noise variance, the noise in strongly light-adapted cells falls to levels similar to the dark-adapted noise, suggesting that the backgrounds light-adapt the dark noise (light adaptation of the dark noise is described explicitly in the following sections); third, it is clear that background induced noise is greatest at levels that produce only very weak light adaptation.
Figure 8. Comparison of estimates of background induced event rates.
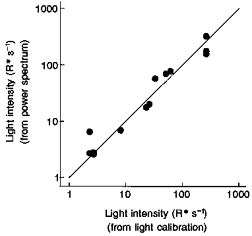
Calibrated light intensities were used to calculate the event rates at different background levels indicated on the abscissa. Values on the ordinate were obtained from the scaling of the power spectral density of estimated single photon events to the power spectral density of the membrane current noise in the background. The line indicates equality.
Bleaching desensitization
When salamander rods are exposed to a step of light that bleaches a significant fraction of visual pigment, and after a suitable time (which may be quite long, up to 1 h for very large bleaches), the cells attain a steady state that has most of the characteristics of cells light adapted by background light (Jones et al. 1996). Figure 3 illustrates this, and should be compared with Fig. 1. The dark-adapted and light-adapted responses shown in Figs 1B and 3B show that the responses in the bleach-desensitized cell had a similar shape and amplitude to those in the moderately light-adapted cell. The current recordings in Figs 1A and 3A show that the reduction in circulating current in the bleached cell was roughly the same as in the medium background. A notable difference, however, is the absence of increased noise in the cell desensitized by bleaching.
Figure 3. Membrane current noise and flash responses before and after desensitization by bleaching.
A, current recordings in the dark (bottom trace), at steady state after bleaching (middle trace) and in a bright light (top trace). The traces were positioned according to the amplitude of responses to bright flashes applied in the dark or after bleaching. The fraction of pigment bleached was estimated to be 0.10. B, estimated single photon responses obtained from responses to dim flashes applied in the dark or after bleaching, scaled down according to the flash intensities and the collecting area of salamander rod outer segments, and corrected for the loss in quantum catch after bleaching. Traces are averages of 34 and 25 responses.
Figure 4 shows collected measurements of membrane current variance in cells desensitized by bleaching, and compares this with the variance in cells desensitized by backgrounds. To make the comparison, the measurements are plotted against flash desensitization, i.e. the relative amplitudes of estimated single photon events in the light-adapted and dark-adapted cells, with the desensitization in bleached cells being corrected for the loss in quantum catch due to bleaching. Thus in the bleached cells, the desensitization was calculated as:
| (3) |
where SF/SFD is relative flash sensitivity, and F is the estimated fraction of pigment bleached (cf. eqn (4) of Jones et al. 1996). Figure 4A shows that there was little change in noise in cells weakly desensitized by bleaching, whereas a similar desensitization by background light was associated with a large increase in noise (Fig. 4B). This finding has already been described by Fain & Cornwall (1993), and also described in a preliminary report of the present study (Jones, 1995a). For cells more strongly desensitized by bleaching there was a definite decrease in membrane current noise, confirming the suggestion above that the dark noise in salamander rods can be light adapted, even if this adaptation is by the ‘equivalent background’ present after bleaching, rather than being adaptation by real light. Furthermore, this difference in membrane current noise occurs even though the adaptation by an ‘equivalent background’ is associated with a similar reduction in circulating current to the reduction in background adapted cells (see Fig. 4 of Jones et al. 1996).
Figure 4. Changes in current variance after bleaching desensitization compared with changes during background adaptation.
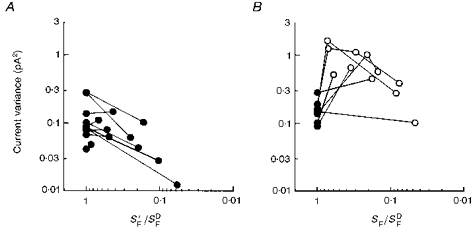
A, bleaching desensitization, with sample current variance plotted against flash desensitization after bleaching. Lines connect the dark-adapted current variance measurement with the measurement made after bleaching in the same cell. B, background adaptation. These data are from the same experiments as those in Fig. 2A, but are replotted against flash desensitization, for comparison with A. Lines connect measurements made in the same cell.
Bleaching and background adaptation
The light regimes used above that lead to similar desensitizations but produce very different changes in membrane current noise variance (Fig. 4) themselves differ greatly: in one case, application of one or more long continuous relatively dim lights (backgrounds); in the other, a relatively short, intense light step, followed by a prolonged period of darkness. It was therefore necessary to exclude the possibility that the second of these does not, in itself, in some way prevent the development of noise in the rod. This was tested by applying background light to cells already desensitized by bleaching. Figure 5 shows the result of one of these experiments. The effects of bleaching in this cell are already illustrated in Fig. 3. Two backgrounds of different intensity were applied to the bleached cell. For both, a further desensitization was found, and there was an associated increase in membrane current noise variance. Indeed, the effect of the backgrounds appears rather similar to that for dark-adapted cells, except that it occurs in an already desensitized cell with the consequence that somewhat higher backgrounds were needed to produce the further desensitization and increase in noise. An essentially similar result was found in two other cells.
Figure 5. Increased membrane current noise by backgrounds after desensitization by bleaching.
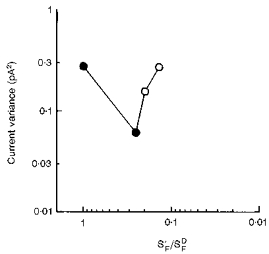
•, sampled current noise variance before and after bleaching. The noise variance is plotted against the flash desensitization after correction for loss in quantum catch. ○, sampled variance during two periods of background adaptation of the bleached rod, which each further desensitized the cell and produced an increase in noise variance. Background intensities were 9 and 27 R * s−1. Same cell as that in Fig. 3.
Power spectral densities
Dark-adapted cells
The previous sections describe the general features of the change in noise levels produced by light adaptation. More information can be obtained from power spectral densities, but it is first necessary to describe here the power spectral density of the membrane current noise in dark-adapted salamander rods. Figure 6A shows raw power spectral densities of the membrane current noise of a salamander rod recorded either in the dark or in a bright light. For the latter, the light was bright enough to reduce and maintain the light-sensitive current to zero, and thus represents noise from the recording system alone. This noise has a high-frequency component determined by the seal resistance, but mostly cut-off by the anti-aliasing filter at 10 Hz (the seal resistance was not measured in the experiment of Fig. 6A, but the noise level is shown for another experiment in Fig. 7A). At low frequencies, there is substantial 1/f (pink) noise, which appeared to be due to low-frequency instability of the amplifier headstage feedback, since it was equally present if the microelectrode (and cell) was replaced by a (high-quality, 1 MΩ metal film or 10 or 100 MΩ metal oxide) resistor, and it scaled with the noise from the resistor.
Figure 6. Power spectral density of membrane current noise in dark-adapted salamander rods.
A, raw power spectra from a rod in the dark and in a bright light. B, difference spectrum (•) from the spectra in A; the line shows the spectrum given by the product of two Lorentzians, fitted to the low power end of the spectrum. C, average difference spectrum (•) from seven cells; the dashed lines are spectra of the product of two and of three Lorentzians fitted to the low-frequency and high-frequency parts of the data, respectively. The continuous line is the sum of these two curves.
The low-frequency noise in control spectral densities was, however, usually well below the low-frequency components of membrane current noise, and could be subtracted out. Two components were clearly present in the power spectra of the membrane current noise in all rods. The filled circles in Fig. 6B show the difference spectrum for the cell of Fig. 6A. The lowest frequencies have been fitted with the product of two Lorentzian functions:
| (4) |
where S (f) is power spectral density at frequency f. This function was chosen because previous work has indicated that it is a good approximation for the low-frequency noise in toad rods (Baylor et al. 1979; Rieke & Baylor, 1996), and it provided a marginally better fit than a single Lorentzian, though for salamander rods the data points available for fitting do not extend over a high enough range of powers to really determine its validity. In part, this is likely to be a consequence of the smaller single photon event in the salamander rods. The function is, over the range available, indistinguishable from the power spectrum of single events in the dark-adapted rods.
Figure 6C shows an average spectrum from seven cells, selected as the best of the thirteen available, after the individual spectra were normalized to unity at their low-frequency asymptotes. This average spectrum has been fitted with the sum of the product of two Lorentzians and of the product of three Lorentzians. A product of three Lorentzians produced a slightly better fit for the second component than other combinations, but it is clear that the roll-off shown by the data is somewhat sharper than for the fitted curve. For this average spectrum, the second component has a much lower low-frequency asymptote than the first component, but it extends to much higher frequencies, such that the total power in the second component is about half that of the first component. The relative amplitude of the two components varied somewhat from cell to cell, but Fig. 6C indicates that, on average, the membrane current in dark-adapted cells shows two components with about one-third of the power in the higher frequency component.
Background adaptation
Analysis of the membrane current noise variance suggested that, in background light, the noise is dominated by that induced by the background, and this was thoroughly confirmed by the power spectral densities. Figure 7A shows raw power spectra in the dark and in the presence of a weak background together with the control spectrum in bright light. These are from the same cell as in Fig. 1. The difference spectrum in background light (Fig. 7B) has been compared with the power spectrum of the estimated single photon event (continuous line and inset, respectively), appropriately scaled. Almost all the power in the light-adapted cell corresponds to that of light-induced events, as concluded above; any light adaptation of the dark noise is obscured by the light-induced noise. However, it might be expected to be small for weak backgrounds since flash responses are only weakly reduced, and, indeed, it does appear that the second component of the dark noise is hardly affected (Fig. 7B). At higher backgrounds, significant light adaptation of the first component of the dark noise could be detected. Figure 7C shows the power spectra from this cell at a higher background level. The membrane current noise in the background, which has shifted to higher frequencies, can now account for all the noise, as seen by the scaled power spectrum of the estimated single photon events in the background, which is much faster (Fig. 7C, inset). Both components of the dark noise have presumably been reduced in the light-adapted cell. Reduction of the second component is difficult to estimate because it is now obscured by the light-induced noise, but reduction of the first component is clear in that the low-frequency asymptote of the power spectrum in the background is lower than the low-frequency asymptote of the noise in the dark-adapted cell.
The shape of the power spectra of the membrane current noise in background light confirmed the suggestion from analysis of the noise variance, that the noise in background light is dominated by that from background light-induced events, and this could also be made quantitative, providing a reasonably strict test of the light calibrations described in Methods. To do this, the scaling factors necessary to bring the power spectrum of an estimated single photon response into correspondence with the power spectrum of the background induced noise were compared with the rate of background induced events calculated from the light intensities of the backgrounds. According to Campbell's theorem, these scaling factors should be equal to the rate of light-induced events (Rice, 1954; Baylor et al. 1979; Leibrock et al. 1994). Correspondence indicates that the calibration is correct since the scaling factors depend on the square of the collecting area (the power spectra depending on the square of the amplitude of the single photon event, which was estimated by scaling down responses to dim flashes by the estimate of the number of photoisomerizations per flash), whereas the estimated isomerization rate is directly proportional to the collecting area. Figure 8 shows an excellent correspondence (for thirteen backgrounds in nine cells). Only one estimate was seriously in error, at the lowest background level where three other measurements were very close. The mean deviation was 24 %, very similar to the standard deviation of the measurement of collecting area made previously (see Methods).
Bleaching desensitization
In five cells of the present study, for which the desensitization by bleaching was substantial, there was a reduction in noise from the initial dark levels (Fig. 4A). This provided an opportunity to observe ‘light adaptation’ of the dark noise in these cells, in the absence of a preponderant noise from real background light, although, because the noise was reduced towards control levels, some aspects of the effect of desensitization by bleaching could not be completely distinguished.
For the one cell where bleaching reduced flash sensitivity more than 10-fold (see Fig. 4A), the very slight excess noise in the bleached cell meant that the power spectrum could not be resolved above that of the system noise recorded in bright light. However, this did indicate that the dark noise in salamander rods can be ‘light-adapted’ to very low levels. For the four other cells that showed a reduction in noise after bleaching, a distinct pattern of changes could be resolved. Figure 9 shows the power spectral densities for one of these cells (the same as that of Fig. 3), both in the dark (Fig. 9A) and after bleaching (Fig. 9B). The original data points are shown as filled circles, and the continuous lines show fits of these data points to the sum of the product of two Lorentzians and the product of three Lorentzians. For comparison, the fitted curves for the dark-adapted cell of Fig. 9A are reproduced as dashed curves on the data for the bleached cell in Fig. 9B. The major changes in the bleached cell are a reduction in low-frequency amplitude of the low-frequency component, and a shift to higher frequencies of the half-power cut-off of the high-frequency component. The decrease in the amplitude of the low-frequency component meant that there was a considerable loss of total power in this component. This was a constant finding for all four cells examined. In the data of Fig. 9, there also appears to be a slight increase in the half-power cut-off frequency of this component. The results for the other three cells were equivocal here; two showed an increase also, but one showed a decrease.
Figure 9. Adaptation of the dark noise after desensitization by bleaching.
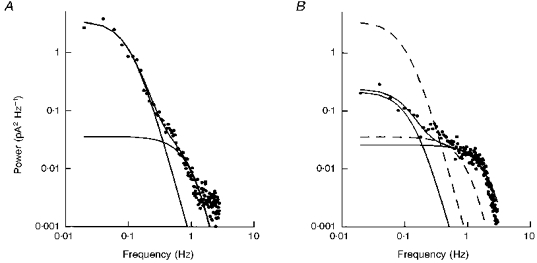
A, difference spectrum of noise in the dark-adapted cell (•). The two components have been fitted with the sum of the product of two Lorentzians and a product of three Lorentzians (continuous lines). B, difference spectrum of the membrane current noise after desensitization by bleaching. The power spectrum (•) was fitted by two curves of the same form as in A (continuous lines); the dashed lines reproduce the fitted curves from A. Results are from the same cell as in Fig. 3.
For the cell in Fig. 9, the low-frequency asymptote of the high-frequency component was decreased after desensitization by bleaching, as found in two other cells, whereas in the fourth cell, this parameter actually increased. These observations are not necessarily inconsistent, however, because of the much more notable increase in the half-power cut-off frequency of this component, which was a consistent finding. Because of this, the total power in this component of the noise was consistently found to increase in the bleached cells, i.e. the total power in the high-frequency component seen in the membrane current noise in the dark-adapted cell is increased in the ‘light-adapted’ salamander rod.
DISCUSSION
The increase in variance and the power spectral density of light-sensitive membrane current noise produced by background light in isolated salamander rods can be quantitatively described as random variation in the summation of discrete events produced by the backgrounds. It is noteworthy, however, that this noise already increases at background levels that hardly reduce the flash sensitivity of the cells (see Fig. 4B). A reduction in flash sensitivity by a factor of two in salamander rods occurs at a background intensity of about 1 photon μm−2 s−1 (Matthews et al. 1988; Jones et al. 1996), corresponding to about 20 R * s−1, a background level for which the background induced noise is already maximal (Fig. 2). It was pointed out by Donner et al. (1990) that it only makes sense for the cells to light adapt at background levels above those where only a few photons are absorbed per integration time of the responses. Since the dark-adapted integration time for the cells of the present study was 3.3 ± 0.5 s (mean ±s.d., n = 13), isolated salamander rods would appear to be following this rule, though it remains that the behaviour of the cells in the intact retina could well be different. In the frog, isolated rods appear to be much less sensitive to backgrounds than rods in the retina in an intact eye cup (Donner et al. 1990).
In contrast to isolated salamander rods desensitized by backgrounds, rods permanently desensitized by bleaching do not show an increase in membrane current noise (Fain & Cornwall, 1993; Jones, 1995a; see Figs 3 and 4), even though other characteristics of the membrane current responses of the bleached cells match the characteristics of the background adapted cells (Jones et al. 1996). This result has a simple explanation. For the cells permanently desensitized by bleaching, it is likely that the desensitization is caused by activation of transduction with low probability by opsin molecules, since all other photoproducts have probably decayed by the time the cells stabilize sensitivity after bleaching. A 2-fold reduction in sensitivity occurs at a background level of about 20 R * s−1, or about 40 R * if the effective lifetime of rhodopsin is 2 s (Pepperberg et al. 1992), whereas a 2-fold reduction in sensitivity after bleaching requires about a 6 % bleach, or production of about 2 × 10⁸ opsin molecules (Jones et al. 1996). Assume that opsin activates transduction in a way that is similar to activated rhodopsin, but with a very much reduced probability and, necessarily, with a very much reduced active lifetime. Then, the relative noise caused by bleaching will be at most proportional to the square root of the number of activating molecules scaled by the number of molecules, i.e. more than three orders of magnitude smaller. This would be undetectable by the techniques used in the present experiments.
After strong bleaches, however, the membrane current noise is reduced from its dark level. There are two components of low-frequency dark noise in salamander rods. The first component, at lower frequencies, is simply reduced in power, and this accounts for the overall reduction in noise in bleach-desensitized rods. This component in salamander rods, in comparison with the noise in rods of other species, appears to be a combination of noise from spontaneous discrete events and a continuous noise from dark phosphodiesterase activity (Rieke & Baylor, 1996). Its reduction during light adaptation is therefore similar to the well-known light adaptation of single photon events combined with the light adaptation of light-stimulated phosphodiesterase activity inferred from other physiological experiments (Lagnado & Baylor, 1994; Jones, 1995b; Koutalos et al. 1995). Adaptation of the second component of the dark noise is somewhat different in that the power spectral density shows an increase in power with a marked increase in half-power cut-off frequency. In truncated toad rods, this component scales with the light-sensitive current, and so has been attributed to slow gating processes of the light-sensitive channels (Rieke & Baylor, 1996), and long-lasting closures of about the right time scale have indeed been observed in isolated patches from salamander rods (Taylor & Baylor, 1995). This suggests the intriguing possibility that adaptation of the channels may occur by modulation of these long closures, perhaps, for example, via interaction with calcium and calmodulin (Gordon et al. 1995). If so, the present work indicates that the closures should become much more frequent and, probably, shorter in light-adapted cells. This component of the membrane current noise is very prominent in whole-cell recordings and cell-attached patch recordings (Bodoia & Detwiler, 1984; Gray & Attwell, 1985), and so further study should be relatively simple.
An equivalence between adaptation by backgrounds and during dark adaptation after bleaching in psychophysical experiments is well established (Barlow, 1972). This equivalence can be explained by a model in which the salient element is back-reactions from the bleached pigment to active states that are the same as those produced by a background (Lamb, 1981). Such a model requires that the rod photoreceptors become ‘noisy’ during recovery from bleaching in the same way that they do during background adaptation and, indeed, Lamb and co-workers (Lamb, 1980; Leibrock et al. 1994) find that this occurs in isolated toad rods during recovery from weak bleaches. Leibrock et al. (1994), however, found that the increase in noise is only a small fraction of that expected from the equivalent background, and proposed that a second process must be present in which bleached pigment activates transduction. This process may well be produced by opsin (Fain et al. 1996), and the present results would then explain the associated absence of an increase in noise.
Acknowledgments
The observation that bleach-adapted isolated rods show no increase in membrane current noise over dark-adapted cells was made independently of the present author by both Harris Ripps and Gordon Fain. Both modestly declined an invitation to co-authorship. The control experiment, showing that noise could be produced by applying backgrounds to bleached cells was suggested by Baruch Minke. Thanks are due to Enrico Nasi for loan of a calibrated photometer, advice on numerical analysis and critical comments on the manuscript, and to Carter Cornwall and Gordon Fain for encouragement. The work was supported by NIH EY01157.
References
- Barlow HB. Dark and light adaptation: Psychophysics. In: Jameson D, Hurvich LM, editors. Handbook of Sensory Physiology. VII/4. Berlin: Springer-Verlag; 1972. pp. 1–28. [Google Scholar]
- Baylor DA, Lamb TD, Yau K-W. Responses of retinal rods to single photons. The Journal of Physiology. 1979;288:613–634. [PMC free article] [PubMed] [Google Scholar]
- Baylor DA, Matthews G, Yau K-W. Two components of electrical dark noise in toad retinal rod outer segments. The Journal of Physiology. 1980;309:591–621. doi: 10.1113/jphysiol.1980.sp013529. [DOI] [PMC free article] [PubMed] [Google Scholar]
- Bendat JS, Piersol AG. Random Data. Analysis and Measurement Procedures. 2. New York: Wiley; 1986. chapter 11. [Google Scholar]
- Bodoia RD, Detwiler PB. Patch-clamp recordings of the light-sensitive dark noise in retinal rods from the lizard and frog. The Journal of Physiology. 1984;367:183–216. doi: 10.1113/jphysiol.1985.sp015820. [DOI] [PMC free article] [PubMed] [Google Scholar]
- Donner K, Copenhagen DR, Reuter T. Weber and noise adaptation in the retina of the toad Bufo marinus. Journal of General Physiology. 1990;95:733–753. doi: 10.1085/jgp.95.4.733. 10.1085/jgp.95.4.733. [DOI] [PMC free article] [PubMed] [Google Scholar]
- Fain GL, Cornwall MC. Light and dark adaptation in vertebrate photoreceptors. In: Shapley R, Lam DM-K, editors. Contrast Sensitivity. Cambridge: MIT Press; 1993. pp. 3–32. [Google Scholar]
- Fain GL, Matthews HR, Cornwall MC. Dark adaptation in vertebrate photoreceptors. Trends in Neurosciences. 1996;19:502–507. doi: 10.1016/S0166-2236(96)10056-4. 10.1016/S0166-2236(96)10056-4. [DOI] [PubMed] [Google Scholar]
- Gordon SE, Downing-Park J, Zimmerman AL. Modulation of the cGMP-gated ion channel in frog rods by calmodulin and an endogenous inhibitory factor. The Journal of Physiology. 1995;486:533–546. doi: 10.1113/jphysiol.1995.sp020832. [DOI] [PMC free article] [PubMed] [Google Scholar]
- Gray P, Attwell D. Kinetics of light-sensitive channels in vertebrate photoreceptors. Proceedings of the Royal Society. 1985;223:379–388. doi: 10.1098/rspb.1985.0007. B. [DOI] [PubMed] [Google Scholar]
- Haynes LW, Kay AR, Yau K-W. Single cyclic GMP-activated channel activity in excised patches of rod outer segment membrane. Nature. 1986;321:66–70. doi: 10.1038/321066a0. [DOI] [PubMed] [Google Scholar]
- Jones GJ. Membrane current noise and light adaptation in isolated salamander rods. Investigative Ophthalmology and Visual Science. 1995a;36:S382. [Google Scholar]
- Jones GJ. Light adaptation and the rising phase of the flash photocurrent of salamander retinal rods. The Journal of Physiology. 1995b;487:441–451. doi: 10.1113/jphysiol.1995.sp020891. [DOI] [PMC free article] [PubMed] [Google Scholar]
- Jones GJ, Cornwall MC, Fain GL. Equivalence of background and bleaching desensitization in isolated rod photoreceptors of the larval tiger salamander. Journal of General Physiology. 1996;108:333–340. doi: 10.1085/jgp.108.4.333. 10.1085/jgp.108.4.333. [DOI] [PMC free article] [PubMed] [Google Scholar]
- Jones GJ, Crouch RK, Wiggert B, Cornwall MC, Chader GJ. Retinoid requirements for recovery of sensitivity after visual-pigment bleaching in isolated photoreceptors. Proceedings of the National Academy of Sciences of the USA. 1989;86:9606–9610. doi: 10.1073/pnas.86.23.9606. [DOI] [PMC free article] [PubMed] [Google Scholar]
- Katz B, Miledi R. The statistical nature of the acetylcholine potential and its molecular components. The Journal of Physiology. 1972;224:665–699. doi: 10.1113/jphysiol.1972.sp009918. [DOI] [PMC free article] [PubMed] [Google Scholar]
- Koutalos Y, Nakatani K, Yau K-W. The cGMP-phosphodiesterase and its contribution to sensitivity regulation in retinal rods. Journal of General Physiology. 1995;106:891–921. doi: 10.1085/jgp.106.5.891. 10.1085/jgp.106.5.891. [DOI] [PMC free article] [PubMed] [Google Scholar]
- Lagnado L, Baylor DA. Calcium controls light-triggered formation of catalytically active rhodopsin. Nature. 1994;367:273–277. doi: 10.1038/367273a0. 10.1038/367273a0. [DOI] [PubMed] [Google Scholar]
- Lamb TD. Spontaneous quantal events induced in toad rods by pigment bleaching. Nature. 1980;287:349–351. doi: 10.1038/287349a0. [DOI] [PubMed] [Google Scholar]
- Lamb TD. The involvement of rod photoreceptors in dark adaptation. Vision Research. 1981;21:1773–1782. doi: 10.1016/0042-6989(81)90211-x. 10.1016/0042-6989(81)90211-X. [DOI] [PubMed] [Google Scholar]
- Leibrock CS, Reuter T, Lamb TD. Dark adaptation of toad rod photoreceptors following small bleaches. Vision Research. 1994;34:2787–2800. doi: 10.1016/0042-6989(94)90048-5. 10.1016/0042-6989(94)90048-5. [DOI] [PubMed] [Google Scholar]
- Matthews G. Comparison of the light-sensitive and cyclic GMP-sensitive conductances of the rod photoreceptor: noise characteristics. Journal of Neuroscience. 1986;6:2521–2526. doi: 10.1523/JNEUROSCI.06-09-02521.1986. [DOI] [PMC free article] [PubMed] [Google Scholar]
- Matthews HR, Murphy RLW, Fain GL, Lamb TD. Photoreceptor light adaptation is mediated by cytoplasmic calcium concentration. Nature. 1988;334:67–69. doi: 10.1038/334067a0. 10.1038/334067a0. [DOI] [PubMed] [Google Scholar]
- Pepperberg DR, Cornwall MC, Kahlert M, Hofmann KP, Jin J, Jones GJ, Ripps H. Light-dependent delay in the falling phase of the retinal rod response. Visual Neuroscience. 1992;8:9–18. doi: 10.1017/s0952523800006441. [DOI] [PubMed] [Google Scholar]
- Rice SO. Mathematical analysis of random noise. In: Wax N, editor. Noise and Stochastic Processes. New York: Dover; 1954. pp. 133–294. [Google Scholar]
- Rieke F, Baylor DA. Molecular origin of continuous dark noise in rod photoreceptors. Biophysical Journal. 1996;71:2553–2572. doi: 10.1016/S0006-3495(96)79448-1. [DOI] [PMC free article] [PubMed] [Google Scholar]
- Taylor WR, Baylor DA. Conductance and kinetics of single cGMP-activated channels in salamander rod outer segments. The Journal of Physiology. 1995;483:567–582. doi: 10.1113/jphysiol.1995.sp020607. [DOI] [PMC free article] [PubMed] [Google Scholar]
- Torre V, Straforini M, Sesti F, Lamb TD. Different channel-gating properties of two classes of cyclic GMP-activated channel in vertebrate photoreceptors. Proceedings of the Royal Society. 1992;250:209–215. doi: 10.1098/rspb.1992.0151. B. [DOI] [PubMed] [Google Scholar]