

Abstract
A slow postural muscle was tenotomized to determine the role of muscle stretch on chronic recruitment patterns in freely moving animals.
Different amounts of muscle shortening were induced in the soleus muscles of ten rats by severing the tendon of insertion (n = 3), the whole Achilles' tendon (n = 4) or the origins and insertions (n = 3).
Bipolar wire electrodes were implanted on each muscle to record the electromyographic activity (EMG) under control and tenotomized conditions. The complex interference pattern was continuously analysed to determine the number and amplitude of peak potentials (called turns). The numbers of these ‘turns’ and their amplitudes were determined during 4 control and at least 5 experimental days. Sham-operated controls and groups matched according to the type of tenotomy were analysed for length changes and pathological changes 5 and 10 days post-tenotomy.
The total activity levels in all three tenotomy conditions were not significantly changed when compared with their own control levels. No differences in total activity level were found between the three tenotomized conditions.
The normal diurnal patterns of muscle recruitment were preserved during the tenotomized conditions, with the highest levels consistently occurring during the first 3 h of the dark cycle.
Tenotomy of the soleus, whether induced by distal (ST), distal and proximal (DT) or Achilles' tenotomy (AT) resulted in muscle shortening (9–26 %). No muscle pathology was found in the ST or AT groups. Degeneration was found in the DT group after 5 days, with further increases at 10 days.
These data suggest that the absence of stretch had no discernible influence on the aggregate activity levels in the slow postural soleus muscle. Whether tenotomy caused changes in recruitment within individual step cycles was not evaluated.
Postural muscles like the soleus are recruited extensively throughout a 24 h period (Alaimo et al. 1984; Hennig & Lømo, 1985; Blewett & Elder, 1993). Recruitment is determined by the level of excitatory versus inhibitory synaptic drive to the α-motoneurones. This drive originates from upper motoneurones, spinal pathways and peripheral reflex mechanisms originating from homonymous and heteronymous muscles. Exactly how much these reflex mechanisms contribute to overall muscle recruitment is not well understood. It is known that when a muscle is stretched, a myotatic stretch reflex is elicited by the muscle spindles (Liddell & Sherrington, 1924). An electromyographic (EMG) response follows, which reflects the recruitment in the muscle. The magnitude of the response is influenced by the state of stretch of the muscle (Weiss et al. 1986; Polus et al. 1991), the amplitude and velocity of stretch, as well as the background level of contraction in the muscle being stretched (Berardelli et al. 1982).
It is less well understood what effect maintained stretch has on recruitment in postural muscles. These muscles are more richly supplied with muscle spindles per volume of muscle than non-postural muscles (Swett & Eldred, 1960), which makes them more sensitive to stretch and provides greater excitatory drive from spindle afferents. Motoneurones supplying postural muscles have also been shown to have a greater convergence of excitatory synapses originating from synergic muscles, which results in more extensive recruitment than occurs in other muscles (Eccles et al. 1957). There is evidence that the afferent system influences recruitment in soleus because when it is blocked by dorsal rhizotomy, recruitment is significantly reduced (Hník et al. 1981). Furthermore, when suprasegmental influences were inhibited by cordotomy, the cat soleus was still found to have 25 % of its normal recruitment level (Alaimo et al. 1984), presumably via reflex mechanisms. When muscles were immobilized in stretched or shortened positions, activity levels were either preserved (Hník et al. 1985), or reduced (Fudema et al. 1961; Fischback & Robbins, 1969; Hník et al. 1985). These authors concluded that maintenance of normal or increased activity levels was dependent on the state of stretch.
Studying the influence of stretch by immobilizing a muscle has its limitations because it also stretches the muscle's synergists and shortens its antagonists. Since recruitment in soleus is influenced by the convergence of excitatory synaptic drive from both synergic (Eccles et al. 1957) and antagonist muscle activity (Hennig, 1987), the true effect of stretch on the muscle of interest may be masked. The normal movement patterns of the animal are also likely to be altered by the immobilization of the ankle and knee.
Tenotomy is a model that reduces muscle stretch in individual muscles without affecting the length of synergists or antagonists. It has been shown to reduce the rat soleus length by as much as a half to two-thirds (Baker & Hall-Craggs, 1978). Recruitment was reported to be abolished in rabbit soleus following tenotomy, except during sudden changes in position (McMinn & Vrbova, 1964). In contrast, Nelson (1969) found little or no effect on EMG activity in either the soleus or the medial gastrocnemius of the cat immediately following tenotomy, or for several weeks after. Tenotomy of the rat Achilles' tendon was reported to reduce the aggregate of motor unit activity to ∼60 % of normal, but activity levels were found to return to normal levels between 7 and 10 days post-tenotomy (Karpati et al. 1972). It therefore remains uncertain exactly what effect reduced muscle length has on soleus recruitment.
The purpose of this study was to determine first if activity levels were reduced in soleus following muscle shortening induced by tenotomy, and second whether the amount of shortening had an effect on activity levels. The third purpose was to determine if activity levels in soleus were influenced by shortening of a muscle which acted synergistically to it.
METHODS
Experimental animals
All animal experimentation received ethical approval from the University Animal Ethics Committee and followed the guidelines of the Canadian Council on Animal Care. Animals were housed individually and fed rat chow and water ad libitum. They were kept on a 12 h : 12 h light-dark cycle with the dark period starting at 18.00 h.
Experimental design
The rats underwent surgery to implant the electrodes, followed by 4 recovery days (for details see below). Control EMG data were collected during the next 4 consecutive days. The muscles were then tenotomized and the animals were allowed to recover for a further 4 days (for details see below), before at least 5 days of experimental EMG data were collected. Data collection started in some animals 24 h after tenotomy and continued for 14 days in three animals to determine if activity levels changed following tendon reattachment.
Groups
EMG data were obtained from ten male Sprague-Dawley rats (weight, 350–550 g) during control and experimental (post-tenotomy) conditions. The origin and insertion of soleus were cut in the left leg of three animals (double tenotomy, DT group). In the same animals, the insertion of soleus was cut in the contralateral leg (single tenotomy, ST group). In four animals the whole Achilles' tendon was cut in just one leg to shorten the soleus and gastrocnemius (AT group). In the remaining three animals, either the insertion or the origin and insertion were cut in a single leg. This design allowed the activity levels in soleus to be compared between animals which had tenotomies performed in one or both legs. Since no differences were found, their results were included in either the DT or ST groups. A further four groups of rats (n = 4 per group) of similar weight, but without electrodes implanted, were studied to determine the effect of tenotomy on muscle length and if the surgical procedures induced any histological changes (see Table 1). Another ten animals of similar weight were studied to determine the effect of DT, DT with an electrode implanted, and AT on the degree of shortening in soleus 5 days post-tenotomy (see Table 1). These muscle length and histology results were compared with those obtained from the contralateral control legs.
Table 1.
Control groups used to study the effects of surgery and tenotomy on muscle length and histology
| Tenotomy | |||||||
|---|---|---|---|---|---|---|---|
| Control groups | n | Sham surgery | ST | DT | AT | Electrodes | Histology and muscle length |
| Control muscles | 4 | — | — | — | — | — | Pretetonomy |
| ST, day 0 | 4 | + | — | — | — | — | Pretetonomy |
| ST, day 5 | 4 | + | + | — | — | — | 5 days post-tenotomy |
| ST, day 10 | 4 | + | + | — | — | — | 10 days post-tenotomy |
| DT | 3 | + | — | + | — | — | 5 days post-tenotomy |
| DTE | 3 | + | — | + | — | + | 5 days post-tenotomy |
| AT | 4 | + | — | — | + | — | 5 days post-tenotomy |
The different control groups are identified along with the procedures they underwent. ST, single tenotomy; DT, origin and insertion tenotomy; DTE, DT plus electrode; AT, Achilles' tenotomy. Sham surgery indicates animals that underwent the same surgical procedures as the experimental group, but without collecting EMG data.
Electrode design
The electrodes were made from two insulated, multistranded stainless steel wires (no. AS632; Cooner, Chatsworth, CA, USA) of 24 cm length. Gold pins were soldered to one end of each wire and the other exposed end was insulated by stretching the insulation over it. These same ends were tied in the smallest knot possible and secured with fine thread. A second knot of the two wires was made 5 mm away from the first, thereby keeping the wires parallel and 1.5 mm apart along this 5 mm length (see Fig. 1). The recording surface of each wire was prepared using a dissecting microscope and a razor blade. From the centre of each 5 mm length, a narrow strip of insulation 2.5 mm long was removed from each wire. The electrode was placed underneath the belly of the soleus at 90 deg to the orientation of muscle fibres with the exposed wires against the soleus. Surgical threads attached to each electrode knot were tied together around the muscle to secure the electrode in place. The electrode was positioned approximately one-third of the way along the soleus. Ground electrodes were made from the same wire and the exposed ends were sutured to the Achilles' tendon or to subcutaneous tissue in the back of the neck, while the proximal end was inserted into a pedestal mounted on the skull (see below). All electrodes were sterilized prior to implantation.
Figure 1. Design of the electrode, the recording surface and its location in relation to the soleus.
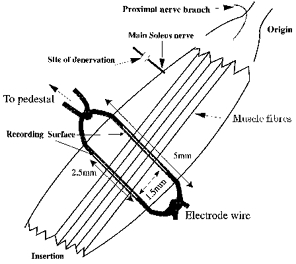
The positions of the major nerve and a recently found proximal nerve are also shown. View is from the dorsal surface of the leg.
Surgical procedure
Rats were anaesthetized by an intraperitoneal injection of sodium pentobarbitone (Somnotol, 65 mg kg−1; MTC Pharmaceuticals, Cambridge, Ontaria, Canada), with supplemental doses of a half the original dose given approximately every 90 min, when recovery of the withdrawal reflex to a mildly painful stimulus indicated that anaesthesia had become less deep. The dorsal aspect of one or both hindlimbs and an area over the skull were shaved and sterilized. A 1 cm2 area of skin on the skull was opened up and the covering layers of skin, connective tissue and membranes were dissected. The bare cranium bone was left exposed to dry, while the muscle electrodes were implanted.
A 1.5 cm incision was made lateral to the mid-line of the dorsal surface of each hindlimb starting just above the Achilles' tendon. The lateral gastrocnemius was retracted, exposing the soleus, and the electrode was positioned as described above. Both electrode wires were run subcutaneously up the back of the animal to the pedestal (6C Pedestal; Plastics One, Roanoke, VA, USA) mounted on the skull. Stretching or pulling of the muscle by the electrodes during movement was prevented by making loops of the electrode wire and suturing them to connective tissue proximal to the origin of the soleus. The incision was then sutured using surgical thread. The gold pins were inserted into the base of the pedestal which was secured to the skull by three stainless steel screws (4.8 mm, catalogue no. 0-80x3/16) and dental cement (cranioplastic powder and hardening liquid; Plastics One). The protruding ends of the gold pins at the base of the pedestal were insulated with the same dental cement. All animals were killed at the completion of the study by an overdose of the same anaesthetic used for surgery (sodium pentobarbitone, 260 mg kg−1). The location of electrodes was checked to ensure they had not moved.
Tenotomy procedures
Tenotomies were performed under aseptic conditions during anaesthesia. A lateral incision 1 cm long was made starting near the Achilles' tendon. The lateral gastrocnemius was retracted and the soleus was exposed. During single and double tenotomies, the soleus was freed from adjacent tissue to allow maximum shortening. Care was taken to preserve its innervation and blood supply. The tendons were severed by a scalpel and muscles were observed to shorten before closing the incision.
EMG recording methods
A shielded cable with six wires and a male plug at either end (SL6C/SL12C 363–363, 45 cm length; Plastics One) was inserted into the pedestal mounted on the animal's skull. The opposite end was plugged into the bottom of a commutator (SL6C 6 channel commutator; Plastics One) suspended above the animal. The animals were individually housed in rectangular cages with high Plexiglass walls. They were free to move around the cage, to turn 360 deg on themselves, and to feed and groom themselves. Another shielded cable from the top of the commutator was connected to a Grass polygraph. The EMG signals were recorded differentially and amplified using preamplifiers (model 7P5B; Grass) and driver amplifiers (model 7DAG; Grass). The signals were band-pass filtered with the filters set for a half-maximum amplitude response between 10 Hz and 40 kHz. The analog-to-digital board was set to record within a ±1.0 V range and sampled each channel at 6 kHz. The gain on each channel was set so that the highest amplitude potentials observed during sudden movements, or during sudden weight bearing after raising the hindlimbs off the ground, just reached 1.0 V. The gain and the amplifier settings were kept constant throughout the recording periods. The filtering and sampling frequency used were able to count accurately the number of peak potentials (turns) and measure their amplitudes. The power of the EMG signal was analysed using fast Fourier transformation with a sampling rate of 10 kHz (see Fig. 2). This showed that most of the power was between 0 and 700 Hz, and only a very small percentage (< 3 %) of the signal exceeded 3 kHz during intervals when muscles had their highest activity levels. Therefore, a sampling rate of 6 kHz should have prevented aliasing during data collection.
Figure 2. Recordings over 8 h during the light and dark cycles of one 24 h period.
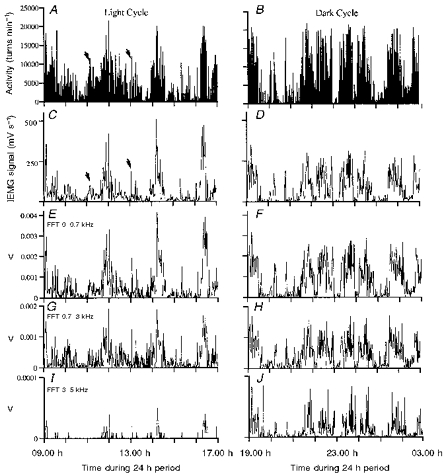
A and B, turn counts. C and D, integrated EMG. E–J, fast Fourier transform (FFT) analysis. E and F, 0–0.7 kHz; G and H, 0.7–3 kHz; I and J, 3–5 kHz. Note scales for FFT analyses are different and the sampling rate for FFT analysis was 10 kHz. The arrows identify two 1 min periods when the number of turns was similar but the IEMG was much lower at the first point, indicating the turns must have been of lower amplitude. The bin data confirmed this.
The EMG activity was analysed using a Macintosh Centris 650 computer with an analog-to-digital board (NB-MIO-16; National Instruments) and a high performance GPIB interface board (NB-DMA-8-G; National Instruments). Programs were written using Labview 2.2.1 software for data collection and analysis. The EMG was analysed using a modification of the ‘turns’ analysis method which has been used by this laboratory previously (Blewett & Elder, 1993). The positive waves of the complex interference pattern were analysed to determine the number and amplitude of every turn in the interference pattern. A turn was defined as any peak potential which was followed by an immediate reduction in amplitude of at least 30 mV (amplified signal). The required reduction in amplitude of 30 mV also set a threshold, preventing baseline noise from contributing to the determination of turns. When one or several motor units were firing, it was usually possible to identify the discrete action potentials of the individual units. With the turns analysis technique, each one of these potentials would be counted as a turn. When the numbers of active motor units increased, along with their firing frequencies, the discrete action potentials were less frequently recognizable. Instead, the interference pattern became progressively more complex, comprising a series of peaks of different amplitudes. We show in this study that the frequency and amplitude of these peaks increased as the animal became increasingly active (see Figs 3 and 4). There was no evidence that the number of turns saturated at the higher activity levels. Each turn, depending on its amplitude, was allocated into one of ten bins of 100 mV each. The number of turns and their amplitudes were continuously determined for each minute of every day.
Figure 3. Turns analysis technique and integrated EMG.
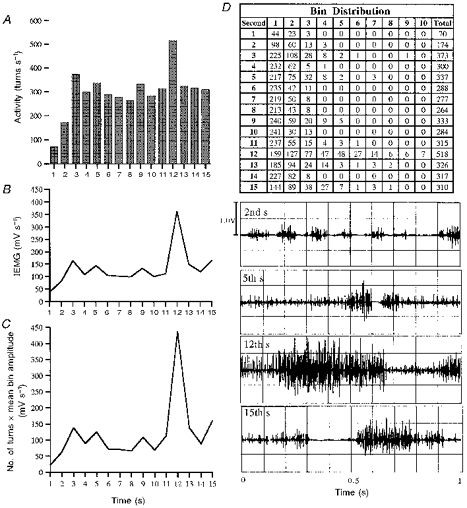
The number of turns in each of fifteen 1 s intervals of activity (A), the IEMG (B), and the number of turns multiplied by the mean bin amplitude for each second (C) are shown. D, the number of turns in each bin and the total number of turns for each of the fifteen 1 s intervals. Note the similarity between B and C. The raw EMG for seconds 2, 5, 12 and 15 are presented.
Figure 4. Increasing the incline of running generally increased the amplitude of potentials, but not the frequency.
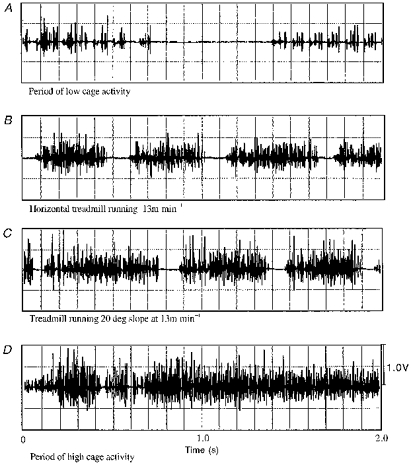
Compare the last two bursts in C (20 deg slope) with bursts in B (horizontal running). The low (A) and high cage activity periods (D) show the ranges of activity, and show that cage activity can produce activity levels that match and exceed treadmill running.
The turns analysis technique was compared with the integrated EMG (IEMG) (see Figs 2 and 3) and we believe that the combination of the number of turns and their amplitude provided more information than the IEMG. The number of turns recorded provided a sensitive measure of the activity level of a muscle from minute to minute (compare Fig. 2A with 2C, and 2B with 2D), and produced a similar pattern of overall activity to the IEMG (Fig. 2). The IEMG was calculated by integrating the full-wave rectified signal for each minute, to allow direct comparison with the turns analysis which determined the number of turns per minute. The problem with the IEMG signal is it is unknown whether it is composed of many small amplitude units, fewer large units or a combination of both. When we calculated the number of turns in each bin and then multiplied this number by the mid-range value of the bin, e.g. 50 mV for bin one, 150 mV for bin two, etc., and plotted this, we got an integral very similar to the IEMG (see Fig. 3). When the same data were plotted for 24 h of activity during a control and experimental day and compared with the turns analysis, very similar patterns of daily activity were evident (see Fig. 5). Therefore, turns data represented the activity of muscles accurately. However, the addition of the amplitude data allowed us to determine if there were any shifts in the distribution of turns in the different bins between control and tenotomy conditions, which the IEMG data would not have provided.
Figure 5. Pattern of activity in control and tenotomized muscles.
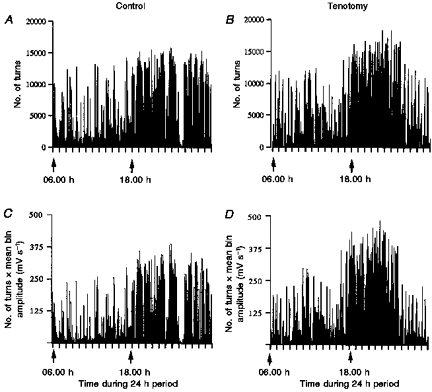
A and B, the number of turns during a control and tenotomy day, respectively. C and D, number of turns multiplied by the mean bin amplitude for the same days. The combination of the number of turns and turn amplitude produces an EMG measure very similar to the actual IEMG. The patterns of activity are very similar using both techniques. There is no indication of turns saturating.
Muscle histology
At the conclusion of the experiment, after the animals had been killed by anaesthetic overdose (see ‘Surgical procedures’), muscles were removed from the DT, ST and AT experimental groups that had not had electrodes implanted, as well as the control and sham-operated groups (Table 1). They were rapidly frozen in isopentane cooled in liquid nitrogen. Thin (12 μm) cross-sections were cut from the mid-belly regions and were stained with Haematoxylin and Eosin, and Gomori Trichrome. The areas of the muscle cross-sections were measured using standard morphometry techniques from images projected from a video camera mounted on a microscope to a monitor. The areas of the muscle undergoing degeneration were identified, measured and expressed as a percentage of the total cross-sectional area.
Data analysis
The EMG data were placed into appropriate files according to the time of day and transferred into a Microsoft Excel program for analysis. After reviewing the trends found in the activity patterns, it was decided to analyse them by combining 3 h blocks of data starting from the beginning of the light cycle at 06.00 h. The data from each of these blocks were averaged for each animal under control and experimental conditions. Since the total daily amount of activity varied among animals, the results for each muscle have been expressed as a percentage of that animal's own control data. Differences between blocks were analysed by a one-factor ANOVA of repeated measures, and by Scheffé's post hoc test. Amplitude data, muscle lengths and degeneration in control and experimental conditions were analysed by Student's paired t tests (one tail), except where stated in the text.
RESULTS
Activity levels in control soleus
The soleus is a postural muscle that is recruited extensively during each 24 h period. Recruitment is based in this study on the analysis of the complex interference pattern recorded, involving counting the number of turns and measuring their amplitudes. Figure 5 illustrates the pattern of activity found during a typical control day. Activity was found to range between 0 and 20 000 turns min−1 in most animals, but in two, maximal levels of 25 000 turns min−1 were found. Recruitment could be observed when animals were quite still, and small changes in posture such as tilting the head could induce, or switch off, recruitment of one or more motor units. The total number of turns on any given control day was quite consistent for a given animal, but ranged between 4 × 10⁶ and 8 × 10⁶ among animals. The two animals with the highest number of turns per minute had total ranges between 1 × 10⁷ and 1.5 × 10⁷.
Diurnal patterns of recruitment
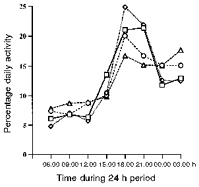
Higher numbers of turns were consistently found during the dark cycle in all animals compared with the light cycle (P < 0.0001). Approximately two-thirds of the total activity in soleus occurred during the night, as compared with the daytime (see Fig. 6). This activity was very cyclical, with periods of high activity lasting for up to an hour or more, followed by rest or low levels for somewhat shorter periods. The highest activity levels were found during the 3 h immediately following the start of the dark cycle (Fig. 6), followed by a steady decline throughout the night. The lowest activity levels were recorded during the 3 h following the start of the light cycle, with a gradual increase up to the start of the dark cycle. The mean number of turns per minute (±s.d.) during the dark cycle was 5917 ± 2352, which was significantly higher than during the light cycle (3024 ± 1542; P < 0.0001). When the number of turns was analysed in 3 h blocks by a one-factor ANOVA of repeated measures, no significant differences were found between the first three blocks following the start of the light cycle. The block immediately preceding the dark cycle had more activity than the other light cycle blocks, but this was not quite significant using Scheffé's post hoc test. When activity levels were expressed as a percentage of total daily activity, the first three light cycle blocks had activity levels ranging between 6 and 8 % and the last had a level of ∼10 %. During the dark cycle, 20 % of total daily activity occurred during the first block, which gradually fell successively to ∼15 % in the last (Fig. 6). Activity in all dark cycle blocks was significantly higher than in any of the light cycle blocks (P < 0.05). There was no significant difference between activity in the first two dark cycle blocks, but activity in the first was significantly higher than in the last two blocks (P < 0.05).
Figure 6. Activity levels in control and tenotomized muscles.
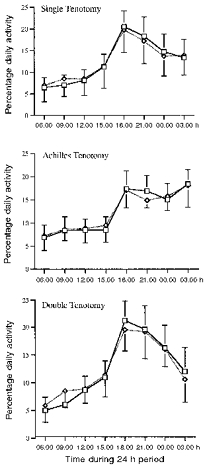
The number of turns was averaged for each day of recording into 3 h blocks, beginning from 06.00 h. The values are the means ±s.d. for all animals (n = 10), recorded during 4 control (□) and 4 tenotomy days (⋄).
Amplitude of turns
The amplitude of each turn was determined and placed in one of ten bins (100 mV bin−1). Approximately 90 % of all turns fell into the first three bins in each group. The highest percentages were in the first bin, with successively fewer in each higher bin (Fig. 7). There were brief periods when high amplitude turns were found (see Fig. 3), but the numbers in the higher bins represented a small percentage of the total, and therefore all turns in bins five to ten were grouped together. When the distributions of low and high amplitude turns were compared between the dark and light cycles, the percentages found in the different bins were similar.
Figure 7. Amplitude of turns recorded in control and tenotomized muscles.
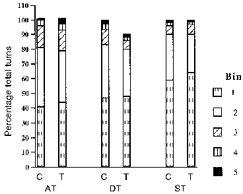
The number of turns recorded in each bin during 4 control (C) and 4 tenotomy days (T) was averaged for the animals in each group and reported as a percentage of total turns. When the data from the three groups were combined, bin two had significantly fewer turns (P < 0.05) in the tenotomized condition. The increase in the number of turns in bin one was not significant. AT, Achilles' tenotomy; DT, double tenotomy; ST, single tenotomy.
Effects of tenotomy on muscle length
Tenotomy was used as a model for inducing shortening of the desired muscles. This assumption was tested by cutting the soleus insertion, and it was found that muscle length decreased by 8.65 ± 2.05 % (mean ±s.d.) when examined 5 days post-tenotomy and by 9.03 ± 4.1 % in a second group examined after 10 days. These length changes were significantly different from their controls (P < 0.05). The hypothesis that soleus length would decrease more after cutting both the origin and insertion, and after cutting the Achilles' tendon was also tested and confirmed (see Fig. 8). The greatest amount of shortening was induced by cutting the origin and insertion (26.43 ± 1.42 %), and this was significantly greater (P < 0.05) than just cutting the Achilles' tendon (19.5 ± 2.73 %). A further group underwent both origin and insertion tenotomy following the implantation of an EMG electrode to determine how the electrode implant might affect muscle length. Length decreased by 22.08 ± 1.42 % after 5 days, which was not significantly different (P > 0.05) from the double tenotomy group.
Figure 8. Muscle length changes in control and experimental muscles.
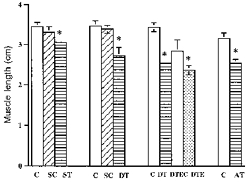
C, control; SC, sham-operated controls; ST, insertion tenotomy; DT, origin and insertion tenotomy; AT, Achilles' tenotomy; DTEC, DT plus electrode control; DTE, DT plus electrode. Values are means ±s.d.* Significantly different from control length (P < 0.05).
Effects of tenotomy on activity levels
Data from the control period demonstrated that total activity levels could be quite different among animals. Therefore, the number of turns during the tenotomy period has been expressed as a percentage of each muscle's own control values. The mean number of turns for each 3 h block averaged over 4 control and 4 experimental days were compared. Despite the fact that each type of tenotomy caused significant shortening of the soleus, and the amount of shortening differed, no effect on total activity levels was observed in any tenotomized group. Therefore, the data from each group were combined and were analysed using an ANOVA of repeated measures to determine if differences existed between the 3 h blocks in the control and tenotomized conditions.
The means and total number of turns during the light and dark cycles and the total daily number of turns in the experimental period were not significantly different from the control period. The amount of activity in each 3 h block during the light cycle was similar to the control condition (Fig. 6). There were no significant differences in activity levels between experimental and control conditions during either the light or the dark cycles.
With the assumption that a higher number of turns per minute represented increased activity levels, the turn count data were divided into ranges of 2500 turns min−1. How many minutes of each day a muscle had activity within each of the ranges was calculated and represented as a percentage of each control and tenotomy day (see Fig. 9). All three groups spent between 40 and 60 % of each day at the lowest activity level (0–2500 turns min−1). Considerably less time was spent in the next three intervals, ranging from 10 to 22 %, with a gradual decline as the activity levels increased. There was no significant difference between the control and tenotomy condition in any interval when analysed by group and when groups were combined (Student's paired t test, two tail).
Figure 9. The level of activity in a muscle is reflected in the number of turns per minute.
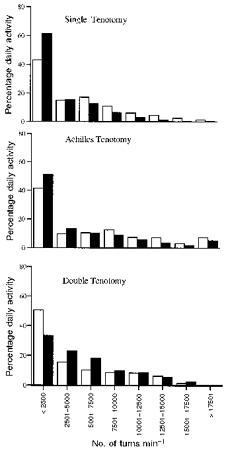
The number of minutes each muscle had activity in the ranges indicated is expressed as a percentage of the total day. There were no significant differences between the control (□) and tenotomy groups (▪). Number of muscles: single tenotomy, n = 5; Achilles' tenotomy, n = 4; double tenotomy, n = 4.
Effect of tenotomy on amplitude data
The percentage of turns that fell into bins one to four, averaged over 4 control and 4 experimental days, and the combined bins five to ten are illustrated in Fig. 7. The percentage of turns in the different bins in control and tenotomized muscles were not significantly different when analysed using Student's paired t test (one tail). In the double tenotomy and Achilles' tenotomy groups, values were within 1–3 % of controls for each bin. In the single tenotomy group there were 5 and 6 % differences in bins one and two, respectively (n.s.). When the bin data were combined for all groups, bin two had significantly fewer turns in the tenotomized condition compared with control (P < 0.05), but there were no differences in the other bins. When the amplitude data were compared between the light and dark cycles, a similar percentage of turns was found in each bin, but the total amount of activity was significantly greater in the dark cycle (P < 0.0001).
Postsurgical sampling
The time it takes for animals to recover from surgery before reliable EMG recordings can be made is uncertain, but it has been suggested that a period of 3–4 days is necessary. Therefore, recordings were started in some animals 24 h postsurgery and continued for at least 8 days. The present results did not confirm that 4 days of recovery were necessary because activity patterns starting 24 h postsurgery were no different from those started 5 days after surgery (see Fig. 10).
Figure 10. Consequences of surgical intervention on activity levels in soleus.
EMG activity was recorded in soleus for 5 days beginning 24 h after surgical implantation of electrodes (days 1–5, □), and compared with activity recordings started 4 days after recovery (days 6–10, ⋄). The means of 3 h blocks are presented as a percentage of total daily activity. No significant differences were found. There was also no significant difference between activity levels recorded during the first 5 days following tenotomy (days 1–5, ○) compared with the second 5 day period (days 6–10, ▵).
Effect of tendon reattachment on activity levels
The severed end of the tendon had already reattached itself by 5 days post-tenotomy in a sham-operated group. This was repeatedly confirmed in other groups. The reattachment was more proximal than the original site, and occurred through proliferation of collagen and connective tissue about the severed end. It was originally anticipated that recruitment would be reduced in shortened muscles, and once reattachment had occurred, activity levels would gradually increase. Recordings were started in three animals 24 h post-tenotomy and were continued for at least 2 weeks, but no effect of tendon reattachment on activity levels was found.
Selectivity of recording electrodes
Cross-talk between muscles has been reported to be a confounding problem in some studies, but we have not observed cross-talk with our methods. To determine whether the recordings from the electrode implanted on the soleus were derived from just the soleus, the soleus was denervated in two animals after control and tenotomized data had been collected. Recordings were continued for several more days and activity levels were reduced to < 10 % of pre-denervation levels (Fig. 11). The clarity of raw EMG signals is shown in Figs 3 and 4, and the absence of cross-talk in Fig. 11.
Figure 11. Absence of cross-talk between muscles.
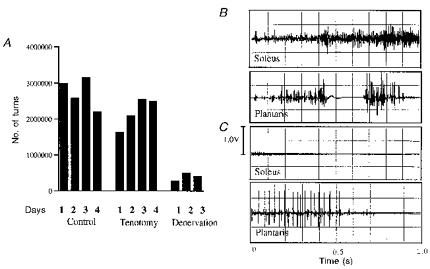
A, activity levels in soleus following denervation. To control for the possibility of cross-talk, the soleus was denervated following control and tenotomy recordings. The total number of turns was reduced to < 10 % of controls. See Discussion for explanation. B, simultaneous recordings from soleus and plantaris show no activity in plantaris when soleus was quite active. C, when plantaris was active, there was no cross-talk in soleus. These recordings were made using the same electrodes and methods as used in the present study, and are typical of our EMG studies.
Effect of tenotomy on muscle structure
Tenotomy of soleus and Achilles' tendons resulted in no degeneration and necrosis after 5 or 10 days. In contrast, tenotomy of both origins and insertions resulted in necrosis after just 5 days, which increased after 10 days. The area of necrosis was expressed as a percentage of each muscle's own cross-sectional area and represented a mean of 17 % (range, 7–38 %) and 38 % (range, 25–53 %) after 5 and 10 days, respectively. No degeneration was found in any of the sham-operated animals.
DISCUSSION
The amount of activity in a slow-twitch postural muscle is believed to be influenced by the degree of stretch imposed on it. Immobilizing a muscle in a shortened position resulted in significantly reduced activity levels (Fischback & Robbins, 1969; Hník et al. 1985). Shortening the muscle by tenotomy should therefore induce similar reductions in activity, but early experiments resulted in contradictory findings (Vrbova, 1963; McMinn & Vrbova, 1964; Nelson, 1969). The results of this study provide a comprehensive analysis of activity levels in soleus in freely moving animals, before and after the muscle had been allowed to shorten by different amounts. Shortening was induced by tenotomy of either the proximal or the distal tendons, or both. In addition, the effect of shortening of gastrocnemii on recruitment in soleus was studied by tenotomizing the Achilles' tendon. Regardless of how much the soleus shortened in the different groups (see Fig. 8) and whether just the soleus or the soleus and gastrocnemii were shortened, diurnal patterns of recruitment and total activity levels were unchanged in the tenotomized state (Fig. 6). The influence of muscle length and stretch reflex mechanisms on recruitment in a postural muscle are discussed.
EMG recording system
Turns analysis was selected as the method of quantifying the muscle activity, although it has not been traditionally used for animal studies, except in previous publications from this laboratory (Blewett & Elder, 1993; Megeney et al. 1993). It has primarily been used for human clinical studies to distinguish between myopathic and neuropathic disorders from needle electrode recordings (Willison, 1964; Nandedkar et al. 1986). It offers certain advantages over more traditional methods, such as the IEMG, because it provides specific information on the type of recruitment that has contributed to the overall EMG. A muscle increases its force of contraction by recruiting additional motor units and by increasing individual firing rates. Both result in a higher number of turns. However, in human muscles the number of turns was found to level off at around 50 % of maximal voluntary contraction (MVC) (Fuglsang-Frederiksen & Månsson, 1975). Our personal observations on human muscle, also using needle and surface electrodes, have shown similar results, except in soleus. In some sites (needle electrodes) increases in the number of turns were found up to 80 % of MVC.
Should the number of turns plateau at submaximal contractions in animal muscle, turns analysis would not be a valid technique for quantifying activity levels. There is evidence from cat (Smith et al. 1977) and rat data (Roy et al. 1991) which would suggest that the soleus reaches maximal recruitment during relatively slow speeds of movement. While the results on cats appear conclusive, the authors of the rat study failed to normalize the IEMG for changing step cycle durations at increasing speeds to a whole second of continuous activity. Therefore, the maximal amount of activity per second was not compared between conditions. Our results on rat soleus suggest that maximal activity is not reached at relatively low levels of movement, for several reasons. Had the number of turns been saturating at any level of activity, there would have been many 1 min intervals with the same number of turns. Figure 2A shows that there were very few 1 min intervals which had turns exceeding 20 000 min−1 during the light or dark cycle. During 24 h of control and tenotomy data in a different animal, very few 1 min intervals had greater than 15 000 turns min−1. Of these, no 1 min intervals had similar total numbers of turns. Had saturation been occurring, there would have been much higher percentages of daily activity in the higher activity levels (see Fig. 9), as opposed to the very small percentages observed. The fact that turns analysis was not limited in showing considerably higher numbers of turns per minute is well demonstrated in Fig. 3. The turn rate in the twelfth second reached 518 turns s−1, and in the raw EMG for the same second, it can be seen that the muscle was not fully active for anywhere near the full second. If this muscle had shown the same level of activity each second for a full minute, there would have been 31 080 turns min−1. If the muscle had been maximally active for the full twelfth second, the number of turns would have been considerably higher than 518 s−1. These high numbers of turns were never observed during either condition, because animals would not maximally recruit a muscle for a whole second, and certainly never for a whole minute. Had the muscles been more active than they were, the recording system was capable of counting higher numbers of turns, because it could accurately count 60 000 peaks of a variable amplitude sine wave with an input frequency of 1 kHz.
Selectivity of electrodes can also be a concern in this type of study because cross-talk from other muscles could influence the results. We have not found cross-talk to be a problem with our preparation. After experimental data collection was completed, the soleus was denervated in two animals, and recordings were continued for several more days. The soleus was denervated by cutting its major nerve trunk several millimetres proximal to its entry point into the mid-belly region (Fig. 1). As a result, activity levels were reduced to < 10 % of controls. While cross-talk cannot be excluded as a potential contributor to this relatively small amount of activity, the following points argue against this. Recent experiments from this laboratory have shown the presence of a proximal nerve branch entering the soleus at its origin (Fig. 1). A very weak contraction was produced when this proximal nerve was stimulated before and after cutting the main nerve trunk. Since this nerve branch was not known to us at the time of this experiment, it had not been cut. Therefore, some activity would be expected after cutting only the main trunk. Secondly, during earlier experiments from this laboratory, recordings from soleus and plantaris were made simultaneously, using exactly the same type of electrodes as in this study, and from the same location in soleus. Recruitment was observed to be muscle specific, not only when one or a few motor units were being recruited, but also during bursts of higher activity (Fig. 11B and C). For these reasons cross-talk was not thought to have influenced the results. Had cross-talk contributed to the small amount of activity found after denervation, it would have affected both the control and experimental conditions, thereby balancing out its effect.
Tenotomy effects on muscle length
Tenotomy is a better model than immobilization for studying the influence of reduced muscle stretch on recruitment, since the length of individual muscles can be altered independently of agonists and antagonists, without restraining limb movement. In this study, it caused the soleus to shorten by 9–23 %, depending on whether one or both tendons were cut. An earlier study reported the rat soleus shortened by as much as a half to two-thirds of normal length (Baker & Hall-Craggs, 1980). In the present study, shortening was maximized by freeing the soleus from adjacent tissue along its entire lateral border and from insertion to just below the main nerve trunk on the medial border. Severing the Achilles' tendon produced a similar amount of soleus shortening to that produced by the double tenotomy (Fig. 8), while preserving plantaris function for gait.
Tenotomy effects on muscle structure
Reattachment of the distal tendon to a more proximal site was consistently shown to occur in this study by 5 days post-tenotomy. Reattachment of a proximal tendon was previously reported to take between 2 and 3 weeks, and normalization of sarcomere length after tenotomy of the origin and insertion occurred by 4 weeks (Baker & Hall-Craggs, 1980).
No degeneration was found after Achilles' or distal tenotomy after 10 days in this study, but there was degeneration by 10 days following proximal and distal tenotomies. In previous studies, central cores were found in rat soleus 9 days post-Achilles' tenotomy (Shafiq et al. 1969), and muscle degeneration was found to be maximal 10 days after proximal and distal tenotomy (Baker & Hall-Craggs, 1980). Of considerable interest was the observation that the degeneration could be inhibited by cordotomy or denervation (Karpati et al. 1972). This suggests that muscle activation is required for the pathology to occur, and maintenance of normal activity levels following tenotomy would help explain the degeneration observed.
In the light of the degeneration in the double tenotomy group, it might be asked why EMG activity was not reduced. It is known that fibres belonging to single motor units in soleus are distributed across a large area of the muscle cross-section (Kugelberg, 1976), and the electrodes used could pick up the activity from most units (Blewett & Elder, 1993). Degeneration was usually seen in localized regions of the muscle, affecting only some of the fibres. Therefore, it is unlikely that there would have been a loss of individual motor units, and consequently no reason for the number of turns to have been affected.
Activity levels in control soleus
The present findings of high activity levels in soleus during the control period are based on continuous sampling, 24 h a day, and they agree with previous studies which recorded EMG chronically from soleus (Hník et al. 1978; Blewett & Elder, 1993). Activity in soleus was very predictable, showing the lowest levels at the start of the light cycle, followed by a gradual increase until shortly before the start of the dark cycle. Anticipation of the dark cycle dramatically increased activity levels, which then remained very high during the first 3 h, followed by a gradual decrease over subsequent 3 h blocks. Approximately 65 % of the total daily activity occurred during the dark cycle, which was composed of alternating periods of high and low activity, lasting between 30 and 60 min.
The high activity levels observed in rat soleus can be explained by the role that this muscle assumes for postural control to produce the torque necessary to stabilize the ankle joint during standing and walking, since its synergists are either not recruited, or recruited minimally (Smith et al. 1977). It is important to recognize that soleus motoneurones receive synaptic input from multiple sources; from sensory afferents from within the same muscle, from synergists, antagonists, spinal motoneurones and upper motoneurones (Eccles et al. 1957). The soleus also receives considerably greater convergence of synaptic input from non-postural muscles (Eccles et al. 1957). Considering the multiplicity of synaptic input to soleus from heteronymous muscles, activity in soleus could be influenced by the recruitment in these muscles (Hennig, 1987) and the state of stretch in which they are maintained. It was for this reason that the gastrocnemius was also shortened by tenotomy to determine its effect on soleus activity levels.
Effects of tenotomy on soleus activity levels
According to our original hypothesis, activity levels were expected to decrease during tenotomy because of the absence of stretch. Once the tendon had reattached and fibre length had returned to its natural state of stretch by the elimination of sarcomeres (Tabary et al. 1981), it was anticipated that activity levels would return to normal. In fact, tenotomy resulted in no changes to activity levels in soleus regardless of whether the insertion, origin and insertion or Achilles' tendon were cut. The total numbers of turns and their amplitudes during each 3 h block were unchanged from the control condition. While no previous tenotomy studies recorded EMG activity chronically as in the present study, Nelson (1969) recorded EMG for approximately 1 h per day, at a similar time of day, and reported little or no effect of tenotomy on the EMG activity in cat soleus or gastrocnemius immediately after tenotomy, and for several weeks more. However, McMinn & Vrbova (1962) and Vrbova (1963) reported significant reductions in EMG activity following tenotomy in rabbits and rats, while Karpati et al. (1972) reported reductions immediately post-tenotomy in rat soleus, and then a return towards normal levels 7–10 days after tenotomy. The results of Karpati's and Vrbova's studies were based on potential counts from oscilloscope tracings and pen recorders for brief periods. Considering the great variation in activity that can occur from minute to minute, and the reported diurnal variations in this paper, it is questionable whether such brief recording periods could accurately represent the activity levels for each condition. It is also a concern whether accurate analyses of the complex interference pattern are possible from oscilloscope tracings and pen recordings which have a low frequency response, particularly during periods of high activity when over 500 turns s−1 can occur.
Influence of muscle stretch on activity levels
Previous studies reported that immobilizing muscles at shortened lengths reduced total activity levels to 5–15 % (Fischback & Robbins, 1969) and < 10 % of controls (Hník et al. 1985). If the reduction in muscle activity was primarily due to the reduced muscle length, we would have expected tenotomy to have had a similar effect. In fact, the present study, which is the most comprehensive to date, found shortening induced by tenotomy had no effect on total activity levels. The very large decrease in muscle activity following immobilization was probably due to the joint fixation and the resulting inhibitory effect on the animal's movement. Such large decreases in activity have not been observed in muscles that had their weight-bearing role removed by hindlimb suspension (Blewett & Elder, 1993).
While it is possible that tenotomy could have influenced the behaviour of the rats, resulting in less cage movement, there are several arguments against this. The rats were able to walk with no discernible difference in gait following tenotomy. The duration of the step cycle on a treadmill at a standard speed was unchanged in two rats that were compared before and after tenotomy. Even ablating the medial and lateral gastrocnemii in a recent study in our laboratory did not affect the gait cycle at two speeds and two inclines. Therefore, the tenotomy procedure did not appear to impede animal movement. Secondly, there were distinct and repeatable diurnal patterns of activity during the light and particularly the dark cycle, which were unchanged by tenotomy (Fig. 5). Had the animals moved less after tenotomy, this would have been evident by increased periods of low activity, which were not seen (see Fig. 9). Since it is very unlikely that activity levels would increase in soleus for a given movement following tenotomy, thereby keeping activity levels the same, it is probable that movement patterns were not significantly changed.
Influence of the stretch reflex on activity levels
It was anticipated that allowing the muscle to shorten by releasing the tendon would primarily have an effect on stretch reflex mechanisms and possibly proprioceptive changes due to reduced loads. Since the early days of this century the stretch reflex has been considered to be an important factor for the maintenance of posture (Sherrington, 1910). It is influenced by the state of stretch of a muscle (Polus et al. 1991) and when fixed at a reduced length, its effect is minimized. It was originally thought that stretch reflex action should compensate for changes in external mechanical loads (Matthews, 1972), and for this to be achieved, fine control of length would be necessary to prevent load changes from affecting movements or postures (Merton, 1953). Subsequently, a number of studies showed that length was not finely regulated by segmental stretch reflexes (see Crago et al. 1976), and other supraspinal mechanisms had to be involved.
It is clear that stretch reflexes influence recruitment during sudden stretch, and the amount of recruitment is sensitive to the rate and amplitude of stretch (Davidoff, 1992), as well as the contraction level of the muscle (Toft et al. 1992). It might be extrapolated that since tenotomy had no effect on total activity levels, stretch reflexes and other proprioceptive feedback mechanisms were either unaffected, or were affected, but had little influence on the overall amount of activity in soleus. In recent years, there has been a considerable amount of data to show that proprioceptors are involved in the regulation of locomotor control. As much as 50 % of the activation of the soleus in humans (Yang et al. 1991) and triceps surae in mesencephalic cat (Severin, 1970) during walking was reported to be due to spindle afferent activity. Group Ia afferents have also been shown to activate ankle extensor motoneurones in synergists; such actions were suggested to play a role during natural movements with stretch of several muscles (McCrea et al. 1995). In addition to spindle activity, Ib afferents have also been shown to increase activation of synergists (Pearson & Collins, 1993) and to influence locomotor rhythm with increases in extensor muscle force (Conway et al. 1987). These findings, together with others reported by Pearson (1993), suggest that proprioceptive activity from Ia and Ib afferents causes increases in extensor muscle activation during walking. It is therefore plausible, although not proven, that tenotomy would reduce the level of reflex-activated recruitment during gait, and possibly other movements, which would result in reduced EMG activity. While the conclusion from this study, that total activity levels were not changed, is clear, unfortunately the methods did not allow us to determine what effect tenotomy had on reflexes during gait. The implications are that if stretch reflexes and proprioceptive feedback were reduced by tenotomizing the soleus and its large synergists, which would be anticipated, their effect on the overall aggregate activity in soleus was relatively small.
Acknowledgments
We thank Dr W. Tatton for his review of this manuscript and Mr H. Sejan for his assistance with the histological procedures. This research was funded by a grant from the Natural Science and Engineering Research Council of Canada.
References
- Alaimo MA, Smith JL, Roy RR, Edgerton VR. EMG activity of slow and fast ankle extensors following spinal cord transection. Journal of Applied Physiology. 1984;56:1608–1613. doi: 10.1152/jappl.1984.56.6.1608. 10.1063/1.334145. [DOI] [PubMed] [Google Scholar]
- Baker JH, Hall-Craggs ECB. Recovery from central core degeneration of the tenotomized rat soleus muscle. Muscle and Nerve. 1980;3:151–159. doi: 10.1002/mus.880030208. [DOI] [PubMed] [Google Scholar]
- Berardelli A, Hallett M, Kaufman C, Fine E, Berenberg W, Simon SR. Stretch reflexes of triceps surae in normal man. Journal of Neurology, Neurosurgery and Psychiatry. 1982;4:513–525. doi: 10.1136/jnnp.45.6.513. [DOI] [PMC free article] [PubMed] [Google Scholar]
- Blewett C, Elder GCB. Quantitative EMG analysis in soleus and plantaris during hindlimb suspension and recovery. Journal of Applied Physiology. 1993;74:2057–2066. doi: 10.1152/jappl.1993.74.5.2057. [DOI] [PubMed] [Google Scholar]
- Conway BA, Hultborn H, Kiehn O. Proprioceptive input resets central locomotor rhythm in the spinal cat. Experimental Brain Research. 1987;68:643–656. doi: 10.1007/BF00249807. [DOI] [PubMed] [Google Scholar]
- Crago PE, Houk JC, Hasan Z. Regulatory actions of human stretch reflex. Journal of Neurophysiology. 1976;39:925–935. doi: 10.1152/jn.1976.39.5.925. [DOI] [PubMed] [Google Scholar]
- Davidoff RA. Skeletal muscle tone and the misunderstood stretch reflex. Neurology. 1992;42:951–963. doi: 10.1212/wnl.42.5.951. [DOI] [PubMed] [Google Scholar]
- Eccles JC, Eccles RM, Lundberg A. The convergence of monosynaptic excitatory afferents on to many different species of alpha motoneurones. The Journal of Physiology. 1957;137:22–50. doi: 10.1113/jphysiol.1957.sp005794. [DOI] [PMC free article] [PubMed] [Google Scholar]
- Fischbach GD, Robbins N. Changes in contractile properties of disused soleus muscles. The Journal of Physiology. 1969;201:305–320. doi: 10.1113/jphysiol.1969.sp008757. [DOI] [PMC free article] [PubMed] [Google Scholar]
- Fudema JJ, Fizzell JA, Nelson EM. Electromyography of experimentally immobilized skeletal muscles in cats. American Journal of Physiology. 1961;200:963–967. doi: 10.1152/ajplegacy.1961.200.5.963. [DOI] [PubMed] [Google Scholar]
- Fuglsang-Frederiksen A, Månsson A. Analysis of electrical activity of normal muscle in man at different degrees of voluntary effort. Journal of Neurology, Neurosurgery and Psychiatry. 1975;38:683–694. doi: 10.1136/jnnp.38.7.683. [DOI] [PMC free article] [PubMed] [Google Scholar]
- Hennig R. Section of fibular nerve affects activity pattern and contractile properties of soleus motor units in adult rats. Acta Physiologica Scandinavica. 1987;130:143–151. doi: 10.1111/j.1748-1716.1987.tb08120.x. [DOI] [PubMed] [Google Scholar]
- Hennig R, Lømo T. Firing patterns of motor units in normal rats. Nature. 1985;314:164–166. doi: 10.1038/314164a0. [DOI] [PubMed] [Google Scholar]
- Hník P, Kasicki S, Afelt Z, Vejsada R, Krekule I. Chronic polyelectromyography in awake, unrestrained animals. Physiologia Bohemoslovaca. 1978;27:485–492. [PubMed] [Google Scholar]
- Hník P, Vejsada R, Goldspink DF, Krekule I. Quantitative evaluation of electromyogram activity in rat extensor and flexor muscles immobilized at different lengths. Experimental Neurology. 1985;88:515–528. doi: 10.1016/0014-4886(85)90067-6. 10.1016/0014-4886(85)90067-6. [DOI] [PubMed] [Google Scholar]
- Hník P, Vejsada R, Kasicki S. Reflex and locomotor changes following unilateral deafferentation of rat hind limb assessed by chronic electromyography. Neuroscience. 1981;6:195–203. doi: 10.1016/0306-4522(81)90055-5. 10.1016/0306-4522(81)90055-5. [DOI] [PubMed] [Google Scholar]
- Karpati G, Carpenter S, Eisen A. Experimental core-like lesions and nemaline rods. A correlative, morphological and physiological study. Archives of Neurology. 1972;27:237–251. doi: 10.1001/archneur.1972.00490150045008. [DOI] [PubMed] [Google Scholar]
- Kugelberg E. Adaptive transformation of rat soleus motor units during growth. Journal of Applied Physiology. 1976;63:533–539. doi: 10.1016/0022-510x(76)90001-0. [DOI] [PubMed] [Google Scholar]
- Levin MF, Feldman AG. The role of stretch reflex threshold regulation in normal and impaired motor control. Brain Research. 1994;657:23–30. doi: 10.1016/0006-8993(94)90949-0. 10.1016/0006-8993(94)90949-0. [DOI] [PubMed] [Google Scholar]
- Liddell EGT, Sherrington CS. Reflexes in response to stretch (myotatic reflexes) Proceedings of the Royal Society B. 1924;96:212–242. [Google Scholar]
- McCrea DA, Shefchyk SJ, Stephens MJ, Pearson KG. Disynaptic group I excitation of synergist ankle extensor motoneurones during fictive locomotion in the cat. The Journal of Physiology. 1995;487:527–539. doi: 10.1113/jphysiol.1995.sp020897. [DOI] [PMC free article] [PubMed] [Google Scholar]
- McMinn RMH, Vrbova G. The effect of tenotomy on the structure of fast and slow muscle in the rabbit. Quarterly Journal of Experimental Physiology. 1964;49:424–429. doi: 10.1113/expphysiol.1964.sp001748. [DOI] [PubMed] [Google Scholar]
- Matthews PBC. Mammalian Muscle Receptors and their Central Actions. Baltimore: Williams & Wilkins; 1972. pp. 546–606. [Google Scholar]
- Megeney LA, Neufer PD, Dohm GL, Tan MH, Blewett CA, Elder GCB, Bonen A. Effects of muscle activity and fiber composition on glucose transport and GLUT4. American Journal of Physiology. 1993;264:E583–593. doi: 10.1152/ajpendo.1993.264.4.E583. [DOI] [PubMed] [Google Scholar]
- Merton PA. The Spinal Cord. Ciba Foundation Symposium. Wiley Chichester; 1953. Speculations on the servo-control of movement; pp. 247–260. [Google Scholar]
- Nandedkar SD, Sanders DB, Stalberg EV. Simulation and analysis of the electromyographic interference pattern in normal muscle. Part 1. Turns and amplitude measurements. Muscle and Nerve. 1986;9:423–430. doi: 10.1002/mus.880090507. [DOI] [PubMed] [Google Scholar]
- Nelson PG. Functional consequences of tenotomy in hind limb muscles of the cat. The Journal of Physiology. 1969;201:321–333. doi: 10.1113/jphysiol.1969.sp008758. [DOI] [PMC free article] [PubMed] [Google Scholar]
- Pearson KG. Common principles of motor control in vertebrates and invertebrates. Annual Review of Neuroscience. 1993;14:265–297. doi: 10.1146/annurev.ne.16.030193.001405. 10.1146/annurev.ne.16.030193.001405. [DOI] [PubMed] [Google Scholar]
- Pearson KG, Collins DF. Reversal of the influence of group Ib afferents from plantaris on activity in medial gastrocnemius muscle during locomotor activity. Journal of Neurophysiology. 1993;70:1009–1017. doi: 10.1152/jn.1993.70.3.1009. [DOI] [PubMed] [Google Scholar]
- Polus BI, Patak A, Gregory JE, Proske U. Effect of muscle length on phasic stretch reflexes in humans and cats. Journal of Neurophysiology. 1991;66:613–622. doi: 10.1152/jn.1991.66.2.613. [DOI] [PubMed] [Google Scholar]
- Roy RR, Hutchison DL, Pierotti DJ, Hodgson JA, Edgerton VR. EMG patterns of rat ankle extensors and flexors during treadmill locomotion and swimming. Journal of Applied Physiology. 1991;70:2522–2529. doi: 10.1152/jappl.1991.70.6.2522. [DOI] [PubMed] [Google Scholar]
- Severin FV. The role of gamma motor system in the activation of the extensor alpha-motoneurones during controlled locomotion. Biophysics. 1970;15:1138–1145. [PubMed] [Google Scholar]
- Shafiq SA, Gorycki MA, Asiedu SA, Milhorat AT. Tenotomy effect on the fine structure of the soleus of the rat. Archives of Neurology. 1969;20:625–633. doi: 10.1001/archneur.1969.00480120071006. [DOI] [PubMed] [Google Scholar]
- Sherrington CS. Flexion-reflex of the limb, crossed extension-reflex, and reflex stepping and standing. The Journal of Physiology. 1910;40:28–121. doi: 10.1113/jphysiol.1910.sp001362. [DOI] [PMC free article] [PubMed] [Google Scholar]
- Smith JL, Edgerton VR, Betts B, Collatos TC. EMG of slow and fast ankle extensors of cat during posture, locomotion and jumping. Journal of Neurophysiology. 1977;40:503–513. doi: 10.1152/jn.1977.40.3.503. [DOI] [PubMed] [Google Scholar]
- Swett JC, Eldred E. Distribution and numbers of stretch receptors in medial gastrocnemius and soleus muscles of the cat. Anatomical Record. 1960;137:453–460. doi: 10.1002/ar.1091370405. [DOI] [PubMed] [Google Scholar]
- Tabary JC, Tardieu C, Tardieu G, Tabary C. Experimental rapid sarcomere loss with concomitant hypoextensibility. Muscle and Nerve. 1981;4:198–203. doi: 10.1002/mus.880040305. [DOI] [PubMed] [Google Scholar]
- Toft E, Sinkjaer T, Andreassen S, Larsen K. Mechanical and electromyographic responses to stretch of the human ankle extensors. Journal of Neurophysiology. 1991;65:1402–1410. doi: 10.1152/jn.1991.65.6.1402. [DOI] [PubMed] [Google Scholar]
- Vrbova G. Changes in the motor reflexes produced by tenotomy. The Journal of Physiology. 1963;166:241–250. doi: 10.1113/jphysiol.1963.sp007103. [DOI] [PMC free article] [PubMed] [Google Scholar]
- Weiss PL, Kearney RE, Hunter IW. Position dependence of stretch reflex dynamics at the human ankle. Experimental Brain Research. 1986;63:49–59. doi: 10.1007/BF00235645. [DOI] [PubMed] [Google Scholar]
- Willison RG. Analysis of electrical activity in healthy and dystrophic muscle in man. Journal of Neurology, Neurosurgery and Psychiatry. 1964;27:386–394. doi: 10.1136/jnnp.27.5.386. [DOI] [PMC free article] [PubMed] [Google Scholar]
- Yang JF, Stein RB, James KB. Contribution of peripheral afferents to the activation of the soleus muscle during walking in humans. Brain Research. 1991;87:679–687. doi: 10.1007/BF00227094. [DOI] [PubMed] [Google Scholar]