Abstract
The initial respiratory and cardiac responses to cold water immersion are thought to be responsible for a significant number of open water deaths each year. Previous research has demonstrated that the magnitude of these responses can be reduced by repeated immersions in cold waterwhether the site of habituation is central or peripheral.
Two groups of subjects undertook two 3 min head-out immersions in stirred water at 10 °C of the right-hand side of the body (R). Between these two immersions (3 whole days) the control group (n = 7) were not exposed to cold water, but the habituation group (n = 8) undertook a further six 3 min head-out immersions in stirred water at 10 °C of the left-hand side of the body (L).
Repeated L immersions reduced (P < 0.01) the heart rate, respiratory frequency and volume responses. During the second R immersion a reduction (P < 0.05) in the magnitude of the responses evoked was seen in the habituation group but not in the control group, despite both groups having identical skin temperature profiles.
It is concluded that the mechanisms involved in producing habituation of the initial responses are located more centrally than the peripheral receptors.
Sudden stimulation of the peripheral cutaneous cold receptors on immersion in cold water initiates the potentially hazardous physiological responses collectively known as the ‘cold shock response’ (Tipton, 1989). This includes a reflex inspiratory gasp followed by a short period of uncontrollable hyperventilation and tachycardia (Keatinge & Evans, 1961). The associated reduction in maximum breath hold time and loss of voluntary control over breathing during this time increases the chances of aspirating water and thus drowning (Tipton, 1989). For individuals with underlying heart or circulatory pathology, the increased cardiac work load associated with the tachycardia and cold-induced vasoconstriction may result in a cardiovascular accident leading to incapacitation and drowning.
Thus, the responses represent a threat to both healthy and unhealthy individuals and are probably responsible for the majority of the 400–1000 deaths which occur in open water each year in the UK (Royal Society for the Prevention of Accidents, 1988; Tipton, 1989).
The magnitude of the ‘cold shock response’ can be attenuated by providing suitable protective clothing which reduces the cold stimulus (Tipton et al. 1990). However, providing such protection is not always practical as the level of insulation required can result in heat stress during normal working procedures. It is known that an adaptation to immersion in cold water can be developed following repeated exposures (Keatinge & Evans, 1961; Golden & Tipton, 1988). The mechanism of this adaptation is, as yet, unclear but it appears to take the form of an habituation. The results of work with animals (Glaser & Griffin, 1962) suggest that alterations in central rather than peripheral sites are responsible for habituation of cold shock tachycardia. There is, however, little evidence in humans to confirm or refute this hypothesis.
The present study was designed to investigate whether the habituation of the ‘cold shock response’ is primarily the result of alterations occurring centrally or peripherally at the cold receptors. If central mechanisms are involved, then repeated immersion of one side of the body should reduce the response evoked by immersion of the other side of the body.
METHODS
The experimental protocol was approved by a local ethics committee. Fifteen healthy volunteers (11 male, 4 female) aged 18–32 years participated in the experiment after giving informed written consent in accordance with the code of ethics of the World Medical Association. None of the subjects had been exposed to cold in the previous 2 years or participated in winter sports.
The subjects were randomly assigned to two groups, a control (CON) group (5 men, 2 women), and an habituation (HAB) group (6 men, 2 women). Each subject undertook two 3 min head-out immersions in stirred water at 10°C with only the right side of the body (right of the mid-saggital line, R) being immersed. These immersions took place at the same time of day with 3 whole days separating the two immersions. During this period the CON group were not further exposed to cold water, but the HAB group undertook a 3 min head-out immersion in stirred water at 10°C of the left side of the body (left of the mid-saggital line, L) each morning and afternoon (total of six immersions). Subjects wore a swimming costume and a modified wet-suit (5 mm closed cell neoprene) which covered the half of the body which was not immersed in the water.
Before immersion, baseline data were collected for 3 min with the subjects lying at rest on their side in a modified wire basket stretcher. The stretcher was then suspended 5 cm above the water surface for 1 min before being lowered into the water to the level of the mid-saggital line at a rate of 0.2 m s−1 using an electric winch. Throughout the immersions the subjects were instructed to relax and breathe freely.
Inspiratory minute volume (V̇I), respiratory frequency (fR) and tidal volume (VT) were measured throughout the experiment using a pneumotachograph and integrator unit (P. K. Morgan, Kent, UK) placed on the inspiratory side of the respiratory tubing. Heart rate (HR) was monitored continuously from a hard wire 3-lead electrocardiogram (Diascope 1, Vickers Medical Kent, UK). HR, V̇I, VT and fR were recorded on a pen recorder (Gould Series 2600S recorder, OH, USA) and computer using CED Spike2 software (Cambridge Electronic Design Ltd, Cambridge, UK).
Skin temperature (Tsk) was measured using skin thermistors (Grants Instruments Ltd, Cambridge, UK) attached to the skin with adhesive tape at four sites: right chest, left chest, right thigh and left thigh. These temperatures were recorded every 10 s throughout the immersions on a data logger (Squirrel data logger, Grants Instruments, Cambridge, UK). Mean skin temperature (Tsk) for each side of the body was calculated from the mean of the corresponding thigh and chest temperatures.
Data were analysed between the two subject groups (CON and HAB) using a repeated measures mathematical model which included linear additive terms for group and immersion occasion effects, and the interaction between these two factors. The Scheffé method of contrasts was employed to investigate the contrast of means within the HAB group. As there appeared to be a biphasic response to each immersion (from 0 to 30 s and from 30 to 180 s), the results were analysed for these two time periods.
All data are expressed as the arithmetic mean and, where appropriate, the standard error of the difference of the means (s.e.d.) is given. Respiratory volumes are expressed at BTPS (body temperature and pressure when saturated with water vapour).
RESULTS
The mean (±s.d.) physical characteristics of the two groups of subjects were similar (CON: age 25.9 ± 3.5 years; height 1.76 ± 0.08 m; mass 75.9 ± 6.7 kg. HAB: age 27.1 ± 5.0 years; height 1.79 ± 0.13 m; mass 87 ± 18 kg). The mean (±s.d.) temperature of the water during the immersions was 9.88 ± 0.03°C with an air temperature of 20.12 ± 0.87°C.
Skin temperatures
During the pre-immersion periods in air the Tsk of the side of the body covered by the wet suit material was higher than the uncovered side. The immersed side of the body approached water temperature by the end of the 3 min immersions whilst the then un-immersed, covered side of the body remained unchanged. The Tsk profile during the R immersions did not differ between the two groups.
Respiratory frequency
On the first R immersion, fR increased in the first 30 s compared with pre-immersion values. This elevation in response was reduced over the remaining 2.5 min of immersion but still remained above pre-immersion values.
With repeated L immersions the HAB group demonstrated a reduction (P < 0.01) in the fR response during both the first 30 s and last 2.5 min of immersion (Fig. 1A and B). During the second R immersion (4 days later), the fR in the first 30 s and last 2.5 min of immersion was significantly reduced in the HAB group (P < 0.05) but not in the CON group when compared to the first R immersion (Table 1, Fig. 1A and B).
Figure 1. Mean respiratory frequency during immersion.
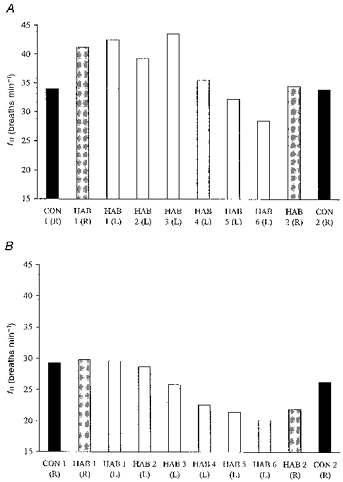
Mean respiratory frequency for the HAB and CON groups during the first 30 s (A) and the last 2.5 min (B) of immersion in water at 10 °C. R, right side immersed; L, left side immersed.
Table 1.
Responses of the HAB and CON groups to immersion of the right side of the body in water at 10°C
| HAB group | CON group | |||||
|---|---|---|---|---|---|---|
| First (R) | Last (R) | s.e.d. | First (R) | Last (R) | s.e.d. | |
| fR (breaths min−1) | ||||||
| 0–30 s | 41.3 | 34.5 | 2.1* | 34.0 | 34.0 | 2.3 |
| (24–72) | (18–74) | (24–40) | (16–42) | |||
| 30–180 s | 29.8 | 22.0 | 1.9* | 29.3 | 26.3 | 2.3 |
| (14.4–46.8) | (11.4–35.4) | (15.0–36.6) | (7.8–33.6) | |||
| V̇1 (l min−1) | ||||||
| 0–30 s | 50.7 | 39.1 | 3.8* | 41.2 | 39.5 | 4.1 |
| (32.0–73.0) | (22.2–71.6) | (32.6–50.8) | (30.0–57.6) | |||
| 30–180 s | 36.6 | 21.8 | 2.8* | 30.0 | 25.9 | 3.0 |
| (19.1–67.0) | (14.0–67.0) | (20.9–52.0) | (10.1–50.8) | |||
| HR (beats min−1) | ||||||
| 0–30 s | 97.5 | 83.6 | 7.5 | 82.6 | 84.0 | 8.0 |
| (66–140) | (76–94) | (72–102) | (62–94) | |||
| 30–180 s | 92.3 | 75.2 | 5.1* | 79.8 | 83.9 | 5.5 |
| (64.8–117.6) | (60.6–84.6) | (67.2–97.8) | (71.4–100.2) | |||
Values represent the mean for each variable over the two time periods 0–30 s and 30–180 s; the range is given in parentheses. The standard error of the difference of the means(s.e.d.) between the two immersions is also given.
Significance at the 5% level.
In Fig. 2, the fR responses recorded during the last R and L immersions are expressed as a percentage of the corresponding responses recorded during the first immersions. The last immersion (2nd) of the CON group elicited a fR response which averaged 91% of that seen during the first immersion. The response to the last R and L immersions of the HAB group averaged 79 and 71% of the first R and L immersions, respectively; these reductions did not differ significantly, but were greater (P < 0.05) than those seen with the CON group. The absolute fR responses recorded during the last L and last R immersions also did not differ significantly.
Figure 2. Comparison of mean frequency responses.
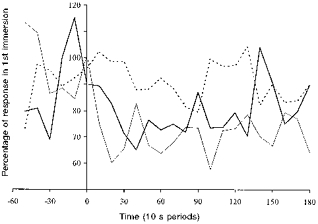
Mean respiratory frequency responses for the HAB and CON groups during their last immersion compared with those elicited in their first immersion in water at 10 °C. Dashed line: CON group, 1st vs. 2nd R immersion. Thick continuous line: HAB group, 1st vs. 2nd R immersion. Thin continuous line: HAB group, 1st vs. 6th L immersion.
Inspiratory minute volume
The V̇I responses corresponded with those obtained for fR. In the first 30 s of the first R immersion, V̇I increased above baseline values in both groups; this elevation of V̇I was maintained for the remaining 2.5 min of immersion albeit at a lower level.
With repeated L immersions, the HAB group demonstrated a reduction in the V̇I response in the first 30 s and in the remaining 2.5 min (P < 0.01 first compared with sixth immersion; Fig. 3A and B). During the second R immersion (3 days later), the V̇I values in the first 30 s and last 2.5 min of immersion were significantly reduced in the HAB group (P < 0.05) but not in the CON group when compared with the first R immersion (Table 1, Fig. 3A and B).
Figure 3. Mean inspiratory minute volume during immersion.
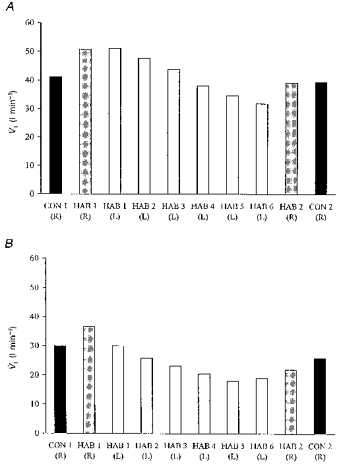
Mean inspiratory minute volume for the HAB and CON groups during the first 30 s (A) and the last 2.5 min (B) of immersion in water at 10 °C. R, right side immersed; L, left side immersed.
In Fig. 4, the V̇I responses recorded during the last R and L immersions are expressed as a percentage of the corresponding responses recorded during the first immersions. The last immersion (2nd) of the CON group elicited an V̇I response which averaged 88% of that seen during the first immersion. The V̇I response to both the last R and L immersions of the HAB group averaged 66% of the first R and L immersions; these reductions did not differ significantly, but were greater than those seen with the CON group. The absolute V̇I responses recorded during the last L and last R immersions did not differ significantly.
Figure 4. Comparison of mean inspiratory minute volume.
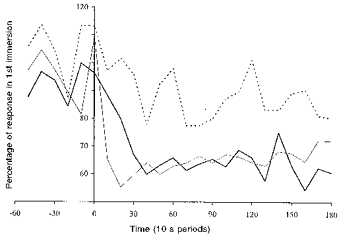
Mean inspiratory minute volume responses for the HAB and CON groups during their last immersion compared with those elicited in their first immersion in water at 10 °C. Dashed line: CON group, 1st vs. 2nd R immersion. Thick continuous line: HAB group, 1st vs. 2nd R immersion. Thin continuous line: HAB group, 1st vs. 6th L immersion.
Tidal volume
In the first R immersion, average VT values for the CON and HAB groups were increased from pre-immersion values of 0.68 and 0.93 l to 1.29 and 1.31 l, respectively, over the first 30 s. The VT remained elevated throughout the remainder of the immersions, averaging 1.08 l in the CON immersions and 1.33 l in the HAB immersions.
With repeated L immersions the HAB group showed an attenuation (P < 0.01) in the VT response over the last 2.5 min (Fig. 5) but not during the first 30 s. During the last compared with the first R immersions the VT response in the first 30 s of immersion was not reduced in either group. Over the remaining 2.5 min, VT was reduced significantly in the HAB, but not the CON group (P < 0.05, Fig. 5).
Figure 5. Mean tidal volume during immersion.
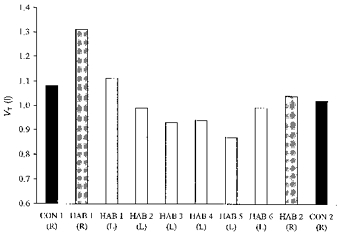
Mean tidal volume for the HAB and CON groups during the last 2.5 min of immersion in water at 10 °C. R, right side immersed; L, left side immersed.
Heart rate
In the first 30 s of the first R immersion, HR increased slightly in both groups, and fell towards the pre-immersion values in the remaining 2.5 min.
With repeated L immersions, the HAB group demonstrated a reduction in the HR response over both time periods (P < 0.01, Fig. 6A and B).
Figure 6. Mean heart rate during immersion.
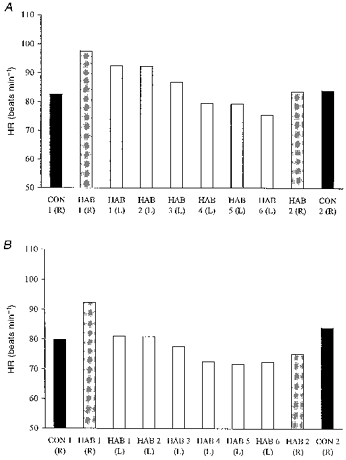
Mean heart rate for the HAB and CON groups during the first 30 s (A) and the last 2.5 min (B) of immersion in water at 10 °C. R, right side immersed; L, left side immersed.
On the second R immersion, the increase in HR in the first 30 s of immersion was not significantly reduced in either group (Fig. 6A). Over the remaining 2.5 min, HR was reduced in the HAB, but not the CON group (Table 1, Fig. 6B, P < 0.05).
In Fig. 7 the HR responses recorded during the last R and L immersions are expressed as a percentage of the corresponding responses recorded during the first immersions. The last immersion (2nd) of the CON group elicited a HR response which averaged 106% of that seen during the first immersion. The response to the last R and L immersions of the HAB group averaged 85 and 89% of the first R and L immersions, respectively; these reductions did not differ significantly, but were greater than those seen with the CON group. The absolute HR responses recorded during the last L and last R immersions also did not differ significantly.
Figure 7. Comparison of mean heart rate response.
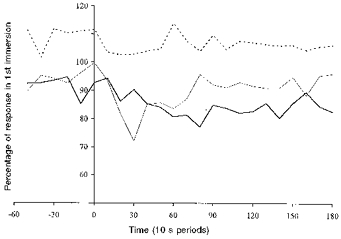
Mean heart rate responses for the HAB and CON groups during their last immersion compared with those elicited in their first immersion in water at 10 °C. Dashed line: CON group, 1st vs. 2nd R immersion. Thick continuous line: HAB group, 1st vs. 2nd R immersion. Thin continuous line: HAB group, 1st vs. 6th L immersion.
DISCUSSION
The results of the present study show that it is possible to produce an habituation of the initial responses to cold immersion elicited from a region of the body surface without repeatedly exposing that region to a cold stimulus. The attenuation of the initial responses observed during the second immersion of the right-hand side of the body of the HAB group must have been produced by the repeated immersions of the left side of the body of this group, as a comparable response was not seen between the two corresponding immersions of the CON group. Furthermore, the reduction in the responses could not be attributed to a reduction in the stimulus, as the skin temperature profiles did not differ between groups.
Although none of the subjects had been exposed to cold in the previous 2 years, the initial responses on immersion were numerically larger in the HAB than in the CON group during the first R immersions. The responses of the CON group were, however, still large enough to have enabled the demonstration of an habituation, had one occurred. The difference between the groups is an artifact of the small subject numbers and can be attributed to one individual in the HAB group who had an especially large cardio-respiratory response to immersion. There is typically a large variation between individuals in the magnitude of the responses seen on immersion in cold water (Table 1); this variation provides part of the rationale for the use of a within-subject design in studies such as the present one.
The rapidity with which the responses occur on immersion suggest that they are initiated by neurogenic pathways rather than circulating hormones. Our results suggest that the mechanism responsible for the habituation observed in the present study primarily involves the nervous system, more specifically central pathways rather than the cutaneous cold receptors. This is supported by the finding that the degree of habituation measured in the HAB group during the second (last) immersion of the right side of the body did not differ significantly from that seen during the sixth (last) immersion of the left side of the body.
The suggestion that habituation is primarily a central rather than peripheral process is consistent with studies in which animal models have been employed. Evidence against the involvement of peripheral receptors in the process of long-term habituation include: electrophysiological studies in which the tails of rats were repeatedly immersed in water at 4°C and no adaptation in cold receptor firing rate was observed (Griffin & Witt, 1964); and the work of Hensel & Banet (1978) who reported no changes in the static and dynamic characteristics of cold receptors in the nasal area of cats kept for 2 months at a room temperature of 5°C.
The precise location and nature of the alterations causing habituation are poorly understood. Clearly, for afferent information from one body region to influence the responses evoked from another, the adaptive changes must occur after the convergence of afferent thermal information from the periphery. Such convergence from contralateral trunk and leg skin receptors may occur at the level of the spinal cord, but is more likely to occur at higher centres.
Whilst work with cats has suggested that the reflex respiratory responses to cold are mediated at midbrain level, and the cerebrum is not essential for the response (Keatinge & Nadel, 1965), studies by Glaser & Griffin (1962) have demonstrated that the frontal areas of the cerebral cortex are involved in the habituation process in rats. Studies with leucotomized patients have indicated the frontal cortex is involved in the habituation process in humans (Griffin, 1963). The inhibition of habituation by the administration of chlorpromazine also suggests a central process for adaptation (Glaser et al. 1959).
It is concluded that the results of the present study support the hypothesis that the majority of the adaptive changes that result in the habituation of the initial responses to cold water immersion occur centrally rather than peripherally. This introduces the possibility of inducing a potentially protective habituation by exposing only a limited region of the skin surface to cold.
Acknowledgments
The authors wish to thank all the subjects who participated in the study and Dr Colin Higenbottam, Dr Roger Pethybridge and Mr John Groom for their expert assistance. This study was funded by the MoD under DERA Procedural Arrangement No. RTB018QA/2 and the University of Surrey.
References
- Glaser EM, Griffin JP. Influence of the cerebral cortex on habituation. The Journal of Physiology. 1962;160:429–445. doi: 10.1113/jphysiol.1962.sp006857. [DOI] [PMC free article] [PubMed] [Google Scholar]
- Glaser EM, Hall MS, Whittow GC. Habituation to heating and cooling of the same hand. The Journal of Physiology. 1959;146:152–164. doi: 10.1113/jphysiol.1959.sp006185. [DOI] [PMC free article] [PubMed] [Google Scholar]
- Golden FS, Tipton MJ. Human adaptation to repeated cold immersions. The Journal of Physiology. 1988;396:349–363. doi: 10.1113/jphysiol.1988.sp016965. [DOI] [PMC free article] [PubMed] [Google Scholar]
- Griffin JP. The role of the frontal areas of the cortex upon habituation in man. Clinical Science. 1963;24:127–134. [PubMed] [Google Scholar]
- Griffin JP, Witt I. Cutaneous afferent C-fibre activity to repeated strong thermal stimuli in rats. In: Dill DB, Adolph EF, Wilber CG, editors. Handbook of Physiology, section 4, Adaptation to the Environment. Washington DC: American Physiological Society; 1964. p. p.59. [Google Scholar]
- Hensel H, Banet M. Thermoreceptor activity, insulative and metabolic changes in cold and warm adapted cats. In: Houdas Y, Guieu JD, editors. New Trends in Thermal Physiology. Masson, Paris: 1978. pp. 53–55. [Google Scholar]
- Keatinge WR, Evans M. The respiratory and cardiovascular response to immersion in cold and warm water. Quarterly Journal of Experimental Physiology. 1961;46:83–94. doi: 10.1113/expphysiol.1961.sp001519. [DOI] [PubMed] [Google Scholar]
- Keatinge WR, Nadel JA. Immediate respiratory responses to sudden cooling of the skin. Journal of Applied Physiology. 1965;20:65–69. doi: 10.1152/jappl.1965.20.1.65. [DOI] [PubMed] [Google Scholar]
- Royal Society for the Prevention of Accidents. Drownings in the UK 1987. Birmingham: RoSPA; 1988. [Google Scholar]
- Tipton MJ. The initial responses to cold-water immersion in man. Clinical Science. 1989;77:581–588. doi: 10.1042/cs0770581. [DOI] [PubMed] [Google Scholar]
- Tipton MJ, Stubbs DA, Elliott DH. The effect of clothing on the initial responses to cold water immersion in man. Journal of the Royal Naval Medical Service. 1990;76:89–95. [PubMed] [Google Scholar]


