

Abstract
Two early signs of human myoblast commitment to fusion are membrane potential hyperpolarization and concomitant expression of a non-inactivating delayed rectifier K+ current, IK(NI). This current closely resembles the outward K+ current elicited by rat ether-à-go-go (r-eag) channels in its range of potential for activation and unitary conductance.
It is shown that activation kinetics of IK(NI), like those of r-eag, depend on holding potential and on [Mg2+]o, and that IK(NI), like r-eag, is reversibly inhibited by a rise in [Ca2+].
Forced expression of an isolated human ether-à-go-go K+ channel (h-eag) cDNA in undifferentiated myoblasts generates single-channel and whole-cell currents with remarkable similarity to IK(NI).
h-eag current (Ih-eag) is reversibly inhibited by a rise in [Ca2+]i, and the activation kinetics depend on holding potential and [Mg2+]o.
Forced expression of h-eag hyperpolarizes undifferentiated myoblasts from −9 to −50 mV, the threshold for the activation of both Ih-eag and IK(NI). Similarly, the higher the density of IK(NI), the more hyperpolarized the resting potential of fusion-competent myoblasts.
It is concluded that h-eag constitutes the channel underlying IK(NI) and that it contributes to the hyperpolarization of fusion-competent myoblasts. To our knowledge, this is the first demonstration of a physiological role for a mammalian eag K+ channel.
The skeletal muscle fibre is a postmitotic multinucleated cell formed by the fusion of mononucleated myoblasts. Myoblast fusion is essential to skeletal muscle development and repair, and understanding this process is important for myoblast-based grafts or gene therapies. Our recent work on human fusion-competent myoblasts indicates that an early step in the fusion process is a hyperpolarization of the resting potential. This hyperpolarization is a two-step mechanism involving the sequential expression of two voltage-gated potassium currents. The first is a non-inactivating delayed rectifier current (IK(NI)) that hyperpolarizes the cell to an intermediate resting potential of approximately −32 mV (Bernheim et al. 1996). Then, slightly before fusion, an inward rectifier current is expressed (IK(IR)), which drives the potential further down to approximately −65 mV, i.e. similar to that measured for multinucleated myotubes (Liu et al. 1998).
We recently isolated the full-length coding region of a human ether-à-go-go K+ channel (h-eag) from myoblasts undergoing differentiation (Occhiodoro et al. 1998). We describe here the properties of the current elicited by h-eag and present data indicating that it constitutes the K(NI) channel responsible for the first hyperpolarization step linked to myoblast differentiation.
METHODS
Dissociation and cell cultures
Samples of human skeletal muscle were obtained during corrective orthopaedic surgery of young patients (9 months to 17 years old) without any known neuromuscular disease, in accordance with the guidelines of the ethical committee of the University Hospital of Geneva (written informed consent was obtained from patients or their legal guardians). Myoblasts (Baroffio et al. 1993) and fusion-competent myoblasts (Krause et al. 1995) were prepared as described. The differentiation-promoting medium consists of Dulbecco's modified Eagle's medium (DMEM, Gibco) supplemented with 0.5 mg ml−1 bovine serum albumin, 10 ng ml−1 epidermal growth factor, 10 μg ml−1 insulin and 1 μg ml−1 gentamicin.
h-eag expression in human myoblasts and COS-7 cells
Transfections of human proliferating myoblasts with a bicistronic h-eag-Green Fluorescent Protein (GFP) vector are described elsewhere (Occhiodoro et al. 1998). Electrophysiological recordings were made in cells labelled with GFP 36–48 h after transfection. Controls were mock-transfected using the same vector but devoid of the h-eag first cistron.
Electrophysiology
Whole-cell and single-channel (outside-out) configurations of the patch-clamp technique (Hamill et al. 1981) were used as described (Bernheim et al. 1996). Leak current subtraction procedures are discussed in the figure legends.
Whole-cell recording
Extracellular solution contained (mm): 100 N-methyl-d-glucamine chloride (NMG-Cl), 5 KCl, 3 MgCl2, 5 Hepes, 50 NaOH, 50 acetic acid, and 8 glucose. The pH was adjusted to 7.4 with NMG. Intracellular (pipette) solution contained (mm): 110 KCl, 5 NaCl, 1 MgCl2, 5 Hepes, 20 BAPTA and 5 glucose. The pH was adjusted to 7.4 with KOH.
Single-channel recording
Extracellular solution contained (mm): 50 NaOH, 50 acetic acid, 100 NMG-Cl, 5 KCl, 3 MgCl2, 5 Hepes, 0.5 CaCl2 and 0.03 nifedipine. The pH was adjusted to 7.4 with NMG. Intracellular (pipette) solution contained (mm): 70 KCl, 80 KF, 4 NaCl, 1 MgCl2, 5 Hepes and 10 BAPTA. The pH was adjusted to 7.4 with KOH.
Chemicals
Hepes was obtained from Sigma, and BAPTA and NMG were from Fluka.
Intracellular free Ca2+ measurements
Intracellular free Ca2+ was measured using fura-2 (Molecular Probes, Inc., Eugene, OR, USA) and an Attofluor RatioVision recording system (Atto Instruments Inc., Rockville, MD, USA). Myoblasts were pre-incubated for 30 min (light protected) at room temperature (20–22°C) in a solution (mm: 150 NaCl, 5 KCl, 5 CaCl2, 2 MgCl2, 5 Hepes and 8 glucose) containing 1 μm fura-2 AM, then rinsed three times, and incubated for 20 min (light protected) at 37°C to allow hydrolysis of fura-2 AM. Intracellular free Ca2+ (and simultaneous electrophysiological) measurements were performed at 20–22°C with a pipette solution composed of (mm): 140 KCl, 5 NaCl, 1 MgCl2, 10 Hepes, 5 glucose, 0.1 BAPTA and 50 μm fura-2. The pH was adjusted to 7.3 with KOH. Intracellular free Ca2+ was calculated using the equation:
where R is the ratio of the two fluorescence intensities (340 nm/380 nm excitation light), and K* is a constant that defines the calibration curve near resting [Ca2+]i. Rmin was measured after dialysis of myoblasts with a solution containing (mm): 110 KCl, 5 NaCl, 2 MgCl2, 10 Hepes, 5 glucose, 30 BAPTA and 50 μm fura-2; pH 7.3. From three recordings, Rmin was 0.06 ± 0.02. Rmax was estimated by dialysing the myoblasts with the standard BAPTA (0.1 mm), fura-2 (50 μm) pipette solution and then lysing the myoblasts with a −150 mV potential step. Rmax was 1.5, the highest of three measurements. K* was measured by dialysing the myoblasts with a pipette solution containing 105 nm free [Ca2+]i (mm: 105 KCl, 7 NaCl, 2 MgCl2, 20 Hepes, 0.5 glucose, 20 BAPTA, 6.5 CaCl2 and 50 μm fura-2; pH 7.3). From five measurements, K* was 1270 ± 258 nm.
Statistics
All data are expressed as means ±s.e.m.
RESULTS
IK(NI) recorded in human fusion-competent myoblasts closely resembles r-eag current
When human myoblasts are transferred to differentiation-promoting medium, they rapidly express a voltage-gated non-inactivating outward potassium current (IK(NI); Bernheim et al. 1996). This current shares many characteristics with the rat ether-à-go-go (r-eag) potassium current (Ludwig et al. 1994; Stansfeld et al. 1996; Terlau et al. 1996), and with currents elicited by the b-eag channels recently isolated from bovine retina (Frings et al. 1998). The kinetics of activation of the r-eag current are influenced by the holding potential: hyperpolarization slows down the kinetics of activation whereas depolarization accelerates them (Ludwig et al. 1994). Another property is that [Mg2+]o slows the activation of this current (Terlau et al. 1996).
Figure 1A illustrates the effect on IK(NI) of holding potential and [Mg2+]o. A fusion-competent myoblast was held at various potentials for 200 ms and then stepped to +40 mV. In nine cells, the half-maximum amplitude of IK(NI) (I1/2, see inset) was reached in 76 ± 5 ms and 6 ± 1 ms when the myoblast was stepped from −140 and −60 mV, respectively. Removal of extracellular Mg2+ accelerated IK(NI) activation about 10-fold (Fig. 1B). I1/2 was reached in 8 ± 1 and 1 ± 0.3 ms when the myoblast was stepped from −140 and −60 mV, respectively (n = 7).
Figure 1. Modulation of IK(NI) by voltage, [Mg2+]o and [Ca2+]i.

A, whole-cell current was recorded from a fusion-competent myoblast after 2 days in differentiation medium. Cell was held at −80 mV (steady-state potential), then stepped to potentials ranging between −60 and −140 mV for 200 ms before the final step to the test potential (+40 mV). Recordings were made in a bath medium containing 3 mm Mg2+ and in the presence of 30 μm nifedipine and 2 μm 4-aminopyridine to block other K+ currents. Leak current was estimated in presence of 90 mm TEA and 5 mm Ba2+, and subtracted. Cell capacitance was 12 pF. The relationship between the half-activation time course (I1/2) and the prepulses are illustrated in the inset, in which symbols indicate the means from nine cells and were connected by straight lines. B, recordings from the same cell as in A. Conditions were the same as in A except that Mg2+ was removed from the bath medium; inset, symbols represent the means from seven cells and were connected by straight lines. C, voltage protocol used in A and B. D, simultaneous recordings of whole-cell current during steady state holding at +40 mV (top panel) and [Ca2+]i (lower panel). The fusion-competent myoblast (2 days in differentiation medium) was held at +40 mV for 3 min prior to data acquisition and perfused with extracellular medium containing 3 mm TEA to block large conductance calcium-activated K+ channels (Hamann et al. 1994). Ionomycin (0.5 μm) was added to the extracellular medium and perfused as indicated (horizontal bar). Leak current was estimated by linear extrapolation from the current-voltage relationship from −90 to −60 mV, and subtracted. [Ca2+]i was determined using fura-2. Inset, outward current at +40 mV plotted against [Ca2+]i, during the recovery phase. The continuous line is a Hill equation with IC50 of 144 nm and a Hill coefficient (nH) of 4.5. In five cells, IC50 and nH were 135 ± 28 nm and 3.6 ± 0.3, respectively.
Another characteristic of r-eag current is its blockade by an elevation of [Ca2+]i (Stansfeld et al. 1996). Using the calcium ionophore ionomycin (0.5 μm) to increase [Ca2+]i, a drastic reduction of IK(NI) was demonstrated (Fig. 1D) by monitoring [Ca2+]i with fura-2 and IK(NI) amplitude at +40 mV (the inset in Fig. 1D shows IK(NI) as a function of [Ca2+]i).
These electrophysiological resemblances of IK(NI) to r-eag current led us to search for a human eag homologue in a cDNA library made from mRNA of myoblasts undergoing differentiation (Occhiodoro et al. 1998). The isolated clone encodes an eag protein of 962 amino acids showing 97 % overall amino acid identity with the rat eag protein, confirming its identity as human eag.
Properties of h-eag current recorded in h-eag-transfected undifferentiated myoblasts
A bicistronic h-eag-GFP vector was constructed by inserting the h-eag sequence upstream of an internal ribosomal entry site (Jang et al. 1989) followed by the sequence encoding GFP (Chalfie et al. 1994). h-eag was overexpressed in undifferentiated myoblasts, which do not express active K(NI) channels, or only at a very low density (Bernheim et al. 1996). As a control, COS-7 cells, which do not express endogenous K(NI) channels, were transfected in parallel and results on currents elicited by h-eag in COS-7 cells were identical to those obtained with transfected myoblasts (data not shown).
Figure 2 illustrates whole-cell and single-channel characteristics of the outward current (Ih-eag) recorded in transfected undifferentiated myoblasts. This current resembles IK(NI) observed in fusion-competent myoblasts (Bernheim et al. 1996), except for its larger amplitude. A whole-cell outward current of the amplitude shown in Fig. 2A (inset) was never observed in untransfected myoblasts, nor in mock-transfected cells or myoblasts transfected with an identical vector expressing an inward rectifier potassium channel in place of h-eag (data not shown). The mean conductance at +40 mV in h-eag-transfected myoblasts is approximately 100 times larger than currents occasionally observed in some undifferentiated myoblasts expressing a very low density of IK(NI).
Figure 2. Properties of h-eag current in transfected human undifferentiated myoblasts.
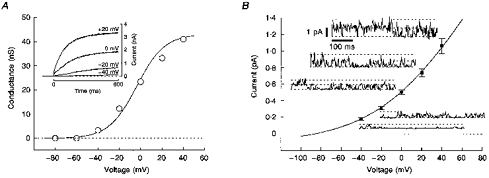
A, recordings were performed in cells labelled with GFP 48 h after transfection of undifferentiated myoblasts with the bicistronic h-eag-GFP vector. Whole-cell outward currents were measured at the end of 600 ms steps and leak current subtracted. The leak current was determined in presence of 90 mm TEA and 5 mm Ba2+. Steady-state conductances were plotted against step potentials and were well described by a Boltzmann equation. Cell capacitance was 24 pF. Inset, voltage-dependent activation of h-eag channels at different voltage steps. B, membrane patches (outside-out) were excised from undifferentiated myoblasts transfected with the h-eag-GFP vector. Symbols (▪) represent the mean single-channel amplitudes obtained from all-points amplitude histograms computed from current traces at potentials between −40 and +40 mV (n = 4). Examples of single-channel recordings are shown for each potential. The continuous line is fitted using the Goldman-Hodgkin-Katz equation.
Like IK(NI), Ih-eag activates above −50 mV (Fig. 2A) and does not inactivate during sustained depolarization (data not shown). The steady-state conductances were calculated by dividing Ih-eag measured during various voltage steps (see Fig. 2A, inset) by the driving force on potassium ions (EK=−78 mV). The steady-state conductance can be described by a Boltzmann equation (Fig. 2A):
where Vm is the membrane potential, G∞,max is the maximum conductance, Q is the gating charge, Vo is the voltage of half-activation, k is the Boltzmann constant and T is the temperature. Results in ten h-eag-transfected myoblasts were: Q = 1.55± 0.03 elementary charge, Vo=−4.1 ± 2.1 mV, and G∞,max= 1401 ± 365 pS pF−1. Except for G∞,max, which is about ten times larger than for IK(NI) in fusion-competent cells, reflecting a high level of h-eag expression in transfected cells, these results are similar to those obtained for IK(NI) recorded in fifteen fusion-competent myoblasts (Bernheim et al. 1996).
Outside-out patch recordings were made in h-eag-transfected myoblasts in order to compare unitary Ih-eag with unitary IK(NI) (Fig. 2B). Non-inactivating K+ channels were looked for at potentials between −40 and +40 mV. Ca2+-dependent potassium channels (Hamann et al. 1994) were blocked by 10 mm BAPTA in the pipette, and nifedipine was added to block delayed rectifier K+ channels (30 μm; Bernheim et al. 1996). Figure 2B represents the mean amplitudes of unitary Ih-eag obtained from four patches and plotted against voltage, with sample recordings at each voltage. A Goldman-Hodgkin-Katz (GHK) equation (Hille, 1992) was used to fit the data points. The GHK equation was adjusted with the single-channel permeability coefficient as the only free parameter ([K+]i and [K+]o were 150 mm and 5 mm, respectively). The quality of the fit indicates that unitary Ih-eag is carried by K+ ions (single-channel permeability coefficient is 3.7 × 10⁻¹⁴ cm3 s−1). The elementary conductance of the channel at +40 mV is 8.4 ± 0.7 pS (EK=−86 mV). The unitary conductance and the single-channel permeability coefficient of Ih-eag are identical to those reported previously for IK(NI) (Bernheim et al. 1996).
h-eag current is modulated by voltage, [Mg2+]o and [Ca2+]i
Figure 3A illustrates that hyperpolarizing a h-eag-transfected myoblast for 200 ms before stepping to +40 mV slows Ih-eag activation kinetics, as seen with IK(NI). In the presence of 3 mm[Mg2+]o, the half-maximum amplitude of Ih-eag (I1/2, Fig. 3A, inset) was reached in 58.2 ± 5.2 ms and 3.5 ± 0.5 ms when the myoblast was stepped from −140 and −60 mV, respectively (n = 4). As for IK(NI), removing extracellular Mg2+ accelerated Ih-eag activation (Fig. 3B), with I1/2 reached in 4.2 ± 1.8 ms and 1.5 ± 0.2 ms, when the myoblast was stepped from −140 and −60 mV, respectively (n = 4; Fig. 3B, inset).
Figure 3. Modulation of h-eagpotassium channels by voltage, [Mg2+]o and [Ca2+]i.

A and B, whole-cell outward currents were recorded from an undifferentiated myoblast 48 h after transfection with h-eag-GFP. Data were acquired either in the presence (A) or absence (B) of 3 mm Mg2+. All recordings were performed in the same conditions as for IK(NI), with 30 μm nifedipine and 2 μm 4-aminopyridine added to the bath medium. Leak current was estimated in presence of 90 mm TEA and 5 mm Ba2+, and subtracted. Cell capacitance was 17 pF. Insets, half-activation time course (I1/2) of Ih-eag were plotted against the prepulses. Symbols are the means from four cells and were connected by straight lines. C, voltage protocol used in A and B. D, effect of a rise of [Ca2+]i on Ih-eag recorded from a h-eag-transfected undifferentiated myoblast. The cell was steadily held at −80 mV and then stepped to +40 mV for 400 ms. Ionomycin (0.5 μm) was added to the bath medium and perfused as indicated (horizontal bar). Current amplitudes were measured at the end of 400 ms steps and not corrected for leak current. Cell capacitance was 50 pF. Inset, current traces recorded before (▪), during (♦), and after (*) ionomycin application.
Like IK(NI) (Fig. 1D), Ih-eag was inhibited by an increase in [Ca2+]i induced by application of 0.5 μm ionomycin (Fig. 3D). Short duration (400 ms) steps to +40 mV every 10 s were preferred to the sustained holding at +40 mV used for IK(NI) (Fig. 1D) due to the magnitude of the current that mobilized a substantial fraction of the intracellular potassium ions present. Figure 3D (inset) shows Ih-eag current traces before, during and after the ionomycin application.
Therefore, with respect to current activation, kinetics of activation-deactivation, unitary conductance and modulation by Mg2+ and Ca2+, the properties of the h-eag current elicited in transfected cells are strikingly similar to those of IK(NI) recorded in fusion-competent myoblasts.
IK(NI), Ih-eag and myoblast membrane resting potential
We have previously suggested that IK(NI) plays a role in setting the resting potential of fusion-competent myoblasts to approximately −32 mV (Bernheim et al. 1996). However, no specific blocker of this current is yet available that can firmly establish this relationship. A IK(NI)-linked hyperpolarization of fusion-competent myoblasts is supported by the analysis presented in Fig. 4A, which shows the relationship between IK(NI) density and resting potential, determined in 134 fusion-competent myoblasts. Myoblast resting potentials ranging between −4 and −45 mV were distributed in five bins of 10 mV, and the corresponding IK(NI) density was plotted for each bin. It can be seen that a larger hyperpolarization corresponds to a larger IK(NI) density, as is expected for a resting potential linked to IK(NI) expression.
Figure 4. IK(NI), Ih-eag and membrane resting potential of myoblasts.

A, whole-cell IK(NI) and resting membrane potentials were measured in fusion-competent myoblasts after 2–3 days in differentiation medium. IK(NI) was measured at +40 mV. Resting membrane potentials were determined in current-clamp mode. Symbols represent the means of current density and resting potential of the indicated number of cells. The dotted line was drawn by eye. B, ▵ represents the means of Ih-eag density and resting potential measured from h-eag-transfected undifferentiated myoblasts, 48 h after transfection. Ih-eag was measured at +40 mV. Parallel measurements were performed on undifferentiated myoblasts that were mock-transfected and ▴ (error bars are not apparent because they are smaller than symbol) represents the means of the resting membrane potential and IK(NI) density.
According to the results presented in Fig. 4A, forcing undifferentiated myoblasts to overexpress h-eag should result in a resting potential even more hyperpolarized than that of fusion-competent myoblasts, as the activation zone of the current begins near −50 mV (Fig. 2). Figure 4B shows that, due to the high density of Ih-eag (142 ± 29 pA pF−1, n = 10), the resting potential of h-eag-transfected undifferentiated myoblasts is, indeed, more hyperpolarized (−51 ± 5 mV, n = 10) than fusion-competent myoblasts, and is close to the potential at which Ih-eag activates. As a control, we tested undifferentiated myoblasts that were mock-transfected. These cells had resting membrane potentials (−9 ± 1 mV, n = 9) identical to non-transfected undifferentiated myoblasts (−8 ± 1 mV, n = 218; Hamann et al. 1994).
DISCUSSION
Human myoblast fusion is preceded by major changes in membrane electrical properties. We have recently shown that an initial hyperpolarization of the resting potential is associated with the expression of a non-inactivating delayed rectifier outward potassium current, IK(NI) (Bernheim et al. 1996). The IK(NI) expressed by fusion-competent myoblasts closely resembles the non-inactivating outward K+ current elicited by r-eag channels in its range of potentials for activation, kinetics of activation-deactivation, and unitary conductance (Ludwig et al. 1994; Stansfeld et al. 1996; Terlau et al. 1996). Furthermore, as was demonstrated here, the activation kinetics of IK(NI), like those of r-eag, depend on the holding potential and on [Mg2+]o, and IK(NI) is reversibly inhibited by a rise in [Ca2+]i. These properties of IK(NI), all shared with r-eag, prompted us to search for an eag homologue in human myoblasts undergoing differentiation and led to the isolation of the complete coding sequence of h-eag (Occhiodoro et al. 1998).
h-eag constitutes the K(NI) channel expressed in fusion-competent myoblasts
Expression of the human eag sequence produces a functional non-inactivating delayed rectifier potassium channel. The electrophysiological properties of Ih-eag were analysed in undifferentiated myoblasts transfected with a h-eag expression vector, and were found to be indistinguishable from those of the endogenous IK(NI) expressed in fusion-competent myoblasts, except for G∞,max, which simply reflects overexpression of the channel.
Single-channel recordings of Ih-eag demonstrate that K+ is the carrier and that the elementary conductance of Ih-eag is identical to that of IK(NI) (Bernheim et al. 1996). Moreover, the holding potential and [Mg2+]o both influence the activation kinetics of Ih-eag, and a provoked increase in [Ca2+]i blocks Ih-eag. Thus electrophysiological analyses of Ih-eag suggest that h-eag is the molecular entity constituting the endogenous K(NI) channel expressed at the onset of human myoblast fusion.
IK(NI), Ih-eag and myoblast membrane resting potential
When human myoblasts are induced to differentiate, their resting potential rapidly drops from about −8 mV to approximately −32 mV. Data presented here confirm that this hyperpolarization is due to the sudden increase in IK(NI). Analysis of current density versus resting potential of fusion-competent myoblasts demonstrates that the higher the current density, the more hyperpolarized the cell. As current density increases, the resting potential clearly moves towards the range of potentials at which K(NI) channels activate, indicating that the balance between IK(NI) and leak current (estimated reversal potential near 0 mV; Bernheim et al. 1996) is in favour of IK(NI). The fact that the resting potential of undifferentiating myoblasts forced to overexpress Ih-eag reaches a value (−51 ± 5 mV; n = 10) near the threshold for Ih-eag activation further strengthens our assumption that the first hyperpolarization step observed at the onset of myoblast commitment to fusion is due to the expression of h-eag channels.
The resting potential of proliferating cells, in general, is depolarized, while more negative potentials have been observed to be associated with differentiation and cell-cycle arrest (Binggeli & Weinstein, 1986). This has raised the hypothesis that the G1-S transition may be inhibited by highly negative values of membrane potential (Binggeli & Weinstein, 1986; Day et al. 1993; Arcangeli et al. 1995). Observations that r-eag currents heterologously expressed in Xenopus oocytes are suppressed by mitosis-promoting factor (Brüggemann et al. 1997) and that an eag current expressed in the human neuroblastoma SH-SY5Y cell line is down-regulated when the cells are blocked in the G0/1 phase by exposure to retinoic acid (Meyer & Heinemann, 1998) suggest that eag channel activity may be linked to the cell-cycle. In human myoblasts, evolution of the resting potential towards hyperpolarized values following h-eag/IK(NI) expression, coincides with cell-cycle arrest, and appears to be an important event to favour their commitment to the differentiation pathway.
Acknowledgments
We thank M. Berti and P. Brawand for their excellent technical assistance on cell cultures, and Dr A. Kaelin for providing the muscle biopsies. This work was supported by grants from the Fonds National Suisse pour la Recherche Scientifique (no. 31–43′597.95 and 31–46′893.96), the Fondation Suisse pour la Recherche sur les Maladies Musculaires, and the Sir Jules Thorn Overseas Trust.
References
- Arcangeli A, Bianchi L, Becchetti A, Faravelli L, Coronnello M, Mini E, Olivotto M, Wanke E. A novel inward-rectifying K+ current with a cell-cycle dependence governs the resting potential of mammalian neuroblastoma cells. The Journal of Physiology. 1995;489:455–471. doi: 10.1113/jphysiol.1995.sp021065. [DOI] [PMC free article] [PubMed] [Google Scholar]
- Baroffio A, Aubry JP, Kaelin A, Krause RM, Hamann M, Bader CR. Purification of human muscle satellite cells by flow cytometry. Muscle and Nerve. 1993;16:498–505. doi: 10.1002/mus.880160511. [DOI] [PubMed] [Google Scholar]
- Bernheim L, Liu J-H, Hamann M, Haenggeli CA, Fischer-Lougheed J, Bader CR. Contribution of a non-inactivating potassium current to the resting potential of fusion-competent human myoblasts. The Journal of Physiology. 1996;493:129–141. doi: 10.1113/jphysiol.1996.sp021369. [DOI] [PMC free article] [PubMed] [Google Scholar]
- Binggeli R, Weinstein RC. Membrane potentials and sodium channels: hypotheses for growth regulation and cancer formation based on changes in sodium channels and gap junctions. Journal of Theoretical Biology. 1986;123:377–401. doi: 10.1016/s0022-5193(86)80209-0. [DOI] [PubMed] [Google Scholar]
- Brüggemann A, Stühmer W, Pardo LA. Mitosis-promoting factor-mediated suppression of a cloned delayed rectifier potassium channel expressed in Xenopus oocytes. Proceedings of the National Academy of Sciences of the USA. 1997;94:537–542. doi: 10.1073/pnas.94.2.537. [DOI] [PMC free article] [PubMed] [Google Scholar]
- Chalfie M, Tu Y, Euskirchen G, Ward WW, Prasher DC. Green fluorescent protein as a marker for gene expression. Science. 1994;263:802–805. doi: 10.1126/science.8303295. [DOI] [PubMed] [Google Scholar]
- Day ML, Pickering SJ, Johnson MH, Cook DI. Cell-cycle control of a large-conductance K+ channel in mouse early embryos. Nature. 1993;365:560–562. doi: 10.1038/365560a0. 10.1038/365560a0. [DOI] [PubMed] [Google Scholar]
- Frings S, Brüll N, Dzeja C, Angele A, Hagen V, Kaupp UB, Baumann A. Characterization of ether-à-go-go channels present in photoreceptors reveals similarity to IKx, a K+ current in rod inner segments. Journal of General Physiology. 1998;111:583–599. doi: 10.1085/jgp.111.4.583. 10.1085/jgp.111.4.583. [DOI] [PMC free article] [PubMed] [Google Scholar]
- Hamann M, Widmer H, Baroffio A, Aubry JP, Krause RM, Kaelin A, Bader CR. Sodium and potassium currents in freshly isolated and in proliferating human muscle satellite cells. The Journal of Physiology. 1994;475:305–317. doi: 10.1113/jphysiol.1994.sp020071. [DOI] [PMC free article] [PubMed] [Google Scholar]
- Hamill OP, Marty A, Neher E, Sakamann B, Sigworth FJ. Improved patch-clamp techniques for high-resolution current recording from cells and cell-free membrane patches. Pflügers Archiv. 1981;391:85–100. doi: 10.1007/BF00656997. [DOI] [PubMed] [Google Scholar]
- Hille B. Ionic Channels of Excitable Membranes. Sunderland, MA 01375, USA: Sinauer Associates; 1992. [Google Scholar]
- Jang SK, Davies MV, Kaufman RJ, Wimmer E. Initiation of protein synthesis by internal entry of ribosomes into the 5′ non-translated region of encephalomyocarditis virus RNA in vivo. Journal of Virology. 1989;63:1651–1660. doi: 10.1128/jvi.63.4.1651-1660.1989. [DOI] [PMC free article] [PubMed] [Google Scholar]
- Krause RM, Hamann M, Bader CR, Liu JH, Baroffio A, Bernheim L. Activation of nicotinic acetylcholine receptors increases the rate of fusion of cultured human myoblasts. The Journal of Physiology. 1995;489:779–790. doi: 10.1113/jphysiol.1995.sp021091. [DOI] [PMC free article] [PubMed] [Google Scholar]
- Liu J-H, Bijlenga P, Fischer-Lougheed J, Occhiodoro T, Kaelin A, Bader CR, Bernheim L. Role of an inward rectifier K+ current and of hyperpolarization in human myoblast fusion. The Journal of Physiology. 1998;510:467–476. doi: 10.1111/j.1469-7793.1998.467bk.x. [DOI] [PMC free article] [PubMed] [Google Scholar]
- Ludwig J, Terlau H, Wunder F, Brüggemann A, Pardo LA, Marquardt A, Stühmer W, Pongs O. Functional expression of a rat homologue of the voltage gated ether-à-go-go potassium channel reveals differences in selectivity and activation kinetics between the Drosophila channel and its mammalian counterpart. EMBO Journal. 1994;13:4451–4458. doi: 10.1002/j.1460-2075.1994.tb06767.x. [DOI] [PMC free article] [PubMed] [Google Scholar]
- Meyer R, Heinemann SH. Characterization of an eag-like potassium channel in human neuroblastoma cells. The Journal of Physiology. 1998;508:49–56. doi: 10.1111/j.1469-7793.1998.049br.x. [DOI] [PMC free article] [PubMed] [Google Scholar]
- Occhiodoro T, Bernheim L, Liu J-H, Bijlenga P, Sinnreich M, Bader CR, Fischer-Lougheed J. Cloning of a human ether-à-go-go potassium channel expressed in myoblasts at the onset of fusion. FEBS Letters. 1998 doi: 10.1016/s0014-5793(98)00973-9. (in the Press) [DOI] [PubMed] [Google Scholar]
- Stansfeld CE, Röper J, Ludwig J, Weseloh RM, Marsh SJ, Brown DA, Pongs O. Elevation of intracellular calcium by muscarinic receptor activation induces a block of voltage-activated rat ether-à-go-go channels in a stably transfected cell line. Proceedings of the National Academy of Sciences of the USA. 1996;93:9910–9914. doi: 10.1073/pnas.93.18.9910. [DOI] [PMC free article] [PubMed] [Google Scholar]
- Terlau H, Ludwig J, Steffan R, Pongs O, Stühmer W, Heinemann SH. Extracellular Mg2+ regulates activation of rat eag potassium channel. Pflügers Archiv. 1996;432:301–312. doi: 10.1007/s004240050137. [DOI] [PubMed] [Google Scholar]