

Abstract
Confocal laser scanning microscopy was used to visualize intercellular transmission of Ca2+ waves in intact rat ventricular trabeculae micro-injected with the calcium indicator fluo-3.
Ca2+ waves usually failed to be transmitted from cell to cell. At identified individual end-to-end cell contacts, successful transmission interspersed with failure, which sometimes occurred despite an apparent small spritz of Ca2+ between cells. The probability of cell to cell transmission (Ptran) was 0.13.
Ca2+ waves arose preferentially near junctions of connected cells, where connexin-43 was found, but randomly in enzymatically disconnected heart cells.
β-Adrenergic stimulation significantly increased Ptran (to 0.22) and heptanol, an uncoupler of gap junction channels, significantly decreased it (to 0.045).
In regions of high [Ca2+]i due to damage, wave frequency decreased markedly with each cell-cell junction passed.
The Ca2+ permeability of cardiac gap junctions may be regulated, and the low ability of cardiac gap junctions to transmit Ca2+ may help control the spread of Ca2+ from damaged regions.
In many biological tissues, waves of Ca2+ release are a normal mechanism of cellular signalling (Jaffe, 1993; Rooney & Thomas, 1993). In cardiac tissue, however, Ca2+ waves are believed not to be important in cellular communication, but rather to provide a mechanism for the removal of Ca2+ from the cell, once Ca2+ in the sarcoplasmic reticulum (SR) has reached a critical level (Diaz et al. 1997). Such ‘Ca2+ overload’ has been linked to cardiac dysfunction both in humans and in animal models of heart failure (Gwathmey et al. 1987), and removal of Ca2+ from the cell generates a depolarizing electric current (via Na+−Ca2+ exchange), which may be important in certain (‘triggered’) cardiac arrhythmias (January & Fozzard, 1988). Nevertheless, the behaviour of Ca2+ waves in intact cardiac tissue, where arrhythmias and other cell interactions can occur (as opposed to isolated cardiac myocytes), has been difficult to investigate because of the limitations of applying confocal laser scanning microscopy (CLSM) to thick (i.e. intact) specimens. In the present study, we utilized objective lenses appropriate for thick aqueous specimens (Brenner, 1994) and CLSM to image Ca2+ waves with higher spatial resolution in intact rat ventricular trabeculae than has been accomplished previously in intact rat heart (Minamikawa et al. 1997). We found, contrary to expectation, that Ca2+ waves almost never propagate immediately between cells contacting each other end to end, despite the demonstrated presence of connexin-43, the major cardiac isoform of the gap-junction protein (Peters, 1996), at these locations. Furthermore, they arise preferentially at the ends of cells, rather than at random locations, and decrease in frequency with distance from regions containing high [Ca2+]i.
METHODS
Trabeculae from the atrio-ventricular border of the right ventricle of rats (Lewos Brown Norway F1, 6–8 weeks old) were obtained as described originally by ter Keurs et al. (1980). Animals were killed by cervical dislocation. The heart was excised and retrogradely perfused with standard perfusate (see below); additional KCl was added to the solution (increasing the [KCl] by 20 mm) to render the hearts quiescent. The trabeculae used were approximately 2000 μm in length, less than 150 μm wide, and 60–75 μm thick. After isolation, the muscles were placed in a recording chamber and perfused with a physiological salt-containing solution composed of (mmol l−1): 120 NaCl, 5 KCl, 1.2 MgCl2, 1.0 CaCl2, 27.0 NaHCO3, 10 glucose; gassed with 95 % O2−5 % CO2; pH 7.4; bath temperature, 21–37°C. Trabeculae had to be mounted in the chamber in such a way that the region to be studied was as close as possible to the bottom of the chamber, which was a glass coverslip. The trabeculae were suspended in the recording chamber between a force transducer (type AE801, Mikro-Elektronikk, Horten, Norway) and via the tricuspid valve to a length adjustment device (micromanipulator). The semiconductor strain gauge force transducer was also mounted on a micromanipulator. The muscles were stimulated by pulses delivered through platinum wires fixed to the sides of the bath, parallel to the long axis of the muscle. Muscles were stimulated at 0.2 Hz with pulses of 4 ms duration and 20 % above threshold. Muscle length was set so that passive force was 5 % of peak twitch force. Sarcomere length was 2.2 μm. Muscles were allowed to recover under these standard conditions for sufficient time (30 to 45 min) to develop normal function. None of the muscles showed after-contractions, spontaneous twitches, or triggered arrhythmias.
Trabeculae were loaded with fluo-3 (pentapotassium salt, Molecular Probes) by iontophoresis (Backx & ter Keurs, 1993) after impalement with a microelectrode (250–300 MΩ when filled with 1 mmol l−1 fluo-3). In these muscles, resting membrane potentials were typically −75 mV. Hyperpolarizing iontophoretic current of 2 nA was applied for 10–20 min. Impalements were made at three or four sites along the length of the muscle. The muscle was then remounted with the injected face of the muscle closest to the objective. The muscle was stimulated for about 1 h after loading to allow the dye to spread throughout the muscle. The confocal microscope consisted of a Bio-Rad MRC 600 imaging system connected to a Nikon Diaphot microscope and imaged with a Nikon CFN Plan Apochromat × 60 water immersion objective (NA 1.2). This objective has a working distance of 220 μm (above 170 μm of coverslip glass). Images were stored in a computer at 4 frames s−1 through the use of a video-capture board (DT3152, Data Translation, Marlborough, MA, USA). Images were analysed using Interactive Data Language (Research Systems, Inc., Boulder, CO, USA).
We localized connexin-43 in fixed preparations by immunofluorescently labelling with a monoclonal antibody against rat connexin-43. The muscles were mounted as described above; they were then perfused for about 10 min in a solution containing (mmol l−1): 10 K2EGTA, 15 Na2-phosphocreatine, 5 Na2ATP, 7 MgCl3, 100 KCl; adjusted to pH 7.00 with KOH. The bath was then flushed with the fixative: 1 % paraformaldehyde, 150 mmol l−1 cyclohexylamine, 20 mmol l−1 EGTA, 20 mmol l−1 MgCl2, 20 mmol l−1 Pipes, pH 6.5; it was allowed to stand for 1 h. The muscle was removed from the mounting and permeabilized in 0.5 % Brij-58, prepared in the same fixative, for 30 min. The samples were washed with a solution of 75 mmol l−1 Tris, 10 mmol l−1 MgCl2, 10 mmol l−1 NaN3 (pH 7.4) and cooled to 4°C. Non-specific binding was blocked with 0.1 % BSA and 0.5 % Brij-58 in 500 mmol l−1 Tris, 10 mmol l−1 MgCl2, 10 mmol l−1 NaN3 (pH 7.4), and the samples were incubated overnight with a monoclonal antibody specific for connexin-43 (Transduction Laboratories, Lexington, KY, USA), diluted to 5 μg ml−1 in the same buffer. The samples were washed and incubated overnight with fluoresceinated goat anti-mouse IgG antibodies, and examined with a Zeiss LSM410 confocal microscope. Brij-58, isoproterenol (isoprenaline) and heptanol were obtained from Sigma.
RESULTS
Study of the propagation of Ca2+ waves from cell to cell required the independent determination of cell borders, the localization of gap-junctional proteins (connexin-43) in our preparations, and proof that these gap junctions were functional. After microinjection of one cell with the Ca2+-indicator fluo-3, cell borders were readily visible in confocal images (Fig. 1A) as different cells contained significantly different amounts of fluo-3. Fluo-3 spread farther longitudinally than transversely, consistent with relatively slow diffusion through gap junctions, which are largely confined to the ends of the cells (80 % of total gap junctions) (Hoyt et al. 1989), and the geometry of the elongated cells. The distribution of fluo-3 in our preparations, as a function of time after microinjection, was roughly consistent with a diffusion coefficient of 21 μm2 s−1 (Zhang et al. 1996). It is known that heptanol reduces the permeability of gap-junction channels (Takens-Kwak et al. 1992) as well as the intercellular diffusion coefficient of dyes of a similar molecular weight to fluo-3 (viz. fura-2), supporting the idea that fluo-3 moves through these channels. We localized the predominant gap junction protein (Peters, 1996), connexin-43, in fixed preparations (Luther & Bloch, 1989) by immunofluorescence labelling with a monoclonal antibody against rat connexin-43. In longitudinal confocal views (Fig. 1B) connexin-43 was present abundantly in a punctate pattern, similar to that reported previously (Hoyt et al. 1989). Projection views showed that the connexin-43 was in fact organized into clusters, probably reflecting gap junctions at the abutments between cells on the so-called ‘plicate’ segments (Hoyt et al. 1989). The observed distributions of fluo-3 and of connexin-43 indicate that gap junctions were present and functional.
Figure 1. Confocal visualization of connexin-43, cell-cell junctions and Ca2+ waves in rat heart muscle.
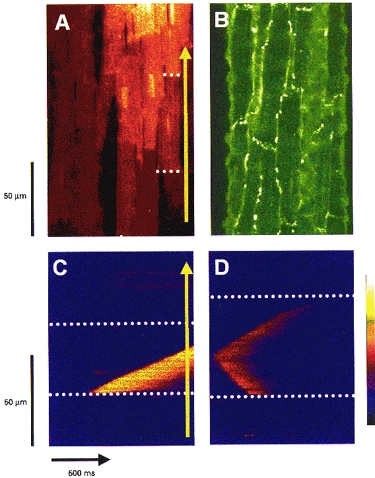
A, a confocal image of a rat ventricular trabecula immediately after injection with the calcium indicator fluo-3. The marked fluorescence gradient from cell to cell reflects the diffusion of fluo-3 away from the injected site. The dotted white lines indicate examples of cell-cell junctions, and the yellow arrow indicates the direction of laser scanning in the line scan images (C and D). B, the immunofluorescent localization of connexin-43 in a different trabecula from that illustrated in A. C, a line scan image of a wave and a spark in a trabecula at 24 °C with [Ca2+]o of 1 mm. The wave arose at the bottom edge of the cell and propagated away at a constant velocity of ∼67 μm s−1. D, line scan images of a wave in a trabecula at 35 °C. The bathing [Ca2+]o for this preparation was increased to 2 mm to increase wave frequency. The wave originated near the centre of the cell and propagated away from the initiation site at ∼100 μm s−1. The colour bar indicates the assignment of colour to the fluorescence ratio (F/F0) in the images, from dark purple (0.0) through blue, red, orange, yellow to white (6.0).
The Ca2+ waves illustrated in Fig. 1C and D are representative of events often observed with fast one-dimensional confocal imaging (viz. 2 ms line scans) at 21°C (Fig. 1C) and 35°C (Fig. 1D). In the example at lower temperature, one spontaneous Ca2+ spark occurred and a spontaneous wave arose at the end of a cell and propagated at a constant velocity (67 μm s−1) towards the other end of the cell. Inhomogeneities along its leading edge reflect the sequential activation of Ca2+ release sites (Wier et al. 1997). These images are similar to those obtained previously from single isolated cells (Wier et al. 1987; Takamatsu & Wier, 1990; Wussling & Salz, 1996). The striking, and unexpected, observation in multi-cellular preparations was the apparent failure of the Ca2+ wave to appear in the adjacent cell. To confirm that this was not an artefact of working at lower than normal mammalian temperature waves were examined at higher temperatures. At normal mammalian temperature (Fig. 1D) Ca2+ waves propagated faster (95 μm s−1), and were shorter in profile as they are in isolated cells (Engel et al. 1995), but still usually failed to appear in the adjacent cells (see below).
Although fast line scan imaging (Fig. 1C and D) is appropriate for investigating the mechanisms of wave propagation and Ca2+ sparks, the brief scans produced would fail to reveal the appearance of a wave in an adjacent cell, if transmission from cell to cell was delayed (Sanderson et al. 1994). Therefore we used full-frame imaging at 4 frames s−1 for periods of 25 s. This method had the major advantage that many cells and cell borders could be studied with ‘virtual line scans’ (Fig. 2) constructed by the computer after acquiring one set of 100 full-frame images. In addition, virtual line scans, at angles to the actual scanned line, could be obtained, which was useful if the longitudinal axis of the cell selected for study was not perfectly parallel to the scanning axis.
Figure 2. Patterns of Ca2+ waves and wave transmission at cell junctions.
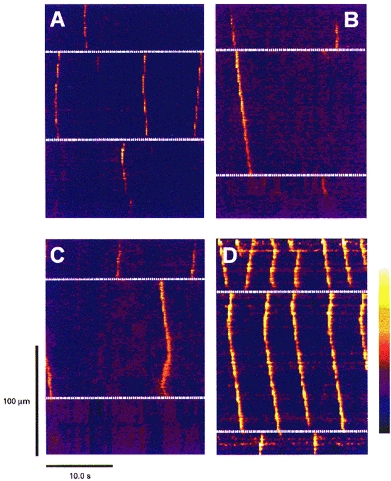
Images of fluorescence ratio from ‘virtual line scans’ made through 4 different multicellular regions (A–D). The white dashed lines indicate the cell edges. In A, three waves arise in the middle cell, two centrally and one at the lower edge. None of these waves are transmitted to the adjacent cells. In B, two waves arise in the top cell; the first is transmitted without delay into the middle cell, but transmission of the second fails. In C, in the top cell two waves arise at the cell-cell junction and are transmitted in only one direction. Towards the end of the scan, two waves arise concurrently at the opposite ends of the middle cell and are annihilated when they meet. D, the pattern of waves near a damage site (top). In the top cell the frequency of waves was highest; this frequency decreased with each cell border passed. The bathing [Ca2+]o is 3 mm in A–C, and 1 mm in D. The colour bar indicates the range of fluorescence ratios (F/F0), from 0.0 (dark blue) to 6.0 (white).
Virtual line scanning of identified cells and cell borders revealed several patterns of Ca2+ wave activity (Fig. 2). Waves were seen to originate both at the edges and in the centre of cells. Waves originating near the centre of the cells propagated in both directions to the ends of the cell, giving a ‘V’ pattern. Waves were seen either to fail to pass between cells (e.g. centre cell of Fig. 2A) or to pass to the neighbouring cell (top and centre cell of Fig. 2B). Waves that originated simultaneously at two sites in the same cell annihilated each other upon meeting, giving an inverted ‘V’ pattern (centre cell in Fig. 2C). In regions of high [Ca2+]i due to damage (Fig. 2D), wave frequency decreased markedly with each cell-cell junction passed. Virtual scans of 25 s in duration, such as those shown in Fig. 2, were used to assess quantitatively the probability of cell-cell transmission (Ptran), as described later (Fig. 4).
Figure 4. Probabilities of Ca2+ wave transmission under different conditions; Ca2+ waves originate at different sites in trabeculae and isolated cardiac myocytes.
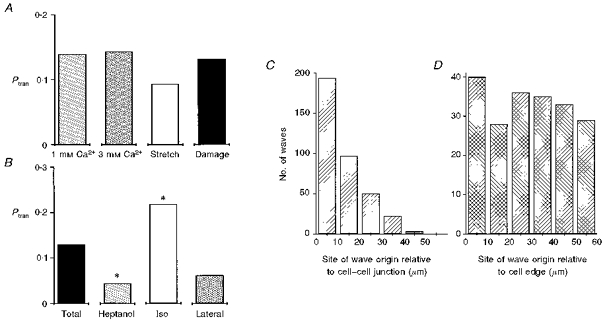
Ptrans was calculated for individual junctions during 25 s. Ptran is the number of waves transmitted by a junction divided by the total number of waves hitting that junction in any 25 s interval. A, the effects of various conditions on Ptran; bathing [Ca2+]o of 1 mm and 3 mm, after a stretch and release (Stretch) and with a small amount of damage caused either by impalement or by cut side branches (Damage). 1 mm Ca2+: 3 muscles, 16 cell-cell junctions, 93 waves, 0.032 waves s−1; 3 mm Ca2+: 3 muscles, 20 cell-cell junctions, 226 waves, 0.100 waves s−1; Stretch: 2 muscles, 18 cell-cell junctions, 157 waves, 0.103 waves s−1; Damage: 5 muscles, 27 cell-cell junctions, 333 waves, 0.116 waves s−1. B, the effect of 3 mm heptanol and 1 μm isoproterenol on Ptran and the Ptran laterally. Total: 13 muscles, 81 cell-cell junctions, 809 waves, 0.085 waves s−1; Heptanol: 3 muscles, 29 cell-cell junctions, 268 waves, 0.110 waves s−1; Iso: 3 muscles, 14 cell-cell junctions, 181 waves, 0.101 waves s−1; Lateral: 2 muscles, 4 cell-cell junctions, 108 waves, 0.154 waves s−1. Differences between the samples were assessed using a Mann-Whitney rank sum test. There was no statistical difference between any of the samples in A. * Significant difference from the ‘total’ sample (P < 0.05). Waves originate near the ends of cells in trabeculae C and randomly in isolated cardiac cells D. Sites of wave origin were measured from line scan images. Data in C are from 80 cells in 12 trabeculae in which the frequency of waves was 0.097 waves s−1. Data in D are from 22 isolated cells obtained by enzymatic digestion of 4 hearts in which the wave frequency was 0.071 waves.
Line scan images provide a convenient format for analysis, but cannot provide information about possible transmission of Ca2+ waves into cells that are not on the same axis as the line scan. It is likely that calcium waves do propagate from cells in the focal plane to those above or below them. Our measurements of probability of wave transmission, however, are calculated for identified cell-cell junctions. Thus Ptran may be lower than the probability of calcium wave transmission from cell to cell. Therefore we also examined movies constructed from full-frame images (Fig. 3) to detect such possible occurrences. Waves were occasionally observed to propagate not to the next cell longitudinally, but to a cell displaced diagonally (Fig. 3C). The group of cells illustrated in Fig. 3 shows an example of true lateral transmission, a phenomenon we were very rarely able to observe (Fig. 3D). The images in Figs 2 and 3 show that the events at cell junctions are not stereotyped. When transmission between cells is observed, no delay is seen in the intercellular calcium wave (Fig. 2B). Calcium seems to move between cells (Fig. 3B and D), suggesting that the transmission is not mediated by an additional messenger, such as inositol trisphosphate (InsP3), as has been suggested for other tissues (Sanderson et al. 1994).
Figure 3. Transmission of Ca2+ waves at cell junctions is not stereotyped.
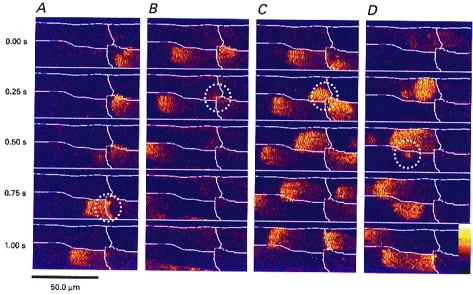
A–D, full frame images of the junctions between the same four cells within a trabecula. Each vertical panel (A–D) shows 5 images taken at 250 ms intervals. The cell borders are marked in white. A, an example of direct longitudinal transmission. The wave in the lower right cell passes directly into the lower left cell; this event is circled. B, a wave failing to pass through the same junction although there is a spritz of calcium (circled) from the lower right cell diagonally into the upper left cell, which to initiate a wave. In C the wave in the lower right cell again fails to propagate into the lower left cell. However, this time the spritz of calcium into the upper left cell (circled) initiates a wave. D, a rare example of lateral transmission, the wave in the upper left cell transmits a spritz of calcium into the lower left cell (circled) which initiates a wave that propagates away in both directions. The bathing [Ca2+]o was elevated to 3 mm to produce Ca2+ waves at a high frequency. Assignment of colour to the fluorescence ratio (F/F0) is from 0.4 (dark purple) to 4.0 (white).
Of waves arriving at the end of a cell under normal conditions (bar labelled 1 mm Ca2+ in Fig. 4A), only 13 % were observed to propagate straight through the cell border, into the longitudinally adjacent cell. This proportion was not altered by elevating extracellular [Ca2+] to 3 mm or by stretch or damage (caused by impalement or cut side branches), although these later conditions were associated with significantly increased frequency of wave occurrence (see legend for details). This contrasts with the observations on intracellular propagation of calcium waves, which does depend strongly on the degree of SR loading (Trafford et al. 1993).
Heptanol (3 mm), a gap junction uncoupler (Takens-Kwak et al. 1992), reduced Ptran significantly (P < 0.05) to 0.045 (Fig. 4B), supporting the idea that when transmission of Ca2+ waves does occur, it does so through gap junctional channels. Because the conductance of gap junction channels can be modulated by phosphorylation (De Mello, 1988), we examined the effects of isoproterenol, a β-agonist that would be expected to elevate cAMP in the tissue. One would expect that adrenergic stimulation would have many effects, including an increase of SR calcium content, from the work of Diaz et al. (1997); the net consequence of this may be an increase in wave frequency with little effect on magnitude. At a concentration of 1 μm, Ptran was increased significantly (P < 0.05), to 0.22. Ptran between laterally adjacent cells (Figs 3D and 4B) was significantly lower (0.06) than at end-to-end cell junctions. This estimate was derived only from cells in which such lateral wave transmission occurred and therefore is undoubtedly an overestimate.
Surprisingly, Ca2+ waves did not arise randomly in connected cells (Fig. 4C) although they did in cells disconnected from each other (Fig. 4D) by enzymatic dissociation (Shacklock et al. 1995). As noted above, the origin of waves could be determined from the line scan images. In twelve trabeculae and eighty cells, waves originated most often within 10 μm of a cell edge. Probabilities of wave origination declined ∼50 % within each 10 μm from the end of the cell.
Whether Ca2+ waves occur normally in intact cardiac tissue is controversial. We found previously (Wier et al. 1997) that ventricular trabeculae did often have spontaneous Ca2+ waves and Ca2+ waves have been recorded in intact whole hearts (Minamikawa et al. 1997). In three of four muscles at physiological temperatures (35–37°C), Ca2+ waves did not occur, even when external [Ca2+] was elevated, from 1.0 mm to 2.0 or 3.0 mm. In three muscles at room temperature (21–25°C) we were able to measure waves with an external [Ca2+] of 1.0 mm, although the frequency of waves was low (0.032 waves s−1). Four of twelve trabeculae had some damage (the result either of electrode impalements or of cut side branches) and showed Ca2+ waves under all conditions (Stuyvers et al. 1997). The optical sectioning achieved with CLSM resolved in detail the site and nature of damage, too small to be resolved by transmitted light microscopy or wide-field fluorescence microscopy. In the remaining five muscles studied at room temperature, we found we could increase the frequency of Ca2+ waves by increasing extracellular [Ca2+]o or by stretching and releasing the muscle. We conclude that, in the absence of damage, Ca2+ waves are infrequent at physiological temperatures and normal external [Ca2+]. At room temperature, however, Ca2+ waves occur much more frequently and are elicited easily by elevation of external [Ca2+] or damage.
DISCUSSION
Although cardiac gap junctions are among the largest in nature (Hoyt et al. 1989), we conclude that their permeability to Ca2+ is normally low. Propagation of intercellular calcium waves is an event of rather low probability (0.13). Ca2+ waves arriving at the end of a cell usually stop, presumably because the permeability of the gap junctional channels to Ca2+ is insufficient to allow enough Ca2+ into the next cell to initiate a new wave via Ca2+-induced Ca2+ release. Occasionally, the intercellular movement of a small spritz of Ca2+ could actually be observed (Fig. 3B and D). We postulate that these properties of cardiac gap junctions have several consequences. First, the limited calcium permeability may account for the progressive decline in frequency of Ca2+ waves away from a site of damage (Fig. 2D). Second, the limited local intercellular movement of Ca2+ may raise the SR calcium load close to the gap junctions, making the ends of the cells the preferential site for wave initiation in intact heart tissue. Finally, the Ca2+ permeability of connexin-43 gap junction channels may be regulated by the same adrenergic mechanisms that are involved in beat-to-beat regulation of cardiac contractility (Spurgeon et al. 1990; Bers, 1991).
References
- Backx PH, ter Keurs HEDJ. Fluorescent properties of rat cardiac trabeculae microinjected with fura-2 salt. American Journal of Physiology. 1993;264:H1098–1110. doi: 10.1152/ajpheart.1993.264.4.H1098. [DOI] [PubMed] [Google Scholar]
- Bers DM. Excitation-Contraction Coupling and Cardiac Contractile Force. Dordrecht, Boston and London: Kluwer Academic Publishers; 1991. [Google Scholar]
- Brenner M. Imaging dynamic events in living tissue using water immersion objectives. American Laboratory. 1994;14:14–19. [Google Scholar]
- De mello WC. Increase in junctional conductance caused by isoproterenol in heart cell pairs is supressed by cAMP-dependent protein-kinase inhibitor. Biochemical and Biophysical Research Commuications. 1988;154:509–514. doi: 10.1016/0006-291x(88)90169-6. [DOI] [PubMed] [Google Scholar]
- Diaz ME, Trafford AW, O'Neillapos;neill S C, Eisner DA. Measurement of sarcoplasmic reticulum Ca2+ content and sarcolemmal Ca2+ fluxes in isolated rat ventricular myocytes during spontaneous Ca2+ release. The Journal of Physiology. 1997;501:3–16. doi: 10.1111/j.1469-7793.1997.003bo.x. [DOI] [PMC free article] [PubMed] [Google Scholar]
- Engel J, Sowerby AJ, Finch EA, Fechner M, Stier A. Temperature dependence of Ca2+ wave properties in cardiomyocytes: implications for the mechanisms of autocatalytic Ca2+ release in wave propagation. Biophysical Journal. 1995;68:40–45. doi: 10.1016/S0006-3495(95)80196-7. [DOI] [PMC free article] [PubMed] [Google Scholar]
- Gwathmey JK, Copelas L, Mackinnon R, Schoen FJ, Feldman MD, Grossman W, Morgan JP. Abnormal intracellular calcium handling in myocardium from patients with end-stage heart failure. Circulation Research. 1987;61:70–76. doi: 10.1161/01.res.61.1.70. [DOI] [PubMed] [Google Scholar]
- Hoyt RH, Cohn ML, Saffitz JE. Distribution and three-dimensional structure of intercellular junctions in canine myocardium. Circulation Research. 1989;64:563–574. doi: 10.1161/01.res.64.3.563. [DOI] [PubMed] [Google Scholar]
- Jaffe LF. Classes and mechanisms of calcium waves. Cell Calcium. 1993;14:736–745. doi: 10.1016/0143-4160(93)90099-r. 10.1016/0143-4160(93)90099-R. [DOI] [PubMed] [Google Scholar]
- January CT, Fozzard HA. Delayed afterdepolarisations in heart muscle: Mechanisms and relevance. Pharamacological Reviews. 1988;40:219–227. [PubMed] [Google Scholar]
- Luther PW, Bloch RJ. Formaldehyde-amine fixatives for immunocytochemistry of cultured Xenopus myocytes. Journal of Histochemistry and Cytochemistry. 1989;37:75–82. doi: 10.1177/37.1.2491754. [DOI] [PubMed] [Google Scholar]
- Minamikawa T, Cody SH, Williams DA. In situ visualization of spontaneous calcium waves within perfused whole rat heart by confocal imaging. American Journal of Physiology. 1997;272:H236–243. doi: 10.1152/ajpheart.1997.272.1.H236. [DOI] [PubMed] [Google Scholar]
- Peters NS. New insights into myocardial arrhthmogenesis: distribution of gap-junctional coupling in normal, ischaemic and hypertrophied human hearts. Clinical Science. 1996;90:447–452. doi: 10.1042/cs0900447. [DOI] [PubMed] [Google Scholar]
- Rooney TA, Thomas AP. Intercellular calcium waves generated by Ins(1,4,5)P3-dependent mechanisms. Cell Calcium. 1993;14:647–690. doi: 10.1016/0143-4160(93)90094-m. [DOI] [PubMed] [Google Scholar]
- Sanderson MJ, Charles AC, Boitano S, Dirksen ER. Mechanisms and function of intercellular calcium signalling. Molecular and Cellular Endocrinology. 1994;98:173–187. doi: 10.1016/0303-7207(94)90136-8. 10.1016/0303-7207(94)90136-8. [DOI] [PubMed] [Google Scholar]
- Shacklock PS, Wier WG, Balke CW. Local Ca2+ transients (Ca2+sparks) originate at transverse tubules in rat heart cells. The Journal of Physiology. 1995;487:601–608. doi: 10.1113/jphysiol.1995.sp020903. [DOI] [PMC free article] [PubMed] [Google Scholar]
- Spurgeon HA, Stern MD, Baartz G, Raffaeli S, Hansford RG, Talo A, Lakatta EG, Capogrossi MC. Simultaneous measurement of Ca2+ contraction and potential in cardiac myocytes. American Journal of Physiology. 1990;258:H574–586. doi: 10.1152/ajpheart.1990.258.2.H574. [DOI] [PubMed] [Google Scholar]
- Stuyvers BDMY, Miura M, ter Keurs HEDJ. Dynamics of viscoelastic properties of rat cardiac sarcomeres during the diastolic interval: involvement of Ca2+ The Journal of Physiology. 1997;502:661–677. doi: 10.1111/j.1469-7793.1997.661bj.x. [DOI] [PMC free article] [PubMed] [Google Scholar]
- Takamatsu T, Wier WG. Calcium waves in mammalian heart: quantification of origin, magnitude, waveform, and velocity. FASEB Journal. 1990;4:1519–1525. doi: 10.1096/fasebj.4.5.2307330. [DOI] [PubMed] [Google Scholar]
- Takens-Kwak BR, Jongsma HJ, Rook MB, Van ginneken AC. Mechanisms of heptanol-induced uncoupling of cardiac gap junctions: a perforated patch-clamp study. American Journal of Physiology. 1992;262:C1531–1538. doi: 10.1152/ajpcell.1992.262.6.C1531. [DOI] [PubMed] [Google Scholar]
- ter Keurs HEDJ, Rijnsburger WH, Van heuningen R, Nagelsmit MJ. Tension development and sarcomere length in rat cardiac trabeculae. Circulation Research. 1980;46:703–714. doi: 10.1161/01.res.46.5.703. [DOI] [PubMed] [Google Scholar]
- Trafford AW, O'Neillapos;neill S C, Eisner DA. Factors affecting the propagation of locally activated systolic Ca transients in rat ventricular myocytes. Pflügers Archiv. 1993;425:181–183. doi: 10.1007/BF00374521. [DOI] [PubMed] [Google Scholar]
- Wier WG, Cannell MB, Berlin JR, Marban E, Lederer WJ. Cellular and subcellular heterogeneity of [Ca2+]i in single heart cells revealed by fura-2. Science. 1987;235:325–328. doi: 10.1126/science.3798114. [DOI] [PubMed] [Google Scholar]
- Wier WG, ter Keurs HEDJ, Marban E, Gao W-D, Balke CW. Ca2+‘sparks’ and waves in intact ventricular muscle resolved by confocal imaging. Circulation Research. 1997;81:462–469. doi: 10.1161/01.res.81.4.462. [DOI] [PubMed] [Google Scholar]
- Wussling MHP, Salz H. Nonlinear propagation of spherical calcium waves in rat cardiac myocytes. Biophysical Journal. 1996;70:1144–1153. doi: 10.1016/S0006-3495(96)79715-1. [DOI] [PMC free article] [PubMed] [Google Scholar]
- Zhang YM, Miura M, ter Keurs HEDJ. Triggered propagated contractions in rat cardiac trabeculae. Inhibition by octanol and heptanol. Circulation Research. 1996;79:1077–1085. doi: 10.1161/01.res.79.6.1077. [DOI] [PubMed] [Google Scholar]