

Abstract
Perturbations of arterial blood pressure change medullary raphe neurone activity and the respiratory motor pattern. This study sought evidence for actions of baroresponsive raphe neurones on the medullary respiratory network.
Blood pressure was perturbed by intravenous injection of an α1-adrenergic receptor agonist, unilateral pressure changes in the carotid sinus, or occlusion of the descending aorta in thirty-six Dial-urethane-anaesthetized, vagotomized, paralysed, artificially ventilated cats. Neurones were monitored with microelectrode arrays in two or three of the following domains: nucleus raphe obscurus-nucleus raphe pallidus, nucleus raphe magnus, and rostral and caudal ventrolateral medulla. Data were analysed with cycle-triggered histograms, peristimulus time and cumulative sum histograms, cross-correlograms and spike-triggered averages of efferent phrenic nerve activity.
Prolongation of the expiratory phase and decreased peak integrated phrenic amplitude were most frequently observed. Of 707 neurones studied, 310 had altered firing rates during stimulation; changes in opposite directions were monitored simultaneously in fifty-six of eighty-seven data sets with at least two baroresponsive neurones.
Short time scale correlations were detected between neurones in 347 of 3388 pairs. Seventeen pairs of baroresponsive raphe neurones exhibited significant offset correlogram features indicative of paucisynaptic interactions. In correlated raphe-ventrolateral medullary neurone pairs with at least one baroresponsive neurone, six of seven ventrolateral medullary decrementing expiratory (E-Decr) neurones increased their firing rate during baroreceptor stimulation. Thirteen of fifteen ventrolateral medullary inspiratory neurones correlated with raphe cells decreased their firing rate during baroreceptor stimulation.
The results support the hypothesis that raphe neuronal assemblies transform and transmit information from baroreceptors to neurones in the ventral respiratory group. The inferred actions both limit and promote responses to sensory perturbations and match predictions from simulations of the respiratory network.
The respiratory motor pattern may be altered by perturbations of blood pressure (Heymans & Bouckaert, 1930). Increases in pressure can reduce both inspiratory drive and respiratory rate (Bishop, 1974; Grunstein et al. 1975), and may contribute to sleep-disordered breathing (Marks & Harper, 1987; however, see Wilson et al. 1998).
Neurones in the ventrolateral medulla co-operate in the generation of the respiratory rhythm and patterns of respiratory drive potentials in motoneurones (Bianchi et al. 1995). Little is known about the responses and roles of these neurones during changes in the respiratory pattern caused by increased arterial blood pressure. Expiratory neurones in the caudal ventral respiratory group (VRG) exhibit a prolongation of their active phase with a slight decline in mean firing rate (Gabriel & Seller, 1969). Inspiratory neurones in the caudal VRG show a decline in firing rate (Gabriel & Seller, 1969; Richter & Seller, 1975).
Current models of cardiorespiratory regulation place medullary raphe neurones in a distributed network that regulates breathing and the cardiovascular system (Spyer, 1994; Lindsey et al. 1994; Morris et al. 1996a; Lalley et al. 1997). Medullary raphe neurones are influenced by peripheral chemoreceptors (Morris et al. 1996a) and baroreceptors (Morrison & Gebber, 1984; Yen & Blum, 1984). Medullary raphe neurones may also function as central chemoreceptors (Bernard et al. 1996). Various lines of evidence have associated abnormalities in ventral brainstem regions that may be linked to caudal raphe neurones with sudden infant death syndrome (Harper & Bandler, 1998).
The first goal of this study was to seek evidence for distributed actions of baroresponsive raphe neurones on the medullary respiratory network. The second objective was to assess predictions derived from a model and simulations of the respiratory network in which defined perturbations caused changes similar to those associated with altered baroreceptor activity (Lindsey et al. 1987; Balis et al. 1994). A preliminary account has been reported (Lindsey et al. 1991).
METHODS
Most of the methods have been described in detail elsewhere (Lindsey et al. 1994; Morris et al. 1996b). All experiments were performed under protocols approved by the University of South Florida's Animal Care and Use Committee. Data were obtained from thirty-six adult cats of either sex (2.0–5.7 kg) initially anaesthetized with sodium thiopental (22.0 mg kg−1, i.v.). Anaesthesia was maintained with Dial-urethane (allobarbital, 60.0 mg kg−1, Ciba; urethane, 240 mg kg−1). Blood pressure and respiration were monitored continuously. Animals were given additional Dial-urethane if there was an increase in blood pressure or respiration in response to periodic noxious stimuli (toe pinch). Animals received dexamethasone (2.0 mg kg−1) to minimize brainstem swelling, and atropine (0.5 mg kg−1) to decrease tracheal secretion. Arterial blood pressure, PO2, PCO2, pH, [HCO3−] and end-tidal CO2 were monitored and maintained within normal limits. Core body temperature was maintained at 38.0 ± 0.5°C.
The vago-sympathetic nerve trunks were isolated within the neck between 1 and 4 cm caudal to the carotid sinus and sectioned to eliminate vagal afferent feedback from lung receptors. The influence of aortic baroreceptors via the vagus nerve was also eliminated. The left C5 phrenic rootlet was isolated, desheathed and cut for subsequent recording. A laminectomy was performed in twenty-one cats and an array of four pairs of tungsten electrodes was placed in the ventral spinal cord at the C3 level to test for spinal projections of neurones with antidromic stimulation methods. A thoracic spinal process was cleared and clamped to reduce movement due to ventilation. Animals were paralysed to reduce brainstem movements with a bolus of gallamine triethiodide (2.2 mg kg−1) followed by constant infusion (0.4 mg kg−1 h−1). An occipital craniotomy was performed and the caudal portion of the cerebellum was aspirated to expose the brainstem. In most experiments, a unilateral or bilateral thoracotomy further reduced brainstem movements. These animals were ventilated with 100% O2 to counteract the hypoxia due to ventilation-perfusion mismatching that may occur in such preparations. The functional residual capacity of the lungs was maintained within a normal range by adjustment of the end-expiratory pressure. Periodically, the upper airways were suctioned and the lungs were hyperinflated. At the end of the experiments, cats were overdosed with sodium pentobarbital and perfused intracardially with 0.9% NaCl, followed by 10% neutral-buffered formalin solution. Brainstem sections were prepared for histological examination to verify the placement of electrodes.
Neurone recording
Neuronal impulses were monitored extracellularly with planar arrays of six to eight individual tungsten microelectrodes (3–5 MΩ), in two or three of the following domains: nucleus raphe obscurus-nucleus raphe pallidus, nucleus raphe magnus, rostral ventrolateral medulla and caudal ventrolateral medulla. Signals were amplified, filtered (100–5000 Hz bandpass) and recorded on either two or three 16-channel FM instrumentation recorders, together with phrenic nerve activity, a stimulus marker, systemic blood pressure and, in some experiments, carotid blood pressure. Common synchronization pulses (5 Hz) were recorded on each tape.
Stimulus protocols
Signals were recorded for at least 15 min prior to the onset of baroreceptor stimulation by one of three conventional methods (Richter & Seller, 1974; Grunstein et al. 1975; Lipski et al. 1976; Harper et al. 1995). In five cats, the α1-adrenergic receptor agonist phenylephrine (1–5 μg kg −1, i.v.) was used to produce transient increases in blood pressure for 20–1080 s. Pressure was elevated in sixteen animals by occlusion of the descending aorta with an embolectomy catheter. Series of three to six inflations (mean duration ± s.d., 32.8 ± 13.3 s) were applied at 3–5 min intervals during each recording. In fifteen animals, occlusion cuffs on the lingual and common carotid arteries were inflated and carotid sinus baroreceptors were stimulated by unilateral injection of arterial blood through a catheter connected to a pressure transducer. Pressure in the sinus area was raised for 10–30 s. Series of three to six baroreceptor stimuli were applied at 3–5 min intervals. Other data on responses to carotid chemoreceptor stimulation from this later subset of animals have been reported previously (Morris et al. 1996a, b).
Data entry and analysis
Single neurone action potentials and synchronized timing pulses from each tape were converted to TTL (transistor-transistor logic) pulses and entered into a laboratory computer. Multiunit phrenic nerve activity was amplified and fed into a resistor-capacitor ‘leaky’ integrator with a time constant of 200 ms. This analog signal and those corresponding to systemic blood pressure, carotid blood pressure and a stimulus marker were digitized with 12-bit accuracy at 20 Hz. In some experiments, whole-nerve phrenic multiunit activity and the synchronization pulse channel were also digitized with 16-bit accuracy at 5 kHz.
Data were analysed on Hewlett Packard 9000 series computers. The times of onset of the inspiratory and expiratory phases were derived from the phrenic nerve signal and inserted into each data file. Respiratory cycle-triggered histograms were computed for each cell to measure the average firing probability during the cycle. Two statistical methods were used to decide whether each neurone had a respiratory modulated firing rate (Orem & Dick, 1983; Morris et al. 1996b).
Changes in inspiratory drive and respiratory phase durations were assessed from measurements of integrated efferent phrenic nerve activity. Spike trains were evaluated for responses to baroreceptor stimulation with the following methods. A long time scale firing rate histogram with all episodes of each stimulus series was constructed and visually examined for changes in firing rate during stimulation relative to activity preceding stimuli. For each series, the activity during the stimulation and an equivalent interval before each stimulus were averaged for each spike train. A peristimulus time histogram and cumulative sum histogram were calculated. Changes in firing rates were considered significant if they exceeded confidence limits set to ± 2 s.d. from the mean of pre-stimulus activity in the peristimulus time histograms, or ± 3 s.d. for the cumulative sum histograms (Davey et al. 1986).
An additional method was used to evaluate spike trains for firing rate changes in respiratory cycles during baroreceptor stimulation. The null hypothesis was that peak and average firing rates were not different from control. To reject the null hypothesis, these parameters, averaged over at least three stimulus trials, had to be significantly different from the mean of control cycles just preceding each of the stimuli (P < 0.05, Student's t test).
Cross-correlograms were calculated for each pair of simultaneously recorded spike trains to detect and evaluate effective connectivity. Inferred functional interactions congruent with data from simulations of neurones with known connections are considered in the Discussion (Perkel et al. 1967; Moore et al. 1970; Aertsen & Gerstein, 1985). An offset trough suggests an inhibitory process, defined operationally as any mono- or paucisynaptic relationship that reduces target cell firing probability. An offset peak suggests either an excitatory action between the neurones or an unobserved shared input that influences both cells with different delays. Shared inputs or cross-connections with similar action result in synchronous discharge reflected as a central peak. A central trough can be attributed to functional inputs with opposite actions on each of the monitored neurones.
A detectability index (DI, equal to the ratio of the maximum amplitude of departure from background, D, to the background, divided by the s.d. of the correlogram noise) was used to test significance (Aertsen & Gerstein, 1985). Values greater than 2 were considered significant. If this criterion was met, the D/background ratio was used as an indicator of the visibility or strength, S, of the correlation. A cumulative sum was then calculated as an additional significance criterion. Statistical confidence limits set at ± 2 or 3 s.d. were computed for each cumulative sum and used to evaluate the significance of suspected features (Davey et al. 1986). The cumulative sums were used only as an additional corroboration of cross-correlogram feature significance in this study.
Autocorrelograms were calculated for each neurone and used as an aid in the interpretation of all cross-correlation histograms (Moore et al. 1970). Examples are shown in the Results. Unrectified and full-wave rectified spike-triggered averages of digitized multiunit phrenic activity were calculated and visually inspected for significant features with latencies up to 1 s (Cohen et al. 1974; Davies et al. 1985).
RESULTS
Table 1 details the responses of 707 neurones studied during perturbations of blood pressure. The three main columns list the initial significant change in firing rate during the indicated stimulus protocol. Phenylephrine administration (5 animals) increased mean pressure by an average of 30.4 ± 11.8 mmHg over an average control mean pressure of 106.4 ± 24.4 mmHg. Unless indicated otherwise, all reported measures of variability are standard deviations. Occlusion of the descending aorta (16 animals) raised the mean pressure by an average of 42.4 ± 14.7 mmHg over an average control mean pressure of 110.7 ± 18.3 mmHg. Unilateral injection of arterial blood (15 animals) raised carotid sinus pressure to 200 mmHg.
Table 1.
Tally of neurones with the indicated changes in peak firing rates during perturbations of blood pressure
| Response to phenylephrine | Response to occlusion of descending aorta | Response to inflation of carotid sinus | |||||||||
|---|---|---|---|---|---|---|---|---|---|---|---|
| Respiratory Modulation | Site | No. a.a. | Inc | Dec | NC | Inc | Dec | NC | Inc | Dec | NC |
| E-Aug | RM | 2 | 1 | 2 | 2 | 8 | 3 | 10 | |||
| CM | 3 | 2 | 3 | 3 | 5 | ||||||
| RV | 5 | 2 | 3 | 7 | 3 | 6* | 14 | 1 | 1 | 6 | |
| CV | 1 | 1 | 3 | ||||||||
| E-Decr | RM | 4 | 2 | 4 | 6 | 19 | 8 | ||||
| CM | 3 | 9 | 1 | 2 | 5 | 4 | 2 | 8 | |||
| RV | 2 | 5 | 4 | 7 | 6 ** | 9 | 2 | 3 | |||
| CV | 2 | 7 | |||||||||
| E-Other | RM | 1 | 1 | 5 | |||||||
| CM | 1 | 6 | |||||||||
| RV | 1 | 5 | |||||||||
| CV | 1 | 2 | |||||||||
| I-Aug | RM | 1 | 1 | 3 | 2 | 2 | 2 | 3 | |||
| CM | 4 | 1 | 6 | 3 | 2 | 4 | 1 | 4 | |||
| RV | 1 | 1 | 7 | 5 | 3 | 11* | 13 | 1 | 1 | 12 | |
| CV | 7 | 9 | |||||||||
| I-Decr | RM | 1 | 1* | 3 | |||||||
| CM | 1 | 1 | 1 | 1 | 1 | 1* | 2 | ||||
| RV | 3 | 2 | 2** | 8 | 1 | 4 | 14 | 3 | 13 | ||
| CV | 3 | 3 | 16 | ||||||||
| I-Other | RM | 1 | 1 | 3 | 1 | ||||||
| CM | 1 | 1 | 1 | 2 | 9 | ||||||
| RV | 1 | 1 | 2 | 3 | |||||||
| CV | 4 | 10 | |||||||||
| NRM | RM | 2 | 1 | 6 | 3 | 13* | 19 | 22 | |||
| CM | 2 | 2 | 12 | 8 | 7 | 11 | 17 | 15 | 3 | 49 | |
| RV | 1 | 2 | 2 | 2 | 5 | 2 | 26 | ||||
| CV | 2 | 1 | 12 | ||||||||
| Column totals | 20 | 28 | 52 | 54 | 64 | 95 | 133 | 41 | 30 | 210 | |
| Totals by stimulus | 134 | 292 | 281 | ||||||||
| Total increased | 133 | ||||||||||
| Total decreased | 177 | ||||||||||
| Total no change | 397 | ||||||||||
| Total neurones tested | 707 | ||||||||||
Respiratory modulation of average firing rate is classified as expiratory (E) or inspiratory (I), and augmenting (Aug), decrementing (Decr), Other, or non-respiratory modulated (NRM). Recording sites included rostral mid-line (RM), caudal mid-line (CM), rostral ventrolateral (RV) medulla and caudal ventrolateral (CV) medulla. No. a. a., number of neurones antidromically activated from the spinal cord. Responses to phenylephrine (5 cats), occlusion of the descending aorta (16 cats) and inflation of the carotid sinus (15 cats) are shown in terms of the firing rate change: Inc, increased; Dec, decreased; NC, no change. The recording domains and other abbreviations are fully defined in the text. Each asterisk represents one antidromically activated neurone in the indicated response category.
Rows in Table 1 include the distribution of responses by category of discharge pattern during the respiratory cycle and by recording site. Twenty bulbospinal neurones identified by antidromic activation are also listed. Eight of nine responsive bulbospinal neurones (asterisks) had diminished firing rates when blood pressure was perturbed; all eight were respiratory modulated (3 expiratory, 5 inspiratory). All raphe neurones were recorded within 0.6 mm of the mid-line. Recording sites in the region of nucleus raphe obscurus-nucleus raphe pallidus had co-ordinates from 0.5 to 4.6 mm rostral to the obex, and 1.9 to 4.6 mm below the medullary surface. This sampled domain is referred to as the caudal mid-line (CM) region for convenience. In the region of nucleus raphe magnus, co-ordinates extended from 6.4 to 8.5 mm rostral to the obex and between 2.0 and 4.6 mm below the brainstem surface. This region is designated the rostral mid-line (RM). Recording sites in the rostral ventrolateral (RV) medulla ranged from 2.5 to 6.0 mm rostral to the obex, 2.9 to 4.5 mm lateral, and 3.1 to 6.3 mm in depth. This domain contains neurones of the rostral ventral respiratory group (Bianchi et al. 1995), which includes regions also referred to as Bötzinger and pre-Bötzinger. Caudal ventrolateral (CV) medullary co-ordinates were between 1.3 mm caudal and 2.0 mm rostral to the obex, 2.3 to 4.0 mm lateral, and 2.7 to 5.6 mm deep.
Cycle-triggered histograms were used to classify each neurone with a statistically significant respiratory modulation according to the phase (inspiration - I, or expiration - E, as defined by overlaid integrated efferent phrenic nerve activity) during which the neurone was more active. Neurones with peak firing rates in the first half of the phase were classified as decrementing (Decr) cells, whereas those cells with peak firing rates in the second half of the phase were denoted as augmenting (Aug) neurones. Neurones with very low firing rates or with peak activities at the middle of a phase or phase transition were classified as E-Other and I-Other. These neurones were more active in the named respiratory phase and included, for example, I–E/I neurones that began to discharge late in expiration and reached peak activity during the inspiratory phase (Segers et al. 1987). Neurones with no preferred phase of maximum activity were classified as non-respiratory modulated (NRM).
Parallel changes in firing rates of multiple single neurones during perturbations of blood pressure
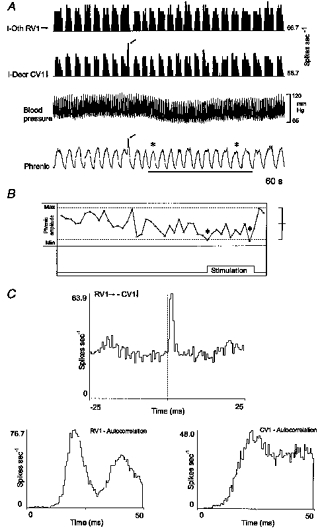
Concurrent changes in the firing rates of two or more neurones were detected in eighty-seven series of baroreceptor perturbations. Neurones with firing rate changes in opposite directions were monitored simultaneously in fifty-six of these series. Figure 1A shows typical responses with firing rate histograms of seven neurones recorded during an increase in blood pressure produced by occlusion of the descending aorta. The arrow to the left of each histogram in this and similar subsequent figures indicates the initial direction of a significant change in firing rate in response to the perturbation.
Figure 1. Simultaneously recorded responses of 7 brainstem neurones to a transient increase in blood pressure produced by inflation of an embolectomy catheter in the descending aorta.

A, labels to the left of each firing rate histogram (top) in this and subsequent figures include type of respiratory modulation (abbreviations in text) and direction of change in firing rate during perturbation (↑, increased; ↓, decreased; →, no change). Firing rates (in spikes s−1) are shown on the right and refer to the largest bin in the corresponding plot. The recording location is indicated by the prefix of each neurone's identifier: CM, caudal mid-line; RM, rostral mid-line; RV, rostral ventrolateral medulla. Blood pressure, integrated efferent phrenic nerve activity, and stimulus duration (bar) are also shown. B, top, peristimulus time histograms (PSTH) show average changes in firing rates of neurones CM1 and RM1 (3 trials); bottom, cumulative sum histograms (CUSUM) for the peristimulus time histograms.
Average responses of two of the neurones are illustrated in peristimulus time histograms and corresponding cumulative sum histograms (Fig. 1B). The firing rate of caudal mid-line neurone CM1 increased when blood pressure was elevated. The activity of rostral mid-line cell RM1 decreased concurrently. Examples of the responses of simultaneously recorded neurones to perturbation of blood pressure by other methods are included in subsequent figures.
Short time scale correlations
Responses of neurones distributed in the medulla during perturbations of blood pressure provided data that helped place those neurones in a functional context. The next step was to screen the same data sets for short time scale correlations that could provide evidence for paucisynaptic interactions among the responsive raphe neurones and with neurones of the ventrolateral medullary respiratory network.
Two examples of short time scale correlations among three neurones represented in Fig. 1 are shown in Fig. 2. Two E-Decr neurones, RM1 and RV1 (Fig. 2A) recorded in the rostral medullary raphe and ventrolateral medulla, respectively, both exhibited transient reductions in firing probability following spikes in caudal raphe NRM neurone CM2 (Fig. 2B). The CM2-RM1 cross-correlogram also had a central peak; the two mid-line neurones tended to discharge synchronously. Consideration of the functional connectivity inferred from these and other results described subsequently is deferred until the Discussion.
Figure 2. Short time scale correlations of rostral raphe and VRG E-Decr target neurones that have opposite responses to baroreceptor stimulation with a caudal raphe NRM reference neurone.

A, respiratory cycle-triggered histograms (CTH, 786 cycles) from E-Decr neurones RM1 and RV1 with integrated phrenic nerve activity (Phr). B, cross-correlograms calculated with NRM neurone CM2 as a trigger (5311 spikes). In this and subsequent cross-correlograms, the arrows in the label following the reference and target neurone designations indicate direction of change in peak firing rate in response to baroreceptor stimulation. Left, neurone RM1 target (11 856 spikes): primary features include central peak (half-width, 50.0 ms; DI, 8.5; S, 0.49) and offset trough (lag, 48 ms; half-width, 37.5 ms; DI, 4.5; S, 0.26). Right, neurone RV1 target (9189 spikes): primary feature is an offset trough (lag, 27.5 ms; half-width, 82.5; DI, 2.2; S, 0.10).
Overall, short time scale correlations were detected between neurones in 347 of 3388 pairs (10.2%). Figure 3 is a graphical summary. The large squares show the ratios of correlated pairs to total pairs of neurones within the indicated brainstem domains. The smaller squares contain ratios for pairs with one neurone in each of the regions connected by the corresponding lines. Table 2 is a tally of pairs of neurones with short time scale correlations, arranged by pattern of respiratory modulation and recording site of the constituent neurones of the pairs.
Figure 3. Ratios of correlated pairs to total pairs for subsets of pairs composed of neurones distributed within and between the brainstem domains sampled.

Abbreviations for brainstem locations represented by large squares: RM, rostral mid-line; CM, caudal mid-line; RV, rostral ventrolateral medulla; CV, caudal ventrolateral medulla; and cRV, contralateral rostral ventrolateral medulla (dotted lines). See text for details. Smaller squares show ratios for pairs with one neurone in each of the locations connected by the corresponding lines.
Table 2.
Tally of pairs of neurones with short time scale correlations arranged by respiratory modulation and recording sites of constituent neurones
| Target neurone | ||||||||
|---|---|---|---|---|---|---|---|---|
| Reference neurone | Reference-target location | E-Aug | E-Decr | E-Other | I-Aug | I-Decr | I-Other | NRM |
| E-Aug | Mid-line-mid-line | 4 | 4 | 2 | 1 | 5 | ||
| Mid-line-VLM | 1 | 4 | 1 | 1 | 1 | |||
| VLM-VLM | ||||||||
| E-Decr | Mid-line-mid-line | 2 | 8 | 4 | 2 | |||
| Mid-line-VLM | 4 | 6 | 1 | 3 | ||||
| VLM-VLM | 1 | 1 | ||||||
| E-Other | Mid-line-mid-line | 2 | 1 | 1 | ||||
| Mid-line-VLM | 1 | 1 | ||||||
| VLM-VLM | 1 | |||||||
| I-Aug | Mid-line-mid-line | 2 | 7 | 1 | 2 | 3 | 1 | 5 |
| Mid-line-VLM | 1 | 6 | 1 | |||||
| VLM-VLM | 3 | 1 | 5 | 1 | 4 | |||
| I-Decr | Mid-line-mid-line | 2 | 1 | 1 | ||||
| Mid-line-VLM | 1 | |||||||
| VLM-VLM | 1 | 4 | 1 | |||||
| I-Other | Mid-line-mid-line | 1 | 1 | 1 | ||||
| Mid-line-VLM | 1 | 3 | 1 | |||||
| VLM-VLM | 1 | 1 | 2 | 1 | 2 | |||
| NRM | Mid-line-mid-line | 4 | 7 | 2 | 4 | 1 | 1 | 29 |
| Mid-line-VLM | 1 | 7 | 1 | 4 | 2 | 1 | 8 | |
| VLM-VLM | 5 | |||||||
Pairs of correlated neurones each composed of reference and target neurones, with the respiratory modulated firing rates indicated in the left column and top row labels, respectively. Recording sites of constituent cells are indicated in each row. VLM, ventrolateral medullary neurone.
The columns in Table 3 are arranged under three main headings that give the recording sites of neurones in each correlated pair. The primary features in the cross-correlograms define the rows, which are grouped according to the responses of the neurones to baroreceptor stimulation. For example, the first group indicates that significant short time scale correlations were found in nineteen of ninety-seven neuronal pairs in which both neurones increased their firing rate. One of those nineteen pairs was composed of two RM neurones and was characterized by a cross-correlogram with an offset peak. In some cases, numbers of occurrences of particular correlation features include a minus sign to indicate a negative time lag of feature onset with respect to the correlogram origin. This information is necessary to infer the direction of putative synaptic actions (Discussion).
Table 3.
Correlogram features for neurone pairs arranged by recording location and change in average firing rate for each constituent cell
| Mid-line-mid-line | Mid-line-VLM | VLM-VLM | |||||||||
|---|---|---|---|---|---|---|---|---|---|---|---|
| Responses | Feature | RM-RM | CM-CM | RM-CM | RM-RV | CM-RV | CM-CV | RV-RV | CV-CV | RV-CV | CV-cRV |
| Inc-Inc | CP | 2 | 4 | 1a | 1 | ||||||
| (19/97; 20%) | CT | 1 | |||||||||
| OP | 1 | 1 | 1 | 1 | 1− | ||||||
| OT | 1 | 1, 1− | |||||||||
| M | 2 | ||||||||||
| Inc-Dec | CP | 2 | 1, 1b | 1 | 1* | ||||||
| (24/198; 12%) | CT | ||||||||||
| OP | 1− | 1− | 1*, 1 | 1−, 2 | 1− | 1 | 1− | ||||
| OT | 1− | 2 * | 1−* | ||||||||
| M | 1 | 2, 1* | |||||||||
| Inc-NC | CP | 1 | 2 | 1, 1*,2a | 1* | 3, 1a | 1 | 3* | 1 | ||
| (31/422; 7%) | CT | 1 | 1* | ||||||||
| OP | 1−b | 1 | 1−b | 1− | 1 | 1* | |||||
| OT | 2d | 1− | 1−* | 1e | |||||||
| M | 1 | ||||||||||
| Dec-Dec | CP | 6 | 4 | 5 | 1 | ||||||
| (25/200; 13%) | CT | ||||||||||
| OP | 1 | 1− | 1 | ||||||||
| OT | 1− | 3− | |||||||||
| M | 1 | 1− | |||||||||
| Dec-NC | CP | 4 | 1, 3−*, 1b* | 3,2b | 2, 1−* | ||||||
| (43/388; 11%) | CT | 1 | 1−* | ||||||||
| OP | 1, 1a* | 1 | 1*, 1−*, 1b* | 4*,1a*, 1, 1−* 1−* | 1a* | ||||||
| OT | 1−*, 1* | 1−e | |||||||||
| M | 1 | 2 * | 1, 1c* | 1 | 1− | ||||||
| NC-NC | CP | 24, 4c,1b | 2 | 5 | 3b, 1c | 7 | 2,1a, 1b | ||||
| (103/1124; 9%) | CT | 9, 1d | 1 | ||||||||
| OP | 7, 1b | 1− | 3, 7−, 1b | 1, 1b | 4 | ||||||
| OT | 2, 2−c | 1−c | |||||||||
| M | 1 | 2 | 4,1− | 1 | 1 | ||||||
| Inc-NT | CP | 8 | 1 | 2 | 1 | 1* | |||||
| (35/222; 16%) | CT | 1, 1−* | |||||||||
| OP | 2−, 1−*, 1* | 1 | 1−*, 1* | 2−a | |||||||
| OT | 1− | 1− | 1, 1* | 1e | |||||||
| M | 1 | 1− | 2, 1− | 1 | |||||||
| Dec-NT | CP | 5, 2b* | 8 | 1, 1−*, 1a, 1a*, 1b | 1* | 1, 1* | 2 | ||||
| (44/272; 16%) | CT | 1 | 1 | ||||||||
| OP | 1 | 1− | 1 | 1* | 1 | ||||||
| OT | 1−, 1 | 1− | |||||||||
| M | 1 | 1 | 1, 1−, 1 * 2 | 2 | 2 | ||||||
| NC-NT | CP | 2, 1− | 1, 1* | 1, 1− | |||||||
| (23/465; 5%) | CT | ||||||||||
| OP | 2, 1d* | 2−, 1* | 1−, 1−a | ||||||||
| OT | 1, 1−* | 1e, 1−e*, 1−* | 1−e* | ||||||||
| M | 1 | 1−* | |||||||||
The number of correlated pairs out of the total number of pairs in a category, and the percentage of pairs that were correlated are shown in parentheses in the first column. Abbreviations: NT, not tested; CP, central peak; CT, central trough; OP, offset peak; OT, offset trough; M, multiple peaks and troughs; others as in Table 1. Keys to secondary cross-correlogram features:
offset trough to right
offset trough to left
peak offset to right
peak offset to left
central peak; a minus sign indicates that the primary feature has a negative time lag with respect to the correlogram origin. Unless otherwise indicated the response and location of the reference neurone are listed first in the row and column labels, respectively. An asterisk indicates that the order of the row (neurone response) labels should be reversed to match the column (neurone location) labels and the correct direction of the time lag of the correlogram feature.
Among the data included in the mid-line-midline column of Table 3 were seventeen pairs of baroresponsive raphe neurones that exhibited significant offset correlogram features indicative of paucisynaptic interactions. In six of these pairs, including three with offset peaks and three with offset troughs, both neurones increased their firing rates during baroreceptor stimulation. Another six pairs were each composed of two neurones that exhibited a decrease in firing rate during stimulation. Two of the correlograms had offset peaks, four offset troughs. The remaining five pairs in this subset each included neurones with opposite responses. Offset peaks with positive lags were detected in two instances when the target neurone had a reduced activity during the perturbation and in two cases when the target neurone was the cell of the pair with increased activity evoked by the stimulus. The sole offset trough in the subset indicated a short time scale decrease in the firing probability of a target neurone that also exhibited an increase in activity evoked by the stimulus.
Responses of correlated raphe neurone-VRG expiratory neurone pairs
The expiratory phase increased in 98% of forty-nine series during which perturbations of blood pressure caused significant departures from control values of expiratory phase duration. Expiratory phase prolongation was found in animals with control respiratory cycle frequencies that ranged from 10 to 26 cycles s−1; the average frequency was 16.9 ± 4.7 cycles s−1. A similar frequency of 16.2 ± 7.0 cycles s−1 was measured in trials with no change in expiratory phase duration. Eleven pairs of correlated neurones, each composed of a ventrolateral medullary expiratory neurone and a raphe cell, included at least one neurone responsive to baroreceptor stimulation (Table 4). The η2 values of these VRG neurones, reported as an index of respiratory modulation (Orem & Dick, 1983), ranged from 0.03 to 0.87.
Table 4.
Correlation features of neurone pairs that include a VLM expiratory neurone and one or more baroresponsive neurones
| VLM neurone | Response | Correlogram feature | Raphe neurone | Response | Perturbation |
|---|---|---|---|---|---|
| E-Decr | ↑ | →− | NRM | ↑ | Carotid sinus |
| E-Decr | ↑ | →+ | E-Decr | ↓ | Aortic occlusion |
| E-Decr | ↑ | +← | E-Aug | ↑ | Aortic occlusion |
| E-Aug | ↑ | →+ | NRM | ↑ | Carotid sinus |
| E-Aug | → | +⊼− | I-Other | ↓ | Carotid sinus |
| E-Decr | → | +← | NRM | ↓ | Carotid sinus |
| E-Decr | ↑ | +← | NRM | NT | Carotid sinus |
| E-Decr | ↑ | −← | E-Decr | ↓ | Phenylephrine |
| E-Decr | NT | −← | E-Decr | ↑ | Phenylephrine |
| E-Decr | NT | −← | E-Decr | ↑ | Aortic occlusion |
| E-Decr | ↑ | −← | I-Aug | ↓ | Aortic occlusion |
Responses to baroreceptor stimulation (↑, increase; ↓, decrease; →, no change; NT, not tested). Direction and sign of offset correlogram features are indicated by: ←, negative lag; →, positive lag; +, offset peak;−, offset trough.
Figure 4 shows cross-correlograms from one set of neurones responsive to unilateral inflation of the carotid sinus. The firing rates of raphe NRM neurone CM5 and VRG E-Decr cell CV4 decreased, whereas the activities of raphe NRM neurone CM4 and VRG E-Aug neurone CV5 both increased with a lag that coincided with a ‘rebound’ in the activity of CM5 and CV4. The cycle-triggered histogram documents the E-Aug discharge pattern of neurone CV5 (Fig. 4A, left). The short time scale correlation of neurones CM5 and CV5 was characterized by a central peak in their cross-correlogram (Fig. 4A, right). Spikes in both CV5 and CM5 were followed by a transient increase in the firing probability of neurone CM4 (Fig. 4B).
Figure 4. Correlations among a VRG E-Aug neurone and two caudal raphe NRM neurones responsive to carotid sinus inflation.

A, left, cycle-triggered histogram for caudal VRG neurone CV5, with integrated phrenic nerve activity. This E-Aug neurone responded with an increased firing rate to carotid sinus inflation as did NRM raphe cell CM4; the firing rate of neurone CM5 diminished during sinus inflation. Right, the CM5-CV5 cross-correlogram had a primary central peak (half-width, 30.0 ms; DI, 7.0; S, 0.19). B, left, offset peak in CV5-CM4 cross-correlogram (lag, 22.5 ms; half-width, 7.5 ms; DI, 4.5; S, 0.31). Right, CM5-CM4 cross-correlogram with offset peak (lag, 22.5 ms; half-width, 75.0 ms; DI, 5.1; S, 0.32). Number of spikes: CM5, 28 456; CV5, 17 711; CM4, 3132.
In the eleven pairs of correlated raphe-VRG expiratory neurones, six of seven tested VRG E-Decr neurones had increased firing rates during baroreceptor stimulation; none showed reduced activity. Data from five simultaneously recorded neurones that included one of these pairs are shown in Fig. 5. The peak firing rate and active phase duration of rostral VRG E-Decr neurone RV2 increased when blood pressure was elevated (Fig. 5A, second histogram; Fig. 6A, middle cycle-triggered histogram). During this same interval, the active phase duration of E-Aug neurone RV1 increased whilst its peak average rate declined (Fig. 5A, first histogram; Fig. 6A, bottom cycle-triggered histogram). The firing rate of E-Decr raphe neurone CM1 (Fig. 6C, cycle-triggered histogram) decreased during the elevated blood pressure (Fig. 5A, third histogram). The arrows indicate the correspondence between peaks and dips in the firing rate histograms of RV2 and CM1 and phrenic motor activity (Fig. 5A, bottom rate histogram). The firing probability of I-Aug neurone CM2 increased during the perturbation and fluctuated in a manner that was opposite to that of neurone CM1. The firing rate of NRM neurone RM1 increased with the elevation of blood pressure.
Figure 5. Concurrent responses of raphe and VRG neurones and integrated efferent phrenic nerve activity to an increase in blood pressure produced by phenylephrine.

A, traces (top to bottom) include firing rate histograms from rostral VRG E-Aug and E-Decr neurones RV1 and RV2, tonic E-Decr and I-Aug caudal raphe cells CM1 and CM2, NRM rostral raphe neurone RM1, blood pressure and integrated phrenic nerve activity. Dashed line provides reference for increase in blood pressure produced by phenylephrine. Arrows mark correspondence between declines in firing rate of neurone CM1 with increases in neurones RV2 and CM2, and changes in phrenic inspiratory drive and phase timing. B, phase graph documents decline in peak phrenic amplitude and prolongation of both inspiratory and expiratory phases during elevated blood pressure. Brackets to the right indicate the mean ± 2 s.d. (dotted lines) of the measured variables during the interval before stimulation.
Figure 6. Increased phase duration and firing rate of a rostral VRG E-Decr neurone during elevation of blood pressure, and a short time scale decrease in firing probability following spikes in a raphe E-Decr neurone with an opposite response.

A, cycle-triggered histograms for multiunit phrenic activity (top), E-Decr neurone RV2 (middle), and E-Aug neurone RV1 (bottom) before (dotted lines) and during elevated blood pressure shown in Fig. 5; 17 control and test cycles averaged. B, top, CM1-RV2 cross-correlogram with a primary trough to the right of the origin (arrow: lag, 7.5 ms; half-width, 3.0 ms; DI, 2.5; S, 0.11; 57 945 reference spikes, 8977 target spikes); other periodic troughs mapped bilaterally (arrows) are also present in the corresponding cumulative sum histogram (bottom; ± 2 s.d.). C, cycle-triggered histogram shows E-Decr pattern of raphe neurone CM1 (50 321 spikes; 338 cycles averaged); histogram was scaled after subtraction of an equal number of events from each bin. D, autocorrelograms for neurones CM1 and RV2; preferred interspike intervals of RV2 matched intervals between troughs in the cross-correlogram.
The neuronal responses were correlated with alterations in the respiratory motor pattern detailed in the phase graph (Fig. 5B) and cycle-triggered histogram (Fig. 6A, top). The three plots in the phase graph, from top to bottom, document a significant decrease in phrenic amplitude and increases in the durations of both the inspiratory and expiratory phases during stimulation.
Cross-correlation analysis revealed a short time scale decrease in the firing probability of neurone RV2 following spikes in CM1 (Fig. 6B, top). The intervals between the bilaterally mapped secondary troughs, also apparent in the corresponding cumulative sum histogram (Fig. 6B, bottom), matched the preferred interspike intervals of the reference neurone CM2 (Fig. 6D, top). Target neurone RV2 did not have such regular interspike intervals (Fig. 6D, bottom).
Increased rostral VRG E-Decr activity during baroreceptor stimulation in another experiment was associated with an enhanced firing probability in two rostral raphe neurones RM1 and RM2 (Fig. 7A and B), classified as E-Aug and NRM, respectively (Fig. 7C). Compared with the time to peak average activity in RM1 following stimulus onset, the maximum responses of both RV1 and RM2 were delayed (Fig. 7B). In contrast to the E-Decr neurone in Figs 5 and 6, neurone RV1 exhibited a short time scale increase in firing probability following spikes in raphe neurone RM2 (Fig. 7D, top). Neurone RM2 was also correlated with RM1; their cross-correlogram had an asymmetrical central peak and bilateral troughs; the deeper trough had a negative time lag (Fig. 7D, bottom).
Figure 7. Rostral VRG E-Decr neurone and 2 rostral raphe cells exhibit increased firing rates during elevation of blood pressure and short time scale impulse synchrony.

A, firing rate histograms for neurones RV1, RM1 and RM2, blood pressure and integrated efferent phrenic nerve activity during an interval with a transient increase in blood pressure produced by occlusion of the descending aorta. B, peristimulus time histograms document increased firing rates for each neurone averaged over 4 trials. C, cycle-triggered histograms for neurones in A (294 cycles averaged). D, top, RM2-RV1 cross-correlogram has a primary offset peak (lag, 10.5 ms; half-width, 21 ms; DI, 7.3; S, 1.04); bottom, RM2-RM1 cross-correlogram has an asymmetrical central peak (half-width, 52.5 ms; DI, 16.3; S, 2.06).
Data with implications for E-Decr neurone modulation of inspiratory activity are shown in Fig. 8. The firing rate of caudal E-Decr VRG neurone CV3 (Fig. 8C) increased during unilateral stimulation of carotid baroreceptors as arterial blood pressure and the amplitude of phrenic motor activity declined (Fig. 8A and B). A short time scale reduction in phrenic motoneurone activity following spikes in the E-Decr neurone was detected with spike-triggered averaging (Fig. 8D).
Figure 8. Response of caudal VRG E-Decr neurone and short time scale decrease in phrenic motoneurone activity.

A, firing rate histogram for E-Decr neurone CV3, blood pressure and integrated phrenic efferent activity recorded during increases in carotid sinus pressure (bar). Asterisks mark inspiratory phases with a significant reduction in peak amplitude when compared with 14 preceding control cycles. B, cumulative sum histogram of peristimulus time histogram (3 trials, ± 3 s.d.) documents average increase in CV3 firing rate during stimulation. C, cycle-triggered histogram (699 cycles) for CV3 with phrenic nerve activity. D, CV3 spike-triggered average (STA) of full-wave rectified efferent phrenic nerve activity (53 055 trigger spikes).
Responses and correlations of VRG inspiratory neurones
In fifty-nine of sixty-four (92%) trials with significant changes in peak phrenic nerve activity, the signal amplitude decreased. In these instances, the average control respiratory cycle frequency was 17.2 ± 6.1 cycles s−1. In trials with no change in peak amplitude the average frequency was 15.0 ± 5.3 cycles s−1. Fewer series (n = 40) were associated with changes in inspiratory duration, and these were about equally divided between an increase (52%) and a decrease (48%). Control respiratory cycle frequencies for these response categories were 17.6 ± 5.3 and 18.3 ± 8.5 cycles s−1, respectively. The responses and short time scale correlations of VRG inspiratory neurones were consistent with these observed changes in the motor pattern and functional relationships inferred from previous work. Fifteen pairs of correlated neurones, each composed of a ventrolateral medullary inspiratory neurone and a raphe cell, included at least one neurone responsive to baroreceptor stimulation (Table 5). Thirteen of the ventrolateral medullary inspiratory neurones decreased their firing rate during baroreceptor stimulation.
Table 5.
Correlations that include baroresponsive neurones and a VRG inspiratory neurone
| VLM neurone | Response | Correlogram feature | Raphe neurone | Response | Perturbation |
|---|---|---|---|---|---|
| I-Aug | ↓ | +← | E-Other | → | Carotid sinus |
| I-Aug | ↓ | →+ | I-Aug | ↑ | Phenylephrine |
| I-Aug | ↓ | +← | E-Decr | NT | Phenylephrine |
| I-Aug | ↓ | +← | E-Aug | ↑ | Phenylephrine |
| I-Other | → | +← | E-Decr | ↓ | Carotid sinus |
| I-Aug | ↓ | →+ | I-Aug | ↑ | Aortic occlusion |
| I-Aug | ↓ | +← | E-Decr | → | Carotid; sinus |
| I-Aug | ↓ | +← | E-Decr | → | Carotid sinus |
| I-Aug | ↓ | +← | E-Decr | → | Carotid sinus |
| I-Aug | ↓ | +← | E-Decr | → | Carotid sinus |
| I-Aug | ↓ | →+ | NRM | → | Carotid sinus |
| I-Other | ↓ | +← | NRM | → | Carotid sinus |
| I-Decr | ↓ | →− | E-Aug | → | Carotid sinus |
| I-Aug | ↓ | −← | I-Aug | → | Carotid sinus |
| I-Other | → | →− | I-Other | ↓ | Carotid sinus |
See Table 4 for definitions.
Of the three neurones classified as I-Other, two showed no change in activity during baroreceptor stimulation. Firing rate histograms for two neurones, blood pressure and phrenic activity during unilateral stimulation of carotid sinus baroreceptors are shown in Fig. 9A. The inspiratory phase of the indicated respiratory cycle (asterisk) was significantly prolonged, having a duration > 2 s.d. above the mean of thirteen consecutive control phases in cycles immediately preceding the stimulus interval. This transient slowing of cycle frequency was associated with a decrease in the firing rate of the tonic caudal raphe E-Decr neurone CM7; the average response over all trials is documented in the cumulative sum histogram (Fig. 9B). The rostral VRG I-Other neurone, RV6 began to discharge late in the expiratory phase and reached peak average firing rate near the onset of inspiration. This I–E/I phase-spanning average discharge pattern is documented in the cycle-triggered histogram with integrated phrenic nerve activity (Fig. 9C). An offset peak with a positive lag in the CM7-RV6 cross-correlogram documents a transient increased firing probability in RV6 following spikes in the raphe neurone (Fig. 9D).
Figure 9. Responses and short time scale correlation between caudal raphe and rostral VRG inspiratory neurone.

A, firing rate histograms for VRG I-Other (I–E/I) neurone RV6 and raphe tonic E-Decr neurone CM7, blood pressure and phrenic nerve activity; bar indicates elevated carotid sinus pressure. Asterisk indicates prolonged inspiratory phase. B, cumulative sum shows a decrease in average firing rate of CM7 (3 trials, ± 3 s.d.). C, respiratory cycle-triggered histogram for RV6 (85 cycles) with integrated phrenic nerve activity. D, CM7-RV6 cross-correlogram with primary offset peak (lag, 7.5 ms; half-width, 2.5 ms; DI, 4.1; S, 0.43).
The firing rates of two correlated VRG inspiratory neurones during unilateral stimulation of carotid baroreceptors are documented in Fig. 10. Of the two, the activity of the caudal VRG inspiratory neurone CV1 more closely followed changes in phrenic nerve activity. Note the spontaneous, transient high firing rate of both the neurone and phrenic nerve activity (arrows) prior to the onset of the stimulus. The peak firing rate of CV1 was reduced during baroreceptor stimulation; rostral neurone RV1 showed no change in firing rate. Stimulation lowered blood pressure and reduced the peak amplitude of integrated phrenic motoneurone activity (Fig. 10A). The phase graph (Fig. 10B) documents cycles with reduced phrenic amplitude compared with the preceding thirty-one cycles, excluding the cycle marked with the arrow in Fig. 10A. The two cycles with peak amplitudes of more than 2 s.d. below the average control value are marked with asterisks in Fig. 10B. Caudal neurone CV1 had an increased firing probability following spikes in the rostral cell RV1 (Fig. 10C). The interval between the primary peak and the bilaterally mapped secondary peaks in the cross-correlogram matched the time between the origin of the autocorrelogram for RV1 and the first peak.
Figure 10. Different responses of correlated rostral and caudal VRG inspiratory neurones to carotid baroreceptor stimulation.
A, firing rate histograms for two inspiratory neurones, blood pressure and integrated efferent phrenic nerve activity; bar indicates a transient increase in carotid sinus pressure. Arrows indicate spontaneous, transient high firing rate prior to stimulation. B, phase graph shows reduction in peak phrenic amplitude during stimulus; see text for details. Asterisks in A and B indicate cycles with reduced peak phrenic amplitudes. C, RV1-CV1 cross-correlogram with primary offset peak (lag, 0.5 ms; half-width, 1.5 ms; DI, 15.4; S, 1.24), and autocorrelograms for RV1 and CV1.
A decline in the amplitude of phrenic nerve activity was associated with decreased activity in some rostral as well as caudal VRG inspiratory neurones. Figure 11A shows firing rate histograms of a bulbospinal I-Aug neurone, RV1, and a caudal medullary raphe neurone, CM1, recorded simultaneously during an interval that included two perturbations of blood pressure by transient occlusion of the descending aorta. The firing rate of CM1 increased during each perturbation, whilst the firing rate of RV1 decreased (Fig. 11B). Antidromic stimulation detected an axonal projection from neurone RV1 to at least the third cervical segment (Fig. 11C). The interval between the peak of the stimulus artifact and the antidromically evoked spikes was 2 ms. Spike-triggered averaging of the rectified phrenic nerve signal revealed a transient peak in averaged phrenic motoneurone activity (Fig. 11D). To improve the estimate of peak onset time, the bottom average was calculated after subtraction of bin counts in the top average, shifted by an amount equal to the period of the high frequency oscillation in the top average. The time to peak onset was approximately 3.5 ms. The cross-correlogram and corresponding cumulative sum histogram (Fig. 11E) show that I-Aug raphe neurone CM1 also had a short time scale increase in firing probability following spikes in the VRG I-Aug neurone.
Figure 11. Concurrent responses and short time scale correlations of caudal raphe and VRG bulbospinal inspiratory neurones.
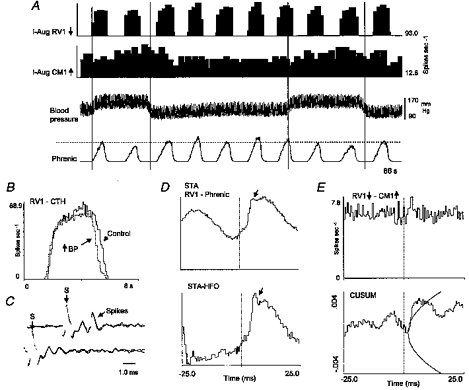
A, firing rate histograms for neurones RV1 and CM1, blood pressure and phrenic nerve activity recorded simultaneously during 2 successive transient increases in blood pressure produced by occlusion of the descending aorta. Vertical lines indicate stimulus intervals; dashed line facilitates comparison of peak phrenic amplitudes in each stimulus interval with peaks at other times. B, cycle-triggered histogram shows decline in average peak firing rate of neurone RV1 during the perturbation; average of 9 cycles in each condition (BP, blood pressure). C, positive collision test for axonal projection of neurone RV1 to the third cervical spinal segment. Top two traces show superimposed antidromic spikes, which are absent in the bottom traces with shortened stimulus delay. Stimulus artifacts are labelled (S) in each set of traces. D, top, averaged full-wave rectified efferent phrenic nerve activity triggered by spikes of neurone RV1; bottom, average after subtraction of average shifted by interval between peaks in high frequency oscillation (HFO). Arrows indicate first post-trigger peak in averages. E, RV1-CM1 cross-correlogram and cumulative sum histogram (± 3 s.d.) with primary offset peak (lag, 3.0 ms; half-width, 1.0 ms; DI, 3.6; S, 0.25; number of spikes: RV1, 633 98l; CM1, 11 955).
DISCUSSION
The responses and correlations reported here extend previous results on effective connectivity among raphe neurones (Lindsey et al. 1992, 1994, 1997; Morris et al. 1996a), guide placement of the baroresponsive neurones into functional contexts, and permit inferences about the transmission and transformation of information from baroreceptors to the respiratory network. The increased expiratory duration and decrease in inspiratory drive during baroreceptor stimulation were the most consistent changes in the respiratory motor pattern measured in this study. The direction of change in inspiratory duration was more variable.
Similar results were observed with three different standard methods for stimulating baroreceptors and in preparations with a wide range of control respiratory cycle frequencies. In the subset of five animals in which infusion of phenylephrine was used to increase blood pressure, the possibility of central actions of the drug must be considered. Potential effects include an increase in the gain of the baroreflex (Imaizumi et al. 1984) and modulation of the respiratory rhythm (Arata et al. 1998). While a central influence is possible, an earlier study suggested that it is unlikely (Yen & Blum, 1984). Furthermore, both the observed changes in the respiratory motor pattern and the responses of respiratory modulated neurones were qualitatively similar to those measured in response to the other stimulus protocols. Indeed, the data confirm previous reports on respiratory pattern modulation and VRG neurone firing rates (Heymans & Bouckaert, 1930; Bishop, 1974; Richter & Seller, 1975; Grunstein et al. 1975). All identified bulbospinal respiratory modulated neurones had diminished firing rates when blood pressure was elevated, consistent with reduced drive to inspiratory and expiratory motoneurones. The correlational data also support previously proposed roles for disinhibition and disfacilitation in the regulation of decrementing expiratory and inspiratory neurones, respectively.
It is well established that some medullary raphe neurones respond to perturbations of blood pressure (Morrison & Gebber, 1984; Yen & Blum, 1984). Other studies have detailed respiratory modulated discharge patterns of raphe neurones (Lindsey et al. 1992). The present results demonstrate that some raphe neurones have both of these properties and functional linkages with other raphe and ventral respiratory group neurones. The results are also consistent with changes in inspiratory drive and respiratory phase durations produced by stimulation of the brainstem mid-line (Millhorn, 1986; Lalley et al. 1997).
The schematic circuits in Fig. 12A and B represent simple models of anatomical connectivity sufficient to generate the detected non-random temporal relationships illustrated in the Results. The large labelled circles correspond to populations of neurones with the indicated respiratory modulation and responses to baroreceptor stimulation. The lines and small circles represent synaptic actions inferred from features in the cross-correlograms and are congruent with data from simulations of neurones with known connections (Moore et al. 1970; Aertsen & Gerstein, 1985; Davies et al. 1985). Such catalogues of correlogram interpretations and the inferred functional connectivity described subsequently are intended to serve as guides for the reader so that further inferences may be drawn from the data tabulated in the Results. Cross-correlation analysis does not allow a unique determination of a neural circuit; firing rate changes due to direct, indirect or parallel paths are measured. The method therefore provides a measure of effective connectivity among monitored neurones. Advantages and limitations have been considered elsewhere (Aertsen & Gerstein, 1985; Lindsey et al. 1994).
Figure 12. Graphical summaries of inferred effective connectivity.
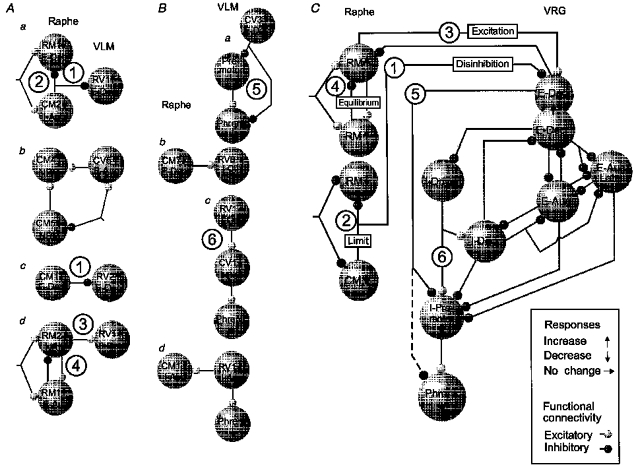
A, functional connections among raphe neurones and VLM expiratory neurones inferred from data illustrated in the indicated figures. Each neurone represented by a large circle is identified by a label that includes respiratory modulation and response to elevated arterial blood pressure (arrow). Aa, Figs 1 and 2; Ab, Fig. 4; Ac, Figs 5 and 6; Ad, Fig. 7. B, functional connections among raphe neurones and VLM inspiratory neurones inferred from data illustrated in the indicated figures. Ba, Fig. 8; Bb, Fig. 9; Bc, Fig. 10; Bd, Fig. 11. C, summary of inferred actions among raphe and ventral respiratory group neurones during baroreceptor stimulation. Circled numbers label key hypotheses suggested by the results. See text for details.
The inferred actions described below are consistent with predictions derived from perturbations of populations in a simulated respiratory network which generated changes in output similar to those observed in this work (Balis et al. 1994). The graphical summary of serial and parallel connections inferred from the Results includes components of that model (Fig. 12C). Two predictions from the earlier work are most relevant to the present results. First, increased activity of E-Decr neurones prolongs the expiratory phase duration; the active phases of both the E-Decr and E-Aug populations are also prolonged. Second, excitation of the I–E/I population prolonged the inspiratory phase. This result implied that two changes associated with elevated inspiratory drive, increased integrated phrenic amplitude and a reduced inspiratory phase duration, are influenced differentially by parallel modulation of pre-motor neurones and their functionally antecedent drivers. This hypothesis has received previous experimental support (Morris et al. 1996b).
The present results support the hypothesis of baroreceptor-mediated modulatory actions of raphe neurones on VRG expiratory neurones (Fig. 12A). The correlations in Fig. 2 suggested divergent inhibitory actions of a caudal raphe neurone on both rostral raphe and rostral ventrolateral medullary E-Decr neurones (Fig. 12Aa). Both raphe neurones also appeared to have been influenced by a shared input. The increased activity of VRG E-Decr neurone RV1 during baroreceptor stimulation would be a consequence of disinhibition following the reduced activity in the caudal raphe cell CM2. The parallel inhibitory action of CM2 on the rostral raphe neurone RM1 would serve to limit the decline in activity in response to baroreceptor stimulation.
Offset correlogram peaks in Fig. 4 suggested convergent excitation of raphe neurone CM4 by both raphe and VRG neurones (Fig. 12Ab). Opposite changes in the firing rates of neurones CM5 and CV5 during baroreceptor stimulation suggest that CV5 would relay baroreceptor actions to CM4 whilst the excitatory effect of CM5 would be diminished. The input with opposite actions on CM5 and CV5 in Fig. 12Ab is intended the represent the functional consequences of baroreceptor stimulation. The central peak in the CM5-CV5 cross-correlogram (Fig. 4A) suggests a shared input with similar rather than opposite actions on the two neurones (Moore et al. 1970). Thus the peak may reflect, for example, other prominent inputs or excitation of CV5 and transient disfacilitation rather than inhibition of CM5 with baroreceptor stimulation.
The firing rate of caudal raphe E-Decr neurone CM1 decreased at times when VRG E-Decr neurone RV2 activity increased. Those responses and the inferred inhibitory action of neurone CM1 on neurone RV2 (Figs 5 and 6) suggest that disinhibition increased rostral VRG E-Decr neurone activity (Fig. 12Ac).
The decline in the peak firing rate and prolonged activity of E-Aug neurone RV1 (Fig. 6) match consequences of increased E-Decr neurone activity predicted by network models and numerical simulations (Balis et al. 1994; Bianchi et al. 1995).
The connectivity in Fig. 12Ad inferred from the data in Fig. 7 supports the hypothesis that excitation promotes the increased activity in VRG E-Decr neurones associated with elevated blood pressure. Both the raphe neurone RM2 and the rostral VRG E-Decr neurone RV1 had increased firing rates during baroreceptor stimulation. The data are also consistent with the possibility that raphe neurone RM1 inhibited RM2. This putative action would limit the increase in activity of all three neurones during baroreceptor stimulation.
The arrangement in Fig. 12Ba shows a parsimonious model to account for the transient decrease in phrenic motor neurone activity following spikes in caudal VRG E-Decr neurone CV3 (Fig. 8). Two parallel routes of action are suggested. First, the expiratory neurone may directly inhibit the inferred pre-motor inspiratory neurone. The trough in the spike-triggered average of phrenic nerve activity would then be due to disfacilitation, secondary to the inhibition. The width of the trough in this average and other cross-correlational evidence for inhibition of pre-motor inspiratory neurones by caudal VRG E-Decr expiratory neurones are consistent with this possibility (Baekey et al. 1997). Alternatively, the E-Decr neurone could act directly at the spinal level.
The results in Fig. 9 support the hypothesis that raphe neurones provide a source of excitatory drive to rostral VRG inspiratory neurones with an I–E/I discharge pattern (Fig. 12Bb). Such neurones have been proposed (Segers et al. 1987; Balis et al. 1994; Morris et al. 1996b) to play a role in defining inspiratory phase duration and drive to other I-Decr and I-Aug neurones (Fig. 12C). That the peak average firing rate of neurone RV6 did not change during baroreceptor stimulation does not negate the possibility of an excitatory action by the raphe E-Decr neurone CM7. The decline in the mean firing rate of CM7 was small; the influence of the connection may be small and counteracted by other parallel influences that prolong the inspiratory phase. Note that the inferred serial excitatory actions in Fig. 12Bc were derived from another example of a rostral VRG inspiratory neurone that did not change firing rate during baroreceptor stimulation whilst its presumptive caudal VRG target neurone did (Fig. 10).
The connections in Fig. 12Bd, inferred from the data in Fig. 11, have the bulbospinal neurone RV1 acting on both a raphe neurone and phrenic motoneurones. The peak in the spike-triggered average of phrenic nerve activity is consistent with neurone RV1 having a premotor function. Because the average measures changes due to direct and indirect parallel paths, presynaptic synchronization of shared inputs that include or are correlated with RV1 could also account for the result (Davies et al. 1985). The inferred excitation of the raphe neurone by efference copy suggests that the decreased activity of the bulbospinal neurone during baroreceptor stimulation limited the concurrent increase in raphe activity by disfacilitation.
Summary of functional implications
The results suggest that a distributed raphe network contributes to the regulation of breathing in response to fluctuations in blood pressure. The observed modulation of the respiratory motor pattern could serve to influence venous return and cardiac output through changes in intrathoracic pressure as well as adjust ventilation. Figure 12C is a graphical summary of the hypotheses suggested and supported by the results. Increased VRG E-Decr activity contributes to the baroreceptor-mediated changes in the respiratory motor pattern. The circled numbers in Fig. 12C indicate proposed actions based on neuronal responses and the inferred connectivity illustrated in the correspondingly numbered examples in Figs. 12A and B. Both disinhibition (1) and excitation (3) contribute to increased E-Decr activity. E-Decr neurones reduce inspiratory drive (5) and influence inspiratory phase timing through actions on I-Driver neurones that excite other inspiratory neurones (6).
The inclusion of two E-Decr neurones indicates that cells so classified do not constitute a homogeneous population; E-Decr neurones recorded along the rostral-caudal extent of the VRG-Bötzinger region exhibit various discharge patterns (Lindsey et al. 1987; Orem & Trotter, 1992). The η2 values for E-Decr neurones with short time scale correlations ranged from low values reported for E-Decr neurones in awake behaving animals (Orem & Trotter, 1992) to values approaching those of phasic E-Decr neurones in numerical simulations of the respiratory network that, in part, motivated this work (Balis et al. 1994). Cross-correlation, spike-triggered averaging and related approaches used in this study overcome some of the shortcomings of classification schemes based solely upon discharge patterns of single neurones and their responses, which do not address connectivity.
The results are consistent with the hypothesis that a central system operates in parallel with negative feedback from peripheral receptors. Some combinations of responses to baroreceptor stimulation and inferred synaptic actions suggest that the network operates to limit the duration and magnitude of reflexly induced changes in respiratory activity as well as to promote responses to changes in blood pressure (cf. Lindsey et al. 1992; Morris et al. 1996a). The connections with opposite actions (4) between raphe neurones and between a raphe cell and the E-Decr neurone in Fig. 12C represent such relationships. Also consonant with this idea are both inferred inhibitory connections between neurones with similar responses (2) and excitatory links between neurones with opposite responses (Fig. 12Ab). These hypothesized mechanisms may be reflected in the delayed responses of some simultaneously recorded neurones relative to others; early responses may be truncated by actions of neurones with delayed responses. Different delays in response times are also consistent with the possibility that the neurones are excited through parallel channels with different thresholds, conduction velocities, routes, or synaptic mechanisms (Seagard et al. 1990; Ezure & Tanaka, 1996; Rogers et al. 1996).
The inferred functional linkages among baroresponsive raphe neurones and the respiratory network suggest specific network loci in which abnormalities could disrupt breathing. A better understanding of these brainstem systems will require recording of many neurones simultaneously in order to measure concurrent responses to the same stimuli under identical conditions and to detect dynamic associations and emergent properties of neuronal groups (Lindsey et al. 1994, 1997). Evaluation of interconnected assemblies can then help to define large-scale network models.
Acknowledgments
This work was supported by grant NS19814 from the National Institute of Neurological Disorders and Stroke. The authors thank J. Gilliland, C. Orsini, T. Krepel and R. McGowan for excellent technical assistance.
References
- Aertsen AMHJ, Gerstein GL. Evaluation of neuronal connectivity: sensitivity of cross-correlation. Brain Research. 1985;340:341–354. doi: 10.1016/0006-8993(85)90931-x. 10.1016/0006-8993(85)90931-X. [DOI] [PubMed] [Google Scholar]
- Arata A, Onimaru H, Homma I. The adrenergic modulation of firings of respiratory rhythm generating neurons in medulla-spinal cord preparation from newborn rat. Experimental Brain Research. 1998;119:399–408. doi: 10.1007/s002210050355. 10.1007/s002210050355. [DOI] [PubMed] [Google Scholar]
- Baekey DM, Morris KF, Li Z, Lindsey BG, Shannon R. Functional connectivity among ventral respiratory group neurons and responses during fictive cough. Society for Neuroscience Abstracts. 1997;23:724. [Google Scholar]
- Balis UJ, Morris KF, Koleski J, Lindsey BG. Simulations of a ventrolateral medullary neural network for respiratory rhythmogenesis inferred from spike train cross-correlation. Biological Cybernetics. 1994;70:311–327. doi: 10.1007/BF00200329. [DOI] [PubMed] [Google Scholar]
- Bernard DG, Li A, Nattie EE. Evidence for central chemoreception in the midline raphe. Journal of Applied Physiology. 1996;80:108–115. doi: 10.1152/jappl.1996.80.1.108. [DOI] [PubMed] [Google Scholar]
- Bianchi AL, Denavit-Saubie M, Champagnat J. Central control of breathing in mammals: neuronal circuitry, membrane properties, and neurotransmitters. Physiological Reviews. 1995;75:1–45. doi: 10.1152/physrev.1995.75.1.1. [DOI] [PubMed] [Google Scholar]
- Bishop B. Carotid baroreceptor modulation of diaphragm and abdominal muscle activity in the cat. Journal of Applied Physiology. 1974;36:12–19. doi: 10.1152/jappl.1974.36.1.12. [DOI] [PubMed] [Google Scholar]
- Cohen MI, Piercey MF, Gootman PM, Wolotsky P. Synaptic connections between medullary inspiratory neurons and phrenic motoneurons as revealed by cross-correlation. Brain Research. 1974;81:319–324. doi: 10.1016/0006-8993(74)90946-9. [DOI] [PubMed] [Google Scholar]
- Davey NJ, Ellaway PH, Stein RB. Statistical limits for detecting change in the cumulative sum derivative of the peristimulus time histogram. Journal of Neuroscience Methods. 1986;17:153–166. doi: 10.1016/0165-0270(86)90068-3. 10.1016/0165-0270(86)90068-3. [DOI] [PubMed] [Google Scholar]
- Davies JGMcF, Kirkwood PA, Sears TA. The detection of monosynaptic connexions from inspiratory bulbospinal neurones to inspiratory motoneurones in the cat. The Journal of Physiology. 1985;368:33–62. doi: 10.1113/jphysiol.1985.sp015845. [DOI] [PMC free article] [PubMed] [Google Scholar]
- Ezure K, Tanaka I. Contralateral projections of barosensitive neurons of the nucleus solitarii. Neuroscience Letters. 1996;219:37–40. doi: 10.1016/s0304-3940(96)13169-4. 10.1016/S0304-3940(96)13169-4. [DOI] [PubMed] [Google Scholar]
- Gabriel M, Seller H. Excitation of expiratory neurones adjacent to the nucleus ambiguus by carotid sinus baroreceptor and trigeminal afferents. Pflügers Archiv. 1969;313:1–10. doi: 10.1007/BF00586323. [DOI] [PubMed] [Google Scholar]
- Grunstein MM, Derenne JP, Milic-Emili J. Control of depth and frequency of breathing by baroreceptor stimulation in cats. Journal of Applied Physiology. 1975;39:395–404. doi: 10.1152/jappl.1975.39.3.395. [DOI] [PubMed] [Google Scholar]
- Harper RM, Bandler R. Finding the failure mechanism in Sudden Infant Death Syndrome. Nature Medicine. 1998;4:157–158. doi: 10.1038/nm0298-157. [DOI] [PubMed] [Google Scholar]
- Harper RM, Gozal D, Aljadeff G, Carroll JL, Dong XW, Rector DM. Pressor-induced responses of the cat ventral medullary surface. American Journal of Physiology. 1995;268:R324–333. doi: 10.1152/ajpregu.1995.268.2.R324. [DOI] [PubMed] [Google Scholar]
- Heymans C, Bouckaert JJ. Sinus caroticus and respiratory reflexes. I. Cerebral blood flow and respiration. Adrenaline apnoea. The Journal of Physiology. 1930;69:255–266. doi: 10.1113/jphysiol.1930.sp002648. [DOI] [PMC free article] [PubMed] [Google Scholar]
- Imaizumi T, Brunk SD, Gupta BN, Thames MD. Central effects of intravenous phenylephrine on baroreflex control of renal nerves. Hypertension. 1984;6:906–914. doi: 10.1161/01.hyp.6.6.906. [DOI] [PubMed] [Google Scholar]
- Lalley PM, Benacka R, Bischoff AM, Richter DW. Nucleus raphe obscurus evokes 5-HT-1A receptor-mediated modulation of respiratory neurons. Brain Research. 1997;747:156–159. doi: 10.1016/s0006-8993(96)01233-4. [DOI] [PubMed] [Google Scholar]
- Lindsey BG, Arata A, Morris KF, Hernandez YM, Shannon R. Baroreceptor actions in cardiorespiratory neural networks. Society for Neuroscience Abstracts. 1991;17:339. [Google Scholar]
- Lindsey BG, Hernandez YM, Morris KF, Shannon R, Gerstein GL. Respiratory related neural assemblies in the brainstem midline. Journal of Neurophysiology. 1992;67:905–922. doi: 10.1152/jn.1992.67.4.905. [DOI] [PubMed] [Google Scholar]
- Lindsey BG, Morris KF, Shannon R, Gerstein GL. Repeated patterns of distributed synchrony in neuronal assemblies. Journal of Neurophysiology. 1997;78:1714–1719. doi: 10.1152/jn.1997.78.3.1714. [DOI] [PubMed] [Google Scholar]
- Lindsey BG, Segers LS, Morris KF, Hernandez YM, Saporta S, Shannon R. Distributed actions and dynamic associations in respiratory-related neuronal assemblies of the ventrolateral medulla and brainstem midline: Evidence from spike train analysis. Journal of Neurophysiology. 1994;72:1830–1851. doi: 10.1152/jn.1994.72.4.1830. [DOI] [PubMed] [Google Scholar]
- Lindsey BG, Segers LS, Shannon R. Functional associations among simultaneously monitored lateral medullary respiratory neurons in the cat. II. Evidence for inhibitory actions of expiratory neurons. Journal of Neurophysiology. 1987;57:1101–1117. doi: 10.1152/jn.1987.57.4.1101. [DOI] [PubMed] [Google Scholar]
- Lipski J, McAllen RM, Trzebski A. Carotid baroreceptor and chemoreceptor inputs onto single medullary neurones. Brain Research. 1976;107:132–136. doi: 10.1016/0006-8993(76)90101-3. [DOI] [PubMed] [Google Scholar]
- Marks JD, Harper RM. Differential inhibition of the diaphragm and posterior cricarytenoid muscles induced by transient hypertension across sleep states in intact cats. Experimental Neurology. 1987;95:730–742. doi: 10.1016/0014-4886(87)90312-8. [DOI] [PubMed] [Google Scholar]
- Millhorn DE. Stimulation of raphe (obscurus) nucleus causes long-term potentiation of phrenic nerve activity in cat. The Journal of Physiology. 1986;381:169–179. doi: 10.1113/jphysiol.1986.sp016320. [DOI] [PMC free article] [PubMed] [Google Scholar]
- Moore GP, Segundo JP, Perkel DH, Levitan H. Statistical signs of synaptic interaction in neurons. Biophysical Journal. 1970;10:876–899. doi: 10.1016/S0006-3495(70)86341-X. [DOI] [PMC free article] [PubMed] [Google Scholar]
- Morris KF, Arata A, Shannon R, Lindsey BG. Long-term facilitation of phrenic nerve activity in the cat: responses and short-time scale correlations of medullary neurones. The Journal of Physiology. 1996a;490:463–480. doi: 10.1113/jphysiol.1996.sp021158. [DOI] [PMC free article] [PubMed] [Google Scholar]
- Morris KF, Arata A, Shannon R, Lindsey BG. Inspiratory drive and phase duration during carotid chemoreceptor stimulation in the cat: medullary neurone correlations. The Journal of Physiology. 1996b;491:241–259. doi: 10.1113/jphysiol.1996.sp021212. [DOI] [PMC free article] [PubMed] [Google Scholar]
- Morrison SF, Gebber GL. Raphe neurons with sympathetic-related activity: baroreceptor responses and spinal connections. American Journal of Physiology. 1984;246:R338–348. doi: 10.1152/ajpregu.1984.246.3.R338. [DOI] [PubMed] [Google Scholar]
- Orem J, Dick T. Consistency and signal strength of respiratory neuron activity. Journal of Neurophysiology. 1983;50:1098–1107. doi: 10.1152/jn.1983.50.5.1098. [DOI] [PubMed] [Google Scholar]
- Orem J, Trotter RH. Post-inspiratory neuronal activities during behavioral control, sleep, and wakefulness. Journal of Applied Physiology. 1992;72:2369–2377. doi: 10.1152/jappl.1992.72.6.2369. [DOI] [PubMed] [Google Scholar]
- Perkel DH, Gerstein GL, Moore GP. Neuronal spike trains and stochastic point processes II. Simultaneous spike trains. Biophysical Journal. 1967;7:419–440. doi: 10.1016/S0006-3495(67)86597-4. [DOI] [PMC free article] [PubMed] [Google Scholar]
- Richter DW, Seller H. Baroreceptor effects on medullary respiratory neurones of the cat. Brain Research. 1975;86:168–171. doi: 10.1016/0006-8993(75)90651-4. [DOI] [PubMed] [Google Scholar]
- Rogers RF, Rose WC, Schwaber JS. Simultaneous encoding of carotid sinus pressure and dP/dt by NTS target neurons of myelinated baroreceptors. Journal of Neurophysiology. 1996;76:2644–2660. doi: 10.1152/jn.1996.76.4.2644. [DOI] [PubMed] [Google Scholar]
- Seagard JL, Van brederode JF, Dean C, Hopp FA, Gallenberg LA, Kampine JP. Firing characteristics of single-fiber carotid sinus baroreceptors. Circulation Research. 1990;66:1499–1509. doi: 10.1161/01.res.66.6.1499. [DOI] [PubMed] [Google Scholar]
- Segers LS, Shannon R, Saporta S, Lindsey BG. Functional associations among simultaneously monitored lateral medullary respiratory neurons in the cat. I. Evidence for excitatory and inhibitory actions of inspiratory neurons. Journal of Neurophysiology. 1987;57:1078–1100. doi: 10.1152/jn.1987.57.4.1078. [DOI] [PubMed] [Google Scholar]
- Spyer KM. Central nervous mechanisms contributing to cardiovascular control. The Journal of Physiology. 1994;474:1–19. doi: 10.1113/jphysiol.1994.sp019997. [DOI] [PMC free article] [PubMed] [Google Scholar]
- Wilson CR, Manchanda S, Crabtree D, Skatrud JB, Dempsey JA. An induced blood pressure rise does not alter airway resistance in sleeping humans. Journal of Applied Physiology. 1998;84:269–276. doi: 10.1152/jappl.1998.84.1.269. [DOI] [PubMed] [Google Scholar]
- Yen CT, Blum PL. Response properties and functional organization of neurons in midline region of medullary reticular formation of cats. Journal of Neurophysiology. 1984;52:961–979. doi: 10.1152/jn.1984.52.5.961. [DOI] [PubMed] [Google Scholar]