

Abstract
The contribution of the sarcoplasmic reticulum (SR) and Na+ −Ca2+ exchanger to intracellular Ca2+ regulation in mouse cardiac myocytes was investigated by measuring contraction after variable rest intervals, rapid cooling contractures (RCCs) and fast application of caffeine. The results obtained showed differences from other species in the roles played by the SR and the Na+ −Ca2+ exchanger. They suggest that in mouse ventricular myocytes there is significant Ca2+ entry via the exchanger during rest and during the latter part of the Ca2+ transient.
In cardiac myocytes isolated from transgenic mice overexpressing the cardiac Na+−Ca2+ exchanger the time to peak and relaxation of twitches and RCCs were faster than in control littermates. The decline of Ca2+, assessed by indo-1 fluorescence, was faster in transgenic myocytes even in the absence of Na+ and Ca2+ in the superfusing solution. This suggests that SR Ca2+ uptake is faster in these myocytes. However, no difference in the expression of SERCA2a, phospholamban or calsequestrin measured with Western blotting could be found in the two groups.
We measured SR Ca2+ content by integrating the caffeine-induced transient inward current. The amount of Ca2+ stored in the SR of transgenic mouse myocytes was 69 % greater than in non-transgenic littermates. The increased SR Ca2+ content may be responsible for the faster rate of SR Ca2+ release and uptake in cells from transgenic mice.
We performed experiments to assess whether the reversal potential of the Na+−Ca2+ exchanger (ENa-Ca) was different in transgenic cardiac cells. We measured a Ni2+-sensitive current elicited by voltage ramps in non-dialysed myocytes. The current-voltage relationship showed no difference in the reversal potential of the Na+−Ca2+ exchanger in transgenic and control myocytes. This suggests that the effects on the SR Ca2+ content in transgenic cardiac myocytes can be ascribed to the overexpression of the exchanger and are not secondary to changes in intracellular diastolic Ca2+ and Na+.
Sarcoplasmic reticulum (SR) Ca2+ content is one of the major determinants of contraction in cardiac muscle (for a review see Bers, 1991). The amount of Ca2+ stored in the SR determines, for a certain amount of trigger Ca2+, the amount of Ca2+ released (‘gain’ of E-C coupling; Bassani et al. 1995; Janczewski et al. 1995) and ultimately the size of contraction. This explains several physiological findings, one being the relationship between the SR Ca2+ content and the rest decay demonstrated in rabbit (Bers, 1989) and guinea-pig cardiac muscle (Terracciano et al. 1995). The SR Ca2+ content also accounts for the force-frequency behaviour demonstrated in several species (Bers, 1991) and determines the rate of SR Ca2+ release (Terracciano et al. 1995), thereby regulating the speed of contraction. The SR Ca2+ content primarily depends on the balance between the amount of Ca2+ released and the amount re-sequestered by the SR. These, in turn, are dependent on the amount of Ca2+ entry from the extracellular space (e.g. Bers, 1985; Bassani et al. 1994; Terracciano & MacLeod, 1997a) and competition with other cytoplasmic Ca2+ extrusion mechanisms, such as the Na+−Ca2+ exchanger.
The SR Ca2+ content depends on the duration of the action potential (Terracciano et al. 1997) suggesting that voltage-dependent mechanisms can be involved in the regulation of SR Ca2+ content. Two obvious voltage-dependent routes for Ca2+ entry into the cell are (1) via sarcolemmal Ca2+ channels and (2) via reverse mode Na+−Ca2+ exchange. As the action potential is prolonged there may be more Ca2+ entry via sarcolemmal Ca2+ channels and since the cells are at more positive membrane potentials for longer periods reverse mode exchange will be favoured and help to load the SR. In other words, there may be a close dependence of SR Ca2+ content on the activity of the Na+−Ca2+ exchanger. Examples of this are the relationship between intracellular [Na+] and contraction (e.g. Eisner, 1990) and the mechanism of action of cardiac glycosides (Lee, 1985). In the latter case, a link between Na+ pump blockade, a shift in the Na+−Ca2+ exchanger activity and increased SR Ca2+ content has been shown (Bers & Bridge, 1988). The relationship between Na+−Ca2+ exchange and cardiac relaxation is very well known (Bers, 1991; Bassani et al. 1994).
Finally, recent reports have shown that expression of the cardiac Na+−Ca2+ exchanger is increased (Studer et al. 1994; Hasenfuss et al. 1997) in some pathophysiological conditions, such as cardiac hypertrophy and failure, despite a slower rate of relaxation (Siri et al. 1991; Beuckelmann et al. 1992; Naqvi & MacLeod, 1994). Preliminary observations have shown that changes in intracellular Na+ may also alter the function of the exchanger despite its overexpression (Pieske et al. 1997; Gray et al. 1997).
We have used transgenic mice overexpressing the Na+−Ca2+ exchanger to investigate the effects of the overexpression of the Na+−Ca2+ exchanger on SR Ca2+ release, SR Ca2+ uptake and the resulting SR Ca2+ content. The initial characterization of the effects of overexpression of the Na+−Ca2+ exchanger on contraction has recently been described (Adachi-Akahane et al. 1997; Yao et al. 1998).
methods
Transgenic mice overexpressing the Na+−Ca2+ exchanger
Production and characterization of transgenic (TR) mice overexpressing the Na+−Ca2+ exchanger have been described in detail elsewhere (Adachi-Akahane et al. 1997). In brief, a transgene construct consisting of the open reading frame of the canine cardiac Na+−Ca2+ exchanger (Nicoll et al. 1990) under the control of the α-myosin heavy chain (α-MHC) promoter was used. The SV40 transcriptional terminator was inserted downstream of α-MHC to provide a polyadenylation signal. The transgene was purified and microinjected into the nuclei of C57Bl/6xC3HF1 mice. Southern blot analysis of genomic DNA extracted from tail clippings was used to demonstrate the presence of the construct (TR mice). Littermates which did not show the transgene construct were used as control (NON mice).
Adachi-Akahane et al. (1997), using Northern blot, Western blot analysis and indirect immunofluorescent labelling, have shown that mice produced with this method overexpress the Na+−Ca2+ exchanger in the heart. They have also investigated the function of the exchanger and shown that exchanger-mediated Ca2+ transport is increased threefold in both inward and outward modes in cardiac myocytes isolated from the TR compared with NON mice.
Protein determination
Ventricular tissue was removed from the hearts of TR and NON mice. Samples were immediately frozen in liquid nitrogen and stored at −80°C. The frozen ventricular samples were ground in liquid nitrogen using a pestle and mortar. Protein concentrations were assessed using a Bio-Rad protein assay followed by standard Western blot techniques. Proteins were first separated by SDS-PAGE followed by blotting onto a nitrocellulose membrane (Hybond C, Amersham). Membranes were then exposed, after a blocking step, to primary antibodies specific for the protein under investigation.
Na+−Ca2+ exchanger
To study the protein expression of the Na+−Ca2+ exchanger a primary polyclonal rabbit antiserum raised against canine sarcolemmal Na+−Ca2+ exchanger (SWant, Bellinzona, Switzerland) (1:1000) was used. The secondary antibody was an anti-rabbit Ig, peroxidase-linked, species-specific, whole antibody from donkey (Amersham) (1:2000).
SERCA2a
The primary antibody used to recognize this protein was monoclonal (mouse) anti-SERCA2 antibody (IgG2A) (Affinity Bioreagents, Inc., Golden, CO, USA) (1:5000). The secondary antibody was an anti-mouse Ig, peroxidase-linked, species-specific F(ab′)2 fragment from sheep (Amersham) (1:2000).
Phospholamban
The primary antibody used to detect this protein was a monoclonal mouse anti-phospholamban antibody (Affinity Bioreagent, Inc.) (1:10000). The secondary antibody was identical to that used to detect the anti-SERCA2a described above (1:10000).
Calsequestrin
The primary antibody was polyclonal rabbit antiserum raised against calsequestrin purified from the sarcoplasmic reticulum of dog myocardium (SWant) (1:5000). The secondary antibody was the same as that used to detect the Na+−Ca2+ exchanger (1:2000).
Secondary antibodies were detected by autoradiography using the Enhanced Chemiluminescence (ECL) system (Amersham). The films produced were then scanned and the optical densities of the bands quantified using the software package Quantity One (Pdi, New York). The values were normalized to the optical density of total protein visualized on the membrane using Amino Black (0.05 % Amido Black in destain (45 % H2O, 45 % methanol, 10 % acetic acid)).
Cell isolation
Isolation of mice ventricular myocytes has been performed following a method previously described for the isolation of guinea-pig and rat ventricular myocytes (Terracciano & MacLeod, 1997a, b). Mice were killed by cervical dislocation and the hearts were rapidly removed and placed in ice-cold normal Tyrode (NT) solution (for the composition of this and other solutions see the Solutions section below). The ascending aorta was cannulated with a blunted 21 g needle. The heart was then retrogradely perfused for 5 min at 37°C with NT solution followed by a further 5 min in low Ca2+ (LC) solution. The solution was changed to an enzyme solution (ES) containing protease (4 U ml−1, Sigma) for 1 min, followed by perfusion for 8 min with ES solution containing collagenase (0.8 mg ml−1; Worthington) and hyaluronidase (0.5 mg ml−1, Sigma). The ventricles were then removed and cut into small pieces using a scalpel blade. The tissue was then agitated for a further 5 min in collagenase and hyaluronidase, filtered and resuspended in ES solution. This suspension was gently triturated using a glass pipette, filtered again and resuspended in ES solution. Myocytes were stored in ES solution at room temperature and used within 7–8 h of isolation.
Cell shortening measurements
Cell shortening was measured using a video-based motion detector described by Steadman et al. (1988). Measurements of the cell size and length were not made, and therefore the shortening of the cell will be expressed as an absolute value and not as a percentage of cell length.
Calcium measurements
We used the Ca2+-sensitive, single excitation, dual emission fluorescent dye, indo-1 AM, as described previously (Terracciano & MacLeod, 1997b). Calibration of indo-1 fluorescence was performed. The Kd was assessed in vitro using solutions with different [free Ca2+] and a constant amount of indo-1. We previously calculated (Terracciano & MacLeod, 1997b) a Kd of 226.9 ± 2.6 nm in control conditions at pH 7.2, which compares favourably with the one reported by Grynkiewicz et al. (1985) (250 nm). The Rmin, Rmax and b (ratio of free to bound indo-1 fluorescence at 485 nm) were obtained in vivo using cells loaded with indo-1 AM. Intracellular [Ca2+] was varied by using the non-fluorescent Ca2+ ionophore 4BrA-23187 (Molecular Probes) in solutions of varying [Ca2+]. In four cells the ratio of the final values in ‘zero Ca2+’ (Rmin) was 0.125 ± 0.01; the ratio in ‘high Ca2+’ (Rmax) was 0.392 ± 0.02. The value of b was 2.584 ± 0.51. The values for Rmin and Rmax were substantially different from the ones recorded previously in guinea-pig myocytes (0.283 and 0.878, respectively; Terracciano & MacLeod, 1997b) presumably because of different binding of the indicator to cellular proteins (Hove-Madsen & Bers, 1992).
Electrophysiology
The electrophysiological experiments were performed using an Axoclamp-2A system (Axon Instruments). To avoid dialysis of the cells and to minimize the effects of changing the intracellular environment, high resistance microelectrodes were used. In all the experiments described, borosilicate glass microelectrodes (Clark Electromedical Instruments, Reading, UK) with resistances between 20 and 30 MΩ were used.
The microelectrode filling solution contained: KCl, 2m; EGTA; 0.1 mm; Hepes, 5 mm; pH 7.2. Unless otherwise stated the cells were stimulated in current clamp mode at 0.5 Hz with a 1.0 nA pulse of depolarizing current of 10 ms duration. Voltage-clamp experiments were performed in switch-clamp mode. The switching rate was 3–5 kHz. Gain was increased up to 0.8 nA mV−1 to obtain a maximally square voltage trace with no oscillations. The phase lag control was not employed in order to avoid ‘false clamp’. When the cells were not impaled with microelectrodes (for example, in experiments involving rapid cooling), they were field-stimulated using a pair of platinum wires in the superfusing chamber (volume, 60 μl).
When integration of caffeine-induced transient inward currents was performed, the baseline was taken at the end of the caffeine pulse, as reported in previous papers (Terracciano et al. 1995, 1997).
Current clamp and voltage clamp protocols were controlled with pCLAMP 6.0.3 software (Axon Instruments).
Acquisition systems and statistical analysis
The data obtained from the video edge-detection system, the epifluorescence apparatus and the Axoclamp-2A system were simultaneously recorded on tape and on computer. The acquisition software programs used were pCLAMP 6.0.3 and Axotape 2.0 (Axon Instruments). The rate of sampling was between 0.5 and 3 kHz.
Time to peak (TTP) was measured between the point before the initial increase of the trace and the top of the signal. Time to 50 % relaxation (t50) was measured between the top of the signal and the point on the declining phase corresponding to half of the total size of the twitch. To assess statistical differences between means, Student' s t test was performed. Unless otherwise specified, the results are expressed as means ± standard error of the mean (s.e.m.); n represents the number of myocytes that have undergone investigation. They were isolated from a minimum of three hearts per n.
Solutions
Normal Tyrode (NT) solution contained (mm): NaCl, 140; KCl, 6; MgCl2, 1; CaCl2, 1; glucose, 10; Hepes, 10; pH adjusted to 7.4 with 2 m NaOH.
Low calcium (LC) solution contained (mm): NaCl, 120; KCl, 5.4; MgSO4, 5; CaCl2, 0.045; sodium pyruvate, 5; glucose, 20; taurine, 20; Hepes, 10; nitrolotriacetic acid (NTA), 5; bubbled with 100 % O2; pH 6.8.
Enzyme solution (ES) contained (mm): NaCl, 120; KCl, 5.4; MgSO4, 5; CaCl2, 0.2; sodium pyruvate, 5; glucose, 20; taurine, 20; Hepes, 10; bubbled with 100 % O2; pH 7.4.
Na+-free-Ca2+-free solution contained (mm): LiCl, 140; KOH, 6; MgCl2, 1; glucose, 10; Hepes, 10; EGTA, 0.1; pH adjusted to 7.4 with 1 m LiOH.
Chemicals were generally purchased from BDH. Nifedipine, 4-aminopyridine, glibenclamide and niflumic acid were from Sigma and thapsigargin from Calbiochem.
The temperature of the superfusing solution was approximately 22°C in control conditions. The rate of superfusion was 2–3 ml min−1 except during rapid cooling or fast application of caffeine when it was 12–15 ml min−1. Miniature solenoid valves (The Lee Company, Essex, UK) were used to produce fast changes in superfusate.
RESULTS
The Na+−Ca2+ exchanger in the E-C coupling of control mouse ventricular myocytes
There have been many studies on the relative contribution of various cellular mechanisms to cytoplasmic Ca2+ regulation in different species (see Bers, 1991), but very little is known about such Ca2+ regulation in mouse ventricular myocytes. Before investigating the effects of the overexpression of the Na+−Ca2+ exchanger on SR Ca2+ regulation, we performed experiments to assess how the exchanger contributes to Ca2+ regulation of control mouse ventricular myocytes. We carried out three groups of experiments: measurements of Ca2+ transients after variable rest intervals, rapid cooling contractures and caffeine application. The results differ substantially from previous studies in cardiac tissue of other species so we shall describe them first to provide necessary background information before showing the results obtained from transgenic myocytes.
Post-rest contraction
Measurements of contraction after variable periods of rest in mouse ventricular myocytes have been described before (He et al. 1997). We have repeated these experiments and demonstrated a similar behaviour in the myocytes isolated in our laboratory. Figure 1A shows that prolonging the rest interval increases the amplitude of the post-rest contraction (rest-potentiation). This behaviour suggests that in mouse myocytes the balance between Ca2+ entry and Ca2+ extrusion during rest is in favour of the former, thus increasing the Ca2+ content of the SR (in contrast with guinea-pig and rabbit which show rest decay).
Figure 1. The effects of rest and rapid cooling on cell shortening and indo-1 fluorescence in control mouse ventricular myocytes.
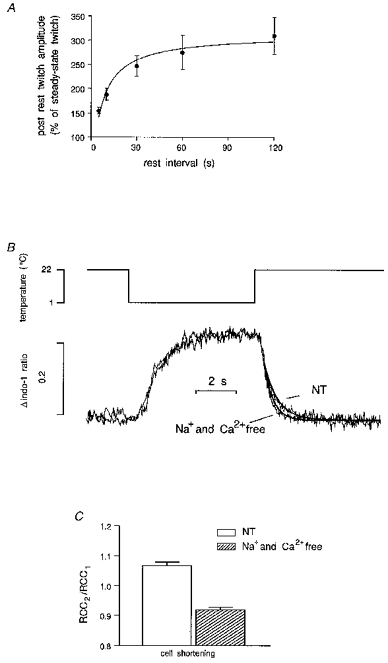
A, rest produces potentiation of the twitch. Cells were stimulated at 0.5 Hz until they reached steady-state contraction and then rested for variable intervals. The data are means ± s.e.m. of 12 myocytes (7 for 60 s interval and 5 for 120 s). Several cells showed spontaneous contractions during prolonged rest. B, indo-1 fluorescence during rapid cooling followed by rewarming. In this case no calculation of [Ca2+]i was performed since the higher level of fluorescence was close to saturation and the cooling alters the Kd of the dye. The cell was initially stimulated at 0.5 Hz. Stimulation was stopped for 5 s before applying rapid cooling. Traces from a RCC performed in NT solution and in Na+- and Ca2+-free solution have been superimposed. In the latter case Na+- and Ca2+-free solution was used from cessation of stimulation throughout rapid cooling and rewarming until relaxation was completed. Lines were fitted on the declining phase of the indo-1 trace with the equation Aexp[−(t−K)/τ]+C where A is the amplitude of the signal, C is the offset, t−K is the time interval between the start and the end of the fit and τ is the time constant. The rate of decline of the indo-1 ratio during rewarming in Na+- and Ca2+-free solution was faster than in NT solution. C, paired RCC experiments. A second RCC (RCC2) was performed 10 s after a first RCC (RCC1) as described above and no stimulation was given during this time. The ratio RCC2/RCC1 represents the amount of Ca2+ handled by the SR during rewarming compared with the previous RCC. These data obtained by measuring cell shortening changes show that in control mouse myocytes, more Ca2+ than that released during the first cooling period is reaccumulated into the SR during the rewarming phase. Removing Na+ and Ca2+ from the superfusing solution abolishes this effect.
Rapid cooling contractures (RCCs)
Rapid cooling of cardiac muscle to 1°C in less than 1 s produces a contracture (Kurihara & Sakai, 1985) due to the release of Ca2+ from the SR (Bridge, 1986). The phenomenon has been ascribed to the effects of temperature on the gating of ryanodine receptors (Sitsapesan et al. 1991). This technique allows qualitative assessment the SR Ca2+ content and study of the relative contributions of various mechanisms to Ca2+ regulation. A Na+ − and Ca2+-free solution can be used during rewarming after rapid cooling to eliminate the contribution of the Na+−Ca2+ exchanger to relaxation. This solution is used only during cooling and rewarming in order to leave the SR loading unaffected. Assuming a minimal role for other extrusion mechanisms, such as the sarcolemmal Ca2+-ATPase and mitochondria, rewarming in the absence of external Ca2+ and Na+ can be used to assess the function of SR Ca2+ uptake during relaxation. Figure 1B shows traces of indo-1 fluorescence changes during rapid cooling and rewarming in NT or Na+− and Ca2+-free solution. Both traces reach values close to saturation and therefore in this case no calculation of [Ca2+]i can be made. Surprisingly, during rewarming after the rapid cooling performed in Na+- and Ca2+-free solution, the time constant τ of the curves fitted to the lower part of the indo-1 fluorescence decline was smaller than the one recorded during normal Tyrode (NT) superfusion (τ of indo-1 ratio decline in NT: 725 ± 92 ms, n = 7; τ in Na+- and Ca2+-free solution: 409 ± 56 ms, n = 7; P = 0.005). This is in contrast with results obtained in other species, such as guinea-pig (Terracciano & MacLeod, 1997a) and rabbit (Bassani et al. 1994) where relaxation was prolonged in these conditions. A possible explanation for this phenomenon is that in mouse ventricular myocytes the Na+−Ca2+ exchanger does not contribute to Ca2+ extrusion during the lower part of the Ca2+ transient. During this period the Na+−Ca2+ exchanger may reverse to take Ca2+ into the cytoplasm. Its functional inhibition would therefore lead to the diastolic level being reached more quickly.
To investigate this phenomenon further we performed paired RCCs. This technique has been described in detail before (Hryshko et al. 1989; Terracciano & MacLeod, 1997b). Ca2+ taken up by the SR during rewarming after the first RCC is assessed by measuring the amplitude of a second RCC elicited after a fixed interval and comparing this with the size of the first RCC. If the Na+−Ca2+ exchanger activity is inhibited by superfusing the cell with a Na+- and Ca2+-free solution throughout the whole period the amplitude of the second RCC represents the amount of Ca2+ taken up by the SR plus the amount of Ca2+ handled by the exchanger. Figure 1C shows that maximal contractures during the second cooling in NT solution were larger than the first RCCs suggesting a net increase in the Ca2+ taken up into the SR during rewarming after the first RCC.
The origin of this Ca2+ seems to be extracellular since removing Ca2+ from the superfusing solution significantly reduces RCC2/RCC1. During RCCs only a small change in resting membrane potential occurs due to the effects of temperature on the Nernst equation (Bridge, 1986; Naqvi et al. 1994). This small depolarization is not likely to be able to increase the open probability of the sarcolemmal Ca2+ channels and therefore this route for Ca2+ entry should be ruled out. Assuming no non-specific Ca2+ leak, the only mechanism able to produce this Ca2+ entry is the Na+−Ca2+ exchanger working in outward current mode (i.e. Ca2+ influx-Na+ efflux producing net outward current).
Fast application of caffeine
Fast application of caffeine is another method used to study Na+−Ca2+ exchanger function. Rapid application of 10 mm caffeine produces a maximal release of Ca2+ from the SR. If the superfusion with caffeine is maintained, relaxation is brought about by non-SR mechanisms, mainly Na+−Ca2+ exchange (Varro et al. 1993; Bassani et al. 1994). In addition, measuring the transient inward current produced by application of caffeine has been widely used to assess the amount of Ca2+ stored in the SR (Varro et al. 1993; Terracciano & MacLeod, 1997a).
We performed these experiments in control mouse myocytes to address two questions: (1) how much Ca2+ is stored in the SR of control mouse ventricular myocytes? (2) How much do the minor Ca2+ extrusion mechanisms contribute to relaxation in the absence of a functionally intact SR? Figure 2A (left side) shows that application of caffeine produces a contraction (top) and a transient inward current. Note that indo-1 fluorescence was not used in these experiments in order to avoid adding extra Ca2+ buffering to the cytoplasm.
Figure 2. The effect of fast application of 10 mm caffeine on cell shortening, membrane current and intracellular [Ca2+] in control mouse myocytes.
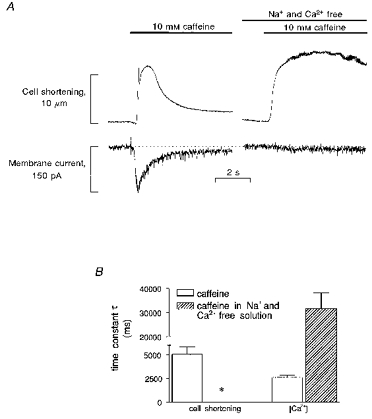
Cells were initially stimulated at 0.5 Hz (not shown) and after 2 s rest, caffeine was rapidly applied and its application maintained for several seconds. A, left side, a typical caffeine-induced transient inward current. The integral of this current allows calculation of the amount of Ca2+ released from the SR. A, right side, a similar caffeine application in the same cell but in the absence of Na+ and Ca2+ in the superfusate. Although a large release of Ca2+ is still present (as demonstrated by the contracture induced by caffeine) the current was almost abolished suggesting that it can be ascribed to the Na+−Ca2+ exchanger. Note that in the absence of Na+ and Ca2+ in the superfusate, relaxation is extremely slow and cannot be accurately measured (*). In many cases it was not possible to determine a time constant of relaxation since the cell seems to stay contracted. Data are shown in B along with data from cells loaded with indo-1. This was done to allow a more direct measurement of Ca2+ extrusion. No indo-1 was used when these experiments were employed to calculate SR Ca2+ content.
We tested the Na+ and Ca2+ dependency of the caffeine-induced current by repeating the same experiment in a Na+- and Ca2+-free solution. As shown in Fig. 2A (right) in this condition, although a maximal contraction was still present, the transient inward current was almost abolished suggesting that the current we measured (and shown in the left side of the figure) is dependent on the Na+−Ca2+ exchanger.
An important factor that influences the calculation of the SR Ca2+ content assessed using this method is the amount of Ca2+ extruded by mechanisms other than the Na+−Ca2+ exchanger. To assess the importance of such mechanisms, we repeated similar experiments but we also measured [Ca2+]i changes using indo-1 fluorescence. As observed in the trace in Fig. 2A, in the absence of a functionally intact SR and Na+−Ca2+ exchanger, relaxation after caffeine application was extremely slow. Data for τ of the decline of [Ca2+]i are shown in Fig. 2B. τ of Ca2+ decline in caffeine was 2582 ± 266 ms (n = 10), a value about 2.7 and 1.6 times greater than the one previously measured in rabbit and rat ventricular myocytes, respectively, with a similar technique (Bassani et al. 1994). The τ for decline of [Ca2+]i in caffeine and Na+- and Ca2+-free solution was 31645 ± 6525 ms (n = 10), approximately 2.6 times slower than in rat and rabbit myocytes measured with the same technique by Bassani et al. (1994). This suggests that, if other minor mechanisms are involved in relaxation, their role is minimal.
In conclusion we have demonstrated that in mouse ventricular myocytes the Na+−Ca2+ exchanger plays a minor role in relaxation compared with other species; it seems that it is involved in Ca2+entry during rest and perhaps during the latter part of relaxation.
RCCs in transgenic mice overexpressing the Na+−Ca2+ exchanger
Contraction and relaxation in transgenic mice overexpressing the Na+−Ca2+ exchanger has been previously described (Adachi-Akahane et al. 1997). We also measured cell shortening and Ca2+ transients elicited by field stimulation at 0.5 Hz in TR and NON myocytes (Fig. 3). Ca2+ transients and twitches were of similar size in the two groups but the rates of contraction and relaxation were significantly faster in TR than in NON myocytes (Table 1).
Figure 3. Ca2+ transients in TR and NON ventricular myocytes.
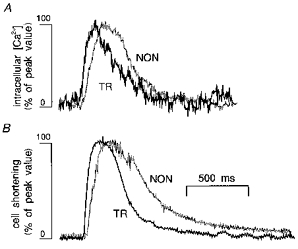
Typical Ca2+ transients (A) and twitches (B) recorded in TR (black traces) and NON (grey traces) myocytes elicited by field stimulation at 0.5 Hz. Traces were scaled and superimposed to compare the time courses of the signals. Both changes in cell length and intracellular [Ca2+] were faster in TR than in NON myocytes.
Table 1.
Ca2+ transients and twitches in TR and NON ventricular myocytes
| TR | NON | P (t test) | |
|---|---|---|---|
| Diastolic [Ca2+] (nm) | 116 ± 8 (18) | 127 ± 11 (13) | 0.45 |
| Ca2+ transient amplitude (nm) | 168 ± 17 (20) | 241 ± 57 (9) | 0.127 |
| Ca2+ transient TTP (ms) | 441 ± 34 (20) | 663 ± 46 (9) | 0.001 |
| Ca2+ transient t50 (ms) | 329 ± 18 (20) | 455 ± 22 (9) | 0.0004 |
| Twitch amplitude (μm) | 4.6 ± 0.8 (20) | 3.2 ± 0.3 (8) | 0.317 |
| Twitch TTP (ms) | 472 ± 35 (20) | 658 ± 85 (9) | 0.022 |
| Twitch t50 (ms) | 404 ± 35 (20) | 639 ± 86 (9) | 0.005 |
Values of n given in parentheses.
These results confirm findings previously reported by Adachi-Akahane et al. (1997) who ascribed the faster relaxation to a larger Ca2+ extrusion brought about by the Na+−Ca2+ exchanger. To investigate whether changes in SR Ca2+ uptake can also be responsible for such a faster relaxation, we performed RCCs. Figure 4A shows traces of Ca2+ decline during rewarming after RCCs performed using NT solution in TR and NON myocytes. Ca2+ decline in TR myocytes was faster than in NON myocytes. This is consistent with the findings observed in twitches. Nevertheless, as for twitches, RCCs in NT solution do not enable us to distinguish between the different relaxation mechanisms. To investigate specifically SR Ca2+ uptake in Ca2+ removal, we performed RCCs in Na+- and Ca2+-free solution. A typical experiment is shown in Fig. 4B. Data for Ca2+ changes during RCCs are reported in Table 2 (amplitude is not shown because during RCCs the indo-1 fluorescence reaches values close to saturation). The rate of decline of Ca2+ in TR myocytes was faster than the one measured in NON myocytes. This suggests that the faster decline of Ca2+ during rewarming in TR myocytes can also be due to faster SR Ca2+ uptake.
Figure 4. The effects of rapid cooling and rewarming on TR and NON myocytes.
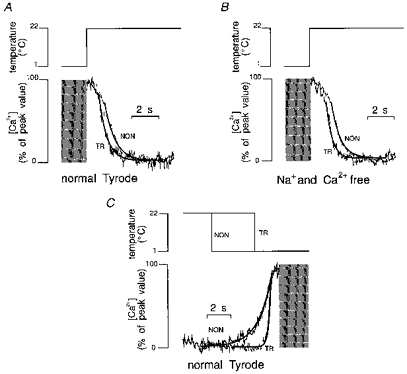
Traces have been scaled then superimposed and finally lines were fitted using the equation described in the legend of Fig. 1. Since indo-1 fluorescence reached values close to saturation during maximal Ca2+ release, the top parts of the traces are not shown (grey rectangles). A, Ca2+ decline recorded from a TR myocyte in NT was faster than the one recorded in a NON myocyte. B, similar findings were observed when rewarming was performed in Na+- and Ca2+-free solution although both traces were significantly faster than the ones recorded in NT solution. C, increase in [Ca2+]i upon cooling. Traces were scaled then superimposed such that the peak values coincide. The rate of increase in TR myocytes was faster than the one recorded in NON myocytes.
Table 2.
Ca2+ decline during rewarming after RCCs in TR and NON myocytes
| TR | NON | P (t test),TR vs. NON | |
|---|---|---|---|
| NT solution, RCCs | |||
| t50 (ms) | 859 ± 56 (20) | 1051 ± 74 (15) | 0.043 |
| τ (ms) | 768 ± 61 (21) | 1016 ± 101 (13) | 0.033 |
| Na+- and Ca2+-free solution | |||
| t50 (ms) | 579 ± 46 (20) | 742 ± 42 (13) | 0.021 |
| τ (ms) | 519 ± 35 (20) | 673 ± 60 (12) | 0.025 |
| NT solution, Ca2+ increase | |||
| τ (ms) | 256 ± 20 (19) | 657 ± 92 (12) | < 0.0001 |
Values of n given in parentheses.
We analysed the rate of increase of Ca2+ during the onset of rapid cooling (Fig. 4C). τ of the mono-exponential curve, fitted on the increasing phase of the Ca2+ trace during cooling, was smaller in TR than in NON myocytes; data are shown in Table 2. This suggests that upon cooling in TR myocytes, Ca2+ is released faster from the SR and may account for the faster TTP of twitches shown in the previous section.
In conclusion, in TR myocytes, even when Na+−Ca2+ exchange function is prevented by removing the Na+ and Ca2+ gradient, Ca2+ removal from the cytoplasm is still faster, presumably due to a faster SR Ca2+ uptake. To explain this phenomenon several hypotheses can be put forward. We first tested the possibility of an alteration of SR Ca2+ uptake due to concomitant changes in the expression of SR proteins.
Ca2+ regulatory protein determination in transgenic mouse cardiac tissue overexpressing the Na+−Ca2+ exchanger
We used Western blotting to assess the level of Ca2+ regulatory proteins associated with the SR, namely SERCA2a, phospholamban and calsequestrin. We did this to assess whether changes in protein expression in TR myocytes occur as an adaptive response to an overexpression of Na+−Ca2+ exchanger or as a consequence of the transgene construct. We observed a strong immunoreactivity, as expected, in TR tissue when we used anti- Na+−Ca2+ exchanger antibodies. The results were comparable to those described by Adachi-Akahane et al. (1997) and confirmed overexpression of the exchanger. Nevertheless, as is evident from Fig. 5, we did not detect significant differences in any of the experiments testing the immunoreactivity of other antibodies in TR or NON tissue. This suggests that in TR cardiac tissue the changes to SR Ca2+ uptake described in the previous section cannot be ascribed to changes in the expression of SR proteins.
Figure 5. Measurements of the expression of Ca2+ regulatory proteins in TR and NON cardiac tissue using Western blotting.
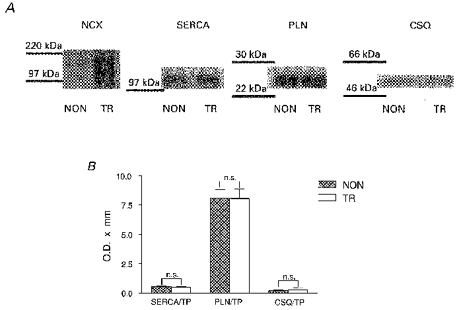
A, examples of Western blots for Na+−Ca2+ exchanger (NCX), SR Ca2+-ATPase (SERCA), phospholamban (PLN) and calsequestrin (CSQ). The results for NCX were similar to that shown by Adachi-Akahane et al. (1997) where bands at 160, 120 and 70 kDa were shown in TR cardiac tissue. The values for optical density of the single proteins were normalized to total protein (TP) and data are shown in B. Data are means ± s.e.m., n = 6.
Measurement of the SR Ca2+ content in non-dialysed transgenic mouse myocytes overexpressing the Na+−Ca2+ exchanger
One of the possible functional reasons for a faster relaxation after Ca2+ release (such as the one recorded during rewarming after a cooling period) is that more Ca2+ has been released in TR than in NON myocytes. As reported by Bers & Berlin (1995), there is a relationship between peak Ca2+ and the rate of Ca2+ removal from the cytoplasm. One may therefore expect a larger SR Ca2+ content in TR myocytes. We analysed the SR Ca2+ content by measuring the charge carried by the transient inward current induced by application of caffeine. We performed these experiments in non-dialysed myocytes voltage clamped at −75 mV. Figure 6A shows traces of caffeine-induced current recorded in TR and NON myocytes. The currents were of similar magnitude and showed similar kinetics compared with those described by Adachi-Akahane et al. (1997). Data are shown in Table 3. In TR myocytes the amplitude of the current was larger and the rate of decline was faster than in NON myocytes. We also observed a faster rate of increase and, most importantly, a significantly larger integral of the current in TR than in NON myocytes (Fig. 6B). The SR Ca2+ content of TR myocytes was therefore significantly larger than the one recorded in NON myocytes.
Figure 6. The effects of fast application of caffeine on membrane current in TR and NON myocytes.
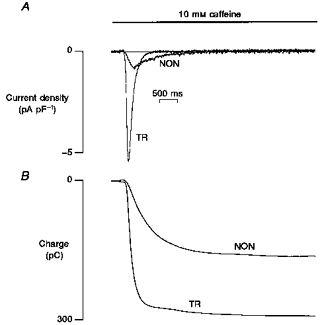
Cells were stimulated at 0.5 Hz until steady-state contraction was reached and then stimulation was stopped; 2 s after cessation of stimulation the cells were voltage-clamped at −75 mV. Caffeine superfusion was then started and maintained for 6 s. A, superimposed current density traces recorded from TR and NON myocytes. B, integrals of the currents. In TR myocytes the amount of charge crossing the cell membrane during caffeine application was larger and increased more rapidly than in NON myocytes.
Table 3.
Caffeine-induced transient inward current in TR and NON myocytes
| TR | NON | P (t test) | |
|---|---|---|---|
| Cell capacitance (pF) | 252 ± 15 (28) | 252 ± 18 (18) | 0.995 |
| Cell volume (pl) | 29.9 ± 2 (28) | 29.9 ± 2 (18) | 0.995 |
| Charge (pC) | −276 ± 21 (28) | −164 ± 18 (18) | 0.0006 |
| Charge/capacitance (pC pF−1) | −1.080 ± 0.03 (28) | −0.642 ± 0.03 (18) | < 0.0001 |
| Ca2+ (μmol l−1 a.v.)† | 118.1 ± 4.2 (28) | 70.2 ± 4.2 (18) | < 0.0001 |
| Current amplitude (pA) | −893 ± 85 (28) | −299 ± 42 (17) | < 0.0001 |
| Current density (pA pF−1) | −3.47 ± 0.25 (28) | −1.16 ± 0.14 (18) | < 0.0001 |
| Current increase (nA s−1) | −10.41 ± 1.76 (25) | −2.73 ± 0.42 (17) | 0.001 |
| Time constant (τ) of current decay (ms) | 242 ± 29 (24) | 525 ± 27 (16) | < 0.0001 |
a.v., accessible cell volume. Values of n given in parentheses.
Assessment of the ability of the Na+−Ca2+ exchange to load the SR in non-dialysed transgenic mouse myocytes overexpressing the Na+−Ca2+ exchanger
From the results described in Fig. 6, it is possible to identify a relationship between the overexpression of the Na+−Ca2+ exchanger and the SR Ca2+ content. This represents an important finding demonstrating that the exchanger can control SR Ca2+. To investigate this relationship further, we performed the experiments described in Fig. 7. They were based on the hypothesis that, if the overexpression of the Na+−Ca2+ exchanger is responsible for a larger SR Ca2+ content, reloading the SR after complete Ca2+ depletion should take place more rapidly in TR myocytes. Important assumptions in this series of experiments are that application of caffeine depletes the SR of Ca2+ in both TR and NON myocytes and that, in the presence of 20 μm nifedipine, Ca2+ entry is brought about mostly by the Na+−Ca2+ exchanger.
Figure 7. Reloading of the SR with increasing numbers of voltage-clamp steps in TR (A) and NON myocytes (B).
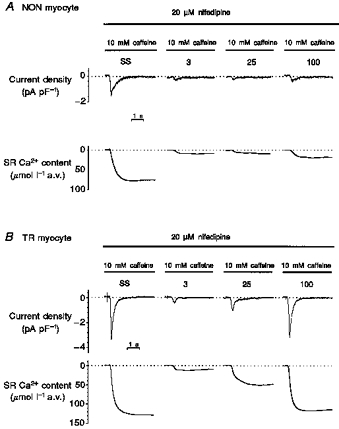
Steady-state (SS) SR Ca2+ content was calculated as described in Fig. 6 and Methods. Caffeine was then withdrawn and an increasing number of voltage-clamp steps (from −75 to +20 mV) of 400 ms duration at 0.5 Hz were applied. The ability of these steps to reload the SR was tested by another caffeine application. The number of steps used is shown above the caffeine traces. Caffeine was then withdrawn again and a different number of steps applied. Experiments were performed in the presence of 20 μm nifedipine in order to abolish the contribution of L-type Ca2+ channels to Ca2+ entry.
The reloading protocol consisted of voltage-clamp steps of 400 ms duration from −75 to +20 mV applied at 0.5 Hz. We chose this protocol in order to keep the voltage command constant, thus avoiding changes in action potential duration (Silverman et al. 1995) that could be responsible for changes of the SR Ca2+ load (Terracciano et al. 1997). We observed that in NON myocytes (Fig. 7A), after 100 steps, the SR Ca2+ content was still approximately half of the one measured at steady state. In contrast, in TR myocytes (Fig. 7B), the steady-state SR Ca2+ content was larger (as previously demonstrated) and half of this value was reached after twenty-five steps. The SR Ca2+ content had returned to the steady-state value after 100 steps. Data are summarized in Fig. 8 where SR Ca2+ content values are expressed as absolute values and as a percentage of the steady-state content. These results suggest that during blockade of Ca2+ channels in TR myocytes, the Na+−Ca2+ exchanger is able to load the SR more rapidly. It therefore may be responsible for the increased SR Ca2+ content demonstrated in these myocytes. In NON myocytes, reloading produced by the exchanger is much slower. In these cells presumably Ca2+ entry via the sarcolemmal Ca2+ channels plays a larger role in beat-to-beat SR Ca2+ regulation.
Figure 8. Reloading in TR myocytes is faster and larger than in NON myocytes.
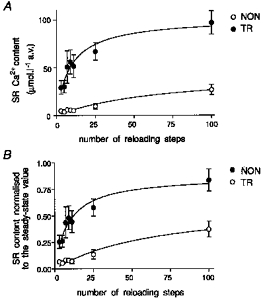
Data from the reloading experiments described in Fig. 7 (n≥ 5). A, absolute value of SR Ca2+ content after each set of loading steps. In B, these data have been normalized to the value of SR Ca2+ content calculated under steady-state conditions before initiating superfusion with nifedipine.
Voltage-current relationship of Na+−Ca2+ exchange and determination of subsarcolemmal Na+ in non-dialysed transgenic mouse myocytes overexpressing the Na+−Ca2+ exchanger
From the results reported above, it is clear that the Na+−Ca2+ exchanger in TR myocytes produces functional changes in SR Ca2+ regulation. Nevertheless, whether these effects are due to the overexpression of the Na+−Ca2+ exchanger or to changes in the equilibrium potentials (ECa and ENa) governing its function is still not clear.
To investigate whether the reversal potential of the exchanger (ENa−Ca) is modified in TR myocytes we performed experiments based on measuring the current-voltage relationship of the Na+−Ca2+ exchanger and determining ENa-Ca in a manner similar to that described by Kimura et al. (1986) and Kimura et al. (1987). However, our method is different in that we used high resistance microelectrodes to avoid dialysis of the cell. Under these circumstances we estimated the [Na+] that the exchanger ‘sees’ (i.e. subsarcolemmal [Na+]) and therefore determined whether this differs in TR myocytes. In order to block most of the conductances and isolate the Na+−Ca2+ exchanger current we superfused the cell with NT solution containing 3 mm 4-aminopyridine, 20 μm nifedipine, 2 mm BaCl2, 2 mm CsCl, 20 μm glibenclamide and 10 μm niflumic acid. To avoid changes in intracellular Ca2+ during the voltage protocol, the SR was emptied by superfusion with 500 nm thapsigargin and intracellular Ca2+ was buffered with BAPTA AM (1 μm, Molecular Probes). We superfused cells loaded with indo-1 AM with this solution for at least 5 min before recording. The voltage protocols were similar to ones used previously (Kimura et al. 1986, 1987; Hobai et al. 1997). From a holding potential of −75 mV, we clamped membrane voltage at −40 mV for 200 ms and then performed a voltage ramp to +80 mV and back to −120 mV at a velocity 50 mV s−1. We then rapidly switched the superfusing solution to a similar solution but containing 5 mm NiCl2 and, after 5 s rest, repeated the ramp protocol. We recorded intracellular Ca2+ simultaneously. A typical example of this type of experiment is shown in the inset in Fig. 9. A Ni2+-sensitive, Na+−Ca2+ exchange current resulted from subtraction of the current recorded during the descending phase of the ramp protocol in Ni2+ from the one obtained during the same phase in control. Indo-1 fluorescence was used to calculate the intracellular [Ca2+]. Average values of Na+−Ca2+ exchange current in eight NON myocytes and twelve TR myocytes are shown in Fig. 9. In TR myocytes a statistically significant increase in current density was present between +40 and +70 mV compared with NON myocytes. We did not detect differences at other voltages. We did not detect changes in ENa-Ca and we did not observe difference in intracellular [Ca2+] in the two groups. Since ENa−Ca = 3ENa − 2ECa, we could calculate intracellular [Na+]. The results suggest that intracellular Na+ is the same in TR and NON myocytes at rest (Table 4). Our results suggest that no changes in cytoplasmic [Ca2+] and [Na+] are present in cells from the two groups and this is consistent with the results reported by Yao et al. (1998).
Figure 9. Current-voltage relationships of the Na+−Ca2+ exchanger current in TR and NON myocytes.
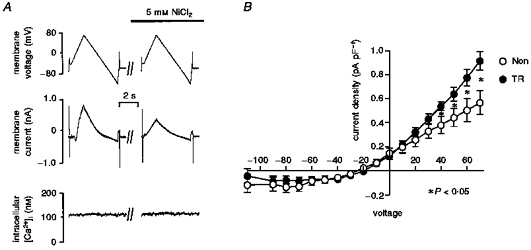
A, the protocol employed to measure the current. Intracellular [Ca2+] was recorded simultaneously. The voltage ramp was performed in control conditions and then in the presence of 5 mm NiCl2 (for composition of the solutions see Results). The Na+−Ca2+ exchange current was calculated by subtracting the current recorded in Ni2+ from the one obtained in control conditions. B, current-voltage relationship calculated for 12 TR and 8 NON myocytes. Current was significantly larger in TR myocytes at voltages between +40 and +70 mV. The currents reversed at approximately −25 mV in both groups.
Table 4.
ENa–Ca exchange, intracellular [Na+] and [Ca+] in TR and NON myocytes
| TR | NON | P (t test) | |
|---|---|---|---|
| ENa–Ca | −26.8 ± 3.3 (12) | −24 ± 2.7 (8) | 0.55 |
| Intracellular [Ca2+] (nm) | 159 ± 28 (12) | 135 ± 23 (8) | 0.57 |
| Intracellular [Na+] (mm) | 9.6 ± 0.9 (12) | 9.6 ± 0.7 (8) | 0.97 |
Values of n given in parentheses.
DISCUSSION
SR Ca2+ content and Na+−Ca2+ exchange in control mouse ventricular myocytes
It is now well established that the relative contributions of different mechanisms to Ca2+ regulation during the cardiac cycle can vary according to species (Bers, 1985, 1991). For example the relative roles played by the SR Ca2+-ATPase and the Na+−Ca2+ exchanger are different in rabbit and guinea-pig cardiac muscle from those in rat cardiac muscle (e.g. Bers, 1991; Terracciano & MacLeod, 1997a). In order to obtain more information on the relative contribution of these mechanisms to Ca2+ regulation in mouse myocardium, experiments were initially performed on control mouse myocytes before undertaking experiments on cells from transgenic animals.
The mouse cardiac myocytes show similarities with rat myocardial cells. Post-rest potentiation, for example, followed a similar time course to the one observed in rat myocardium (Bers, 1991) and a negative force-frequency relationship has already been described in mouse myocytes (Wolska & Solaro, 1996). A peculiar finding was that the time constant of rewarming after rapid cooling was faster in the combined absence of Na+ and Ca2+, suggesting that Ca2+ entry occurs at some point during the decline of intracellular Ca2+. Although it is difficult to predict the effect of reversed Na+Ca2+ exchange function on the total time constant of relaxation, it is possible to predict that the time constant for relaxation after the exchanger has reversed will be increased. This increase may be reflected in an alteration to the total time constant that we measure.
The hypothesis that Ca2+ entry occurs during the decline of intracellular Ca2+ was examined using paired RCCs. During rewarming and rest, more Ca2+ than that expelled from the SR during the first cooling is taken back up into the SR. This observation, together with the demonstration that the extra SR loading is inhibited by Na+- and Ca2+-free superfusate, suggests that the Na+−Ca2+ exchanger is responsible for Ca2+ entry during the decline in Ca2+. We suppose that, at the beginning of relaxation, Na+−Ca2+ exchange is in inward mode and extrudes Ca2+ from the cell but, as the intracellular [Ca2+] declines, the reversal potential of the Na+−Ca2+ exchange is reached and it ceases to remove Ca2+ from the cell. Instead, it reverses and takes Ca2+ into the cell, reducing the speed of relaxation and allowing a larger amount of Ca2+ to be taken up by the SR. SR uptake represents the favoured route for Ca2+ since at this level of cytoplasmic Ca2+ the contribution of the other mechanisms to relaxation is minimal.
We calculated that during steady-state contraction in control mouse ventricular myocytes the SR Ca2+ content was 59.7 ± 10 μmol l−1 accessible cell volume (a.v.) (non-mitochondrial; Terracciano et al. 1995) (n = 6). It should be noted that the absolute value of SR Ca2+ content calculated with this method is dependent on the capacitance: volume ratio used. Since a value for mouse myocytes is not available, here and in all the other experiments described in this paper we have used the value calculated for rat ventricular myocytes of 8.4 pF pl−1 by Satoh et al. (1996). We decided to use the value measured for rat myocytes for two reasons: (1) the average cell volume of mouse cells calculated using this correction factor was similar to the one calculated in other species (approximately 30 pl; see Table 3) and (2) rat myocytes have similar post-rest and force-frequency behaviour to mouse myocytes and therefore, at least as far as E-C coupling is concerned, they seem to be more similar to mouse cells than other species. However, it is possible that there are large differences in the capacitance:volume ratio between rat and mouse myocytes, and, indeed, between myocytes from TR and NON, and if this occurs it will lead to miscalculation of the SR Ca2+ content. This should be kept in mind when comparing results from different species and from cells from TR and NON.
SR Ca2+ uptake in myocytes from transgenic (TR) mice
We found that in TR mouse hearts there was more rapid Ca2+ removal from the cytoplasm (even in the absence of Na+ and Ca2+ in the superfusing solution) than in NON hearts. Since other Ca2+ extrusion mechanisms play a very minimal role in relaxation in mouse myocytes, the results suggest that SR Ca2+ uptake is increased in TR compared with NON myocytes. We initially wondered if, in TR myocytes, there had been complementary changes to the levels of expression of other Ca2+ handling proteins. However, there was no evidence for changes in the expression of the major SR Ca2+ proteins such as SERCA2a, phospholamban or calsequestrin, which suggested that the kinetics of SR Ca2+ uptake had been affected in the presence of similar amounts of protein.
A larger release of Ca2+ from the SR (either upon rapid cooling or during electrical stimulation) could account for this phenomenon. This is because it has been shown by Bers & Berlin (1995) that increasing peak [Ca2+] produces a faster decline or recovery to diastolic values in cardiac myocytes. These authors have demonstrated that in similar conditions (absence of Na+ and Ca2+ in the superfusate), Ca2+ decline (ΔCa2+/Δt) can be predicted assuming that Ca2+ transport rate and Ca2+ binding depend on [free Ca2+]. Since we have shown, by integrating the caffeine-induced currents, that the SR Ca2+ content is larger in TR than in NON myocytes, we expect that the peak [Ca2+] reached upon cooling is higher in the former cells (although we cannot detect it with the fluorescence experiments, presumably due to dye saturation). The faster Ca2+ decline observed in TR myocytes is therefore expected even in the absence of other functional or morphological changes in SR Ca2+ uptake.
SR Ca2+ content in TR myocytes
Adachi-Akahane et al. (1997) have already assessed SR Ca2+ content using changes in the peak indo-1 fluorescence during application of caffeine. This was the first study using the transgenic mouse overexpressing the exchanger and it was anticipated that SR Ca2+ content would be smaller than in non-transgenic mouse heart cells because more exchanger would be available to compete with the SR Ca2+-ATPase for Ca2+. However, they concluded that the SR Ca2+ content was not significantly smaller in TR myocytes than in NON myocytes but their study did not have sufficient power to determine if the SR Ca2+ content was greater. Further, on complete release of SR Ca2+, fura-2 fluorescence, while not perhaps reaching Rmax, may be on the non-linear part of the fluorescence-[Ca2+] relationship and so may not give a reliable indication of the SR Ca2+ content.
To obtain reliable and accurate values of the SR Ca2+ content we integrated the caffeine-induced transient inward current. We calculated a larger SR Ca2+ content in TR myocytes than in NON myocytes. In order to discuss these results two important assumptions need to be made.
These are: (1) The contribution of minor cellular mechanisms (i.e. mechanisms other than the SR Ca2+-ATPase and Na+−Ca2+ exchange) involved in Ca2+ regulation does not affect the calculation of SR Ca2+ content. We have shown that other Ca2+ extrusion mechanisms play only a very minor role in relaxation in mouse myocytes. As shown in Fig. 2, where it could be measured, the τ for decline of [Ca2+]i in caffeine and Na+- and Ca2+-free solution was approximately 2.5 times slower than in rat and rabbit myocytes measured with the same technique by Bassani et al. (1994). In many cases the cells did not relax when superfused with caffeine and a Na+- and Ca2+-free solution. For this reason we did not correct for Ca2+ extrusion produced by these mechanisms and the values for SR Ca2+ content are derived purely by the integration of the caffeine-induced transient inward current.
(2) The capacitance:volume ratio used (8.4 pF pl−1) is adequate for mouse myocytes and is not different in myocytes from TR and NON mice. The absolute values derived from the pure integration of the caffeine-induced transient inward current may be in error because we do not know with precision the capacitance:volume ratio of mouse cardiac ventricular myocytes.
It is probable that the increased SR content in TR myocytes occurs because of the overexpression of the exchanger. The reloading experiments (in the presence of nifedipine to inhibit Ca2+ influx through the L-type Ca2+ channel) shown in Fig. 7 suggest that in TR myocytes the Na+−Ca2+ exchanger alone is capable of reloading the SR and is thus able to regulate SR Ca2+ content.
In conclusion we speculate that, bearing in mind that in mouse cardiac myocytes the Na+−Ca2+ exchanger brings Ca2+ into the cells at low cytoplasmic [Ca2+], this Ca2+ entry is larger in cells with overexpression of the exchanger, thus producing a larger SR Ca2+ content.
SR Ca2+ release in TR myocytes
The increased SR Ca2+ content in TR myocytes can explain the previous observation that the intracellular [Ca2+] during electrical stimulation and rapid cooling increases more rapidly in TR than in NON myocytes. A larger SR Ca2+ content is able to increase the rate of SR Ca2+ release (Terracciano et al. 1995), perhaps because of the effects of increasing luminal Ca2+ on the properties of the SR Ca2+ release channels (e.g. Sitsapesan & Williams, 1997). The overexpression of the Na+−Ca2+ exchanger therefore indirectly increases the rate of Ca2+ release from the SR affecting the speed of contraction. Whether Ca2+ entry via the Na+−Ca2+ exchanger is also important in producing a faster TTP during electrically stimulated twitches in TR myocytes cannot be determined by the experiments described in this paper.
Evidence for enhanced Na+−Ca2+ exchanger function in TR myocytes
Adachi-Akahane et al. (1997) showed clear evidence of increased Na+−Ca2+ exchanger protein with both Western blotting and immunofluorescence. We have obtained similar results. Although a larger amount of protein is present in these animals, whether this produces a greater proportion of Ca2+ removal via the exchanger is more questionable. Adachi-Akahane et al. (1997) showed that Ca2+ removal from the cytoplasm after application of caffeine was larger and faster in TR than in NON myocytes suggesting an increased efflux of Ca2+ via the exchanger. Although our experiments yielded similar results, our interpretation of these results is slightly different.
Na+−Ca2+ exchanger function can only be assessed in this way when releases of Ca2+ are of similar magnitude. Different amounts of release produce changes in the kinetics of the exchanger resulting in different current amplitudes (Kimura et al. 1987). Since our results show that caffeine application to TR myocytes results in a larger SR release, then the size of the Ca2+ transient and associated current will be larger. Therefore the larger current observed in TR myocytes may be not only related to the overexpression of the Na+−Ca2+ exchanger, but also partly explained by the increase in the amount of Ca2+ released from the SR.
Direct evidence of increased function of the Na+−Ca2+ exchanger in TR myocytes comes from the measurements of Ni2+-sensitive Na+−Ca2+ exchanger current elicited by changes in voltage elicited in a similar manner to that previously described (Kimura et al. 1986, 1987). With this method we were able to show that the outward current produced by the Na+−Ca2+ exchanger for voltages between +40 and +70 mV was significantly larger in TR than in NON myocytes. This was in the absence of changes in the reversal potential of the Na+−Ca2+ exchanger as discussed below and represents direct evidence of increased function of the exchanger in TR myocytes.
We did not detect differences in the current at more negative potentials where the I–V relationship was almost flat. This may have been caused by our use of non-dialysing sharp microelectrodes and by using different solutions from ones used by other investigators. However, the currents we have recorded are remarkably similar to the ones obtained using more traditional dialysing patch-clamp techniques. They also showed an almost flat configuration at negative potentials (Kimura et al. 1987; Hobai et al. 1997). Kimura et al. (1987) suggested that the carrier probably saturates at these potentials. Our results do not support this view since we would expect that increasing the amount of carrier (overexpression of Na+−Ca2+ exchanger) would produce saturation at higher current amplitude. Recently, Convery & Hancox (1998) have shown that this flattening of the current response does not seem to be dependent on saturation but on the direction of ramp used, being present only during descending voltage ramps (from positive to negative voltages). It is possible that this effect could be due to a reduction of subsarcolemmal [Ca2+] as negative values of potential are reached during the ramp. A reduced subsarcolemmal [Ca2+] will result in less inward current produced by the Na+−Ca2+ exchanger. If Ca2+ extrusion is performed more effectively in TR myocytes it sets subsarcolemmal [Ca2+] to a lower level, thereby further reducing the amount of current. This can explain why we do not see any difference in the two groups. All these considerations suggest that the measurement of the Na+−Ca2+ exchanger current at negative potentials during a descending voltage ramp can be misleading. The absolute value of ENa-Ca may also be misleading since intra- and extracellular [Ca2+] are artificial because of the buffers and blockers used in the superfusing solution. Nevertheless comparison between the ENa-Ca values in identical conditions is possible and it is interesting to note that ENa-Ca is unchanged in the two groups of myocytes, suggesting that the Na+ regulatory mechanisms are able to maintain [Na+]i to the same level in myocytes from TR and NON mice. We do not think that the protocol affects the more positive side of the I–V curve, (Convery & Hancox (1998) showed no difference in that portion of the curve using different voltage clamp protocols) and so outward currents can provide better measurements of Na+−Ca2+ exchanger activity.
In myocytes from TR and NON mice, no differences can be detected in diastolic intracellular [Ca2+] and [Na+] (see also Adachi-Akahane et al. 1997; Yao et al. 1998). Our reversal potential experiments confirm these findings. The reasons for similar Na+ and Ca2+ values are unknown. One can speculate that the same [Na+] in the two cell types arises from the ability of the Na+ pump to control Na+ at a set level. Similarly, the SR Ca2+ pump is able to maintain closely matching levels of diastolic [Ca2+] in the two cell types. We did not measure the activity of the SR Ca2+ pump directly in these myocytes at rest and therefore we assume that the affinity of the pump for Ca2+ is probably the same in the two cell types. If the affinities are the same, one would anticipate that an increased SR uptake in TR myocytes requires a higher diastolic [Ca2+]. We conclude that the difference between the diastolic [Ca2+] in the two cell types is smaller than can be measured with our system.
During stimulation we know that cytoplasmic [Ca2+] increases more quickly in myocytes from TR, and this means that Ca2+ is available more quickly as a substrate for the pump during the twitch. This, together with a larger release of Ca2+ from the SR during the twitch, may be responsible for the faster relaxation and ultimately for the increased SR Ca2+ content in myocytes from TR.
In conclusion, we have shown that an increased expression of the Na+−Ca2+ exchanger strongly affects SR Ca2+ regulation, particularly by increasing SR Ca2+ content. This results in a faster SR Ca2+ release and SR Ca2+ uptake. From these findings it can be speculated that changes in the expression of the Na+−Ca2+ exchanger protein in pathophysiological conditions can result in modifications of SR Ca2+ regulation in cardiac muscle.
Acknowledgments
We would like to thank Maren Koban for her invaluable help with the protein determination experiments. We also thank the British Heart Foundation and NIH (HL48509) for financial support.
References
- Adachi-Akahane S, Lu L, Li Z, Frank JS, Philipson KD, Morad M. Calcium signaling in transgenic mice overexpressing cardiac Na+-Ca2+ exchanger. Journal of General Physiology. 1997;109:717–729. doi: 10.1085/jgp.109.6.717. 10.1085/jgp.109.6.717. [DOI] [PMC free article] [PubMed] [Google Scholar]
- Bassani JWM, Bassani RA, Bers DM. Relaxation in rabbit and rat cardiac cells: species-dependent differences in cellular mechanisms. The Journal of Physiology. 1994;476:279–293. doi: 10.1113/jphysiol.1994.sp020130. [DOI] [PMC free article] [PubMed] [Google Scholar]
- Bassani JWM, Yuan W, Bers DM. Fractional SR Ca release is regulated by trigger Ca and SR Ca content in cardiac myocytes. American Journal of Physiology. 1995;268:C1313–1319. doi: 10.1152/ajpcell.1995.268.5.C1313. [DOI] [PubMed] [Google Scholar]
- Bers DM. Ca influx and sarcoplasmic reticulum Ca release in cardiac muscle activation during post rest recovery. American Journal of Physiology. 1985;248:H366–381. doi: 10.1152/ajpheart.1985.248.3.H366. [DOI] [PubMed] [Google Scholar]
- Bers DM. SR Ca loading in cardiac muscle preparations based on rapid-cooling contractures. American Journal of Physiology. 1989;256:C109–120. doi: 10.1152/ajpcell.1989.256.1.C109. [DOI] [PubMed] [Google Scholar]
- Bers DM. Excitation-Contraction Coupling and Cardiac Contractile Force. Dordrecht: Kluwer Academic; 1991. [Google Scholar]
- Bers DM, Berlin JR. Kinetics of [Ca]i decline in cardiac myocytes depend on peak [Ca]i. American Journal of Physiology. 1995;268:C271–277. doi: 10.1152/ajpcell.1995.268.1.C271. [DOI] [PubMed] [Google Scholar]
- Bers DM, Bridge JH. Effect of acetylstrophanthidin on twitches, microscopic tension fluctuations and cooling contractures in rabbit ventricle. The Journal of Physiology. 1988;404:53–69. doi: 10.1113/jphysiol.1988.sp017278. [DOI] [PMC free article] [PubMed] [Google Scholar]
- Beuckelmann DJ, Nabauer M, Erdmann E. Intracellular calcium handling in isolated ventricular myocytes from patients with terminal heart failure. Circulation. 1992;85:1046–1055. doi: 10.1161/01.cir.85.3.1046. [DOI] [PubMed] [Google Scholar]
- Bridge JHB. Relationships between sarcoplasmic reticulum and trans-sarcolemmal Ca transport revealed by rapidly cooling rabbit ventricular muscle. Journal of General Physiology. 1986;88:437–473. doi: 10.1085/jgp.88.4.437. [DOI] [PMC free article] [PubMed] [Google Scholar]
- Convery MK, Hancox JC. Na+-Ca2+ exchanger current measured in isolated rabbit ventricular myocytes compared using voltage ramp and step protocols. The Journal of Physiology. 1998;509.P:155P. doi: 10.1007/s004240050866. [DOI] [PubMed] [Google Scholar]
- Eisner DA. Intracellular sodium in cardiac muscle: effects on contraction. Quarterly Journal of Experimental Physiology. 1990;75:437–457. doi: 10.1113/expphysiol.1990.sp003422. [DOI] [PubMed] [Google Scholar]
- Gray RP, Carey P, Sheridan DJ, Fry CH. The relationship between intracellular [Na], [Na]i, and force-frequency response in hypertrophied guinea-pig left ventricular myocardium. The Journal of Physiology. 1997;504.P:72P. [Google Scholar]
- Grynkiewicz G, Poenie M, Tsien RY. A new generation of Ca2+ indicators with greatly improved fluorescence properties. Journal of Biological Chemistry. 1985;260:3440–3450. [PubMed] [Google Scholar]
- Hasenfuss G, Meyer M, Schillinger W, Preuss M, Pieske B, Just H. Calcium handling proteins in the failing human heart. Basic Research in Cardiology. 1997;92(suppl. 1):87–93. doi: 10.1007/BF00794072. [DOI] [PubMed] [Google Scholar]
- He H, Giordano FJ, Hilal-Dandan R, Choi D, Rockman HA, Mcdonough PM, Bluhm WF, Meyer M, Sayen R, Swanson E, Dillmann WH. Overexpression of the rat sarcoplasmic reticulum Ca2+ ATPase gene in the heart of transgenic mice accelerates calcium transients and cardiac relaxation. Journal of Clinical Investigation. 1997;100:380–389. doi: 10.1172/JCI119544. [DOI] [PMC free article] [PubMed] [Google Scholar]
- Hobai IA, Bates JA, Howarth FC, Levi AJ. Inhibition by external Cd2+ of Na/Ca exchange and L-type Ca channel in rabbit ventricular myocytes. American Journal of Physiology. 1997;272:H2164–2172. doi: 10.1152/ajpheart.1997.272.5.H2164. [DOI] [PubMed] [Google Scholar]
- Hove-Madsen L, Bers DM. Indo-1 binding to protein in permeabilized ventricular myocytes alters its spectral and Ca binding properties. Biophysical Journal. 1992;63:89–97. doi: 10.1016/S0006-3495(92)81597-7. [DOI] [PMC free article] [PubMed] [Google Scholar]
- Hryshko LV, Stiffel V, Bers DM. Rapid cooling contractures as an index of sarcoplasmic reticulum calcium content in rabbit ventricular myocytes. American Journal of Physiology. 1989;257:H1369–1377. doi: 10.1152/ajpheart.1989.257.5.H1369. [DOI] [PubMed] [Google Scholar]
- Janczewski AM, Spurgeon HA, Stern MD, Lakatta EG. Effects of sarcoplasmic reticulum Ca2+ load on the gain function of Ca2+ release by Ca2+ current in cardiac cells. American Journal of Physiology. 1995;268:H916–920. doi: 10.1152/ajpheart.1995.268.2.H916. [DOI] [PubMed] [Google Scholar]
- Kimura J, Miyamae S, Noma A. Identification of sodium-calcium exchange current in single ventricular cells of guinea-pig. The Journal of Physiology. 1987;384:199–222. doi: 10.1113/jphysiol.1987.sp016450. [DOI] [PMC free article] [PubMed] [Google Scholar]
- Kimura J, Noma A, Irisawa H. Na-Ca exchange current in mammalian heart cells. Nature. 1986;319:596–597. doi: 10.1038/319596a0. [DOI] [PubMed] [Google Scholar]
- Kurihara S, Sakai T. Effects of rapid cooling on mechanical and electrical responses in ventricular muscle of guinea-pig. The Journal of Physiology. 1985;361:361–378. doi: 10.1113/jphysiol.1985.sp015650. [DOI] [PMC free article] [PubMed] [Google Scholar]
- Lee CO. 200 years of digitalis: the emerging central role of the sodium ion in the control of cardiac force. American Journal of Physiology. 1985;249:C367–378. doi: 10.1152/ajpcell.1985.249.5.C367. [DOI] [PubMed] [Google Scholar]
- Naqvi RU, Macleod KT. Effect of hypertrophy on mechanisms of relaxation in isolated cardiac myocytes from guinea pig. American Journal of Physiology. 1994;267:H1851–1861. doi: 10.1152/ajpheart.1994.267.5.H1851. [DOI] [PubMed] [Google Scholar]
- Naqvi RU, Terracciano CMN, Macleod KT. Rapid cooling of voltage-clamped guinea-pig cardiac myocytes produces an inward current which could be attributable to Na/Ca exchange. Biophysical Journal. 1994;66:A96. [Google Scholar]
- Nicoll DA, Longoni S, Philipson KD. Molecular cloning and functional expression of the cardiac sarcolemmal Na+-Ca2+ exchanger. Science. 1990;250:562–564. doi: 10.1126/science.1700476. [DOI] [PubMed] [Google Scholar]
- Pieske B, Maier LS, Minami K, Just H, Hasenfuss G. Frequency-dependent changes in intracellular Na concentration in isolated human myocardium. Heart Failure 97, European Society of Cardiology. 1997;90 (abstract) [Google Scholar]
- Satoh H, Delbridge LMD, Blatter LA, Bers DM. Surface:volume relationship in cardiac myocytes studied with confocal microscopy and membrane capacitance measurements: species-dependence and developmental effects. Biophysical Journal. 1996;70:1494–1504. doi: 10.1016/S0006-3495(96)79711-4. [DOI] [PMC free article] [PubMed] [Google Scholar]
- Silverman HS, Haigney MCP, Griffiths EJ, Wei S, Ocampo CJ, Philipson KD, Stern MD. Excitation-contraction coupling in ventriculocytes from transgenic mice with high level expression of canine sarcolemmal sodium-calcium exchange. Circulation. 1995;92:I-236 (abstract). [Google Scholar]
- Siri FM, Krueger J, Nordin C, Ming Z, Aronson RS. Depressed intracellular calcium transients and contraction in myocytes from hypertrophied and failing guinea pig hearts. American Journal of Physiology. 1991;261:H514–530. doi: 10.1152/ajpheart.1991.261.2.H514. [DOI] [PubMed] [Google Scholar]
- Sitsapesan R, Montgomery RAP, Macleod KT, Williams AJ. Sheep cardiac sarcoplasmic reticulum calcium-release channels: modification of conductance and gating by temperature. The Journal of Physiology. 1991;434:469–487. doi: 10.1113/jphysiol.1991.sp018481. [DOI] [PMC free article] [PubMed] [Google Scholar]
- Sitsapesan R, Williams AJ. Regulation of current flow through Ryanodine receptors by luminal Ca2+ Journal of Membrane Biology. 1997;159:179–185. doi: 10.1007/s002329900281. 10.1007/s002329900281. [DOI] [PubMed] [Google Scholar]
- Steadman BW, Moore KB, Spitzer KW, Bridge JH. A video system for measuring motion in contracting heart cells. IEEE Transactions on Biomedical Engineering. 1988;35:264–272. doi: 10.1109/10.1375. 10.1109/10.1375. [DOI] [PubMed] [Google Scholar]
- Studer R, Reinecke H, Bilger J, Eschenhagen T, Böhmouml;hm M, Hasenfuss G, Just H, Holtz J, Drexler H. Gene expression of the cardiac Na+-Ca2+ exchanger in end-stage human heart failure. Circulation Research. 1994;75:443–453. doi: 10.1161/01.res.75.3.443. [DOI] [PubMed] [Google Scholar]
- Terracciano CMN, Naqvi RU, Macleod KT. Effects of rest interval on the release of calcium from the sarcoplasmic reticulum in isolated guinea pig ventricular myocytes. Circulation Research. 1995;77:354–360. doi: 10.1161/01.res.77.2.354. [DOI] [PubMed] [Google Scholar]
- Terracciano CMN, Macleod KT. Measurements of Ca entry and SR Ca content during the cardiac cycle in guinea-pig and rat ventricular myocytes. Biophysical Journal. 1997a;72:1319–1326. doi: 10.1016/S0006-3495(97)78778-2. [DOI] [PMC free article] [PubMed] [Google Scholar]
- Terracciano CMN, Macleod KT. Effects of lactate on the relative contribution of Ca2+ extrusion mechanisms to relaxation in guinea-pig ventricular myocytes. The Journal of Physiology. 1997b;500:557–570. doi: 10.1113/jphysiol.1997.sp022042. [DOI] [PMC free article] [PubMed] [Google Scholar]
- Terracciano CMN, Tweedie D, Macleod KT. The effects of changes to action potential duration on the calcium content of the sarcoplasmic reticulum in isolated guinea-pig ventricular myocytes. Pflügers Archiv. 1997;443:542–544. doi: 10.1007/s004240050312. [DOI] [PubMed] [Google Scholar]
- Varro A, Negretti N, Hester SB, Eisner DA. An estimate of the calcium content of the sarcoplasmic reticulum in rat ventricular myocytes. Pflügers Archiv. 1993;423:158–160. doi: 10.1007/BF00374975. [DOI] [PubMed] [Google Scholar]
- Wolska BM, Solaro RJ. Method for isolation of adult mouse cardiac myocytes for studies of contraction and microfluorimetry. American Journal of Physiology. 1996;271:H1250–1255. doi: 10.1152/ajpheart.1996.271.3.H1250. [DOI] [PubMed] [Google Scholar]
- Yao A, Su Z, Nonaka A, Zubair I, Lu L, Philipson KD, Bridge JHB, Barry WH. The effects of overexpression of the Na/Ca exchanger on [Ca2+]i transients in murine ventricular myocytes. Circulation Research. 1998 doi: 10.1161/01.res.82.6.657. (in the Press) [DOI] [PubMed] [Google Scholar]