Abstract
The electrophysiological properties of parasympathetic preganglionic neurones in the superior salivatory nucleus were studied in thin- and thick-slice preparations of rats aged 1 and 2 weeks using the whole-cell patch-clamp technique.
The superior salivatory neurones were identified by a retrograde tracing method with dextran-tetramethylrhodamine-lysine. The injection of the tracer into the chorda-lingual nerve labelled the neurones innervating the submandibular ganglia and those innervating the intra-lingual ganglia, while the injection into the tip of the tongue labelled the latter group of neurones.
Firing characteristics were investigated mainly in the neurones of 6–8 days postnatal rats. In response to an injection of long depolarizing current pulses at hyperpolarized membrane potentials (< −80 mV) under a current clamp, the neurones labelled from the nerve displayed a train of action potentials with either a long silent period preceding the first spike (late spiking pattern) or a long silent period interposed between the first and second spikes (interrupted spiking pattern). The neurones labelled from the tongue invariably displayed the interrupted spiking pattern.
Under a voltage clamp, among the neurones from 6–8 days postnatal rats, those labelled from the nerve expressed either a fast or a slow transient outward current (A-current), while those labelled from the tongue invariably showed a slow transient outward current. Both the fast and slow A-currents were largely depressed by 1 mm 4-aminopyridine.
Similar fast and slow A-currents were observed in the neurones of rats aged 14–15 days. Both the time to peak and decay time constant of these A-currents were accelerated, suggesting a developmental trend of maturation in the activation and inactivation kinetics between 6 and 15 days postnatal.
Based on the differences in the firing pattern and outward current, the superior salivatory neurones can be separated into two distinct types. We discuss the functional aspects of these two types of neurones with reference to their target organs.
Parasympathetic preganglionic neurones of the superior salivatory nucleus are diffusely distributed in the lateral reticular formation of the medulla oblongata (e.g. Contreras et al. 1980; Mitchell & Templeton, 1981). Many of the superior salivatory neurones send their fibres (the preganglionic parasympathetic fibres) to the submandibular ganglia and to the intra-lingual ganglia in the anterior part of the tongue, via the intermediate, chorda tympani and chorda-lingual nerves (Chibuzo et al. 1980; Yu & Srinivasan, 1980). As with other parasympathetic preganglionic neurones, the superior salivatory neurones are considered to be cholinergic (Large & Sim, 1986; Yawo, 1989). Biophysical studies have revealed that cholinergic neurones, such as preganglionic sympathetic neurones (Yoshimura et al. 1987) and pedunculopontine tegmental or mesopontine neurones (Kamondi et al. 1992), often express the transient outward current (A-current), which is reflected in a late spiking pattern or a large spike after-hyperpolarization (Manis, 1990; Kang & Kitai, 1990). However, little is known about the electrophysiological properties of preganglionic parasympathetic neurones, including the superior salivatory neurones.
The firing patterns of the superior salivatory neurones during reflex activation have been indirectly examined by recording impulses from the preganglionic fibres supplying the salivary glands of anaesthetized rodents. Most of the fibres showed tonic firing at a low rate (5–18 impulses s−1, mean value over 5–15 s), while some fibres showed periodical grouped discharges or phasic tonic discharges (Kawamura & Yamamoto, 1978; Matsuo & Kusano, 1984; Matsuo & Yamamoto, 1989). These findings suggest that the superior salivatory neurones may have biophysical membrane properties that limit firing frequencies to relatively low values, and that the neurones may be separated into different subtypes based on their firing pattern. To test this hypothesis and to investigate the membrane properties, we made whole-cell recordings on retrogradely identified superior salivatory neurones maintained in brainstem slice preparations obtained from neonatal rats aged 6–15 days. We investigated mainly voltage-activated potassium currents, which are important for limiting the firing frequency and for determining the firing pattern and action potential waveform (for review see Rudy, 1988). The neurones were found to display two distinct types of A-currents, depending on their peripheral targets (i.e. the salivary glands and the anterior part of the tongue). Since the rat submandibular gland as well as the submandibular ganglia undergo progressive development to attain mature functions during the early postnatal period (e.g. Jacoby & Leeson, 1959; Schneyer & Schneyer, 1961; Lichtman, 1977; Bylund et al. 1982), the superior salivatory neurones of neonatal rats are also likely to be under development. However, a clear developmental trend of maturation was seen in the activation and inactivation kinetics of the A-currents expressed in the neurones obtained from rats aged 1 and 2 weeks.
METHODS
Histological study
We examined the morphological development of the superior salivatory neurones, which were used for the assessment of changes in the current density of the transient outward currents. Eight neonatal (6-day-old, both sexes) and three adult male (weighing 250–310 g) Wistar rats (Charles River Breeders, Osaka, Japan) were used for the histological investigation. The animal protocols were in accord with the Guiding Principles for the Care and Use of Animals approved by the Council of the Physiological Society of Japan. Horseradish peroxidase (25 % solution in physiological saline; Grade III, Toyobo, Osaka) was injected into the chorda-lingual nerve or the anterior part of the tongue (for 4 neonatal rats, only) as the tracer material. Prior to surgery, the neonatal rats were anaesthetized with ether (3 ml allowed to evaporate in a transparent topped container of approximately 500 ml capacity) and the surgical operation was performed with the rat maintained on chipped ice to prolong the surgical level of anaesthesia. The adult rats were anaesthetized with an intraperitoneal (i.p.) injection of sodium pentobarbitone (50–75 mg kg−1). For the tracer injection into the tongue of neonatal rats, 1 μl of the tracer solution was infused into the left tip of the tongue using a Hamilton microsyringe with a 30 gauge needle. For the injection into the chorda-lingual nerve, the left side of the lingual and chorda tympani nerves were exposed by the ventral approach, and the lingual nerve was cut central to its junction with the chorda tympani. An aliquot of the tracer solution (0.1–0.15 μl for neonatal and 0.5 μl for adult rats) was injected into the chorda-lingual nerve central to the intersection of the nerve and the ducts of the submandibular and sublingual glands, using a Hamilton microsyringe with a glass micropipette (50 μm tip diameter). To prevent leakage of the injected tracer, the injection site was sealed with silicone gel (KE445W, Shin Etsu Co., Tokyo, Japan), and the wound was sutured. After recovery from anaesthesia, the adult rats were returned to their home cage and allowed access to water and food pellets. The neonatal rats were returned to their mothers, and were carefully observed until mother-infant feeding interaction was observed. All the animals survived surgery without apparent ill effects or signs of discomfort. After 1 (for neonatal rats) or 2 days recovery (for adult rats), the animals were killed by an intraperitoneal injection of an overdose of sodium pentobarbitone (100 mg kg−1), and then 2 l kg−1 of a mixture of 0.05 % glutaraldehyde and 4 % paraformaldehyde in 0.1 M phosphate buffer (pH 7.3) was perfused for 30 min. This was followed by the perfusion of 2 l kg−1 of the same buffer containing 10 % sucrose. The brainstem was immediately removed and saturated with a solution of 25 % sucrose in the same buffer for 24 h at 4°C. Transverse serial frozen sections of the brainstem were cut to a thickness of 30 μm. Histochemical processing was performed using tetramethyl benzidine (Sigma). Sections were mounted onto chrome alum-coated slides and counterstained with 1 % Neutral Red. Cells labelled with horseradish peroxidase were observed by dark- and light-field microscopy and photographed. The photographs were fed to a personal computer equipped with an image processor (NIH image, the NIH Division of Computer Research and Technology), and the size of labelled cells was calculated by averaging the long and short diameters of the cell bodies.
Electrophysiological study
Whole-cell patch-clamp recordings were made from the superior salivatory neurones in thin- and thick-slice preparations obtained from 6–8 and 14–15 days postnatal rats of both sexes, respectively. Two days before the slices were prepared, 10 % dextran-tetramethylrhodamine-lysine (in physiological saline; 10 000 MW, Molecular Probes, USA) was injected into the chorda-lingual nerve or the tip of the tongue for the retrograde labelling of the superior salivatory neurones. The methods for anaesthesia and injection of the tracer were the same as those used for the morphological study in neonatal rats. After 2 days recovery, each animal was anaesthetized with ether and placed on chipped ice for 5–10 min. The brain was then quickly removed and cut with a razor blade to give a portion containing the lower brainstem and cerebellum. Slices of 120–150 μm and 300–350 μm thickness for the brains of rats aged 6–8 days and 14–15 days, respectively, were cut coronally.
The standard Ringer solution had the following composition (mm): 124 NaCl, 1.8 KCl, 2.5 CaCl2, 1.0 MgCl2, 26 NaHCO3, 1.2 KH2PO4, and 10 glucose, bubbled with a mixture of 95 % O2-5 % CO2. After tetramethylrhodamine-labelled neurones were identified as fluorescence images using a G-2A dichroic mirror, they were viewed using Nomarski optics to obtain whole-cell recordings in thin-slice preparations. In the case of thick-slice preparations, infrared differential interference contrast video-microscopy was used for the visualization of neurones. The patch pipettes had a DC resistance of 5–7 MΩ when filled with the standard pipette solution (mm): 120 potassium gluconate, 20 KCl, 10 NaCl, 2 MgCl2, 2 Na2ATP, 10 Hepes, 0.2 EGTA; the pH was adjusted to 7.2 with KOH. [Ca2+]o was reduced to 1.0 mm by substitution with equimolar Mg2+ in the voltage-clamp experiments. The liquid junction potential between the internal solution (negative) and the standard Ringer solution was approximately 10 mV. The liquid junction potential was measured with a patch pipette filled with 3 M KCl. The membrane potential values given in the text were corrected for the junction potential. All recordings were made at room temperature (21–24°C). The sealing resistance was usually more than 10 GΩ. The series resistance was usually less than 15 MΩ, and the recordings in which the series resistance was more than 20 MΩ were not included in the analysis. The series resistance was compensated by approximately 50 %. Whole-cell currents were low-pass filtered at 5–10 kHz (3-pole Bessel filter), digitized at a sampling rate of 2 kHz (ITC-16, Axon, USA) and stored on the hard disk of a computer. Tetrodotoxin (1 μm, for blocking Na+ current under the voltage clamp) and 4-aminopyridine (1 mm) were added to the perfusate.
RESULTS
Morphology of superior salivatory neurones
The photomicrograph in Fig. 1A shows horseradish peroxidase-labelled cells of a 7-day-old rat found in the lateral reticular formation medial to the oral subnucleus of the spinal trigeminal nucleus at the level of the rostral part of the facial nucleus, following tracer injection into the chorda-lingual nerve. The labelled neuronal cell bodies had oval, triangular or square shapes and had two to four primary dendrites. The mean number of dendrites in the 7-day-old and adult rats was 3.05 ± 0.09 (mean ±s.e.m., n = 78) and 3.02 ± 0.10 (n = 82), respectively; with no significant difference between them (P > 0.05, Student's t test). The mean sizes of the cell bodies in the 7-day-old and adult rats were 13.8 ± 0.2 (mean ±s.e.m., n = 78) and 13.9 ± 0.3 μm (n = 82), respectively; also not significantly different (P > 0.05, Student's t test). Therefore, no obvious changes in the somata of the superior salivatory neurones were detected in the neonatal and adult rats. When horseradish peroxidase was injected into the tongue of neonatal rats, a similar size of cell bodies and number of primary dendrites were observed, although the number of labelled cells from the tongue was about one third of that labelled from the nerve. Figure 1B shows a superior salivatory neurone in a slice preparation obtained from a 7-day-old rat, which was retrogradely labelled by the injection of tetramethylrhodamine into the chorda-lingual nerve for electrophysiological study. The Nomarski image of the same neurone is shown in Fig. 1C.
Figure 1. Morphology of the superior salivatory neurones.
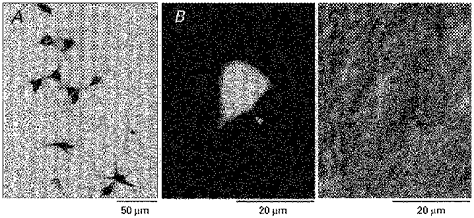
A, the superior salivatory neurones retrogradely labelled by the injection of horseradish peroxidase into the chorda-lingual nerve of a 7-day-old rat. The cell body size and the number of primary dendrites were similar to those of adult rats. B and C, a neurone of a 7-day-old rat labelled by dextran-tetramethylrhodamine lysine injected into the chorda-lingual nerve, under fluorescence and Nomarski images, respectively (indicated by arrowheads). These photomicrographs were taken after whole-cell recording.
Firing properties of superior salivatory neurones
The firing properties were investigated in the superior salivatory neurones of 6- to 8-day-old rats. In response to the injection of a long depolarizing current pulse at hyperpolarized membrane potentials (e.g. −90 mV), the neurones which were retrogradely labelled from the chorda-lingual nerve displayed a train of action potentials either in a pattern with a long silent period preceding the first spike (late spiking pattern, n = 11) or in a pattern with a long silent period interposed between the first and second spikes (interrupted spiking pattern, n = 5). In contrast, the neurones that were retrogradely labelled from the tongue always displayed the interrupted spiking pattern (n = 7). Figure 2Aa shows a sample record of the late spiking pattern, in which a hyperpolarizing notch (indicated by an arrowhead) followed by a ramp-like depolarization leading to the generation of the first spike was observed. Even with stronger current pulses, the first spike was barely evoked at the onset of depolarizing-current pulses but was triggered from the ramp-like depolarization following the hyperpolarizing notch. Thus, a silent period preceded the first spike irrespective of the varying intensities of current pulses in the late spiking neurones. When depolarizing current pulses were applied at a slightly depolarized membrane potential (−80 mV), the first spike could occasionally be evoked at the onset of current pulses and was followed by a silent period before the second spike (Fig. 2Ab), similar to that of the interrupted spiking pattern (Fig. 2Ba and b). However, the amplitude of the first spike was invariably smaller than that of the remaining spikes in the train (Fig. 2Ab). This is in contrast to the pattern seen in the neurones displaying the interrupted spiking pattern, wherein the amplitude of the first spike was the largest in the train of spikes, irrespective of the changes in the membrane potential or in the current pulse intensities (Fig. 2Ba and b). When single spikes were evoked in neurones by an injection of short current pulses at depolarized membrane potentials (e.g. −65 mV), the half-duration of spike after-hyperpolarization (397 ± 76 ms, mean ±s.e.m., n = 5) seen in the late spiking neurones was significantly longer (161 ± 13 ms, n = 5) than that seen in the interrupted spiking neurones (P < 0.05, Student's t test; Fig. 2Ac and Bc). The threshold for evoking these single spikes was −43.2 ± 2.7 mV (mean ±s.e.m., n = 5) in the late spiking neurones and −39.6 ± 0.9 mV (n = 5) in the interrupted spiking neurones.
Figure 2. Two types of firing pattern in the superior salivatory neurones.
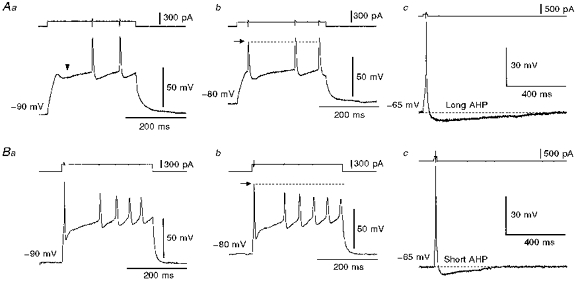
A, a neurone labelled from the chorda-lingual nerve displayed late (a) and interrupted (b) spiking patterns in response to injections of long depolarizing current pulses applied at membrane potentials of −90 and −80 mV, respectively. The arrowhead (a) indicates a hyperpolarizing notch. This neurone showed a long after-hyperpolarization (AHP) near its resting membrane potential (c). B, a neurone labelled from the tongue displayed the interrupted spiking pattern at membrane potentials more hyperpolarized than −80 mV (a and b). This neurone showed a relatively short after-hyperpolarization near its resting membrane potential (c).
At resting membrane potentials, both types of neurones displayed regular spiking patterns in response to injections of long depolarizing current pulses (Fig. 3Aa and Ba). There was no significant difference in the resting membrane potential between the late spiking (−65.8 ± 2.6 mV, mean ±s.e.m., n = 11) and interrupted spiking neurones (−66.0 ± 1.3 mV, n = 12; P > 0.05, Student's t test). The quantitative relationship between the intensity of injected current pulses and the firing frequency is illustrated in Fig. 3. With increasing current intensity, the firing frequency calculated from the interspike interval between the first and second spikes increased linearly to a plateau level (or its increase was saturated) at 20–30 Hz in the late spiking neurones and at 40–70 Hz in the interrupted spiking neurones (Fig. 3Ab and Bb). This difference in the maximum firing capability was due mainly to the difference in the half-duration of spike after-hyperpolarization, which correlates with the refractory period. Figure 3Ac and Bc shows the time courses of changes in the firing frequency in the respective trains of action potentials evoked by an injection of long depolarizing current pulses with various intensities. Each frequency value as the reciprocal of interspike intervals in the train of action potentials was plotted as a function of the time of occurrence of spikes after the step onset. This graphical analysis revealed that the late spiking neurones fired tonically during a depolarizing current pulse, whereas the interrupted spiking neurones showed a spiking pattern characterized by an initial transient discharge at higher frequencies followed by a tonic discharge at lower frequencies. Thus, the superior salivatory neurones were separated into two distinct subtypes according to the difference in firing patterns, which may be attributable to differences in their outward currents.
Figure 3. Firing characteristics of two types of superior salivatory neurones.
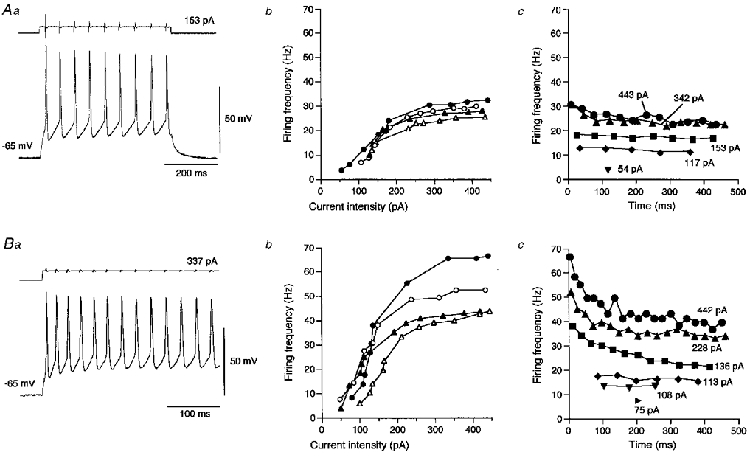
In A and B, a shows sample records of trains of spikes evoked at −65 mV in 2 types of neurones displaying late (A) and interrupted (B) spiking patterns. b shows the relationship between firing frequency and current intensity obtained from 4 neurones of each type. Each frequency was calculated from the inter-spike interval between the first and second spikes. c shows the typical time course of firing frequencies calculated from successive inter-spike intervals in trains of spikes evoked by current pulses of various intensities.
Outward currents in superior salivatory neurones
Voltage-clamp experiments were performed to investigate outward currents in the superior salivatory neurones. The superior salivatory neurones could be separated into two distinct subtypes based on the differences in the outward currents; one displayed a fast transient outward current (fast A-current) followed by a very slowly decaying outward current, while the other type displayed a relatively slow transient outward current (slow A-current) followed by a very slowly decaying outward current.
At a holding potential of −60 mV, depolarizing command pulses of 1500 ms duration were applied either immediately or with a delay of 200 ms after a 1000 ms hyperpolarizing prepulse to −120 mV. As shown in Fig. 4Aa and Ba, two types of A-currents were elicited in the neurones retrogradely labelled from the chorda-lingual nerve with voltage steps between −120 and −10 mV. With the delayed prepulse protocol, the A-currents could be almost completely inactivated, leaving very slowly decaying or persistent outward currents (Fig. 4Ab and Bb). Figure 4Ac and Bc shows the isolated A-currents obtained by the subtraction of the corresponding current traces in Fig. 4Ab and Bb from those in Fig. 4Aa and Ba, respectively. Thus, the neurones labelled from the chorda-lingual nerve displayed either a fast or a slow A-current. In contrast, the neurones labelled from the tongue invariably displayed the slow A-current, never the fast A-current.
Figure 4. Isolation of A-current from total outward current.
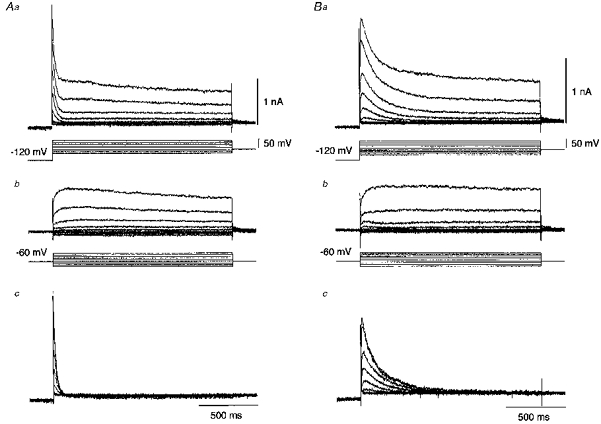
A and B were obtained from the superior salivatory neurones labelled from the chorda-lingual nerve. Depolarizing voltage commands (1.5 s) in steps of +10 mV were followed by a 1 s hyperpolarizing prepulse to −120 mV either immediately (a) or with the interposition of a 200 ms delay at a holding potential of −60 mV between the prepulse and command pulses (b). c, the digital subtraction of currents in b from currents in a revealed isolated transient outward currents.
The decay time courses of the isolated fast A-currents and slow A-currents evoked at −10 mV in the neurones labelled from the chorda-lingual nerve could be fitted by monoexponential functions (Fig. 5Aa and b), and the slow A-current evoked at −10 mV in the neurones labelled from the tongue also decayed mono-exponentially (Fig. 5Ac). The rising time course was also faster in the fast A-currents than in the slow A-currents, as seen in the superimposed traces of Fig. 5Ad. There was no appreciable difference in the rising and decaying time courses between the slow A-currents recorded in the neurones labelled from the chorda-lingual nerve and from the tongue. The decay time constants of the mono-exponential functions were plotted against the time to peak of the fast and slow A-currents, as shown in Fig. 5Ba. The plotted values sampled from the neurones labelled from the chorda-lingual nerve were bimodally distributed; the mean value of the time to peak and decay time constant of the fast A-current (filled circles) were 5.9 ± 0.6 and 30.3 ± 3.2 ms (means ±s.e.m., n = 11), respectively, and those of the slow A-current (open circles) were 14.0 ± 0.9 and 102.4 ± 7.2 ms (n = 8), respectively. The plotted values sampled from the neurones labelled from the tongue (filled triangles) always fell into the latter group; the mean values of the time to peak and decay time constant were 14.3 ± 0.6 and 98.7 ± 8.9 ms (n = 7), respectively. Both the time to peak and the decay time constant decreased with the membrane depolarization of test pulses (Fig. 5Bb and c). Thus, there were significant differences between the fast and slow A-currents in the time to peak (P < 0.01, Student's t test) and the decay time constant (P < 0.01, Student's t test).
Figure 5. Time course of the isolated A-currents.
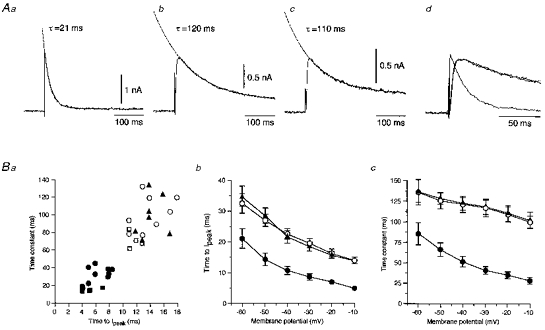
A, the isolated fast A-current recorded from the superior salivatory neurones labelled from the chorda-lingual nerve (a) and the slow A-currents recorded from neurones labelled from the nerve (b) and the tongue (c). Traces of a, b and c were superimposed at a faster time base in d. Ba, relationships between the decay time constants and the time to peak of the isolated fast (n = 12: •, recorded from the neurones labelled from the chorda-lingual nerve) and slow A-currents (n = 8: ○, recorded from the neurones labelled from the chorda-lingual nerve; n = 7: ▴, recorded from those labelled from the tongue). ○ (n = 4) and □ (n = 4) indicate the values of the isolated fast and slow A-currents, respectively, obtained from 14- to 15-day-old rats. Each value was obtained at −10 mV. The mean time to peak (b) and the mean decay time constant (c) decreased with the membrane depolarization of test pulses.
Kinetics of the fast and slow A-currents
Voltage-dependent steady-state activations of the isolated fast and slow A-currents (Fig. 4A and B) were clarified by examining the relationship between the normalized peak conductance and the command voltage step. Conductance was calculated by dividing the measured peak currents by the driving potential (VM - EK; EK =−97 mV). The normalized conductance-membrane potential relationships were fitted by a Boltzmann equation of the form:
where Gmax is the maximal membrane conductance, V½ is the voltage at half-maximal conductance, and k is the slope factor. As shown in Fig. 6Ac and Bc, the activation curves for the isolated fast (open squares) and slow A-currents (filled squares) were well fitted by the Boltzmann equation, with V½ =−49.7 ± 0.4 mV and k =−7.6 ± 0.4 mV for the fast A-current (means ±s.e.m., n = 9, thick continuous curve representing the activation in Fig. 6Ac) and V½ =−50.3 ± 0.4 mV and k =−8.9 ± 0.3 mV for the slow A-current (n = 10, thick continuous curve representing the activation in Fig. 6Bc).
Figure 6. Voltage dependence of activation and inactivation for A-currents.
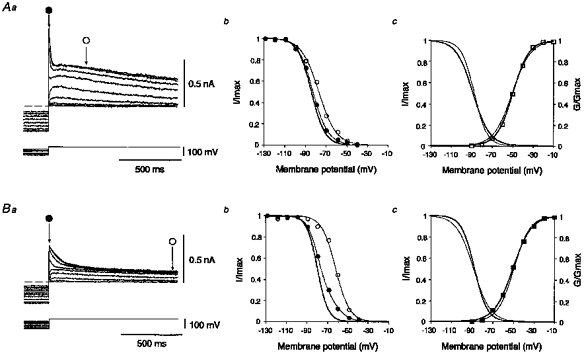
Aa and Ba, superimposed traces of fast and slow A-currents followed by slowly decaying components elicited at −10 mV on return from various hyperpolarizing voltage steps. The dashed lines indicate the base-line current. Ab and Bb, the relative amplitudes (I/Imax) of relaxing outward currents versus prepulse voltages. Thin continuous curves with ○ are inactivating curves for the slowly decaying components measured at ○ in Aa and Ba. Thin continuous curves with • are those for the peak outward currents measured at • in Aa and Ba. Thick continuous curves are the mathematically estimated inactivation curves for fast and slow A-currents (see text). Ac and Bc, the mean normalized conductance (G/Gmax) of the isolated fast (n = 9, □) and slow A-currents (n = 10, ○) were plotted against the voltage of command pulses. The thick continuous curves represent the voltage-dependent activation of the fast (Ac) and slow A-currents (Bc). For comparison, the voltage-dependent activation (thin continuous curves) of the slow and fast A-currents were also drawn in Ac and Bc, respectively. The thick continuous curves (left) represent the mathematically isolated mean inactivation of the fast (n = 7, Ac) and slow A-currents (n = 9, Bc). For comparison, the voltage-dependent inactivation (thin continuous curves at left) of the slow and fast A-currents were also drawn in Ac and Bc, respectively.
The voltage dependency of steady-state inactivation of fast and slow A-currents was also studied. Hyperpolarizing prepulses of 1 s duration with varying amplitudes between −40 and −120 mV were applied at a holding potential of −10 mV. As the amplitude of the hyperpolarizing prepulses was reduced, both the transient (fast and slow A-currents) and the slowly-decaying outward currents decreased in amplitude, as shown in Fig. 6Aa and Ba. The amplitudes of the slowly decaying components following the fast and slow A-currents were measured 300 and 1000 ms, respectively, after the offset of the hyperpolarizing prepulses where fast and slow A-currents should be completely inactivated. These amplitudes of the slowly decaying component (open circles in Fig. 6Aa and Ba) and peak current amplitudes (filled circles in Fig. 6Aa and Ba) were normalized with respect to their maximal currents, and plotted against the respective prepulse voltages (Fig. 6Ab and Bb). Since the peak current is the sum of the transient component and the slowly decaying component, the inactivation curve for the peak current can be fitted by a sum of two Boltzmann equations, one of which can be independently estimated by fitting the inactivation curve for the slowly decaying component. As shown in the examples in Fig. 6, the voltage-dependent inactivation of the slowly decaying components was fitted by each Boltzmann equation with V½ =−76.9 mV and k = 8.4 mV (Fig. 6Ab) and V½ =−61.5 mV and k = 6.7 mV (Fig. 6Bb). Using these values of V½ and k, the other Boltzmann equations representing the inactivation curves for the fast and slow A-currents could be accurately estimated to have values of V½ =−84.1 mV and k = 6.5 mV and V½ =−79.3 mV and k = 5.2 mV, respectively (thick continuous curves in Fig. 6Ab and Bb). The mean inactivation curves for the fast and slow A-currents were mathematically isolated and expressed as Boltzmann equations with V½ =−88.5 ± 2.9 mV and k = 8.2 ± 0.9 mV for the fast A-current (means ±s.e.m., n = 7, thick continuous curve representing the inactivation in Fig. 6Ac) and V½ =−87.4 ± 3.6 mV and k = 6.2± 1.2 mV for the slow A-current (n = 9, thick continuous curve representing the inactivation in Fig. 6Bc). There were no significant differences in the voltage-dependent steady-state activation and inactivation between the fast and slow A-currents (P > 0.05, Student's t test).
The time course of the recovery from inactivation was studied by applying prepulses of variable duration to −110 mV at a holding potential of −10 mV. With an increase in the duration of prepulses, both the transient and the slowly decaying components became apparent, as shown in Fig. 7Aa and Ba. The peak current amplitudes and the amplitudes of the slowly decaying components measured 300 and 1000 ms after the offset of prepulses for the fast (Fig. 7Aa) and slow A-currents (Fig. 7Ba), respectively, were plotted against the prepulse durations (Fig. 7Ab and Bb). Since the peak current is the sum of the transient component and the slowly decaying component, the time course of the recovery from inactivation for the peak current (open circles in Fig. 7Ab and Bb) can be fitted by the sum of two exponential equations, one of which can be independently estimated by the time course of the recovery from inactivation for the slowly decaying component. Therefore, we first estimated the recovery time courses for the slowly decaying components, which were fitted by exponential equations with time constants of 132.2 and 70.4 ms (filled circles in Fig. 7Ab and Bb, respectively). Then, using these time constants, the other time constants representing the removal time course of the inactivation of the fast and slow A-currents were estimated to be 28.9 and 21.2 ms, respectively (open circles in Fig. 7Ab and Bb). The mean time constants describing the removal of inactivation were 22.6 ± 2.5 ms (mean ±s.e.m., n = 5) and 19.8 ± 0.9 ms (n = 5) for the fast and slow A-currents, respectively. There was no significant difference in the recovery time constant between the two types of A-currents (P > 0.05, Student's t test).
Figure 7. The time-dependent recovery from inactivation of A-currents.
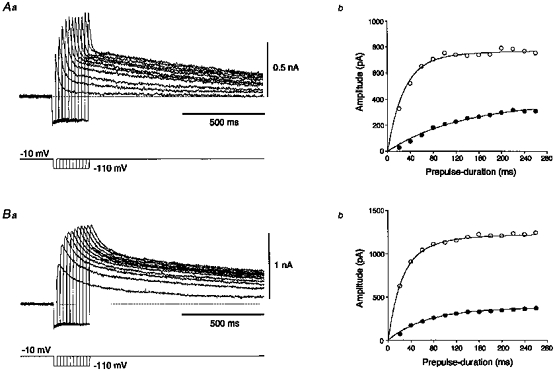
Aa and Ba, superimposed traces of fast (A) and slow (B) transient outward currents followed by slowly decaying components elicited at −10 mV on return from hyperpolarizing prepulses of various durations stepped to −110 mV. Ab and Bb, plots of the amplitudes of peak outward currents (○) and slowly decaying components (•) versus prepulse duration. The slowly decaying components recovered mono-exponentially. The recovery time courses of the peak currents were bi-exponential with time constants of τ1 = 132.2 ms, τ2 = 28.9 ms and τ1 = 70.4 ms, τ2 = 21.2 ms, respectively. Each of the latter time constants represents the recovery time constant of the fast (28.9 ms) and slow A-current (21.2 ms).
Effects of 4-aminopyridine on the A-currents
Since the A-current has been reported to be sensitive to 4-aminopyridine (Thompson, 1982), the sensitivity of the two types of A-currents to 4-aminopyridine was also examined. As shown in Figs 8Ba and 9Ba, 1 mm 4-aminopyridine reversibly reduced the peak amplitudes of the net outward currents involving fast and slow A-currents by 38.2 ± 2.7 % (n = 4) and 45.1 ± 3.9 % (n = 4; mean ±s.e.m.), respectively. The late slowly decaying components measured 300 and 1000 ms after the onset of command pulses were not markedly affected by 4-aminopyridine (Figs 8Bb and 9Bb). Therefore, the amplitudes of the fast and slow A-currents were estimated by subtracting the late slowly decaying component from the peak of the net outward currents. We found that 1 mm 4-aminopyridine reduced the amplitudes of the fast and slow A-currents by 71.4 ± 3.4 % (n = 4) and 65.2 ± 2.8 % (n = 4), respectively (Figs 8Bc and 9Bc). Since the extent of the block of the fast and slow A-currents was almost constant within the range of membrane potentials examined (Figs 8Bc and 9Bc), the block of both the fast and slow A-currents seemed to be voltage independent. Thus, 4-aminopyridine reversibly reduced both types of A-currents to an almost equal extent; there appeared to be no significant difference in the sensitivity of the fast and slow A-currents to 4-aminopyridine (P > 0.05, Student's t test).
Figure 8. Effects of 4-aminopyridine on the fast A-current.
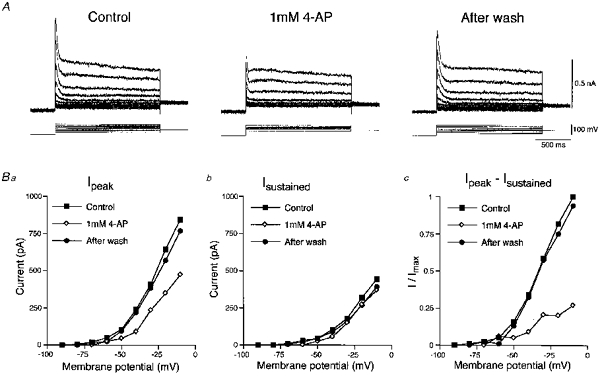
A, sample records of fast transient outward currents followed by slowly decaying components evoked at various membrane potentials before, during and after the application of 1 mm 4-aminopyridine. Ba, the amplitudes of peak outward currents (Ipeak) obtained before (○), during (⋄) and after the application of 4-aminopyridine (•) were plotted against the membrane potentials. Bb, the amplitudes of the slowly decaying components were measured 300 ms after the onset of command pulses (Isustained). Bc, the amplitudes of the fast A-currents were estimated by subtracting Isustained from Ipeak. The fast A-currents were largely depressed voltage independently.
Figure 9. Effects of 4-aminopyridine on the slow A-current.
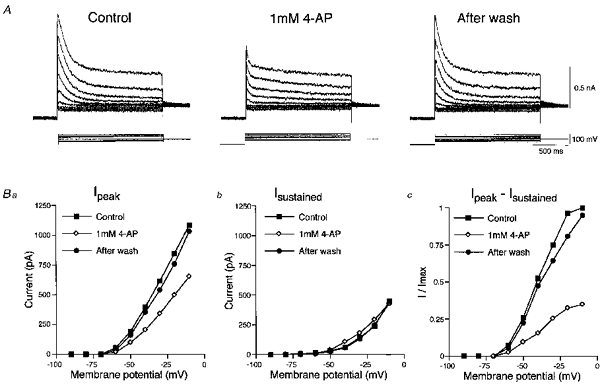
A, sample records of slow transient outward currents followed by slowly decaying components evoked at various membrane potentials before, during and after the application of 1 mm 4-aminopyridine. Ba, the peak amplitudes of the slow transient outward currents (Ipeak) obtained before (▪), during (⋄) and after the application of 1 mm 4-aminopyridine (•) were plotted against the membrane potentials. Bb, the amplitudes of the slowly decaying components were measured 1000 ms after the onset of command pulses (Isustained). Bc, the amplitudes of the slow A-currents were estimated by subtracting Isustained from Ipeak. The slow A-currents were largely depressed voltage independently.
Maturation of A-currents
In the present electrophysiological study, we used neonatal rats aged 6–8 days. Due to the technical limitations of the use of thin-slice preparations, it was not possible to obtain whole-cell recordings from more mature neurones. However, the superior salivatory neurones may be under development at this neonatal period. A-currents in dentate granule cells and hippocampal CA3 pyramidal cells have been reported to decrease in amplitude with development, due either to the ontogenic downregulation of A-currents (Strecker & Heinemann, 1993; Klee et al. 1995) or the translocation of K+ channels from somata to dendrites (Sheng et al. 1992). On the other hand, various matured neurones displayed A-currents (Stefani et al. 1992; Ducreux & Puizillout, 1995; Hulbek & Cobbett, 1997), and it is reported that A-currents matured in terms of kinetics during development, without a reduction in current density (Costa et al. 1994). Therefore, we further examined whether the two types of A-currents expressed in the neurones of 6- to 8-day-old rats changed with maturation. Even though we combined the retrograde labelling technique with an infrared differential interference contrast video-microscopy system using thick-slice preparations, it was not possible for us to obtain whole-cell recordings from neurones older than 15 days.
As shown in Fig. 10B and D, similar fast and slow A-currents were obtained from the neurones of 15-day-old rats. There were no significant differences (P > 0.05, Student's t test) in amplitude between fast A-currents obtained from neurones of 6- to 8-day-old and 14- to 15-day-old rats (1027 ± 348 and 1098 ± 284 pA; n = 5 and 4, respectively) or between slow A-currents obtained from neurones of 6- to 8-day-old and 14- to 15-day-old rats (970 ± 258 and 987 ± 265 pA; n = 7 and 4, respectively). Since there were no significant differences in the size of somata or in the number of primary dendrites between the superior salivatory neurones of 7-day-old and adult rats, the current density of the fast and slow A-currents may have remained unchanged between 6 and 15 days postnatal. In contrast, both the time to peak and the decay time constant of the fast and slow A-currents appeared to be accelerated with maturation. As seen in Fig. 5Ba, both the time to peak and the decay time constant of the fast (filled squares) and slow A-currents (open squares) obtained from 14- to 15-day-old rats were minimal within the respective ranges of the fast and slow A-currents obtained from 6- to 8-day-old rats.
Figure 10. Fast and slow A-currents in 7- and 15-day-old rats.
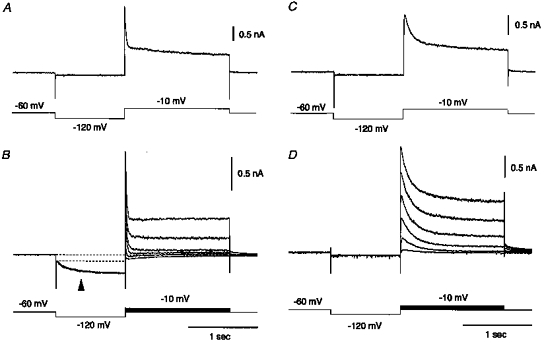
Fast and slow A-currents obtained from the superior salivatory neurones labelled from the chorda-lingual nerve of 7-day-old (A and C, respectively) and 15-day-old rats (B and D, respectively). At a holding potential of −60 mV, depolarizing command pulses of 1500 ms duration stepped to −10 mV for A and C, and stepped between −60 and −10 mV for B and D were applied after a 1000 ms hyperpolarizing prepulse to −120 mV. A hyperpolarization-activated inward current (arrowhead in B) is seen during the hyperpolarizing prepulse in the neurone of a 15-day-old rat displaying the fast A-current.
Furthermore, the V½ and k values for the steady-state activation of the isolated fast A-currents were −40.6 ± 2.7 and −10.6 ± 3.2 mV (n = 4), respectively, and those of the isolated slow A-currents were −40.7 ± 2.4 and −9.2 ± 1.8 mV (n = 4), respectively. The V½ and k values for the steady-state inactivation of the isolated fast A-currents were −78.4 ± 4.6 and 12.3 ± 3.6 mV (n = 4), respectively, and those of the isolated slow A-currents were −80.6 ± 4.3 and 8.8 ± 2.8 mV (n = 4), respectively. Thus, these values of V½ for the steady-state activation and inactivation of the fast and slow A-currents were more positive by approximately 10 mV than those values of V½ obtained from neurones at postnatal days 6–8.
The acceleration of both the time to peak and the decay time constant, and the positive shift of the half-activation and inactivation voltages (V½) for both the fast and slow A-currents are consistent with maturation of the kinetics of outward currents, as reported previously (Desarmenien & Spitzer, 1991; Sikdar et al. 1991; Costa et al. 1994). Therefore, it is unlikely that the fast and slow A-currents were reducedwith maturation. On the other hand, another pattern of postnatal development was seen in the hyperpolarization-activated inward current. As shown in Fig. 10B (arrowhead), a hyperpolarization-activated inward current became apparent only in neurones of 15-day-old rats displaying the fast A-current, whereas the hyperpolarization-activated inward current was not apparent in neurones of 6-to 8-day-old rats displaying the fast A-current. A similar postnatal development of a hyperpolarization-activated inward current has been reported in rat hypoglossal motoneurones (Bayliss et al. 1994).
DISCUSSION
Development of parasympathetic salivatory system
In the present electrophysiological study, we used neonatal rats aged 6–8 and 14–15 days. It is well recognized that the rat submandibular gland during the early postnatal period undergoes progressive development into mature organs. Morphologically, acinar cells begin to develop at the terminals of primitive ducts from the first week of postnatal life (Jacoby & Leeson, 1959). Functionally, chemical stimulation with a parasympathomimetic agent, pilocarpine, induced a copious fluid secretion in an amount sufficient for collection after about 2 weeks of age (Schneyer & Schneyer, 1961). The density of cholinergic receptors per gland tissue was reported to be rapidly increased during the first 2 weeks and reached adult levels by 3 weeks of age (Bylund et al. 1982). However, electrical stimulation of the postganglionic parasympathetic nerve at birth caused a watery secretion from the developing duct system, while stimulation of the sympathetic nerve did not cause protein secretion from the developing duct or acini (Bottaro & Cutler, 1984). On the other hand, the elimination of excessive preganglionic fibres arising from the superior salivatory neurones to innervate individual submandibular ganglion cells occurs mainly during the first two weeks after birth, and each ganglion cell is subsequently contacted by a single preganglionic fibre after about 5 weeks (Lichtman, 1977). Thus, the developing salivary gland at 6–15 days of postnatal life (as investigated in the present study) may already be under the control of the developing cholinergic parasympathetic nervous system. The present findings demonstrated that the superior salivatory neurones of 1-week-old rats have already been functionally differentiated into two groups expressing two distinct types of A-currents, despite the immaturity of their target organs. Whole-cell recordings from the neurones of 2-week-old rats revealed a developmental trend in the activation and inactivation kinetics of both types of A-currents during the first two weeks of neonatal life. Thus, the functional differentiation of the superior salivatory neurones may precede the development of their target organs, presumably facilitating the differential maturation of their target organs.
Late-spiking vs. interrupted spiking superior salivatory neurones
The superior salivatory neurones retrogradely labelled from the anterior tongue invariably showed the interrupted spiking pattern under a current clamp and expressed the slow A-current under a voltage clamp, at membrane potentials more hyperpolarized than the resting membrane potential. In contrast, the neurones displaying the late spiking pattern under a current clamp eventually corresponded to those expressing the fast A-current under the voltage clamp. The two different spiking patterns could well be accounted for by the differences in the kinetics between the fast and slow A-currents. The activation of the fast A-current may be rapid enough to suppress the spike initiation at the onset of depolarizing current pulses, leading to a long delay before the first spike in the late spiking pattern. However, the activation of the slow A-current may be so slow that it allows the spike initiation at the onset of depolarizing current pulses, but causes a long interval between the first and second spikes in the interrupted spiking pattern. Similar causal relationships between the late spiking pattern and the fast A-current and between the interrupted spiking pattern and the slow A-current have been observed in various neurones (Manis, 1990; Manis & Marx, 1991; Fujino et al. 1997). When single spikes were evoked at resting membrane potentials by an injection of short depolarizing current pulses, the half-duration of spike after-hyperpolarization in late spiking neurones was much longer than that in interrupted spiking neurones. Since the fast and slow A-currents were largely inactivated at resting membrane potentials, the difference in the half-duration of spike after-hyperpolarization indicates the presence of another difference in outward currents between late- and interrupted spiking neurones. The two types of superior salivatory neurones also behaved differentially in response to an injection of a long depolarizing current pulse at resting membrane potentials; the late spiking neurones fired tonically at 20–30 Hz, whereas the interrupted spiking neurones showed an initial transient discharge at higher frequencies (∼70 Hz) followed by a tonic discharge at lower frequencies (∼40 Hz), presumably due to some outward currents causing frequency adaptation (Madison & Nicoll, 1984). In comparison with the interrupted spiking neurones, such lower firing rates in the late spiking neurones may be due to longer spike after-hyperpolarization. Thus, the superior salivatory neurones, at postnatal days 6–8, can be separated into two distinct types based on the following four differences: (1) late spiking vs. interrupted spiking at hyperpolarized membrane potentials; (2) longer vs. shorter spike after-hyperpolarization; (3) tonic firing vs. phasic-tonic firing at resting membrane potentials; and (4) fast vs. slow A-currents.
Fast vs. slow A-currents in the superior salivatory neurones
We recorded the rapidly and slowly inactivating transient outward currents from the two types of superior salivatory neurones, i.e. the fast and slow A-currents. Except for the inactivation kinetics reflected in the decay time constants of the fast and slow A-currents, their voltage-dependent kinetics and pharmacological properties were very similar and fell within the range of values reported for the A-current in other preparations (e.g. Rudy, 1988); these include the activation threshold, steady-state inactivation, recovery from inactivation, and 4-aminopyridine sensitivity. The above-mentioned features of the fast A-current in particular, are very similar to those of A-currents recorded from other autonomic neurones of rats such as parasympathetic intracardiac ganglia (Xi-Moy & Dun, 1995), sympathetic coeliac-superior-mesenteric ganglia (Carrier, 1995) and sympathetic spinal neurones (Bordey et al. 1995). These autonomic neurones have only one type of A-current. Rat nodose neurones, in contrast, displayed a whole-cell A-current whose decay time course was fitted by the sum of three exponentials with time constants of 10–40 ms, 100–350 ms and 1–3 s (Cooper & Shrier, 1989; McFarlane & Cooper, 1991). Consistent with this observation, rat nodose neurones expressed three different types of A-channels which inactivated in three different modes, and the respective ensemble averages of the three types of single-channel currents decayed with three distinct time constants, which are similar to those of the three components of the whole-cell A-current (Cooper & Shrier, 1989; McFarlane & Cooper, 1991). Thus, the three different kinetics of inactivation were confirmed at single-channel levels. The two types of A-currents observed in the present study therefore probably reflect the activities of different types of channels present in the two distinct types of superior salivatory neurones.
Functional roles of the two types of superior salivatory neurones
The anterior part of the rat tongue is a non-glandular area. Previous studies of adult rats have shown that the postganglionic fibres in the anterior tongue could be traced along the lingual artery (Tsumori et al. 1996) and that electrical stimulation of the chorda-lingual nerve increased the blood flow of the anterior tongue (Hellekant, 1977). Although such evidence has not yet been obtained from neonatal rats, it is not unreasonable to posit that the interrupted spiking neurones, which invariably send their axons into the anterior tongue, may be involved in regulating the vasodilator function of the anterior tongue. The late spiking neurones, in contrast, may be involved in regulating the activity of the developing salivary glands, because they never innervate the anterior part of the tongue.
The absence of late spiking neurones retrogradely labelled from the anterior tongue directly indicates that a single late spiking neurone has no axon collaterals projecting to the non-glandular area of the anterior tongue. It was beyond the scope of the present study to investigate whether the interrupted spiking neurones, or the presumed vasodilatation-related neurones, also innervate the submandibular ganglia or have bifurcated axons, since we could not inject tracers directly into the secretory nerves of the salivary glands alone.
Acknowledgments
This study was supported by Grants-in-Aid for Scientific Research (Nos 08680887 and 09470402) from the Ministry of Education, Science and Culture of Japan, and also supported by CREST (Core Research for Evolutional Science and Technology) of the Japan Science and Technology Corporation (JST). The authors thank Dr H. Ohmori for critical reading of the manuscript.
References
- Bayliss DA, Viana F, Bellingham MC, Berger AJ. Characteristics and postnatal development of a hyperpolarization-activated inward current in rat hypoglossal motoneurons in vitro. Journal of Neurophysiology. 1994;71:119–128. doi: 10.1152/jn.1994.71.1.119. [DOI] [PubMed] [Google Scholar]
- Bordey A, Feltz P, Trouslard J. Kinetics of A-currents in sympathetic preganglionic neurons and glial cells. NeuroReport. 1995;7:37–40. [PubMed] [Google Scholar]
- Bottaro B, Cutler LS. An electrophysiological study of the postnatal development of the autonomic innervation of the rat submandibular salivary gland. Archives of Oral Biology. 1984;29:237–242. doi: 10.1016/0003-9969(84)90061-x. [DOI] [PubMed] [Google Scholar]
- Bylund DB, Martinez JR, Camden J, Jones SB. Autonomic receptors in the developing submandibular glands of neonatal rats. Archives of Oral Biology. 1982;27:945–950. doi: 10.1016/0003-9969(82)90101-7. [DOI] [PubMed] [Google Scholar]
- Carrier GO. Whole-cell and perforated patch recordings of four distinct K+ currents in acutely dispersed coeliac-superior mesenteric ganglia neurones of adult rats. Brain Research. 1995;701:1–12. doi: 10.1016/0006-8993(95)00756-6. [DOI] [PubMed] [Google Scholar]
- Chibuzo GA, Cummings JF, Evans HE. Autonomic innervation of the tongue: a horseradish peroxidase study in the dog. Journal of the Autonomic Nervous System. 1980;2:117–129. doi: 10.1016/0165-1838(80)90040-5. [DOI] [PubMed] [Google Scholar]
- Contreras RJ, Gomez MM, Norgren R. Central origins of cranial nerve parasympathetic neurons in the rat. Journal of Comparative Neurology. 1980;190:373–394. doi: 10.1002/cne.901900211. [DOI] [PubMed] [Google Scholar]
- Cooper E, Shrier A. Inactivation of A currents and A channels on rat nodose neurons in culture. Journal of General Physiology. 1989;94:881–910. doi: 10.1085/jgp.94.5.881. [DOI] [PMC free article] [PubMed] [Google Scholar]
- Costa PF, Santos AI, Ribeiro MA. Potassium currents in acutely isolated maturing rat hippocampal CA1 neurons. Developmental Brain Research. 1994;83:216–223. doi: 10.1016/0165-3806(94)00140-5. [DOI] [PubMed] [Google Scholar]
- Desarmenien MG, Spitzer NC. Role of calcium and protein kinase C in development of the delayed rectifier potassium current in Xenopus spinal neurons. Neuron. 1991;7:797–805. doi: 10.1016/0896-6273(91)90282-5. 10.1016/0896-6273(91)90282-5. [DOI] [PubMed] [Google Scholar]
- Ducreux C, Puizillout J-J. A-current modifies the spike of C-type neurones in the rabbit nodose ganglion. The Journal of Physiology. 1995;486:439–451. doi: 10.1113/jphysiol.1995.sp020824. [DOI] [PMC free article] [PubMed] [Google Scholar]
- Fujino K, Koyano K, Ohmori H. Lateral and medial olivocochlear neurons have distinct electrophysiological properties in the rat brain slice. Journal of Neurophysiology. 1997;77:2788–2804. doi: 10.1152/jn.1997.77.5.2788. [DOI] [PubMed] [Google Scholar]
- Hellekant G. Vasodilator fibres to the tongue in the chorda tympani proper nerve. Acta Physiologica Scandinavica. 1977;99:292–299. doi: 10.1111/j.1748-1716.1977.tb10382.x. [DOI] [PubMed] [Google Scholar]
- Hulbek MD, Cobbett P. Outward potassium currents of supraoptic magnocellular neurosecretory cells isolated from the adult guinea-pig. The Journal of Physiology. 1997;502:61–74. doi: 10.1111/j.1469-7793.1997.061bl.x. [DOI] [PMC free article] [PubMed] [Google Scholar]
- Jacoby F, Leeson CR. The post-natal development of the rat submaxillary gland. Journal of Anatomy. 1959;93:201–216. [PMC free article] [PubMed] [Google Scholar]
- Kamondi A, Williams JA, Hutcheon B, Reiner PB. Membrane-properties of mesopontine cholinergic neurons studied with the whole-cell patch-clamp technique: implications for behavioral state control. Journal of Neurophysiology. 1992;68:1359–1372. doi: 10.1152/jn.1992.68.4.1359. [DOI] [PubMed] [Google Scholar]
- Kang Y, Kitai ST. Electrophysiological properties of pedunculopontine neurons and their postsynaptic responses following stimulation of substantia nigra reticulata. Brain Research. 1990;535:79–95. doi: 10.1016/0006-8993(90)91826-3. 10.1016/0006-8993(90)91826-3. [DOI] [PubMed] [Google Scholar]
- Kawamura Y, Yamamoto T. Studies on neural mechanisms of the gustatory-salivary reflex in rabbits. The Journal of Physiology. 1978;285:35–47. doi: 10.1113/jphysiol.1978.sp012555. [DOI] [PMC free article] [PubMed] [Google Scholar]
- Klee R, Ficker E, Heinemann U. Comparison of voltage-dependent-potassium currents in rat pyramidal neurons acutely isolated from hippocampal regions CA1 and CA3. Journal of Neurophysiology. 1995;74:1982–1995. doi: 10.1152/jn.1995.74.5.1982. [DOI] [PubMed] [Google Scholar]
- Large WA, Sim JA. A comparison between mechanisms of action of different nicotinic blocking agents on rat submandibular ganglia. British Journal of Pharmacology. 1986;89:583–592. doi: 10.1111/j.1476-5381.1986.tb11159.x. [DOI] [PMC free article] [PubMed] [Google Scholar]
- Lichtman JW. The reorganization of synaptic connexions in the rat submandibular ganglion during post-natal development. The Journal of Physiology. 1977;273:155–177. doi: 10.1113/jphysiol.1977.sp012087. [DOI] [PMC free article] [PubMed] [Google Scholar]
- McFarlane S, Cooper E. Kinetics and voltage dependence of A-type currents on neonatal rat sensory neurons. Journal of Neurophysiology. 1991;66:1380–1391. doi: 10.1152/jn.1991.66.4.1380. [DOI] [PubMed] [Google Scholar]
- Madison DV, Nicoll RA. Control of the repetitive discharge of rat CA1 pyramidal neurons in vitro. The Journal of Physiology. 1984;354:319–331. doi: 10.1113/jphysiol.1984.sp015378. [DOI] [PMC free article] [PubMed] [Google Scholar]
- Manis PB. Membrane properties and discharge characteristics of guinea pig dorsal cochlear nucleus neurons studied in vitro. Journal of Neuroscience. 1990;10:2338–2351. doi: 10.1523/JNEUROSCI.10-07-02338.1990. [DOI] [PMC free article] [PubMed] [Google Scholar]
- Manis PB, Marx SO. Outward currents in isolated cochlear nucleus neurons. Journal of Neuroscience. 1991;11:2865–2880. doi: 10.1523/JNEUROSCI.11-09-02865.1991. [DOI] [PMC free article] [PubMed] [Google Scholar]
- Matsuo R, Kusano K. Lateral hypothalamic modulation of the gustatory-salivary reflex in rats. Journal of Neuroscience. 1984;4:1208–1216. doi: 10.1523/JNEUROSCI.04-05-01208.1984. [DOI] [PMC free article] [PubMed] [Google Scholar]
- Matsuo R, Yamamoto T. Gustatory-salivary reflex: neural activity of sympathetic and parasympathetic fibres innervating the submandibular gland of the hamster. Journal of the Autonomic Nervous System. 1989;26:187–197. doi: 10.1016/0165-1838(89)90168-9. 10.1016/0165-1838(89)90168-9. [DOI] [PubMed] [Google Scholar]
- Mitchell J, Templeton D. The origin of the preganglionic parasympathetic-fibres to the mandibular and sublingual salivary glands in the rat; a horseradish peroxidase study. Journal of Anatomy. 1981;132:513–518. [PMC free article] [PubMed] [Google Scholar]
- Rudy B. Diversity and ubiquity of K channels. Neuroscience. 1988;25:729–749. doi: 10.1016/0306-4522(88)90033-4. 10.1016/0306-4522(88)90033-4. [DOI] [PubMed] [Google Scholar]
- Schneyer CA, Schneyer LH. Secretion by salivary glands deficient in acini. American Journal of Physiology. 1961;201:939–942. doi: 10.1152/ajplegacy.1961.201.5.939. [DOI] [PubMed] [Google Scholar]
- Sheng M, Tsaur ML, Jan YN, Jan LY. Subcellular segregation of two A-type K+ channel proteins in rat central neurons. Neuron. 1992;9:271–284. doi: 10.1016/0896-6273(92)90166-b. 10.1016/0896-6273(92)90166-B. [DOI] [PubMed] [Google Scholar]
- Sikdar SK, Legendre P, Dupouy B, Vincant JD. Maturation of a transient outward potassium current in mouse fetal hypothalamic neurons in culture. Neuroscience. 1991;43:503–511. doi: 10.1016/0306-4522(91)90311-b. 10.1016/0306-4522(91)90311-B. [DOI] [PubMed] [Google Scholar]
- Stefani A, Calabresi P, Mercuri NB, Bernardi G. A-current in rat globus pallidus: a whole-cell voltage clamp study on acutely dissociated neurons. Neuroscience Letters. 1992;144:4–8. doi: 10.1016/0304-3940(92)90703-a. 10.1016/0304-3940(92)90703-A. [DOI] [PubMed] [Google Scholar]
- Strecker T, Heinemann U. Redistribution of K+ channels into dendrites is unlikely to account for developmental downregulation of A-currents in rat dentate granule cells. Neuroscience Letters. 1993;164:209–212. doi: 10.1016/0304-3940(93)90893-p. 10.1016/0304-3940(93)90893-P. [DOI] [PubMed] [Google Scholar]
- Thompson S. Aminopyridine block of transient potassium current. Journal of General Physiology. 1982;80:1–18. doi: 10.1085/jgp.80.1.1. 10.1085/jgp.80.1.1. [DOI] [PMC free article] [PubMed] [Google Scholar]
- Tsumori T, Ando A, Yasui Y. A light and electron microscopic study on the connections between the preganglionic fibres and the intralingual ganglion cells in the rat. Anatomical Embryology. 1996;194:559–568. doi: 10.1007/BF00187469. [DOI] [PubMed] [Google Scholar]
- Xi-Moy SX, Dun NJ. Potassium currents in adult rat intracardiac neurones. The Journal of Physiology. 1995;486:15–31. doi: 10.1113/jphysiol.1995.sp020787. [DOI] [PMC free article] [PubMed] [Google Scholar]
- Yawo H. Rectification of synaptic and acetylcholine currents in the mouse submandibular ganglion cells. The Journal of Physiology. 1989;417:307–322. doi: 10.1113/jphysiol.1989.sp017803. [DOI] [PMC free article] [PubMed] [Google Scholar]
- Yoshimura M, Polosa C, Nishi S. A transient outward rectification in the cat sympathetic preganglionic neuron. Pflügers Archiv. 1987;408:207–208. doi: 10.1007/BF00581354. [DOI] [PubMed] [Google Scholar]
- Yu WHA, Srinivasan R. Origin of the preganglionic visceral efferent fibres to the glands in the rat tongue as demonstrated by the horseradish peroxidase method. Neuroscience Letters. 1980;19:143–148. doi: 10.1016/0304-3940(80)90185-8. [DOI] [PubMed] [Google Scholar]


