

Abstract
Using microneurography with a conventional monopolar electrode, the action potentials of ten myelinated axons in the peripheral nerves of human subjects were followed while they developed conduction block.
The action potentials had initially (n = 6) or developed (n = 4) a positive double-peaked morphology. The time interval between the two positive peaks represents the conduction time across the impaled internode.
When the interpeak interval was < 500 μs, conduction across the site of impalement was secure, even if the conduction time was markedly prolonged. When the interval was > 600 μs, intermittent conduction failure occurred. For all units the longest interpeak interval recorded just prior to complete conduction failure was, on average, 1.12 ms (range, 0.8–1.4 ms).
For five axons, there was evidence that natural activity triggered the conduction failure.
Impalement of the nerve fibre by the microelectrode impairs the ability of the axon to conduct impulses across the site of injury, but impulse transmission can be secure even when the conduction time across individual internodes is prolonged to 500 μs. These findings are therefore relevant to the conduction deficits that occur in focal injuries of human axons.
In most neurological diseases, peripheral or central, symptomatic deficits result from a combination of loss of axons and conduction block in impaired but surviving axons. The extent to which conduction can be restored in non-conducting axons may determine the extent of recovery. When the safety margin for impulse conduction is critically impaired, physiological stresses such as activity (Bostock & Grafe, 1985) and temperature (Rasminsky, 1973) can produce a fluctuating conduction block, and this may result in a variable clinical deficit.
To record from a single myelinated axon using microneurography usually requires that the fibre be impaled by the microelectrode (Torebjörk et al. 1970; Vallbo, 1976; Calancie & Stein, 1988; Rice et al. 1993; Inglis et al. 1996; Wu et al. 1996). Impalement inevitably causes damage to the myelin sheath and possibly to the axon, impairing the ability of the axon to conduct impulses, sometimes to the extent that conduction block ensues. Such damage can be readily repaired without sequelae, and microneurography generally produces transient or no adverse after-effects (Gandevia & Hales, 1997). However, detailed analysis of the morphology of action potentials can provide insight into the effects of trauma on human axons in vivo.
In the present study, ten axons were studied before, during and after the development of conduction block. The results indicate the extent to which conduction time can be prolonged across single internodes in human axons before conduction failure ensues, and show that natural activity can precipitate conduction failure when conduction time is prolonged (much as was shown for demyelinated axons by Bostock & Grafe, 1985). An abstract of some of the findings has been published (Burke et al. 1995).
METHODS
Data were obtained from ten of twenty-four experiments, in which action potential morphology was studied in detail (Inglis et al. 1996). The study was performed on ten healthy adult volunteers who gave informed written consent to the experimental procedures. The study had the approval of the institutional research ethics committee.
This report is based on the data from ten axons, nine of which were in the radial nerve and one in the peroneal nerve. Action potentials were recorded using microneurography, as described in detail elsewhere, and were identified using standard tests (Vallbo et al. 1979; Burke et al. 1987). The microelectrodes were tungsten wires of diameter 0.2 mm, insulated to the tip (1–5 μm), and inserted through skin into the peripheral nerve trunk and then manoeuvred to impale a single large myelinated axon. Electrode impedance when in situ was 60–150 kHz at 1 kHz.
Amplified neural activity was recorded on tape together with other experimental variables, using a bandwidth of 300 Hz to 10 kHz for the neural signals, as described by Inglis et al. (1996). The analysis of action potential morphology was performed off-line using a Cambridge Electronics Design 1401-plus interface, running Spike2 software. Sampling was at 66.7 kHz. Customized programs were written to determine the peak-to-peak interval for each of the units. In the subsequent figures, an upward deflection represents a positive signal at the microelectrode.
RESULTS
Recordings were made from ten axons that had double-peaked action potentials. Figure 1 shows a double-peaked action potential and a diagram to indicate the likely origin of the two peaks. The morphology of the action potentials changed during the recording, with loss of the second positive peak (see also Vallbo, 1976; Inglis et al. 1996). One of the axons was a motor axon, a fact established by the short-latency EMG potential seen in spike-triggered averages of the surface EMG activity of tibialis anterior during a voluntary contraction (Fig. 2). Eight axons were afferent: six muscle spindle afferents (identified by their discharge pattern during an electrically induced twitch contraction of the receptor-bearing muscle; see Burke et al. 1987), one muscle afferent that was not classified further, and one cutaneous afferent. One axon, held for only 9 s before conduction block occurred, was not identified.
Figure 1. The origin of the two positive peaks in the action potential generated by large myelinated axons using microneurography.
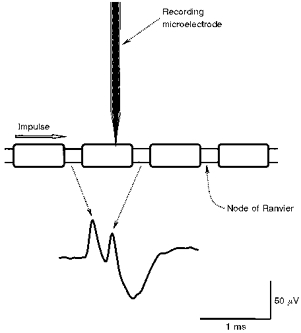
When the microelectrode impales the myelin sheath, positive-going action potentials are recorded from the nodes on either side of the impaled internode, though this is apparent only if the interpeak interval is prolonged to greater than 90 μs. Accordingly, a single positive peak will be recorded if the interval is less than this (see Fig. 3), or conduction block prevents the generation of the action potential at the distal node. The illustrated action potential is the average of 30 consecutive discharges, for an unidentified axon, with a steady discharge of 10 Hz, held for 9 s.
Figure 2. Activity-dependent conduction block in an α-motor axon innervating tibialis anterior.
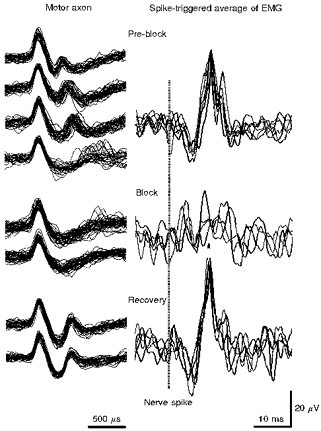
The traces on the left represent superimposed consecutive action potentials recorded at different stages during the development of conduction block and, after rest, recovery therefrom, for a motor axon discharging in a voluntary contraction. The traces on the right represent spike-triggered averages of surface EMG of tibialis anterior, each trace consisting of approximately 32 sweeps, corresponding to those on the left. The timing of the nerve action potential is indicated by the interrupted vertical line. In the top left panel a second positive peak was seen in each recording, though the interpeak interval gradually increased and became highly unstable in the fourth trace. The EMG potential was consistently recordable. In the middle panel (Block), the second positive peak was present only in a few sweeps making up the upper trace. There was no consistent EMG potential. Following rest for a few minutes, a further contraction was performed, and the second positive peak was again present in the nerve action potential, and the EMG potential had reappeared (bottom panel). Note the difference in time base for the nerve action potential and the EMG potential. The longest interpeak interval (fourth set of traces under Pre-block) was 1.43 ms.
Based on the average waveform of fifty consecutive discharges, the initial morphology consisted of two positive peaks for six axons (Fig. 2), with an interpeak separation ranging from 188 ± 13 μs (mean ±s.d.) to 610 ± 38 μs for different axons. The implications of this morphology are considered below. Four axons initially had an action potential that was biphasic with a single positive peak, but the positive double-peaked waveform appeared during the recording (Fig. 3). The time from unit impalement to the disappearance of the second positive peak (i.e.the time to conduction block) was 3–27 s for four axons, 2 min for one axon (Fig. 3) and 10–55 min for five axons (Fig. 4).
Figure 3. Development of conduction block.
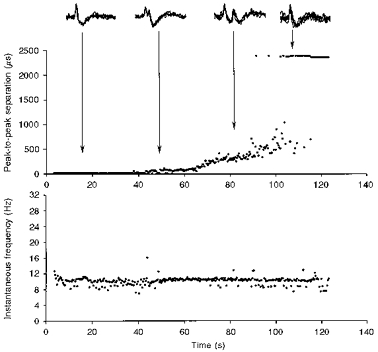
Changes occurring over 2 min in the action potential of a muscle spindle afferent from extensor pollicis longus, maintaining a steady discharge of 10–11 Hz (see instantaneous frequency plot, bottom panel). For clarity, only every fourth action potential is illustrated. As indicated in the inset, the action potential initially had only a single positive peak, but developed a second peak after 40 s. The interpeak interval then increased steadily (top panel), until the second peak disappeared, leaving a single positive peak again. The horizontal row of dots (at ∼2300 μs) corresponds to those discharges without a second peak (i.e. the default interval for this afferent).
Figure 4. Activity-dependent conduction block.
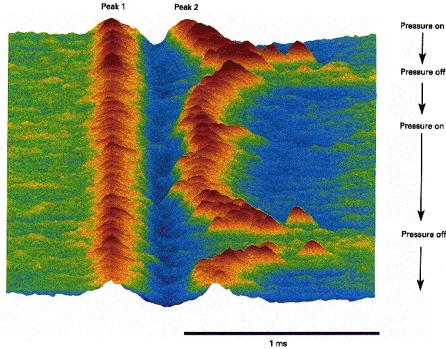
Raster display of action potentials of a muscle spindle afferent developing conduction block during a discharge that was maintained by pressure over the receptor. Muscle spindle afferent from extensor pollicis longus, without a background discharge, discharging irregularly at ∼3 Hz due to pressure. When the pressure was increased (Pressure on), 10 min after the onset of the recording, the discharge rate of the afferent increased to ∼20 Hz, and the second positive peak became unstable and disappeared. When pressure was relaxed (Pressure off), the second peak reappeared, only to disappear 2 min later when pressure was again increased. The longest interpeak interval was 975 μs in the first episode and 1.02 ms immediately after the second episode. The illustrated sequence contains 891 consecutive action potentials.
The implications of loss of the second positive peak
Vallbo (1976) has summarized the evidence that the two positive peaks arise from nodes on either side of the site of impalement (as illustrated in Fig. 1). He demonstrated that axons with this morphology can conduct impulses past the microelectrode (although, as stressed by Inglis et al. 1996, with prolonged internodal conduction time), and this has been confirmed by Calancie & Stein (1988).
Evidence supporting this contention is provided in Fig. 2, which shows recordings from a motor axon and spike-triggered averages of EMG. Multiple nerve action potentials are superimposed on the left, at different stages during a steady voluntary contraction (Pre-block and Block). The traces on the right are the spike-triggered averages of EMG (n =∼32), corresponding to the illustrated neural spikes. In the top panel (Pre-block), there was a consistent second positive peak, with an internodal conduction time of initially 500 μs, though this increased in subsequent superimposed traces until the lowest in the panel, when the second peak was intermittently absent. In these sequences, a consistent EMG potential could be recorded. In the middle panel (Block), the nerve action potential had a simple biphasic waveform with a single positive peak (except for a few sweeps in the upper trace). The EMG averages contained no definite EMG potential. After a rest, traces shown in the bottom panel (Recovery) were recorded during a further contraction. The nerve action potential again had two positive peaks, and the EMG potential could be defined by averaging. In other words, the presence of the EMG potential paralleled the presence of the second positive peak.
Extent of the increase in interpeak interval
As the interval between the two positive peaks increased so did the trial-to-trial variability of the interval (Fig. 3). For the six units initially with two positive peaks, the coefficient of variation (i.e.s.d. of the interval divided by its mean) was 0.124 (range, 0.039–0.248). Immediately prior to the first discharge in which no second positive peak occurred, the coefficient of variation for the same six units was 0.156 (range, 0.075–0.236) and, for all ten units, 0.216 (range, 0.075–0.600). The increasing interval and increasing variability presumably reflect progressive impairment of the safety margin for impulse conduction.
The second positive peak could be detected in each discharge as long as the interpeak interval remained below, on average, 589 μs (range, 320 ± 192 to 685 ± 162 μs). Thereafter, the second peak was intermittently absent, apparently at random, but increasingly so until complete conduction failure ensued. For the ten afferents the longest interpeak interval was, on average, 1.12 ms (range, 0.80–1.43 ms), and this usually occurred shortly before the action potential waveform consistently became single peaked.
Activity-dependent changes in action potential waveform
Six axons had a background discharge (range, 6–13 Hz). Activity was induced in the remaining four axons by voluntary contraction (the motor axon in Fig. 2) and focal pressure over the receptor (3 axons). For five axons, conduction block developed inexorably despite a steady background discharge (4 axons; Fig. 3) or a steady pressure-induced discharge (1 axon). The recording time from impalement to conduction block was < 2 min for each of these axons. For two of the remaining five axons, conduction block developed as the discharge frequency was increasing (Fig. 4) and, for three, recovery from conduction block occurred following rest (1 axon; Fig. 2) or the reduction of pressure (2 axons; Fig. 4), manoeuvres that resulted in silence (2 axons) or a lower discharge frequency (1 axon).
The muscle spindle afferent of Fig. 4 (innervating extensor pollicis longus) had no background discharge but fired irregularly at 3–5 Hz when steady pressure was applied to the muscle belly over the ending. With increased pressure the interpeak interval increased as the discharge rate increased to 20 Hz, ultimately leading to conduction block. The conduction block resolved as the pressure was reduced and the discharge rate slowed. As seen in Fig. 4, this sequence was reproduced when the pressure was reapplied.
Similar evidence that natural activity can lead to an increasing interpeak interval and ultimately to loss of the second positive peak from action potentials with two positive peaks separated by > 600 μs was seen with a further four muscle spindle afferents from the forearm extensor muscles. With two of the four, activity was altered by varying levels of pressure over the receptor, and action potential morphology proved to be sensitive to the discharge frequency. However, these data have not been quantified as those for the ten axons that form the basis of the present report.
DISCUSSION
In the present study, changes in action potentials of myelinated axons of human subjects were analysed as the axons developed conduction block (see below). Evidence is presented that natural activity can lead to conduction failure when the safety margin for impulse conduction has been impaired by a focal injury. Assuming that the interpeak interval reflects the conduction time across the impaled internode (see below), its measurement allows the extent of the impairment of the safety margin to be estimated: impulse conduction was usually stable when internodal conduction time was < 500 μs, but became unstable, with intermittent conduction failure, above this value. One of the more unexpected findings was the degree of conduction slowing that could occur with intermittent conduction block: internodal conduction times of up to 1400 μs for individual discharges. The Discussion will focus on the validity of the model as an indicator of conduction failure, the evidence for activity-dependent conduction failure and the implications for focal nerve lesions.
Validity of the model
Positive bipeaked potentials are not normally seen in animal experiments in which individual axons are isolated by dissection. They are common in microneurographic recordings in human subjects (e.g. Vallbo, 1976; Inglis et al. 1996; Wu et al. 1996, 1997), presumably because the recordings are obtained by impaling the fibre. In human and amphibian nerve, Vallbo (1976) demonstrated that the axon can conduct across the site of impalement when the action potential has a positive double-peaked morphology (see also Calancie & Stein, 1988), and this is supported by the recording from a motor axon in Fig. 2 in which loss of the second peak was associated with loss of the EMG potential. However, as argued by Inglis et al. (1996), such recordings are still from damaged nerve fibres: the normal internodal conduction time should be of the order of 30 μs for large myelinated axons of human subjects; the positive double-peaked morphology can be detected only when the interval between peaks is > 90 μs. Accordingly, it is not surprising that such waveforms are virtually unique to a recording technique that isolates single units by impaling them.
The most parsimonious explanation for the two peaks is that proposed by Vallbo (1976), namely that they are generated at the nodes of Ranvier on either side of the electrode. This leads to the conclusion that the conduction time across the impaled internode can be measured directly by measuring the separation of the two peaks, and the subsequent discussion assumes this interpretation.
Activity-dependent conduction block
In demyelinated spinal root axons of the rat, Bostock & Grafe (1985) demonstrated that activity could precipitate conduction failure due to activity-dependent hyperpolarization at the distal (blocking) node, a phenomenon that could be prevented by application of an equal but opposite depolarizing current (Bostock & Grafe, 1985) or by blocking the activity of the electrogenic Na+-K+ pump (Kaji & Sumner, 1989). Importantly, rates of 10–50 Hz, well within the range of natural firing, were sufficient to produce such a block, provided that the safety margin had been reduced sufficiently (Bostock & Grafe, 1985).
In the present study, five axons that were maintaining a steady discharge frequency underwent a progressive increase in internodal conduction time, culminating in conduction failure. Presumably there was progressive inability to compensate for fibre injury, perhaps associated with further movement of the microelectrode (though there was no evidence to suggest this). For the other five axons, conduction failure occurred as discharge frequency was increasing and, for three of the five, the ability to conduct across the site of impalement was restored after rest. This suggests that activity may have been a precipitating factor for the conduction failure. If so, this represents the first demonstration that naturally evoked activity can produce conduction failure at sites of lowered safety margin for impulse conduction.
Implications for understanding conduction in focally injured axons
In the present recordings, it is likely that the efficacy of the myelin insulation would have been reduced when the fibre was impaled by the microelectrode, but the axons were not fully ‘demyelinated’, and it is likely that the underlying axon was damaged in at least some of the recordings. Regardless of the precise nature of the injury, the safety margin for impulse conduction was impaired and this was due to a focal lesion. In animal experiments, it is well established that conduction time is prolonged across demyelinated internodes, but the reported internodal conduction times are usually of the order of 200 μs (e.g. Lafontaine et al. 1982), though values > 600 μs have been documented (Rasminsky & Sears, 1972; Bostock & Grafe, 1985). Values as long as 1.0–1.4 ms have not previously been reported. Nevertheless, this value is of interest because it implies that the driving current at the distal node can persist for > 1 ms.
In normal human axons, rheobase (the threshold current if the stimulus could be infinitely long) is twice as high in motor axons as in cutaneous afferents, and because of the hyperbolic shape of the strength-duration curve, the threshold at 1.0 ms approaches the rheobase value (Mogyoros et al. 1996). While there may be differences between action potentials generated by externally applied currents and natural activity, the finding that the driving current in axons can last > 1 ms implies that the threshold current for excitation of an axon may approximate rheobasic values under some circumstances. In addition, it has recently been suggested that the hyperpolarization that occurs when axons conduct trains of impulses is greater in motor axons than cutaneous afferents (Vagg et al. 1998). If these findings are applicable to naturally occurring impulses and to pathological axons of polyneuropathy, the above differences would render motor axons more susceptible to conduction block for the same stress (see Burke et al. 1997). Biophysical differences between sensory and motor axons could contribute to the greater involvement of motor function than sensory function in neuropathies such as Guillain-Barré syndrome, chronic inflammatory demyelinating polyneuropathy and multifocal motor neuropathy, regardless of whether the pathology affects motor axons more than sensory (as it probably does).
That conduction across a single internode can remain stable despite prolongation to 500 μs implies that considerable conduction disturbance can be tolerated without producing critical impairment of the safety margin for impulse conduction. In diagnostic nerve conduction studies, conduction delays of 0.5–1.0 ms are often sufficient to localize a lesion. The present findings suggest that such delays can be produced by the involvement of one or two internodes, and that conduction might then be quite secure even if slow. Indeed, in entrapment neuropathies, the conduction abnormality is usually confined to a nerve segment of ∼1 cm length (Brown et al. 1976; Kimura, 1979).
Acknowledgments
This study was supported by the National Health and Medical Research Council of Australia. J. T. Inglis was supported by the MRC and NSERC of Canada. The authors would like to thank Mr Maxim Volkow for assistance with figures.
References
- Bostock H, Grafe P. Activity-dependent excitability changes in normal and demyelinated rat spinal root axons. The Journal of Physiology. 1985;365:239–257. doi: 10.1113/jphysiol.1985.sp015769. [DOI] [PMC free article] [PubMed] [Google Scholar]
- Brown WF, Ferguson GG, Jones MW, Yates SK. The location of conduction abnormalities in human entrapment neuropathies. Canadian Journal of Neurological Sciences. 1976;3:111–122. doi: 10.1017/s0317167100025865. [DOI] [PubMed] [Google Scholar]
- Burke D, Aniss AM, Gandevia SC. In-parallel and in-series behavior of human muscle spindle endings. Journal of Neurophysiology. 1987;58:417–426. doi: 10.1152/jn.1987.58.2.417. [DOI] [PubMed] [Google Scholar]
- Burke D, Inglis JT, Gandevia SC. The development of conduction block in human axons. Electroencephalography and Clinical Neurophysiology. 1995;97:S33. [Google Scholar]
- Burke D, Kiernan MC, Mogyoros I, Bostock H. Susceptibility to conduction block: differences in the biophysical properties of cutaneous afferents and motor axons. In: Kimura J, Kaji R, editors. Physiology of ALS and Related Diseases. Amsterdam: Elsevier; 1997. pp. 43–53. [Google Scholar]
- Calancie BM, Stein RB. Microneurography for the recording and selective stimulation of afferents: an assessment. Muscle and Nerve. 1988;11:638–644. doi: 10.1002/mus.880110617. [DOI] [PubMed] [Google Scholar]
- Gandevia SC, Hales JP. The methodology and scope of human microneurography. Journal of Neuroscience Methods. 1997;74:123–136. doi: 10.1016/s0165-0270(97)02243-7. 10.1016/S0165-0270(97)02243-7. [DOI] [PubMed] [Google Scholar]
- Inglis JT, Leeper JB, Burke D, Gandevia SC. Morphology of action potentials recorded from human nerves using microneurography. Experimental Brain Research. 1996;110:308–314. doi: 10.1007/BF00228561. [DOI] [PubMed] [Google Scholar]
- Kaji R, Sumner AJ. Effect of digitalis on central demyelinative conduction block in vivo. Annals of Neurology. 1989;25:159–165. doi: 10.1002/ana.410250209. [DOI] [PubMed] [Google Scholar]
- Kimura J. The carpal tunnel syndrome: localization of conduction abnormalities within the distal segment of the median nerve. Brain. 1979;102:619–635. doi: 10.1093/brain/102.3.619. [DOI] [PubMed] [Google Scholar]
- Lafontaine S, Rasminsky M, Saida T, Sumner AJ. Conduction block in rat myelinated fibres following acute exposure to anti-galactocerebroside serum. The Journal of Physiology. 1982;323:287–306. doi: 10.1113/jphysiol.1982.sp014073. [DOI] [PMC free article] [PubMed] [Google Scholar]
- Mogyoros I, Kiernan MC, Burke D. Strength- duration properties of human peripheral nerve. Brain. 1996;119:439–447. doi: 10.1093/brain/119.2.439. [DOI] [PubMed] [Google Scholar]
- Rasminsky M. The effects of temperature on conduction in demyelinated single nerve fibers. Archives of Neurology. 1973;28:287–292. doi: 10.1001/archneur.1973.00490230023001. [DOI] [PubMed] [Google Scholar]
- Rasminsky M, Sears TA. Internodal conduction in undissected demyelinated nerve fibres. The Journal of Physiology. 1972;227:323–350. doi: 10.1113/jphysiol.1972.sp010035. [DOI] [PMC free article] [PubMed] [Google Scholar]
- Rice ASC, McMahon SB, Wall PD. The electrophysiological consequences of electrode impalement of peripheral nerves in the rat. Brain Research. 1993;631:221–226. doi: 10.1016/0006-8993(93)91538-4. 10.1016/0006-8993(93)91538-4. [DOI] [PubMed] [Google Scholar]
- Torebjörk HE, Hallin RG, Hongell A, Hagbarth K-E. Single unit potentials with complex waveform seen in microelectrode recordings from the human median nerve. Brain Research. 1970;24:443–450. doi: 10.1016/0006-8993(70)90184-8. 10.1016/0006-8993(70)90184-8. [DOI] [PubMed] [Google Scholar]
- Vagg R, Mogyoros I, Kiernan MC, Burke D. Activity-dependent hyperpolarization of motor axons produced by natural activity. The Journal of Physiology. 1998;507:919–925. doi: 10.1111/j.1469-7793.1998.919bs.x. [DOI] [PMC free article] [PubMed] [Google Scholar]
- Vallbo ÅB. Prediction of propagation block on the basis of impulse shape in single unit recordings from human nerves. Acta Physiologica Scandinavica. 1976;97:66–74. doi: 10.1111/j.1748-1716.1976.tb10236.x. [DOI] [PubMed] [Google Scholar]
- Vallbo ÅB, Hagbarth K-E, Torebjorebjörkouml;rk HE, Wallin BG. Somatosensory, proprioceptive, and sympathetic activity in human peripheral nerves. Physiological Reviews. 1979;59:919–957. doi: 10.1152/physrev.1979.59.4.919. [DOI] [PubMed] [Google Scholar]
- Wu G, Hallin RG, Ekedahl R. Multiple action potential waveforms of single units in man as signs of variability in conductivity of their myelinated fibres. Brain Research. 1996;742:225–238. doi: 10.1016/s0006-8993(96)01015-3. 10.1016/S0006-8993(96)01015-3. [DOI] [PubMed] [Google Scholar]
- Wu G, Hallin RG, Ekedahl R. Waveform complexity of unit activity recorded with concentric needle electrodes from human peripheral nerves. Experimental Brain Research. 1997;114:377–383. doi: 10.1007/pl00005646. [DOI] [PubMed] [Google Scholar]