

Abstract
The activity of locus coeruleus (LC) neurones (n= 126) was examined in whole-cell (conventional and amphotericin B-perforated patch) recordings, and the relationship of this activity to the respiratory discharge recorded on the C4 or C5 phrenic nerve roots was determined at different CO2 concentrations (2 and 8 %; bath pH 7.8 and 7.2) in the in vitro brainstem-spinal cord preparation of the neonatal rat (1–5 days old).
In most neurones (n= 105) ongoing activity was modulated at respiratory frequency. Typically, this consisted of a phase of depolarization and increased discharge frequency synchronous with the phrenic burst, followed by a phase of hyperpolarization and inhibition of discharge (n= 94 of 105). The incidence of respiratory modulation decreased from 91 % on P1 to 57 % on P5.
Bath application of the non-nmDA receptor antagonist 6-cyano-7-nitroquinoxaline-2,3-dione (CNQX; 5 μmmu;m) or the nmDA receptor antagonist DL-2-amino-5-phosphonovaleric acid (APV; 100 μmmu;m) abolished both phases of respiratory modulation. The hyperpolarizing phase alone was abolished by the adrenoceptor antagonists idazoxan (5 μmmu;m) or phentolamine (0.8 μmmu;m). These results indicate that excitatory amino acid pathways are involved in the transmission of both the excitatory and inhibitory components and that the latter involves in addition an α2-adrenoceptor-mediated pathway.
Increasing the CO2 concentration from 2 to 8 % resulted in a shortening of expiratory duration and weakening or loss of respiratory-phased inhibition; this was accompanied by depolarization, increased discharge frequency and, in those neurones where they were initially present (60 %), an increase in the frequency of subthreshold membrane potential oscillations. The depolarizing response was retained in the presence of tetrodotoxin (TTX, 0.2–1.0 μmmu;m).
These results indicate that in this neonatal preparation LC neurones form part of the synaptically connected brainstem respiratory network, and that the LC constitutes a site of CO2- or pH-dependent chemoreception.
The locus coeruleus (LC) is a noradrenergic nucleus located in the dorsomedial region of the pons, close to the floor of the fourth ventricle. A striking feature of the nucleus is the discrepancy between the extensive nature of its efferent projections and the very much more restricted nature of its afferent innervation: the former includes much of the neuraxis, while the latter appears to be dominated by afferents from two regions of the rostral medulla, the nucleus (ncl.) paragigantocellularis, a structure known to be involved, among other things, in cardiorespiratory control, and the ncl. prepositus hypoglossi (Aston-Jones et al. 1986, 1991; Astier et al. 1990; Pieribone & Aston-Jones, 1991).
The manner in which the LC processes afferent inputs is of interest for several reasons. The first and most obvious is because of the diversity of somatic and autonomic functions with which it has been associated, even if most of these appear to be connected in some way to the control of arousal (Foote et al. 1983; Aston-Jones et al. 1986, 1991). A second reason arises from consideration of the properties of the nucleus itself: under in vitro conditions in slice preparations the nucleus is composed of electrophysiologically largely homogeneous neurones which exhibit an endogenously generated rhythm of discharge (Williams et al. 1984), and which, at least in the neonatal and young adult rat, are also electrically coupled (Christie et al. 1989; Christie & Jelinek, 1993; Travagli et al. 1995). A third reason, of particular interest in relation to the processing of cardiorespiratory inputs, stems from the long recognized fact that LC neurones discharge at increased frequency in response to systemic hypercapnia (Elam et al. 1981), and the more recent finding that focal tissue acidosis within the vicinity of the nucleus is followed by a large increase in respiratory motor (phrenic) output; this last point suggests that some LC neurones may function directly as respiratory chemosensors (Coates et al. 1993). That LC neurones are indeed intrinsically chemosensitive, and that under in vitro conditions this results in their increasing their discharge frequency in response to hypercapnic acidosis, has recently been established (Pineda & Aghajanian, 1997).
Much of the significance of LC neurone chemosensitivity is likely to depend on the way it influences the processing of naturally occurring afferent inputs, but this kind of information is difficult or impossible to obtain in most slice preparations. It might, however, be revealed by the less reduced in vitro brainstem-spinal cord preparation of the neonatal rat (Suzue, 1984) since this retains sufficient synaptic circuitry to sustain a rhythmic respiratory motor output and responsiveness to bath-applied changes in pH for several hours after isolation. Our object here was to use this preparation to determine how the activity of LC neurones is modified in response to bath-applied hypercapnic acidosis, and to identify the relationship of this response to the acidosis-induced increase in the respiratory motor output on the phrenic nerve roots. There were three main findings: first, that the activity of a large majority of LC neurones is synaptically modulated at the frequency of the respiratory rhythm; second, that increasing the CO2 concentration weakened or removed an inhibitory component of this modulation, this effect contributing significantly to the overall excitatory response of LC neurones to hypercapnic acidosis; and third, that the membrane potential response of LC neurones to hypercapnic acidosis was retained following suppression of their synaptic input.
Some of the present findings have been previously published in abstract form (Ballantyne et al. 1997a,b; Oyamada et al. 1997; Scheid et al. 1997).
METHODS
Brainstem-spinal cord preparation
The preparation, essentially similar to that described by Suzue (1984), consisted of the cerebellum, pons, medulla oblongata and rostral segments of the spinal cord and was removed en bloc from 1- to 5-day-old (Sprague-Dawley) rats which were anaesthetized with ether. Following isolation it was placed, dorsal surface up, in the recording chamber (1.5 ml volume), and continuously superfused with control solution (see below, Superfusates) at a flow rate of 7–8 ml min−1 and temperature of 24–26°C. After removing the arachnoid membrane the cerebellum was reflected rostrally to expose the floor of the fourth ventricle (Fig. 1A).
Figure 1. Identification of LC neurones.

A, schematic view of the dorsal surface of the preparation (cerebellum reflected rostrally) showing the arrangements to record from LC neurones (Vm) and from the C4 or C5 phrenic root (Phr). B, photomicrograph of dye-coupled LC neurones. C and D, photomicrographs of the same section to show the TH-positive nature (Cy3 fluorescence, red) of the dye-injected (Lucifer Yellow) neurone (arrow in D); the film was double-exposed in C to show both the Lucifer Yellow and Cy3 fluorescence. The floor of the fourth ventricle is indicated by arrowheads in C and D. Horizontal bar indicates 400 μmmu;m in B and 100 μmmu;m in C and D. E, hyperpolarization and suppression of discharge in a type 1 neurone in response to noradrenaline. F, same neurone as in E showing retention of the noradrenaline-induced hyperpolarizing response in TTX. Vm, membrane potential. The negative- and positive-going voltage deflections in F were elicited by injection of current pulses, used to measure input resistance.
Superfusates
Control conditions were established using a superfusate which contained (mm): 125 NaCl, 4.0 KCl, 2.0 CaCl2, 1.0 MgSO4, 0.5 NaH2PO4, 26 NaHCO3 and 30 glucose; equilibrated with a gas mixture consisting of 2 % CO2, 8 % N2 and 90 % O2 (pH 7.8). Hypercapnic (test) solution was of identical composition, but equilibrated with 8 % CO2, 2 % N2 and 90 % O2 (pH 7.2). These experimental conditions, including the choice of CO2 concentrations, were thus closely similar to those in our previous study of chemosensitive medullary neurones in the brainstem preparation (Kawai et al. 1996). Tetrodotoxin (TTX), tetraethylammonium (TEA), noradrenaline bitartrate, idazoxan, phentolamine, bicuculline methiodide, DL-2-amino-5-phosphonovaleric acid (APV) (all from Sigma) and 6-cyano-7-nitroquinoxaline-2,3-dione (CNQX, dissolved in DMSO, Research Biochemicals International) were added to solutions as required.
Recordings
The pH of the superfusate was continuously measured in the recording chamber with a glass macroelectrode (U402-M3, Ingold, Steinbach, Germany) calibrated with standard phosphate buffers. Phrenic nerve activity was recorded from the C4 or C5 ventral roots with a suction electrode, and the resulting signal filtered (80 Hz to 10 kHz), amplified, half-wave rectified and displayed in integrated form (time constant, 80 ms) on a pen recorder.
LC neurones were recorded with a patch pipette which was inserted into the pons at the lateral border of the fourth ventricle (Fig. 1A). Pipettes were filled with the following solution (mm): 130 potassium gluconate, 10 Na-Hepes, 10 EGTA, 1.0 CaCl2, 1.0 MgCl2, 0 or 2.0 Na2-ATP, 0 or 0.2 Na2-GTP; and 0.5-1.0 % Lucifer Yellow (Sigma) (dipotassium salt or, in some neurones, dilithium salt - we observed no difference in the activity of LC neurones related to the salt used); pH 7.3, adjusted with KOH. The procedure for obtaining a seal was that commonly used in such en bloc preparations, including the maintenance of positive pressure at the tip of the advancing pipette (e.g. Onimaru & Homma, 1992). The pressure was reduced in the case of perforated patch pipettes because the tip was not filled with amphotericin-B-free solution; the reason for this was the wide variability in the time required to locate a neurone so that there was no one appropriate volume of such solution. After seal formation (1–2 GΩ) the membrane was either ruptured by applying negative pressure and/or hyperpolarizing current pulses through the pipette (conventional whole-cell, n= 78), or permeabilized with amphotericin-B (Sigma), which was added to the pipette solution at a concentration of 0.2–0.4 mg ml−1 (perforated patch, n= 48).
Membrane potential was measured with an EPC-7 amplifier (List Electronic). When filled, patch pipettes had a resistance of 3-5 MΩ in the bath. However, because the access resistance is high (typically ∼60 MΩ with LC neurones in conventional whole-cell and almost always greater with perforated patch) in recordings obtained in the en bloc brainstem preparation (see also Kawai et al. 1996; Onimaru et al. 1996), large current injections were avoided in current clamp recordings; in voltage clamp recordings with series compensation of 50–70 % the voltage error was of the order of 10 mV at the currents involved and corrected by this amount. In neurones showing oscillatory activity (see Results), ‘baseline’membrane potential was determined from the trough of the oscillation. Membrane potential values given here have been corrected for a measured mean liquid junctional potential of −11 mV with the standard pipette solution.
Histology
With conventional whole-cell recordings no special procedure for dye injection was followed and dye presumably entered the cell throughout. In perforated patch experiments the membrane was ruptured at the end of the recording by applying large current pulses over a prolonged period (Kawai et al. 1996). The preparation was subsequently placed in fixative solution (4 % formaldehyde) for at least 48 h, immersed in a 30 % sucrose solution overnight and sectioned into 100 μmmu;m thick slices with a cryostat; sections were then examined and photographed through a fluorescence microscope (stimulating wavelength, 450–490 nm). In thirteen preparations Lucifer Yellow injection was combined with subsequent staining for the enzyme tyrosine hydroxylase (TH). In these preparations sections were cut at 50 or 75 μmmu;m thickness, and those containing dye-injected neurones washed in phosphate buffer solution (PBS) and exposed for 1 h to PBS-Triton X–100 (0.5 %) solution containing 1 % normal rabbit serum. After a further wash, the sections were placed overnight at room temperature in a solution containing mouse anti-TH monoclonal antibody (1:10 or 1:20 dilution, Boehringer Mannheim Biochemica). In four preparations, sections were incubated for 2 h in a solution containing Cy3-conjugated anti-mouse IgG rat-absorbed antibody (1:100 dilution, Jackson ImmunoResearch Laboratories, Inc., West Grove, PA, USA), and then photographed through a fluorescence microscope (stimulating wavelength, 530–560 nm). In the remaining nine preparations biotinylated rabbit anti-mouse IgG rat-absorbed antibody (1:100 dilution, DAKO, Hamburg, Germany) was used as the secondary antibody. In this case the immunoreaction product was visualized by using standard biotin-avidin peroxidase reaction.
Statistics
Values are presented as means ±s.d. Details of statistical tests are given in the text where they are used. Differences were considered to be significant at P < 0.05.
RESULTS
Identification of LC neurones
The results given here are based on recordings from 126 neurones, of which 120 were identified by Lucifer Yellow injection. Their cell bodies (mean diameter of the longest axis, 28 ± 10 μmmu;m) were distributed between 40 and 400 μmmu;m below the floor of the fourth ventricle and confined within the ncl. locus coeruleus; the boundaries of the latter under fluorescent illumination were nearly always clearly visible - because of catecholaminergic fluorescence in the fixed tissue - and readily distinguished from the more ventrolaterally located mesencephalic trigeminal nucleus with its more dispersed and larger cell bodies. Multiple dye-containing neurones following injection into a single neurone were present in 18 (7 conventional whole-cell, 11 perforated patch) of 120 preparations, the number of neurones ranging from two to eight (mean, 4 ± 2) (Fig. 1B). The cell bodies of all such coupled neurones were located within the nucleus, though their dendritic projections often extended beyond its boundary. The catecholaminergic nature of dye-injected neurones was confirmed by subsequent processing of the tissue for TH immunoreactivity (Fig. 1C and D; n= 13).
Additional evidence of neurone identification was given by their hyperpolarizing response to bath application of noradrenaline (100–200 μmmu;m, Fig. 1E, n = 12). The retention of this response following TTX-induced suppression of all ongoing activity in LC neurones confirmed the somatic or soma-dendritic location of the receptors (Fig. 1F, same neurone as Fig. 1E, n= 5). The response to noradrenaline was suppressed by prior addition of the specific α2-adrenoceptor antagonist idazoxan (5 μmmu;m) (not shown).
General features of the activity of LC neurones
Under control conditions, with the preparation exposed to 2 % CO2-equilibrated superfusate, the baseline membrane potential (see Methods) of LC neurones was −51 ± 4 mV (n= 126). In most respects their activity resembled that previously described for LC neurones in slice preparations, including the distinction between ‘oscillatory’and ‘non-oscillatory’ neurones illustrated by the two records shown in Fig. 2A and B.
Figure 2. Spontaneous activity of LC neurones.

A and B, spontaneous activity of a type 1 (A) and type 2 (B) neurone and the synchronous modulation of their membrane potential (Vm) and discharge frequency with the inspiratory burst recorded on a phrenic root (∫Phr). C, age-dependent changes in the incidence of type 1 neurones and of respiration-modulated changes in membrane potential. D, age-dependent changes in the mean oscillation frequency in type 1 neurones (•) and respiratory frequency (○). Bars indicate one standard deviation. n, number of neurones/preparations tested at each age. **P < 0.01 vs. day 1; ***P < 0.0001 vs. day 1; †P < 0.05 vs. day 2; †††P < 0.001 vs. day 2 (one-way ANOVA followed by Fisher's test).
Sixty per cent (n= 76) of the neurones in this sample exhibited a fairly steady pattern of oscillations in membrane potential (amplitude, 4–8 mV, measured in the absence of discharge; Fig. 2A), each wave of depolarization giving rise to one or more action potentials (mean frequency, 1.2 ± 0.6 Hz, n= 76, measured during the interval between phrenic bursts). The frequency of oscillation was independent of recording configuration (conventional whole-cell: 0.4 ± 0.2 Hz, n= 43; perforated patch: 0.4 ± 0.3 Hz, n= 33; P= 0.94, Student's unpaired t test) and, when measured at 2 % CO2, was unrelated to the prevailing respiratory frequency (r=−0.039, n= 76, P= 0.75). The injection of hyperpolarizing current from the pipette, sufficient to suppress discharge, revealed some variability between neurones in the details of the shape of the oscillating wave, but commonly the latter exhibited a slow phase of depolarization on which one or more small spike-like deflections were superimposed (Fig. 8). Under voltage clamp the frequency of current oscillations (20–40 pA) was unchanged at a holding potential ranging from −50 to −100 mV. The incidence of neurones showing oscillatory activity increased from 26 % at P1 to 100 % at P5 (Fig. 2C), but the frequency of oscillation was independent of age over this range (P= 0.472, one-way ANOVA, Fig. 2D). (The small size of the P5 sample was due to the poor viablity of P5 preparations, i.e. their ability to sustain a rhythmic phrenic output did not extend much beyond an hour after isolation compared with the several hours of activity shown by P1 to P4 preparations.) We will refer to these neurones as ‘type 1’, while the general term ‘oscillation’ as used here refers to subthreshold rhythmical changes in membrane potential.
Figure 8. Response of oscillatory activity to hypercapnic acidosis.

Recording traces are taken from a type 1 neurone which showed no evidence of respiratory modulation. Action potentials were suppressed by negative current injection (−88 pA). Vm, membrane potential; ∫Phr, integrated signal of phrenic nerve activity.
The distinguishing feature of the remaining neurones, which we refer to as ‘type 2’, was the absence of such oscillations (Fig. 2B) while in superfusate of standard composition, nor were they revealed by hyperpolarizing the cell below discharge threshold. The mean discharge frequency (1.4 ± 0.8 Hz, n= 50) of type 2 neurones was comparable to that of type 1, but in individual cases discharge could be very much more irregular than in the example of Fig. 2B. The presence or absence of oscillations in a given neurone was unrelated to recording configuration (conventional vs. perforated patch, χ2 test, P= 0.18), nor was it related to respiratory frequency. There was no difference between these neurone types in the relative depths of their cell bodies within the nucleus (type 1: 147 ± 75 μmmu;m, n= 72; type 2: 146 ± 75 μmmu;m, n= 48).
Respiratory modulation of LC neurones
The respiratory-phased increase in discharge frequency was superimposed on a wave of depolarization (3–10 mV amplitude) which, where its point of onset could be determined reasonably accurately (e.g. Fig. 5C), began at times which ranged between preparations from 400 ms before to 220 ms after the onset of the phrenic burst (mean delay to the phrenic burst, 40 ms, n= 20 preparations). The subsequent inhibition of discharge was associated with a hyperpolarizing wave (amplitude, measured from the baseline, 3 ± 1 mV; duration, 4.2 ± 2.0 s, n= 94) which was unaccompanied by any significant change in input resistance (< 5 % decrease on average). In voltage clamp, the amplitude of the outward current corresponding to the inhibitory phase was reduced by 50–70 % (n= 4) on going from a holding potential of −50 to −100 mV, but could not be reversed in these recordings. The polarity of the hyperpolarizing wave was unchanged in (conventional whole-cell) recordings in which potassium gluconate in the pipette was replaced by KCl (130 mm) (n= 6).
Figure 5. Response of LC neurones to bath-applied CNQX.
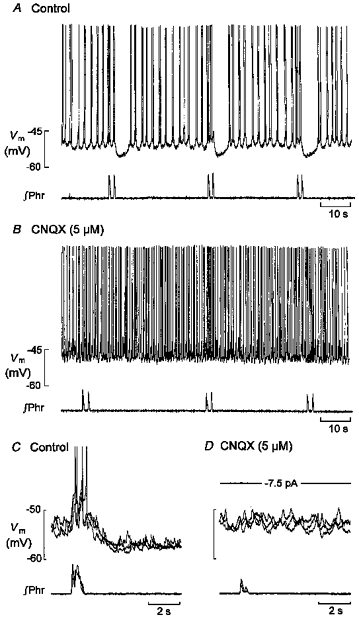
A and B, bath application of 5 μmmu;m CNQX was followed by an elimination of respiratory-phased activity, an increase in discharge frequency and a depolarizing shift in baseline membrane potential. C and D, three superimposed traces of the membrane potential and corresponding phrenic bursts taken from another neurone under control conditions (C) and after 10 min of exposure to 5 μmmu;m CNQX (D). Vm, membrane potential; ∫Phr, integrated signal of phrenic nerve activity.
A prominent feature of most neurones of both types was the modulation of their discharge frequency at the frequency of the respiratory rhythm (n= 105 of 126). Typically, as in the examples of Fig. 2A and B, this took the form of a transient increase in discharge frequency accompanying the phrenic burst, followed by a transient inhibition of discharge (n= 94 of 105). In a small number of neurones the inhibitory phase of this sequence was absent (n= 11 of 105). The incidence of respiratory modulation among LC neurones decreased from 91 % of the sample at P1 to 57 % at P5 (Fig. 2C). Since the incidence both of respiratory modulation and of type 2 neurones decreased with age from P1 to P5, respiratory modulation was marginally more common in type 2 (47 of 50, 94 %) than in type 1 (58 of 76, 76 %) neurones.
Duration of respiratory-phased inhibition depends on respiratory frequency
Under control conditions (2 % CO2), the respiratory-phased hyperpolarizing wave occupied, on average, 18 % of the expiratory interval (mean duration, 23 s), i.e. the interval between phrenic bursts. In a representative selection of preparations (n= 21) the duration of this hyperpolarization was independent of the number (r=−0.188, P= 0.419) and frequency (r= 0.069, P= 0.769) of action potentials accompanying the preceding depolarization, and was also independent of phrenic burst duration (r=−0.068, P= 0.773) (Fig. 3A–C). In the same set of preparations linear regression revealed a positive correlation between the duration of hyperpolarization (range, 1.9–8.6 s) and the length of the expiratory interval (range, 11–88 s; r= 0.741, P < 0.0001) (Fig. 3D), i.e. inhibition tended to shorten as the expiratory interval decreased and respiratory frequency, thus, increased. This correlation was strengthened when we included those few neurones (n= 11) in which there was no detectable phase of inhibition, since in the preparations from which they were recorded the respiratory frequency was significantly higher (3.9 ± 1.7 min−1, n= 11) than in the rest of the sample (2.5 ± 1.1 min−1, n= 94, unpaired t test, P < 0.001). It is unlikely, therefore, that this small group of neurones represents a separate class, but that the absence of an inhibitory phase was related to the relatively high respiratory frequency.
Figure 3. Relationship between duration of respiratory-phased hyperpolarization and other respiratory variables.

The duration of hyperpolarization was independent of the number (A) and frequency (B) of action potentials accompanying respiratory-phased depolarization, and independent of phrenic burst duration (C), but positively correlated with the length of the expiratory interval between phrenic bursts (D). All measurements made with the preparations exposed to 2 % CO2.
Respiratory-phased inhibition depends on the activation of an α2-adrenergic pathway
The relationship shown in Fig. 3D suggests that respiratory-phased inhibition originates in neurones concerned in some way with the control of expiratory duration, and thus more likely to originate within the medulla than in the LC itself. One known source of inhibitory input to the LC is represented by adrenergic afferents from C1 neurones of the ncl. paragigantocellularis within the rostral ventrolateral medulla (Ennis & Aston-Jones, 1988; Pieribone & Aston-Jones, 1991; Aston-Jones et al. 1992). In the present experiments bath addition of the adrenoceptor antagonists idazoxan (5 μmmu;m, n 4 = 5) or phentolamine (0.8 μmmu;m, n= 5) completely eliminated the hyperpolarizing phase of respiratory modulation, and the corresponding period became occupied by action potentials. This response is shown in Fig. 4A–C for a type 1 neurone exposed to idazoxan. Type 2 neurones responded in the same way, and since the effects of idazoxan and phentolamine were very similar, the statistical data for both antagonists have been pooled. The suppression of the inhibitory phase was unaccompanied by a change in the frequency of action potentials generated during the excitatory phase (control, 4.4 ± 3.3 Hz; test, 3.9 ± 2.9 Hz; P= 0.08, paired t test), but there was a small decrease in their number (control, 4 ± 1; test, 3 ± 1; P < 0.05), the latter probably reflecting the small (< 10 %) decrease in phrenic burst duration. The response as a whole was marked by a small (< 5 mV) depolarizing shift in baseline potential, an increase in the frequency of membrane potential oscillations in type 1 neurones (0.4 ± 0.1 to 1.4 ± 0.9 Hz, n= 6, P < 0.05) and, in both types of neurone, an increase in discharge frequency during the interval between phrenic bursts (1.3 ± 0.4 to 2.0 ± 0.6 Hz, n= 10, P < 0.05). Respiratory frequency was increased (from 2.6 ± 1.2 to 3.7 ± 0.9 min−1, n= 10, P < 0.01), an effect which presumably reflects the blockade of pontine inhibitory α2-adrenergic input to the medulla in this preparation (Hilaire et al. 1989). Where a neurone could be held long enough during washout for recovery to go to completion, as judged by respiratory frequency, the hyperpolarizing component of respiratory input also recovered.
Figure 4. Response of an LC neurone to bath-applied idazoxan.
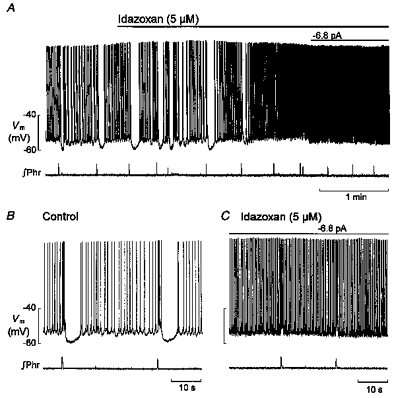
A, idazoxan (5 μmmu;m) eliminated the hyperpolarizing phase of respiratory modulation and this was accompanied by an increase in discharge frequency; the small depolarizing shift in membrane potential (Vm) was compensated for by negative current injection. B and C show samples before and during idazoxan on a faster time scale. ∫Phr, integrated signal of phrenic nerve activity.
Since, in the rat, most LC neurones are also reported to exhibit a bicuculline-sensitive (GABAA-mediated) inhibition in response to stimulation of the ncl. prepositus hypoglossi (Ennis et al. 1988; Ennis & Aston-Jones, 1989), we tested the effect of bath addition of bicuculline (20 μmmu;m). This resulted in a 2- to 3-fold increase in respiratory frequency and an increase in the mean discharge frequency of LC neurones, but had no apparent effect on the inhibitory phase of their respiratory input (n= 2). (In one neurone the duration of the excitatory component was prolonged, as was the phrenic burst.)
These results imply that the respiratory-phased inhibition of LC neurones is dependent on an adrenergic pathway utilizing α2-adrenoreceptors; in addition, since blocking these receptors did not give rise to an increase in the frequency or number of action potentials generated during the preceding excitatory phase, it is reasonable to conclude that the onset of inhibition essentially coincided with the transition from the inspiratory to the expiratory phase of the cycle; finally, these results suggest that in the brainstem preparation, LC neurones may also be subject to a tonic α2-adrenergically mediated inhibition or, possibly, an α1-adrenergically mediated excitation (see Williams & Marshall, 1987; Ivanov & Aston-Jones, 1995).
Both phases of respiratory modulation depend on the activation of an excitatory amino acid pathway
Bath application of glutamate antagonists resulted in rapid suppression of both the excitatory and inhibitory components of respiratory modulation, and appeared to be complete in response to both the non-nmDA receptor antagonist CNQX (5 μmmu;m, n= 5) and the nmDA antagonist APV (100 μmmu;m, n= 6). There was no difference in this respect between type 1 and type 2 neurones. Figure 5A and B shows an example of the response of a type 1 neurone to CNQX. Because this response also included a small depolarization and an overall increase in discharge frequency, it was usually necessary to suppress discharge by negative current injection in order to see that the excitatory - as well as the inhibitory - component of respiratory modulation was blocked by CNQX, and this procedure is shown for another neurone in Fig. 5C and D. Complete recovery from CNQX-induced suppression of respiratory input was observed in one neurone. Because APV application also resulted in depolarization and increased discharge, the response (of a type 2 neurone) shown in Fig. 6A–E was also measured in the presence of negative current sufficient to suppress ongoing discharge: it is clear that both components of respiratory modulation were suppressed. An additional effect of APV (n= 1), on type 2 neurones was to generate oscillations in membrane potential. The frequency (about 3 Hz in Fig. 6E) of these oscillations was insensitive to current injected at the soma, suggesting that they may be identical to those of type 1 neurones, but they were not further investigated.
Figure 6. Response of an LC neurone to bath-applied APV.

Depolarizing and hyperpolarizing components of respiratory modulation (Vm) in a type 2 neurone (A) were suppressed within 3 min of the addition of APV (B), and began to recover 17 min after return to control solution (C). D and E, control and test activity on a faster time base to show the APV-induced oscillations in membrane potential. Negative currents were injected throughout to keep the membrane potential close to the same value. ∫Phr, integrated signal of phrenic nerve activity.
These results imply that both components of respiratory-phased input depend on the activation of an excitatory amino acid pathway. This dependence might arise because the inhibitory component is a direct consequence of the preceding activation of LC neurones, but if this is so then it probably depends also on the synchronized discharge of large numbers of neurones because idazoxan (5 μmmu;m) failed to suppress the 3–5 mV after-hyperpolarization which followed a burst of action potentials elicited by intracellular current injection (n= 3, not shown here; see also Egan et al. 1983; Andrade & Aghajanian, 1984; Williams et al. 1984). An alternative, and one supported by the relationships shown in Fig. 3A–D, is to suppose that the sequence of excitation and inhibition reflects mechanisms co-ordinating the discharge of excitatory and inhibitory afferent inputs to the LC.
Response to CO2-induced acidosis
In both type 1 and type 2 neurones the general effect of increasing the CO2 concentration (from 2 to 8 %) of the superfusate was to increase their discharge frequency (n= 12 of 14 respiration modulated, and 3 of 4 non-modulated neurones). Several factors contributed to this increase, and are described below.
(i) Effects on respiratory-phased activity. The CO2-induced acid shift in bath pH was followed, after a delay of 1–2 min, by an increase in phrenic burst frequency (2.4 ± 1.4 to 4.1 ± 1.8 min−1, n= 18, P < 0.0001) so that among respiration-modulated neurones there was an increase in the contribution made by the respiratory component of their discharge to the overall level of activity. This response is illustrated in Fig. 7A-C. There was no effect of acidosis either on the frequency (2.8 ± 1.2 and 2.8 ± 1.1 Hz) or number (3 ± 1 and 3 ± 1) of action potentials in LC neurones (n= 12) accompanying the phrenic burst, but the hyperpolarizing component of respiratory modulation was reduced in duration (4.9 ± 2.0 to 2.1 ± 1.4 s, n= 12, P < 0.001) and could be fully suppressed, i.e. the excitatory phase was unaffected while the inhibitory phase became occupied by action potentials (Fig. 7B and C). The recovery of the hyperpolarizing component on return to 2 % CO2 followed approximately the same time course (4–5 min) as the recovery of phrenic burst frequency (Fig. 7A).
Figure 7. Rresponse of an LC neurone to hypercapnic acidosis.
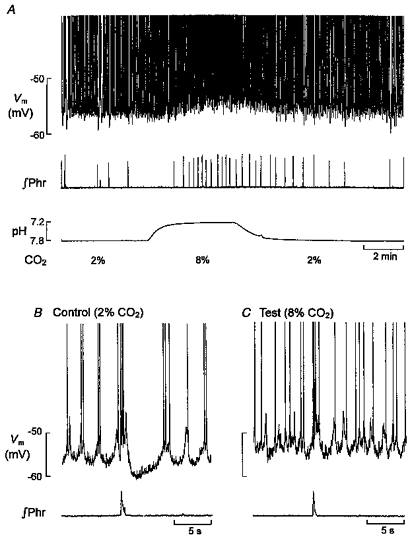
A, depolarization and increase in discharge frequency (Vm) of a type 1 neurone accompanying the increase in phrenic burst frequency (∫Phr) in response to the CO2-induced acid shift in bath pH. B and C, faster time base sweeps from the same neurone showing an increase in both oscillation and action potential frequency and suppression of the hyperpolarizing phase of respiratory modulation at 8 % CO2. Action potentials are truncated.
(ii) Effects on oscillation frequency and membrane potential. Additional features of the response to acidosis included a small (< 5 mV) depolarizing shift in membrane potential, an increase in mean discharge frequency determined during the expiratory interval (from 0.9 ± 0.4 to 1.4 ± 0.5 Hz, n= 15, P < 0.001) and, in type 1 neurones, an increase in the frequency of their spontaneous oscillations in membrane potential (from 0.4 ± 0.2 to 0.7 ± 0.2 Hz, n= 7, P < 0.001, Fig. 7B and C). This effect on oscillation frequency is more readily apparent in the (non-respiration modulated) neurone shown in Fig. 8 where discharge was suppressed by hyperpolarizing current injection. The acidosis-induced increase in oscillation frequency could not be simulated by current-induced depolarization.
Chemosensitivity of LC neurones following suppression of synaptic input
In all preparations (n= 40) bath addition of TTX (0.2−1.0 μmmu;m) resulted in suppression of both phrenic discharge and the respiratory-phased sequence of excitation and inhibition in LC neurones within a period of a few minutes. As indicated earlier (Fig. 1E and F), TTX also suppressed all ongoing activity in LC neurones, i.e. spikes and, where they were initially present, oscillations in membrane potential. At a concentration of 1.0 μmmu;m this decline in LC activity followed about the same time course as the decline in phrenic discharge - never continuing for more than 3 min beyond the point at which phrenic discharge finally ceased - and was accompanied by a hyperpolarizing shift in baseline potential of 2–5 mV (Fig. 9A, n= 15). This response was present with perforated patch recordings and in conventional whole-cell recordings both with and without ATP and GTP and with and without Lucifer Yellow in the pipette. Following the suppression of activity, and in the continued presence of TTX, the injection of a depolarizing current pulse elicited a steady train of spikes (Fig. 9B) which were suppressed on subsequent bath addition of Cd2+ (0.5 mm) (Fig. 9C), but (in other neurones) increased in amplitude and duration following replacement of external Ca2+ with Ba2+ (2 mm) and addition of TEA (10 mm) (not shown). We presume that these TTX-resistant, Cd2+-sensitive spikes are Ca2+ spikes (see also Williams et al. 1984; Williams & Marshall, 1987).
Figure 9. Membrane potential response to CO2 in the presence of TTX.

A, suppression of all ongoing activity in a type 1 neurone and phrenic nerve by 1 μmmu;m TTX. B and C, different type 1 neurone showing membrane potential response to depolarizing current pulses in 1 μmmu;m TTX (B) and 1 μmmu;m TTX plus 0.5 mm Cd2+ (C). D, depolarizing response to 8 % CO2 following the suppression of all activity in a type 1 neurone and phrenic nerve by 0.5 μmmu;m TTX. Rhythmic discharge (full size of spikes shown in right inset) was restored by subsequent addition of 10 mm TEA and replacement of Ca2+ with 2 mm Ba2+. Vm, membrane potential; ∫Phr, integrated signal of phrenic nerve activity.
Under these conditions, i.e. in the presence of TTX and following suppression of all activity both in LC neurones and on the phrenic root, the switch from 2 to 8 % CO2 resulted in a depolarizing shift of 3-5 mV which developed throughout the 5 min period of acidification (Fig. 9D, n= 5 of 7). When measured at the same membrane potential, there was a just detectable increase at 8 % over 2 % CO2 in the amplitude of the voltage response to a hyperpolarizing current step (mean increase, 10 %; range, 5–19 %; n n = 3), corresponding to an increase in input resistance from 344 to 377 MΩ. The acidosis-induced depolarization failed to restore the rhythmic activity in LC neurones - nor could oscillatory activity be evoked by depolarizing current injection at the soma - but following return to control membrane potential at 2 % CO2 the addition of Ba2+ and TEA resulted in depolarization and restoration of rhythmic discharge which persisted for up to an hour (Fig. 9D and inset, n n = 3). On this evidence we conclude that the depolarizing component of the LC neurone response to acidosis is not dependent on intact synaptic transmission or voltage-sensitive Na+ conductances.
The restoration of oscillation and discharge in the presence of TTX (Fig. 9D) implies that its generation is not dependent on voltage-sensitive Na+ conductances, but the loss of oscillation in TTX also implies that such conductances are involved in some way in its maintenance (see Discussion). Other evidence supporting this interpretation, rather than that the oscillations are synaptic potentials, was that by lowering the TTX concentration (to 0.2 μmmu;m) it was possible to prolong the decline in oscillatory activity so that it continued for 20–30 min beyond the point at which phrenic discharge and respiratory-phased synaptic input were suppressed (n= 20). Figure 10A and B shows this reduction in oscillation frequency and the reduction in the amplitude and number of spikes superimposed on each oscillation. Both the spikes and the oscillation in membrane potential were completely suppressed within 2 min following addition of Cd2+, after which current injection elicited only an electrotonic response. However, the involvement of a voltage-sensitive Na+ conductance in the maintenance of oscillatory activity, long after the suppression of phrenic discharge, was verified by the fact that increasing the TTX concentration from 0.2 to 1.0 μmmu;m immediately accelerated the decline, suppressing all activity within 2-3 min (Fig. 10C, n= 3).
Figure 10. Sensitivity of oscillation frequency to CO2 in the presence of TTX.

A and B, effects of 0.2 μmmu;m TTX on membrane potential oscillation and action potentials. C (different neurone), acceleration of the decline of oscillatory activity on increasing the TTX concentration from 0.2 to 1.0 μmmu;m. D, response of an LC neurone to increasing the CO2 concentration 15 min after suppression of phrenic discharge by 0.2 μmmu;m. Vm, membrane potential; ∫Phr, integrated signal of phrenic nerve activity.
Under these conditions (0.2 μmmu;m TTX), where rhythmic activity was sustained at reduced frequency, the depolarizing response to increasing the CO2 concentration was retained (Fig. 10D), and accompanied by an increase in discharge frequency (0.2 ± 0.1 to 0.5 ± 0.2 Hz, n= 15, P < 0.0001). Phrenic discharge remained suppressed throughout.
DISCUSSION
In this study evidence is given that in the neonatal brainstem in vitro the activity of many LC neurones - 83 % of the sample - is modulated synchronously with the respiratory rhythm, and that typically (75 %) this modulation takes the form of a biphasic sequence of excitation and inhibition. The results also show that part of the excitatory response of LC neurones to hypercapnic acidosis is attributable to weakening or suppression of the inhibitory phase of the sequence, and that the time course of this effect is closely similar to that of the acidosis-induced increase in respiratory frequency. Finally, evidence is given that acidosis also results in a depolarizing response of LC neurones and that this response is retained following TTX-induced suppression of respiratory rhythm.
These results are of most immediate significance in relation to the in vitro brainstem preparation itself because they demonstrate that in this widely used preparation the network of synaptically connected neurones showing respiratory rhythm is not confined to the medulla and spinal cord, and that CO2- or pH-chemosensitive ‘respiratory’ neurones, which in this preparation have previously been described only within the ventral medulla (Onimaru et al. 1989; Kawai et al. 1996), are also not confined to this region. This last is of course consistent with the evidence of intrinsic chemosensitivity in adult LC neurones recently reported by Pineda & Aghajanian (1997), and with the suggestion, supported by results from both in vivo (Coates et al. 1993) and in vitro material (Dean et al. 1990; Huang et al. 1997), that chemosensitivity related to the control of respiration is likely to be a property which is widespread among brainstem neurones (Nattie et al. 1995).
In the following sections we consider four issues: the reliability of neurone identification, the source of respiratory synaptic input to LC neurones, the nature of the acidosis-induced changes in their activity, and the relevance of the network properties of the LC to the present findings.
Reliability of neurone identification
The only report of recordings from LC neurones in the anaesthetized neonatal rat of which we are aware is that of Kimura & Nakamura (1985) the strain of rats (Sprague- Dawley) was the same as in the present work, and the age range (P1–3) was also essentially the same (P1–5). In that study 30 % of LC neurones spontaneously discharged at frequencies comparable to those encountered in the in vitro brainstem, but no mention was made of any activity which might have been related to respiration. This last may simply reflect the effect of anaesthetic, but naturally it raises the question as to the reliability of neurone identification in the present work. In addition to the morphological, immunohistochemical and pharmacological evidence of identification (see Results), there were clearly many similarities of a general kind with the descriptions of neonatal LC neurones in slice preparations: these include the low frequency of discharge, the presence of oscillations of membrane potential in many neurones, and the existence of dye coupling (Williams & Marshall, 1987; Christie et al. 1989; Christie & Jelinek, 1993; Travagli et al. 1995). Taking this evidence together, it is reasonable to conclude that the cells recorded in this study were indeed LC neurones, so justifying our main conclusion, which is that respiratory modulation is a prominent and regular feature of their activity.
Source of respiratory-phased synaptic input to LC neurones
At present all that can be attempted by way of identifying the source of respiratory-phased synaptic input to LC neurones is to compare certain features of the respiratory innervation with what is known about the innervation of the LC.
(i) Excitatory innervation
It is reasonable to assume that the excitatory component of the respiratory input originates in neurones located within the medulla since this is the site of respiratory rhythm generation in this preparation (Smith et al. 1991). The acidosis-induced increase in respiratory frequency can also be safely attributed to mechanisms operating within the medulla since there is abundant evidence that in the in vitro brainstem this response is not dependent on the presence of the pons. Of the two main potential sources of excitation, the ncl. paragigantocellularis (PGi) is the better candidate. This is partly because of the large body of evidence implicating this nucleus in the processing of cardiorespiratory inputs likely to be relevant to the role of the LC in its arousal function (Aston-Jones et al. 1991), but also because the PGi constitutes a major source of glutamate-mediated excitatory input to the LC. Under in vivo conditions in the rat, electrical stimulation of the PGi elicits from most LC neurones (83 %) an excitatory response which is blocked by glutamate antagonists (Ennis & Aston-Jones, 1988), while most (73 %) are reported to exhibit a bicuculline-sensitive inhibition in response to stimulation of the ncl. prepositus hypoglossi (Ennis et al. 1988; Ennis & Aston-Jones, 1989). In the present work bicuculline had no obvious effect on respiratory modulation, while both components were suppressed by the glutamate antagonists used here. Given the wide range of latency variation (more than 600 ms) between the time of onset of depolarization and the onset of phrenic discharge, together with the apparently complete nature of the block produced with either CNQX or APV, it is likely that medullary respiratory neurones and LC neurones are connected via a multisynaptic pathway.
(ii) Inhibitory innervation
Irrespective of the identity of the excitatory afferents to the LC, their activation appeared to be a prerequisite to the occurrence of a phase of inhibition. This relationship is of interest because such a pattern of transient excitation with subsequent inhibition is a common feature of the response of LC neurones to electrical stimulation of various peripheral afferents (Foote et al. 1983), to stimulation of the PGi (Aston-Jones et al. 1986; Ennis & Aston-Jones, 1988) or stimulation within the LC itself (Egan et al. 1983). This would naturally tend to suggest that the typically biphasic character of respiratory modulation may be the result of intracoerulear mechanisms, and the most obvious possibility in this respect - given the noradrenergic nature of LC neurones, the fact that they are equipped with α2-adrenoceptors and that the inhibitory phase was suppressed by α2-antagonists - is that the inhibitory phase of the sequence is mediated by collateral synaptic connections between LC neurones. There is, moreover, evidence from in vivo preparations to support such an inhibitory connection (Aghajanian et al. 1977; Ennis & Aston-Jones, 1986) so that in general terms it is reasonable to suppose that a mechanism of this kind will make a significant contribution to determining the overall level of activity within the nucleus, whether in response to afferent input from an extracoerulear source or in response to hypercapnic acidosis.
In spite of these arguments, there is reason to believe that respiratory-phased inhibition either does not arise in this way or depends on an additional source of input: this rests on the observation that the time course of inhibition was specifically sensitive to changes in expiratory duration, becoming shorter as the latter decreased and respiratory frequency increased, whether this occurred ‘spontaneously’ under control conditions, or in response to increasing the CO2 concentration. This suggests that the inhibition originates in some component of the respiratory network involved in the control of expiratory duration. Since PGi neurones represent the main source of α2-adrenoceptor-mediated input to the LC (Ennis & Aston-Jones, 1988; Pieribone & Aston-Jones, 1991; Aston-Jones et al. 1992), the likelihood is that they also convey the respiratory-phased inhibitory input to the LC. An exact comparison with the data provided by in vivo studies is not possible because the incidence of respiratory modulation changed with age, but comparison of the mean incidence of respiratory-phased inhibition (75 % of LC neurones) in the neonate in vitro with the incidence of PGi-evoked inhibition (90 % of LC neurones after suppresion of their excitatory input) in the adult in vivo (Aston-Jones et al. 1992) reinforces the likelihood that the former arrives via adrenergic input from C1 neurones of the PGi. Moreover, our own figure (75 %) probably underestimates the true incidence because in preparations showing a high respiratory frequency, respiratory-phased inhibition was not detectable.
Chemosensitivity of LC neurones
Aside from the increase in the frequency of their respiratory input, the response of LC neurones to hypercapnic acidosis was characterized by two features: (1) partial or complete loss of respiratory-phased inhibition, an effect which may be due to pre- or postsynaptic mechanisms, or both and (2) a depolarizing shift in membrane potential and increase in the frequency of oscillations and discharge which were not dependent on intact synaptic transmission.
This last provides an area of comparison with the results obtained by Pineda & Aghajanian (1997) using adult slice preparations. Considering the different nature of the slice and en bloc brainstem the magnitude of the increase in discharge frequency was similar in the two preparations when compared over similar ranges of CO2 concentration (mean increase 53 % for the slice; 56 % for en bloc brainstem). In the former the effect was attributed to intracellular acidification and block of inwardly rectifying K+ currents, i.e. to inhibition of outward K+ flow, an action consistent both with the depolarizing response to 8 % CO2 observed here and with the fact that this response was retained after suppression of synaptic input. This last point means that while removal of inhibitory input - or noradrenaline depletion - may contribute to acidosis-induced depolarization, it cannot be the chief explanation for this response.
Network properties of the LC nucleus
(i) Their relevance to the present work
LC neurones form an electrically coupled network. Such coupling has been directly demonstrated in the neonatal slice where it acts to synchronize subthreshold oscillations in paired recordings (Christie et al. 1989; Christie & Jelinek, 1993). In the adult slice spontaneous oscillations are much less common, but can be induced by K+ channel blockers, when they are synchronized throughout the nucleus (Travagli et al. 1995; Ishimatsu & Williams, 1996). In the present work oscillatory (our type 1) and non-oscillatory (our type 2) neurones were represented almost equally (60 and 40 %, respectively) within the sample as a whole, but a more significant comparison is between the incidence of each type and the age of the animal from which the preparation was obtained: this revealed a large (4-fold) increase in the incidence of type 1 neurones between P1 and P5 such that by P5 only type 1 neurones were present. Over the same period the incidence of respiration-modulated neurones decreased by about one-third. These two features may be connected by the following argument.
Since the occurrence of oscillations in neonatal LC neurones is dependent on electrical coupling, the increasing incidence of neurones showing oscillations suggests that the number of neurones coupled into the network also increases. At some point the increasing electrical capacity of such a network might be expected to pose a problem of electrotonic attenuation of respiratory-phased synaptic excitation unless the density of synaptic contacts is continuously matched in some way to the size of the network or the time course of excitation is lengthened. We have no evidence as to the former, but the rapidly rising, transient nature of respiratory excitation is ‘fixed’ by the correspondingly transient nature of the inspiratory (phrenic) burst in this preparation. The decrease in the incidence of respiratory-phased excitation with age might, therefore, be at least partly due to its less effective electrotonic spread as the size of the coupled network enlarges. Since the inhibitory component of respiratory input is of much longer duration than the excitatory component, its electrotonic spread should be less affected by an increase in capacity. Here, however, a second effect may be significant, namely the tendency towards weakening of inhibition with increased respiratory frequency, together with the fact that the latter also increased with age. (That this increase was not sustained byond P4 is probably related to the poor viability of the preparation beyond this point.)
The low-pass electrical properties of the LC network (Christie et al. 1989) should not pose a problem for the spread of ‘chemosensitive’ signals because the latter are of low frequency (slow changes in membrane potential). Chemosensitive signals may indeed be particularly effective in making use of the coupled nature of LC neurones to ensure a vigorous response of the whole nucleus to CO2. This relationship may be of more general significance in connection with the organization of brainstem chemosensitivity, since a very strong association has recently been demonstrated in the dorsal medulla, also a chemosensitive region (Dean et al. 1990), between the presence or absence in a given neurone of an excitatory response to CO2 and the corresponding presence or absence of anatomical (dye) coupling to other neurones (Huang et al. 1997). In the present work 7 of 35 morphologically identified neurones excited by acidosis showed Lucifer Yellow coupling to other neurones, but no very useful conclusion can be drawn from this because the overall incidence of dye coupling was low (15 % of preparations, a figure which certainly underestimates the true extent of anatomical coupling in the neonatal LC as revealed by biocytin injection; Christie & Jelinek, 1993). For a detailed account of the problems involved in the analysis of dye coupling see Dean et al. (1997).
(ii) Comparison with work on LC slice preparations
There are two notable points of difference revealed by comparison with work on LC slice preparations. First, the incidence of non-oscillatory LC neurones in the neonatal slice is very low (< 5 %; Christie et al. 1989) while they constitute the dominant type in the brainstem preparation up to P2. This difference is most simply accounted for by supposing that in the latter extracoerulear factors play some role in determining whether oscillations are present or not; there is some evidence for this since the suppression of nmDA receptor-mediated input resulted in the emergence of oscillations in previously non-oscillatory (type 2) neurones. This is potentially important because it suggests that the gradual shift in the relative incidence of type 1 and type 2 neurones between P1 and P5 may not be due to a change in the level of anatomical coupling, but to the gradual elimination of mechanisms making electrical connections to type 2 neurones ineffective.
The second difference concerns the sensitivity of oscillations to TTX in the brainstem preparation. This was unexpected because it is not generally the case - a few exceptions were noted by Christie et al. (1989) - in the neonatal slice (see also Williams & Marshall, 1987). We have given reasons with the results for supposing that the response observed here was not related to recording configuration or the composition of the pipette solution; reasons are also given for believing that the oscillations are not synaptic potentials, and we can eliminate the possibility that the oscillations are dependent on the transmission of ‘fast’ sodium action potentials because after the latter were suppressed by TTX the oscillations were restored by addition of K+ channel blockers; these particular conclusions are in agreement with those reached in previous work (see also Travagli et al. 1995). Similarly, in the presence of TTX at low (0.2 μmmu;m) concentration, when the oscillations were sustained for a prolonged period after suppression of phrenic discharge and respiratory-phased synaptic input, they were blocked by Cd2+, a result consistent with their generation by a Ca2+-dependent mechanism and with the original description of these oscillations as ‘calcium spikes’ (Williams & Marshall, 1987).
At this stage we suggest that TTX blocks a Na+ conductance active at the membrane potential (−51 ± 4 mV) prevailing in these experiments, and that the effect of this block is to reduce the current available for electrical coupling. This effect would then be counteracted by the increase in membrane resistance produced by K+ channel blockers so that coupling and oscillations are restored. Following on from this, the action of TTX in suppressing the oscillation would be ‘indirect’, achieved in effect by reducing the spread of oscillatory activity to a point where it is no longer detectable. It is also necessary to suppose that this response to TTX is related in some way to the use of the en bloc brainstem and therefore dependent on effects involving the whole nucleus or the pericoerulear dendrites at which electrical coupling is believed to occur (Ishimatsu & Williams, 1996). The 5- to 10-fold slower time course of suppression seen at a low (0.2 μmmu;m) compared with a high (1.0 μmmu;m) TTX concentration might be due to a low density of the relevant Na+ channels and/or a large number of pericoerulear sites at which dendro-dendritic interaction occurs.
Acknowledgments
We thank Frau U. Neubacher, Frau M. v. Frieling-Salewsky and Frau F. Depasquale for technical assistance, and the Deutsche Forschungsgemeinschaft (DFG Sche 46/12-2) for financial support.
References
- Aghajanian GK, Cedarbaum JM, Wang RY. Evidence for norepinephrine-mediated collateral inhibition of locus coeruleus neurons. Brain Research. 1977;136:570–577. doi: 10.1016/0006-8993(77)90083-x. 10.1016/0006-8993(77)90083-X. [DOI] [PubMed] [Google Scholar]
- Andrade R, Aghajanian GK. Locus coeruleus activity in vitro: intrinsic regulation by a calcium-dependent potassium conductance but not α2-adrenoceptors. Journal of Neuroscience. 1984;4:161–170. doi: 10.1523/JNEUROSCI.04-01-00161.1984. [DOI] [PMC free article] [PubMed] [Google Scholar]
- Astier B, Van Bockstaele EJ, Aston-Jones G, Pieribone VA. Anatomical evidence for multiple pathways leading from the rostral ventrolateral medulla (nucleus paragigantocellularis) to locus coeruleus in rat. Neuroscience Letters. 1990;118:141–146. doi: 10.1016/0304-3940(90)90612-d. 10.1016/0304-3940(90)90612-D. [DOI] [PubMed] [Google Scholar]
- Aston-Jones G, Astier B, Ennis M. Inhibition of noradrenergic locus coeruleus neurons by C1 adrenergic cells in the rostral ventral medulla. Neuroscience. 1992;48:371–381. doi: 10.1016/0306-4522(92)90497-p. 10.1016/0306-4522(92)90497-P. [DOI] [PubMed] [Google Scholar]
- Aston-Jones G, Ennis M, Pieribone VA, Nickell WT, Shipley MT. The brain nucleus locus coeruleus: restricted afferent control of a broad efferent network. Science. 1986;234:734–737. doi: 10.1126/science.3775363. [DOI] [PubMed] [Google Scholar]
- Aston-Jones G, Shipley MT, Chouvet G, Ennis M, Van Bockstaele E, Pieribone V, Shiekhattar R, Akaoka H, Drolet G, Astier B, Charléty P, Valentino RJ, Williams JT. Afferent regulation of locus coeruleus neurons: anatomy, physiology and pharmacology. Progress in Brain Research. 1991;88:47–75. doi: 10.1016/s0079-6123(08)63799-1. [DOI] [PubMed] [Google Scholar]
- Ballantyne D, Oyamada Y, Mückenhoff K, Scheid P. Respiratory modulation of membrane potential and sensitivity to CO 2 of Locus coeruleus neurones in vitro. Pflügers Archiv. 1997a;433:R18. [Google Scholar]
- Ballantyne D, Oyamada Y, Mückenhoff K, Scheid P. Chemosensitive pontine (Locus coeruleus, LC) neurones in the neonatal rat brainstem. XXXIII International Congress of Physiological Sciences. 1997b:L030.08. [Google Scholar]
- Christie MJ, Jelinek HF. Dye-coupling among neurons of the rat locus coeruleus during postnatal development. Neuroscience. 1993;56:129–137. doi: 10.1016/0306-4522(93)90568-z. [DOI] [PubMed] [Google Scholar]
- Christie MJ, Williams JT, North RA. Electrical coupling synchronizes subthreshold activity in locus coeruleus neurons in vitro from neonatal rats. Journal of Neuroscience. 1989;9:3584–3589. doi: 10.1523/JNEUROSCI.09-10-03584.1989. [DOI] [PMC free article] [PubMed] [Google Scholar]
- Coates EL, Li A, Nattie EE. Widespread sites of brain stem ventilatory chemoreceptors. Journal of Applied Physiology. 1993;75:5–14. doi: 10.1152/jappl.1993.75.1.5. [DOI] [PubMed] [Google Scholar]
- Dean JB, Bayliss DA, Erickson JT, Lawing WL, Millhorn DE. Depolarization and stimulation of neurons in nucleus tractus solitarii by carbon dioxide does not require chemical synaptic input. Neuroscience. 1990;36:207–216. doi: 10.1016/0306-4522(90)90363-9. [DOI] [PubMed] [Google Scholar]
- Dean JB, Huang R-Q, Erlichman JS, Southard TL, Hellard DT. Cell-cell coupling occurs in dorsal medullary neurons after minimizing anatomical-coupling artifacts. Neuroscience. 1997;80:21–40. doi: 10.1016/s0306-4522(97)00016-x. [DOI] [PubMed] [Google Scholar]
- Egan TM, Henderson G, North RA, Williams JT. Noradrenaline-mediated synaptic inhibition in rat locus coeruleus neurones. The Journal of Physiology. 1983;345:477–488. doi: 10.1113/jphysiol.1983.sp014990. [DOI] [PMC free article] [PubMed] [Google Scholar]
- Elam M, Yao T, Thorén P, Svensson TH. Hypercapnia and hypoxia: chemoreceptor-mediated control of locus coeruleus neurons and splanchnic, sympathetic nerves. Brain Research. 1981;222:373–381. doi: 10.1016/0006-8993(81)91040-4. [DOI] [PubMed] [Google Scholar]
- Ennis M, Aston-Jones G. Evidence for self- and neighbor-mediated postactivation inhibition of locus coeruleus neurons. Brain Research. 1986;324:299–305. doi: 10.1016/0006-8993(86)90424-5. [DOI] [PubMed] [Google Scholar]
- Ennis M, Aston-Jones G. Activation of locus coeruleus from nucleus paragigantocellularis: a new excitatory amino acid pathway in brain. Journal of Neuroscience. 1988;8:3644–3657. doi: 10.1523/JNEUROSCI.08-10-03644.1988. [DOI] [PMC free article] [PubMed] [Google Scholar]
- Ennis M, Aston-Jones G. Potent inhibitory input to locus coeruleus from the nucleus prepositus hypoglossi. Brain Research Bulletin. 1989;22:793–803. doi: 10.1016/0361-9230(89)90022-1. [DOI] [PubMed] [Google Scholar]
- Ennis M, Aston-Jones G, Shipley MT. A GABAergic input to locus coeruleus from the rostral dorsomedial medulla. Society for Neuroscience Abstracts. 1988;14:406. [Google Scholar]
- Foote SL, Bloom FE, Aston-Jones G. Nucleus locus ceruleus: new evidence of anatomical and physiological specificity. Physiological Reviews. 1983;63:844–914. doi: 10.1152/physrev.1983.63.3.844. [DOI] [PubMed] [Google Scholar]
- Hilaire G, Monteau R, Errchidi S. Possible modulation of the medullary respiratory rhythm generator by the noradrenergic A5 area: an in vitro study in the newborn rat. Brain Research. 1989;485:325–332. doi: 10.1016/0006-8993(89)90577-5. [DOI] [PubMed] [Google Scholar]
- Huang R-Q, Erlichman JS, Dean JB. Cell-cell coupling between CO2-excited neurons in the dorsal medulla oblongata. Neuroscience. 1997;80:41–57. doi: 10.1016/s0306-4522(97)00017-1. [DOI] [PubMed] [Google Scholar]
- Ishimatsu M, Williams JT. Synchronous activity in locus coeruleus results from dendritic interactions in pericoerulear regions. Journal of Neuroscience. 1996;16:5196–5204. doi: 10.1523/JNEUROSCI.16-16-05196.1996. [DOI] [PMC free article] [PubMed] [Google Scholar]
- Ivanov A, Aston-Jones G. Extranuclear dendrites of locus coeruleus neurones: activation by glutamate and modulation of activity by alpha adrenoceptors. Journal of Neurophysiology. 1995;74:2427–2436. doi: 10.1152/jn.1995.74.6.2427. [DOI] [PubMed] [Google Scholar]
- Kawai A, Ballantyne D, Mückenhoff K, Scheid P. Chemosensitive medullary neurones in the brainstem-spinal cord preparation of the neonatal rat. The Journal of Physiology. 1996;492:277–292. doi: 10.1113/jphysiol.1996.sp021308. [DOI] [PMC free article] [PubMed] [Google Scholar]
- Kimura F, Nakamura S. Locus coeruleus neurons in the neonatal rat: electrical activity and responses to sensory stimulation. Developmental Brain Research. 1985;23:301–305. doi: 10.1016/0165-3806(85)90055-0. [DOI] [PubMed] [Google Scholar]
- Nattie EE, Li A, Coates EL. Central chemoreceptor location and the ventrolateral medulla. In: Trouth CO, Millis RM, Kiwull-Schöne HF, Schläfke ME, editors. Ventral Brainstem Mechanisms and Control of Respiration and Blood Pressure. New York: Marcel Dekker, Inc.; 1995. pp. 131–150. [Google Scholar]
- Onimaru H, Arata A, Homma I. Firing properties of respiratory rhythm generating neurons in the absence of synaptic transmission in rat medulla in vitro. Experimental Brain Research. 1989;76:530–536. doi: 10.1007/BF00248909. [DOI] [PubMed] [Google Scholar]
- Onimaru H, Ballanyi K, Richter DW. Calcium-dependent responses in neurons of the isolated respiratory network of newborn rats. The Journal of Physiology. 1996;491:677–695. doi: 10.1113/jphysiol.1996.sp021249. [DOI] [PMC free article] [PubMed] [Google Scholar]
- Onimaru H, Homma I. Whole cell recordings from respiratory neurons in the medulla of brainstem-spinal cord preparations isolated from newborn rats. Pflügers Archiv. 1992;420:399–406. doi: 10.1007/BF00374476. [DOI] [PubMed] [Google Scholar]
- Oyamada Y, Ballantyne D, Mückenhoff K, Scheid P. Respiratory-modulated membrane potential of Locus coeruleus (LC) neurones in the in vitro brain stem-spinal cord preparation of the neonatal rat. European Respiratory Journal. 1997;10:181S. [Google Scholar]
- Pieribone VA, Aston-Jones G. Adrenergic innervation of the rat nucleus locus coeruleus arises predominantly from the C1 adrenergic cell group in the rostral medulla. Neuroscience. 1991;41:525–542. doi: 10.1016/0306-4522(91)90346-p. [DOI] [PubMed] [Google Scholar]
- Pineda J, Aghajanian GK. Carbon dioxide regulates the tonic activity of locus coeruleus neurons by modulating a proton- and polyamine-sensitive inward rectifier potassium current. Neuroscience. 1997;77:723–743. doi: 10.1016/s0306-4522(96)00485-x. [DOI] [PubMed] [Google Scholar]
- Scheid P, Oyamada Y, Ballantyne D, Mückenhoff K. CO2-dependent chemosensitivity of Locus coeruleus neurons in the in vitro brainstem-spinal cord of the neonatal rat. American Journal of Respiratory and Critical Care Medicine. 1997;155:A299. [Google Scholar]
- Smith JC, Ellenberger HH, Ballanyi K, Richter DW, Feldman JL. Pre-Bötzinger complex: A brainstem region that may generate respiratory rhythm in mammals. Science. 1991;254:726–729. doi: 10.1126/science.1683005. [DOI] [PMC free article] [PubMed] [Google Scholar]
- Suzue T. Respiratory rhythm generation in the in vitro brain stem-spinal cord preparation of the neonatal rat. The Journal of Physiology. 1984;354:173–183. doi: 10.1113/jphysiol.1984.sp015370. [DOI] [PMC free article] [PubMed] [Google Scholar]
- Travagli RA, Dunwiddie TV, Williams JT. Opioid inhibition in locus coeruleus. Journal of Neurophysiology. 1995;74:519–528. doi: 10.1152/jn.1995.74.2.519. [DOI] [PubMed] [Google Scholar]
- Williams JT, Marshall KC. Membrane properties and adrenergic responses in locus coeruleus neurons of young rats. Journal of Neuroscience. 1987;7:3687–3694. doi: 10.1523/JNEUROSCI.07-11-03687.1987. [DOI] [PMC free article] [PubMed] [Google Scholar]
- Williams JT, North RA, Shefner SA, Nishi S, Egan TM. Membrane properties of rat locus coeruleus neurones. Neuroscience. 1984;13:137–156. doi: 10.1016/0306-4522(84)90265-3. [DOI] [PubMed] [Google Scholar]