Abstract
Mammalian phrenic nerve, in a trough filled with saline, was excited by magnetic coil (MC)-induced stimuli at defined stimulation sites, including the negative-going first spatial derivative of the induced electric field along a straight nerve, at a bend in the nerve, and at a cut nerve ending. At all such sites, the largest amplitude response for a given stimulator output setting was elicited by an induced damped polyphasic pulse consisting of an initial quarter-cycle hyperpolarization followed by a half-cycle depolarization compared with a predominantly ‘monophasic’ quarter-cycle depolarization.
Simulation studies demonstrated that the increased efficacy of the induced quarter-cycle hyperpolarizing-half-cycle depolarizing polyphasic pulse was mainly attributed to the greater duration of the outward membrane current phase, resulting in a greater outward charge transfer afforded by the half-cycle (i.e. quarter-cycles 2 and 3). The advantage of a fast rising initial quarter-cycle depolarization was more than offset by the slower rising, but longer duration depolarizing half-cycle.
Simulation further revealed that the quarter-cycle hyperpolarization-half-cycle depolarization showed only a 2.6 % lowering of peak outward current and a 3.5 % lowering of outward charge transfer at threshold, compared with a half-cycle depolarization alone. Presumably, this slight increase in efficacy reflects modest reversal of Na+ inactivation by the very brief initial hyperpolarization.
In vitro, at low bath temperature, the nerve response to an initial quarter-cycle depolarization declined in amplitude as the second hyperpolarizing phase progressively increased in amplitude and duration. This ‘pull-down’ phenomenon nearly disappeared as the bath temperature approached 37 °C. Possibly, at the reduced temperature, delay in generation of the action potential permitted the hyperpolarization phase to reduce excitation.
Pull-down was not observed in the thenar muscle responses to median nerve stimulation in a normal human at normal temperature. However, pull-down emerged when the median nerve was cooled by placing ice over the forearm.
In a nerve at subnormal temperature straddled with non-conducting inhomogeneities, polyphasic pulses of either polarity elicited the largest responses. This was also seen when stimulating distal median nerve at normal temperature. These results imply excitation by hyperpolarizing-depolarizing pulse sequences at two separate sites. Similarly, polyphasic pulses elicited the largest responses from nerve roots and motor cortex.
The pull-down phenomenon has a possible clinical application in detecting pathologically slowed activation of Na+ channels. The current direction of the polyphasic waveform may become a significant factor with the increasing use of repetitive magnetic stimulators which, for technical reasons, induce a cosine-shaped half-cycle, preceded and followed by quarter-cycles of opposite polarity.
When Polson et al. (1982) first elicited a human compound muscle action potential (CMAP) with a neuromagnetic stimulus applied to distal forearm, the induced biphasic pulse had an initial larger amplitude phase that depolarized the nerve membrane, followed by a longer lasting, smaller amplitude second phase. The induced biphasic pulse, referred to below as a ‘monophasic’ pulse, has emerged as the standard configuration used in the majority of stimulators available commercially (Barker et al. 1987). In contrast, McRobbie & Foster (1984) induced a damped polyphasic pulse and compared it with the predominantly monophasic pulse, which they called a ‘quarter-cycle followed by a slow decay’. Over human forearm, the polyphasic pulse elicited the CMAP at lowest threshold. Subsequently, a number of physiological and simulation studies confirmed McRobbie & Foster's findings (Cadwell, 1990; Claus et al. 1990; Wada et al. 1996). Claus and colleagues suggested that the polyphasic pulse is more powerful owing to the greater peak-to-peak magnitude of the first two quarter-cycles. However, Wada and colleagues present contradictory data on this issue; their physiological recordings reveal decreased threshold with the half-cycle compared with a quarter-cycle pulse, whereas their simulation studies demonstrate a higher threshold with half-cycle excitation.
In this report, excitation by these waveforms is further investigated, using in vitro recording methods that precisely define the site of stimulation along the nerve at the negative-going first spatial derivative of the induced electric field, at a bend in the nerve and at a cut nerve ending. Using waveforms with identical first phases, responses elicited by an induced, predominantly monophasic pulse, are compared with those elicited by a polyphasic pulse. Similar studies are also carried out over human forearm and with computer simulation. As previously briefly presented, we propose that the increased efficacy of the polyphasic pulse results mainly from the longer duration of the depolarizing phase when it consists of quarter-cycles 2 and 3 compared with quarter-cycle 1 (Maccabee et al. 1993b; 1996b).
METHODS
In vitro experiments
Magnetic coil stimulation. A time-varying magnetic field was generated by a Cadwell Laboratories (Kennewick, WA, USA) MES-10 stimulator. The current profile induced by the standard MES-10 is polyphasic. The output of the MES-10 was fed into a custom-built device that allowed selection of two different monophasic waveforms, in addition to the standard MES-10 polyphasic pulse. This was accomplished by manipulating the second phase of the polyphasic pulse while keeping the first phase constant. The hardware implementation altered the circuit when the waveform entered the second phase, i.e. after a specified delay using a flywheel diode shunt (McRobbie & Foster, 1984). The device also provided for selection of the direction of current flow. Attached to this device by a cable was a figure-of-eight magnetic coil (MC), covered by black plastic tape (9.6 × 4.8 cm o.d., each half-coil was 4.8 × 4.8 cm).
When induced in saline solution and recorded with a coaxial cable probe, the first phase (i.e. the first quarter-cycle) of the conventional polyphasic pulse and the first phases of the modified pulses were identical (Fig. 1). The second phase of the conventional polyphasic pulse, consisting of two quarter-cycles, was 80 % of that of the first phase in amplitude. Quarter-cycle durations were measured to range from 78 to 85 μs, and the latter value was used for simulation studies (see below). By moving manual switches, the polyphasic pulse was further damped, giving two predominantly monophasic pulses with two different levels of damping. The amplitudes of the damped second phases were either 35 or 20 % that of the first phase. These relative phase amplitudes were constant at all MC output intensities, and when reversed, gave the same relative amplitude sequences. Thus using two different polarities and three different waveform shapes it was possible to select up to six different induced MC pulses without moving the stimulating MC.
Figure 1. Induced electric fields used for nerve stimulation and in simulation.
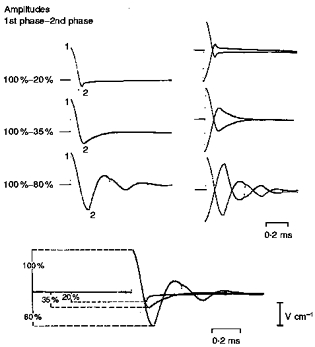
Positivity is indicated by an upward deflection. Although for a given MC stimulator output the initial quarter-cycles superimpose, the amplitudes of the second phases are variously 20, 35 and 80 % that of the initial phase. By reversing the current direction, a total of six stimulating pulse waveforms are available.
Nerve in trough. Using the identical protocols of Maccabee et al. (1993a), experiments were performed on phrenic nerves obtained from Yorkshire pigs following completion of other, unrelated experiments under Saffan (Pitman-Moore, UK) anaesthesia (approximately 12 mg kg−1 h−1, i.v.). The nerve was dissected from the diaphragm to the cervical roots. After nerve excision, each animal was killed with an overdose of sodium pentobarbitone. Ten-centimetre or greater lengths of nerve were immersed in a transparent, flat-bottomed rectangular trough filled to a depth of 15 mm with mammalian Ringer solution. Except in the cut nerve experiments, the ends of the nerve were ligated. At the bottom of the trough, the nerve was held down by a thin transverse thread at the end closer to the recording electrode. At this end the nerve gently sloped to the surface of the Ringer solution, where it emerged for monophasic recording in air and was protected from drying by a Vaseline-mineral oil coating. At the further end the nerve was positioned according to the experiment. In all in vitro studies, recordings were obtained from only one end of the nerve. Experiments on freshly cut nerve were performed 1.5–2.5 h after nerve transection.
Neuromagnetic and electrical stimulations of nerve in trough. As nearly complete details were published in Maccabee et al. (1991, 1993a), and Amassian et al. (1992), the following descriptions are abbreviated.
For excitation at the first spatial derivative site, the figure-of-eight MC was positioned immediately beneath and contacting the under surface of the trough, with the long axis of the junction parallel to the nerve. For optimal excitation at the end of the nerve, at the bend, and beneath closely spaced glass tubes placed astride the nerve (perpendicular to the trough), the mid-point of the MC junction, where the electric field is maximal, was moved parallel to and beneath these locations. A bipolar stimulating electrode assembly was used in the Ringer solution to elicit a response from the nerve; thus the site of nerve excitation, with a response latency equal to that elicited by the MC, was identified (Amassian et al. 1992). Nerve responses were recorded with an Excel Electromyography System (Cadwell Laboratories). The temperature of the solution was measured repeatedly throughout the experiments and was at room temperature.
Waveform nomenclature. In Fig. 1, the electric field recordings of the different stimulating pulses are measured with a coaxial cable electrode in a line along the trajectory of the nerve over the proximal end of the MC, near the handle. Positivity is indicated by an upward deflection.
As the reader looks at the experimental set-ups and electric fields in Figs 2 to 8, a negative (or below baseline) deviation of the electric field induces a right-to-left direction of current flow (+ to −) along the trajectory of the nerve. A positive (or above baseline) deviation of the electric field induces a left-to-right direction of current flow along the trajectory of the nerve. Also, the induced electric field stimulating pulses are illustrated adjacent to the diagrams, indicating the direction of current flow for each phase, labelled 1 or 2. For example, in Fig. 2A, the stimulating waveform consists of an initial negative phase (at 100 % amplitude) that induces current in the illustrations and the bath from right to left, and a second positive phase (at 80 % relative amplitude) that induces current from left to right. At spatial derivative site E, the polyphasic waveform pulse, designated H100-D80, creates a stimulating sequence of hyperpolarization (H100 %)-depolarization (D80 %). The opposite sequence depolarization (D100 %)-hyperpolarization (H80 %) occurs simultaneously at the other spatial derivative site further from the recording electrode (open circle). Induced current direction along the nerve trajectory was determined similarly for the other waveform pulses and experiments.
Figure 2. Experimental set-up and in vitro responses to MC stimulation of a straight nerve in a homogeneous medium volume conductor.
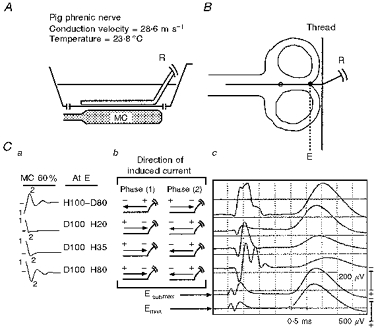
A, position of the MC with respect to the trough. B, accurate dimensional relationship of the figure-of-eight MC to the nerve trajectory within the trough. Before exiting the volume conductor, the nerve is held down to the bottom of the trough by a thin thread. Ca, designation of induced electric field waveforms at site E; b, directions of induced current for each pulse phase; c, corresponding compound nerve action potentials. The spatial derivative site (E) closer to the recording electrodes, and the further spatial derivative site are illustrated on the nerve trajectory by • and ○, respectively. Emax and Esubmax are responses at different gains to supramaximal and submaximal electrical stimulation elicited at site E. R, recording electrodes. Pull-down is evident in this and Figs 3 and 4 when the responses to D100-H20, H35 and H80 are compared.
Figure 8. Median nerve CMAPs elicited at constant MC stimulator output intensity (70 %) and using six different pulse sequences (I–VI).
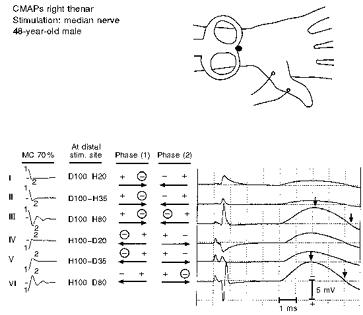
○ indicates the proposed effective depolarizing phase (s) at proximal and/or distal excitation site (s) for each induced pulse (see text).
Recording and neuromagnetic stimulation in humans
Using the same twin MC as in the in vitro experiments, the right median nerve was stimulated at the forearm. CMAPs were recorded from right thenar muscles with 10 mm Ag-AgCl recording discs.
The MC was oriented symmetrically and tangentially over the distal forearm, with its junction parallel to and directly over the long axis of the median nerve (Figs 7 and 8). The median nerve was also stimulated before and after cooling the forearm with crushed ice contained within a rubber glove. Skin surface temperature was repeatedly measured with a flat thermistor probe. The MC location was outlined on the skin with wax pencil; after its temporary removal, the ice pack was placed over the entire region. Subsequently, the MC was replaced at its previous marked site (Fig. 7).
Figure 7. Median nerve CMAPs at different temperatures are elicited at constant MC stimulator output intensity (50 %).
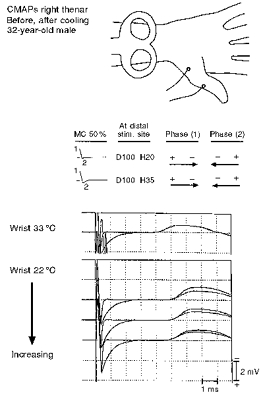
Superimposed responses at two temperatures elicited by the different waveforms are shown in the bottom records. Temperature was measured at the skin surface. Cooling was obtained by packed ice, which required removal and then repositioning of the MC. At 33 °C, pull-down is absent. At 22 °C, latencies are prolonged and pull-down is present but diminishes as warming occurs.
As in the in vitro experiments, induced current pulse and polarity were selected with a mechanical switch. Negativity in the focal recording electrode resulted in an upward deflection. Filter settings were 3–3000 Hz. Human subjects were members of the Departments of Neurology, Physiology, and Surgery. The study was approved by the Institutional Review Board and subjects gave informed, written consent. Seven males (mean age 42 years, range 34–48 years) were studied.
Computer simulation
Excitation sites. Spatial simulation studies were performed on a single nerve fibre using a previously published one-dimensional cable model of magnetic stimulation (Nagarajan et al. 1993). The waveforms used in the model (Fig. 9A) were nearly identical to those used in the in vitro experiments (Fig. 1, top). The electric field induced by a figure-of-eight MC (with the same dimensions as those used in vitro) and the corresponding spatial derivative sites were calculated along the axon (Durand et al. 1989; Reilly, 1989; Roth & Basser, 1990; Basser & Roth, 1991). It was assumed that this field excited an isolated myelinated axon (20 μm in diameter), 20 cm in length, within a semi-infinite volume conductor at 37°C. The axon was given the non-linear membrane characteristics of mammalian nodes of Ranvier. All simulations were performed on a 486–25 MHz Gateway or a Sun Sparc Station 10 using NEURON, a neuronal simulation software program (Hines, 1989). The original program was modified to include simulations of the effect of neural stimulation by applied electric and magnetic fields (Warman et al. 1992).
Figure 9. Simulation of the stimulating waveforms, the excitation sites along a uniform straight axon, and the graphical display of latency of activation vs. distance.
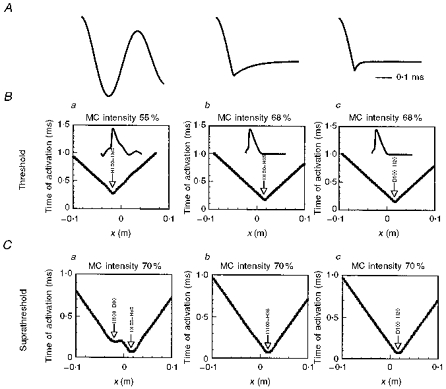
A, the waveform shapes are similar to those used in the nerve-in-bath and human experiments. B, activation graphs at threshold using a polyphasic pulse (H100-D80) at 55 % output (a), and using monophasic pulses (D100-H35 and D100-H20) at 68 % output (b and c, repsectively). Transmembrane potentials at the sites of excitation for each waveform are shown in the insets. C, activation graphs for the same axon, but with suprathreshold excitation (70 % output). Mid-length of the MC junction corresponds to x= 0 on the horizontal axis.
Spatio-temporal activation graphs for a long straight axon were plotted (Roth & Basser, 1990; Basser & Roth, 1991; Nagarajan et al. 1993). The time taken for an action potential to propagate from the site of excitation to the distal end of the axon was measured, and is referred to as the conduction (or latency) time. It was assumed that the recording electrodes were located at the distal end of the axon.
Response to threshold current passed by an intracellular electrode. Temporal simulation studies were performed on a space-clamped patch of axon membrane, and compared seven stimulating pulse sequences at threshold, of which the top six were studied in vitro and were available from the MES-10 stimulator (Fig. 10). The bottom pulse sequence lacked an initial inward quarter-cycle, thereby serving to compare the identical depolarizing half-cycle with and without an initial hyperpolarization (cf. H100-D80 (Fig. 10, next to bottom) with H0-D80 (Fig. 10, bottom)).
Figure 10. Simulation of threshold current passed by an intracellular electrode for space-clamped axonal membrane.
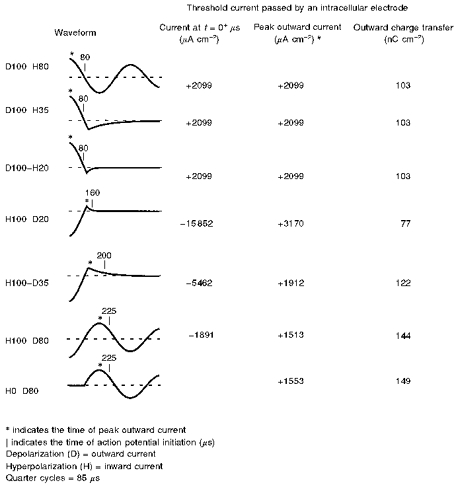
Simulation is performed with the six possible waveforms available from the neuromagnetic stimulator and an additional waveform designated H0-D80 (bottom) consisting of a half-cycle 80 % depolarization without a preceding hyperpolarization. Outwardly and inwardly directed membrane currents are defined as depolarizing and hyperpolarizing, respectively. Note that the setting on the magnetic stimulator intensity dial is linearly related to the membrane current at t= 0+μs.
The standard nomenclature and induced electric field profile of each stimulating MC pulse waveform is shown on the left in Fig. 10. Note that in neuromagnetic stimulation the induced electric field is the same whether extracellular or intracellular (Nagarajan & Durand, 1996); moreover, the time course of the induced intracellular electric field profile is identical to that of the stimulating current (Warman et al. 1992). Inwardly directed currents are defined as negative in polarity giving rise to a hyperpolarization (H), and outwardly directed currents are defined as positive in polarity giving rise to a depolarization (D). To the right of each waveform is the current (positive or negative) at time t= 0+μs when curent passage is initiated (0+ is defined as an instant after time 0). In the stimulator used, the setting on the stimulus intensity dial is linearly related to the current at t= 0+μs. The next column to the right in Fig. 10 shows the peak outward current at threshold, indicated by an asterisk on each waveform. In addition to initial and peak outward current, the simulation also determined for each waveform the duration of the outward current at threshold from onset to action potential initiation (indicated by a vertical line on each waveform), and the corresponding (integrated) outward charge transfer (Fig. 10, right-most column). The time to initiation of the action potential was defined when the transmembrane potential reached 0 mV (resting potential, −80 mV) with a threshold slope of 60 mV μs−1.
RESULTS
In vitro nerve studies
Straight nerve in homogeneous conducting medium
Studies performed on three straight nerves examined excitation characteristics of responses elicited at the spatial derivative site closer to the recording electrodes (E, indicated by • in Fig. 2B). The spatial derivative site further from the recording electrodes is indicated by ○ (Fig. 2B). Site E was identified by direct electric stimulation of the nerve with a bipolar electrode, roughly matching response amplitude and latency with that elicited at the negative-going spatial derivative (Fig. 2, fifth and second traces from the top, respectively). After a few trials, a constant MC output intensity was chosen (60 %), which yielded well-defined responses to four types of stimulus waveforms arising at spatial derivative site E. (The predominantly monophasic waveforms with negative-going second phases of 20 and 30 % at derivative site E (H100-D20 and H100-D35) were below threshold there. Using higher MC output intensity these same monophasic waveforms elicited responses at the further spatial derivative site (○, Fig. 2B), where their first phases are 100 % and negative-going.)
The largest amplitude responses at E are elicited by H100-D80 (Fig. 2C, top trace), smaller amplitude responses by D100-H20 (second trace from top), even smaller responses by D100-H35 (third trace from top), and smallest responses by D100-H80 (fourth trace from top). The progressive decrease in response amplitude when induced pulses with identical initial depolarizing phases (quarter-cycle 1) are followed by progressively increasing second phases (quarter-cycles 2 and 3) is called ‘pull-down’. The reduction in amplitude is accompanied by a slight increase in onset latency, comparing D100-H20 with D100-H80. Significantly, pull-down is attenuated at higher temperatures (Figs 6 and 7).
Figure 6. In vitro responses at different temperatures to MC stimulation of a bent nerve in a homogeneous media volume conductor.
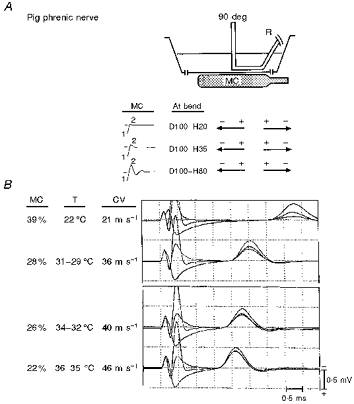
A, the nerve was pivoted about a thread (not illustrated) to a 90 deg angle. Three different waveform configurations (shown in B) elicit superimposed responses at each temperature (shown in C). At the bend, the initial depolarizing phase of each waveform is identical, but the second hyperpolarizing phases progressively increase in amplitude. The severe ‘pull-down’ at low temperature (top trace) nearly disappears at higher temperatures (bottom trace). CV, conduction velocity; T, temperature.
It might be expected that in a uniformly excitable nerve the sequence designated D100-H80 at E also excites the nerve at the further derivative site (○, Fig. 2B) with an H100-D80 sequence; this would generate an action potential with amplitude similar to the top trace in Fig. 2C (elicited at E by H100-D80). Also, part of the action potential elicited at the further derivative site would fail to propagate to the derivative site (E) because of collision with the action potential arising at E. However, an uncollided component is not clearly evident on the falling phase of the bottom MC trace (fourth from top). This implies that towards the ligated portion of the nerve, excitability was less than at E.
Also, the top two responses in Fig. 2C, although of similar amplitude, do not demonstrate the identical onset latency. The damped biphasic depolarizing-hyperpolarizing D100-H20 at E (second trace from the top) elicits a response that is 130–150 μs earlier than the polyphasic hyperpolarizing-depolarizing stimulus H100-D80 at E (top trace).
Bent nerve
This experiment was performed on two nerves: previously, excitation threshold was found to be reduced at a bend only when the direction of induced current was directed along the nerve towards the bend (Maccabee et al. 1993a). In Fig. 3C, the response to direct electrical stimulation at the bend is shown in the top trace. Note the low MC output intensity of 16 %. As in Fig. 2C, the relative response amplitudes are presented in order, top to bottom. The largest amplitude response is elicited at the bend site H100-D80 (second trace from top), a smaller response is by D100-H20 (third trace from top), an even smaller response by D100-H35 (fourth trace from top), and the smallest response by D100-H80 (fifth trace from top). The progressive decline in amplitude indicates pull-down, as illustrated previously in Fig. 2. The superimposed traces (bottom) reveal that the peak of the response to H100-D80 is slightly delayed compared with the other responses.
Figure 3. Responses to MC stimulation of a bent nerve in a homogeneous medium volume conductor.
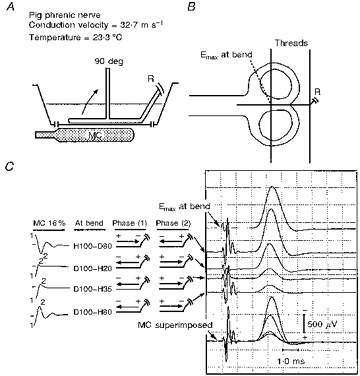
The nerve was pivoted about a thin thread as shown. Emax indicates the suprathreshold response to conventional electrical stimulation elicited at the bend.
Cut nerve ending
End excitation studies were performed on two nerves, again using current directed along the nerve towards the cut end (Fig. 4). The results are essentially the same as when exciting a nerve at a bend. The site of excitation at the nerve ending is indicated by the response to direct electrical stimulation there (Fig. 4C, Emax, top trace). The largest amplitude response to magnetic stimulation is elicited, close to the end, by H100-D80 (bottom trace), which also demonstrates, as expected, a slightly delayed peak latency compared with the other responses. However, when the second (depolarizing) phases are 20 or 35 %, no responses were recorded from the nerve (fifth and sixth traces from the top) at the same MC output intensity. A smaller response is elicited by D100-H20 (second trace from the top); the third and fourth traces from the top show progressively even smaller responses with increasing second hyperpolarizing phases (35 %, 80 %).
Figure 4. In vitro responses to MC stimulation at a cut nerve ending of a straight nerve in a homogeneous medium volume conductor.
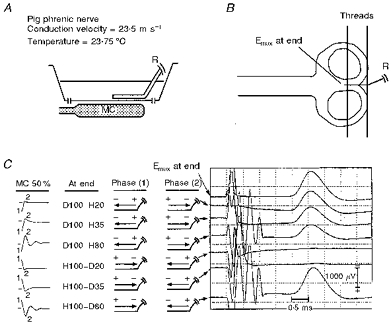
The portion of the nerve closer to the terminal cut end was held down by a thin thread as shown.
Straight nerve in an inhomogeneous conducting medium
In three nerves, solid Lucite cylinders of varying diameter, and in one nerve (Fig. 5), two thin glass tubes were placed astride a straight nerve. The glass tubes were purposely located 4–5 mm distal to the mid-point of the MC junction such that a monophasic pulse of either polarity at the same constant intensity elicited responses of approximately equal amplitude (compare the amplitude response of pulse I with IV, and pulse II with V). In Fig. 5, owing to the nearly simultaneous activation of some pulses at sites further from (a) and closer to (b) the recording electrodes (Fig. 5A), the stimulating pulse response sequences are designated by roman numerals for convenience, and the inferred membrane depolarizations and hyperpolarizations at sites a and b are indicated in Fig. 5D (see Discussion). As expected, the onset latencies of responses I and II precede those of responses IV and V by approximately 270 μs; at the measured conduction velocity (CV) of 25 m s−1, this time difference corresponds to excitation sites 6.8 mm apart on either side of the tubes, roughly depicted by filled circles (Fig. 5B).
Figure 5. In vitro responses to MC stimulation of a straight nerve straddled by 5 mm diameter glass tubes.
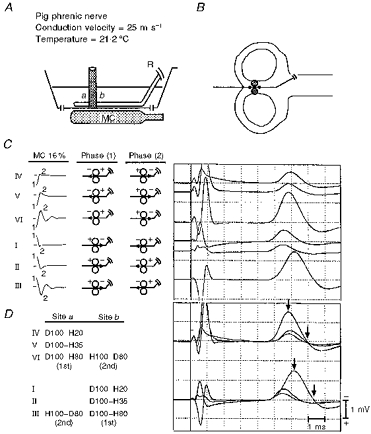
Six different pulse sequences are used (I–VI). Excitation can occur either at site a or b of the glass tubes, related to the stimulating pulse sequence.
In contrast to studies of a straight nerve in a homogeneous volume conductor (at a bath temperature below 25°C), pull-down was observed only when comparing response I with II, and IV with V; otherwise, polyphasic pulses of either polarity elicited the largest responses (responses III and VI). Also, although the onset latencies of responses III and VI are nearly identical, the peak of response III is delayed by approximately 310 μs compared with that of response VI (Fig. 5C, left vertical arrows) and the corresponding negative phase durations are also delayed by the approximate conduction time from the further excitation site (right vertical arrows).
Effect of varying temperature on nerve response
In two nerves the bend model was used to examine the effect of varying temperature on the pull-down phenomenon, previously demonstrated in Figs 2, 3, 4 and also partially demonstrated in Fig. 5. The bend model was chosen because it provides the lowest threshold site in a homogeneous media volume conductor and thus requires the least stimulator output intensity (Fig. 6). At ambient room temperature (22°C, top superimposed traces in Fig. 6) the response elicited at the bend by D100-H80 (smallest response) is less than one-third of that elicited by D100-H20 (largest response). Thus pull-down was evident when increasing the amplitude of the second, hyperpolarizing phase. When the measured bath temperature was above 35°C, however, the pull-down phenomenon had almost disappeared (bottom traces, Fig. 6).
Stimulation over distal human forearm at varying temperatures
Median nerve at different temperatures
In one subject, the right median nerve was stimulated with depolarizing-hyperpolarizing sequences before and immediately after cooling the forearm with ice. Cooling significantly delayed the onset latency (Fig. 7, cf. top trace with lower traces). Pull-down with the larger second hyperpolarizing phase was not evident at 33°C forearm surface temperature, but was evident at 22°C, and thereafter was attenuated as forearm temperature increased towards normal.
Median nerve without cooling
The right median nerve was stimulated at the forearm in four normal subjects with the distal divergence of the MC junction variously located up to 4 cm proximal to the distal wrist crease. When using constant MC stimulator output below response saturation, monophasic pulses yielded smaller responses with the current directed towards the excitation site closer to the recording electrodes than when directed towards the further site (Fig. 8; cf. response I with IV and II with V). (In Fig. 8, roman numeral designations are also used for convenience.) As anticipated, the onset latencies of responses I and II precede those of responses IV and V (by approximately 290 μs); at the measured CV of 60 m s−1, this time difference corresponds to excitation sites 17.4 mm apart.
In contrast to the glass tube preparation and median nerve at lower temperatures, pull-down was just minimally visible (cf. response I with II and IV with V). Surprisingly, repeated studies in all four subjects revealed that polyphasic pulses of either polarity elicited the largest responses (III and VI). Again, although the onset latencies of responses III and VI are nearly identical, the peak of response III is delayed by approximately 280 μs compared with that of response VI (Fig. 8, left vertical arrows) and the corresponding negative phase duration of response III compared with response VI is delayed by the approximate conduction time from the further excitation site (right vertical arrows).
Simulation studies
Excitation sites along a straight axon
Long straight axon. In these simulations (Fig. 9), a long straight axon (length ranging from x=−0.1 to +0.1 m) was positioned along the axis of the junction of the figure-of-eight MC, symmetrical to the electric field and similar to the geometry of the in vitro experiments. The computer generated pulses (Fig. 9A) are nearly identical to the waveforms implemented in hardware (cf. Fig. 1). The simulated responses to threshold and suprathreshold stimulation using these waveform pulses are displayed as activation graphs (Fig. 9B and C, respectively). The corresponding transmembrane potentials at the sites of threshold excitation are illustrated in the insets.
To achieve threshold excitation (Fig. 9B), the simulation requires a polyphasic pulse at 55 % MC output (Fig. 9Ba), and monophasic pulses at 68 % output (Fig. 9Bb and Bc). The lowest threshold excitation elicited by the polyphasic pulse at 55 % output gives rise to a H100-D80 sequence at the spatial derivative site to the left of x= 0. Depolarization occurs during the second phase of the pulse (inset, Fig. 9Ba). Notably, the corresponding D100-H80 at the right spatial derivative site to the right of x= 0 does not excite the nerve at 55 % MC output. In contrast, at 68 % MC output, the two predominantly monophasic pulses give rise to D100-H35 and D100-H20 sequences, which excite the nerve only at the right spatial derivative site (i.e. during the initial depolarizing phase of the pulse (insets, Fig. 9Bb and Bc). Thus at their respective thresholds, the polyphasic and monophasic waveforms excite the nerve at different loci along the nerve membrane. In addition, threshold onset latency elicited by the H100-D80 sequence at the left spatial derivative site is delayed by approximately 130 μs compared with the responses elicited by D100-H35 and D100-H20 at the right spatial derivative site.
At suprathreshold intensity (Fig. 9C), activation graphs at the same MC output intensity (70 %) reveal that excitation by the polyphasic pulse occurs at two sites, first at the right spatial derivative site, and 130 μs later at the left spatial derivative site. This delay confirms that observed in vitro by Maccabee et al. (1993a). Roth & Basser (1990, their Fig. 10) previously demonstrated two activation sites when simulating excitation with a polyphasic pulse.
Response to threshold current passed by an intracellular electrode
Stimulator output at threshold excitation. In these experiments, the current waveforms identical to those induced in vitro are simulated and passed via an intracellular electrode; these are used to excite a patch of space-clamped axon (Fig. 10, top six traces). As anticipated from the in vitro experiments, the least current required at t= 0+μs (−1891 μA cm−2) to excite the membrane is provided by H100-D80, which consists of a quarter-cycle 100 % hyperpolarization-half-cycle 80 % depolarization (Fig. 10, second trace from the bottom).
The next lowest threshold simulated pulse waveforms (Fig. 10, top three traces) all require the identical peak current (+2099 μA cm−2) to excite the membrane at t= 0+μs. These three current waveforms all share the identical initial depolarization component (quarter-cycle, 100 %). Following the initial depolarization there are: (i) a hyperpolarization (half-cycle, 80 %), D100-H80; (ii) a small hyperpolarization (35 %), D100-H35; and (iii) a still smaller hyperpolarization (20 %), D100-H20. As expected from the preceding temperature studies in vitro (Fig. 6) and in human forearm (Fig. 7), the pull-down phenomenon is not observed in these simulations performed at 37°C.
The greatest initial current at t= 0+μs required to excite the membrane to threshold (−15 852 μA cm−2) is provided by H100-D20, which consists of a quarter-cycle 100 % hyperpolarization−20 % depolarization (Fig. 10, fourth trace from top).
Efficacy of the hyperpolarizing-depolarizing pulse. Two possible explanations could account for the enhanced efficacy of H100-D80. First, the initial hyperpolarization could reduce Na+ inactivation (Hodgkin & Huxley, 1952). Therefore, a further simulation was performed comparing threshold activation by a half-cycle 80 % depolarization with and without an initial quarter-cycle 100 % hyperpolarization (Fig. 10, bottom two waveforms; H100-D80 vs. H0-D80). As shown in Fig. 10, threshold peak outward current for H100-D80 was +1513 μA cm−2 but for H0-D80, the threshold peak outward current was 1553 μA cm−2. Thus the initial hyperpolarization reduced excitation threshold by approximately ((1553-1513)/1513) × 100 %= 2.6 %. The corresponding reduction in outward charge transfer attributed to the initial hyperpolarization is 3.5 % (see below).
The second possible explanation for the enhanced efficacy of H100-D80 is the greater duration and corresponding greater outward charge transfer during the depolarizing half-cycle. However, not all the charge transferred during this depolarizing half-cycle is necessary for excitation; i.e. excitation is completed for all simulated pulses before the depolarizing phase falls back to baseline (Fig. 10). Notably, the duration from onset of threshold outward current to action potential initiation (and corresponding outward charge transfer) is 140 μs (and 144 nC cm−2) for H100-D80 versus 80 μs (and 103 nC cm−2) for the D100-H80, D100-H35 and D100-H20 sequences.
DISCUSSION
Explanation of in vitro findings by simulation
Unlike our earlier work, which determined the sites of low-threshold neuromagnetic excitation along the nerve fibre, this study examines the effects of different configurations of the induced pulse at known sites. In vitro, at all excitation sites, the largest response for a given stimulator intensity setting was elicited when the pulse sequence was a hyperpolarizing quarter-cycle followed by a depolarizing half-cycle.
In order to explain this experimental observation, additional computer simulations were performed because an initial depolarizing half-cycle was not instrumentally available to compare with the hyperpolarizing-depolarizing sequence.
Initially, spatial simulation studies performed on a model of a single nerve fibre excited at threshold confirmed previous theoretical work and qualitatively demonstrated that the loci of excitation (Fig. 9) were similar to those observed within homogeneous volume conductors in vitro (Maccabee et al. 1993a). These studies show further that lowest threshold excitation occurs when the pulse sequence consists of a quarter-cycle hyperpolarization followed by a half-cycle depolarization. The subsequent temporal simulation of a patch of space-clamped axon (Fig. 10) investigated three issues. For a given pulse waveform these include: (a) what is the stimulator output required for excitation?; this leads to the practical instrumental question, is the magnetic stimulator capable of generating the suprathreshold outward current required with each waveform?; (b) why is the quarter-cycle hyperpolarizing-half-cycle depolarizing pulse sequence the most efficacious tested?; (c) what is the relationship at threshold between the pulse sequence and the depolarizing outward charge transfer?
The stimulator capability
The practicality issue is illustrated in Fig. 10 by the extremely high value at t= 0+μs for the H100-D20 sequence at threshold, in which peak initial inward current (proportional to stimulator output) is −15 852 μA cm−2; in contrast, −1891 μA cm−2 is adequate with the H100-D80 sequence. Thus if 50 % of the magnetic stimulator output were required to elicit a threshold response with the H100-D20 pulse, only a 2-fold increase would be possible from the apparatus and, therefore, supramaximal excitation by H100-D20 might be impossible, requiring an output exceeding the upper limit on the dial. However, when using the H100-D80 waveform, threshold would be reached with one-eighth of the stimulator output required for the H100-D20 sequence.
Why is excitation greatest with the hyperpolarizing (quarter-cycle)-depolarizing (half-cycle) sequence?
A possible explanation is that the reversal of Na+ inactivation by the initial hyperpolarization results in an increased fraction of Na+ channels available for the subsequent depolarizing phase. When the giant squid axon was hyperpolarized by a 10 ms square wave pulse, nearly complete reversal of Na+ inactivation occurred (Hodgkin & Huxley, 1952). However, in a simulation model, Grill & Mortimer (1995; their Fig. 7) detected no effect on threshold after a brief 200 μs hyperpolarization of nodal membrane. In the still briefer initial hyperpolarizing phase used in our in vitro experiments (78 μs) and simulations (85 μs), even less reversal of Na+ inactivation would be expected. To determine if a brief initial hyperpolarization could diminish Na+ inactivation, a further simulation was performed comparing threshold activation by a half-cycle 80 % depolarization with and without an initial quarter-cycle 100 % hyperpolarization (Fig. 10, bottom two waveforms). The initial hyperpolarization reduced the threshold by approximately 2.6 % and reduced the required outward charge transfer by only 3.5 %. (Paradoxically, the H100-D20 sequence elicited excitation with the smallest outward charge transfer probably because of the extraordinary amplitude of the hyperpolarizing phase, cited above.)
Alternatively, the greater duration of the depolarizing half-cycle phase could explain the increased efficacy of this sequence if the outward charge transfer was significantly increased. The depolarizing outward charge transfer is calculated by integrating the outward current between the start of the depolarizing phase and the initiation of the action potential. Classically, the strength-duration relationship implies that with pulses briefer than the rheobase, an increased pulse duration requires a smaller current intensity for excitation (Katz, 1939). In Fig. 10, the time of initiation of the action potential is used to define the end of an applied pulse required for excitation; the duration of the outward current pulse generating the action potential at threshold for H100-D80 is 140 μs compared with 80 μs for D100-H80. Quantitatively, the longer duration of the depolarizing phase and greater integrated outward charge transfer accounts for most of the 11 % reduction in stimulator output threshold, ((2099-1891)/1891) × 100 %, when comparing H100-D80 with D100-H80. Reversal of Na+ inactivation by a brief initial hyperpolarization is relatively unimportant.
Relationship between pulse sequence and outward charge transfer
The H100-D80 sequence elicits the most powerful excitation largely through maximizing, for a given dial setting, the outward charge transfer (Fig. 10). However, the D80 depolarizing half-cycle does not have as fast a rise time as the initial D100 quarter-cycle. Classically, the faster the rise time of a depolarizing current, the lower the threshold for excitation (Katz, 1939). Thus the fast rising D100-H20, H35 and H80 sequences excite with less outward charge transfer than the H100-D80 sequence, which, however, excites at a lower dial setting.
It might be expected that further increasing the quarter-cycle duration and corresponding outward charge transfer would further increase excitation. Induced pulse duration can be lengthened either by increasing the stimulator capacitance or increasing the coil inductance (Barker et al. 1991; Panizza et al. 1992). However, such hardware manipulations result in diminished amplitude of the induced pulse. Barker et al. (1991) showed that the slower the rise time of the magnetic field, the longer the induced monophasic pulse duration, but excitation required greater stored energy.
Simulation also dispels the notion that the least outward charge transfer required for excitation is sufficient to define stimulator utility. For example, although the H100-D20 waveform excites with the least outward charge transfer, excitation cannot practically be achieved. As cited above, a stimulator that excites at the lowest dial setting has the greatest capability for supramaximal stimulation. It may be more useful to normalize outward charge transfer by the required stimulator output. Combining the two into a measure of efficiency by dividing outward charge transfer at threshold by the corresponding peak current at t= 0+μs (× 100), yields values of 4.9 for D100-H80, D100-H35 and D100-H20, the smallest values of 0.5 for H100-D20 and 2.2 for H100-D35, and the largest value of 7.6 for H100-D80. The advantage of the initial fast-rising depolarization with D100-H80 is more than offset by the greater depolarizing charge transfer with H100-D80.
The pull-down phenomenon at low temperatures
The in vitro data at lower temperatures (e.g. below 25°C) also reveal a progressively decreasing activation when the initial depolarizing phase (quarter-cycle) is followed by progressively increasing hyperpolarizing phases. This pull-down phenomenon is observed at the spatial derivative site (Fig. 2), at a bend (Fig. 3), and at a cut nerve ending (Fig. 4). However, pull-down is prevented when the bath temperature approaches 37°C, in normal human studies, and in the simulation experiments at 37°C. Possibly, the lower temperature of the bath in the in vitro experiments is far enough below mammalian body temperature to delay the generation of the action potential sufficiently for the subsequent hyperpolarization to halt the process. The slight increase in onset latency (approximately 270 μs) in Fig. 2 comparing D100-H80 with D100-H20 corresponds to a conduction distance of 7.7 mm (at a CV of 28.6 m s−1). This distance is too brief to reflect activation at a distant negative derivative site, but could reflect the delay that results in pull-down.
Observations related to the pull-down phenomenon were previously reported by van den Honert & Mortimer (1979) and Reilly et al. (1985) using rectangular electrical depolarizing pulses followed by hyperpolarizing pulses; or magnetically induced rectangular pulses with a trapezoidal coil current (Reilly, 1989; Hiwaki & Ueno, 1991). These studies revealed that for pulse durations less than the nerve time constant, thresholds were elevated above that of a single monophasic rectangular pulse, if there was little or no time delay between the end of the depolarizing and the onset of the subsequent hyperpolarizing rectangular pulses.
Inhomogeneous volume conductors and clinical correlation
Sites of excitation
A surprising finding in both the glass tube preparation and the thenar recordings is that the largest responses were elicited by both directions of polyphasic current. It is most likely that excitation was elicited by hyperpolarizing- depolarizing sequences on either side of the glass tubes, and at both the proximal and distal median nerve excitation sites in the forearm. In the glass tube experiment, the distance between sites a and b was estimated to be 6.8 mm, obtained from the 270 μs shift in onset latency comparing monophasic pulses in both directions. Significantly, reversing polyphasic pulse direction yielded differences in peak response latency of 310 μs (Fig. 5), consistent with an initial depolarization occurring on the side closer to the recording electrodes (response III) vs. the further side (response VI); furthermore, the durations of the negative phases are also prolonged. The prolongation may be explained by a combination of (i) marked pull-down with the D100-H80 sequence at site b, i.e. the initial excitation at site b would be reduced by the H80 phase, and thus (ii) impulses excited by H100-D80 on the further side (site a) reach the recording electrodes without significant collision. The onset latencies of the roughly equal amplitude responses to both polyphasic pulses are nearly identical, possibly because response VI arises at site b after a quarter-cycle hyperpolarization delay (the earlier initiated response at further site a is suppressed by pull-down and collides with the more powerful response arising at site b), and response III is also initiated first at site b.
The findings with the thenar preparation are similar, but cannot be attributed to pull-down, which is much less evident than with the glass tube preparation, presumably because the median nerve is at a higher temperature. The thenar responses to monophasic stimuli are significantly reduced when current is directed towards rather than away from the recording electrodes (Fig. 8); therefore, the identical initial depolarizing phase of a polyphasic pulse would be expected to produce a similarly weaker excitation at the same site. It is most likely that in response III, some impulses initiated at the proximal median nerve excitation site by the polyphasic H100-D80 sequence escape collision with impulses initiated at the distal excitation site by D100-H80. Moreover, the duration of the negative phase of response III is increased approximately by 280 μs compared with response VI (cf. right vertical arrows in traces III and VI; Fig. 8). This is approximately the same conduction time from the further site (290 μs) obtained by reversing the direction of monophasic current (compare responses I and II with IV and V). By contrast, in response VI the impulses arising at the proximal median nerve site elicited by D100-H80 would be expected to collide with impulses arising at the distal site elicited by H100-D80.
Distance between excitation sites in thenar recordings
Note that unlike in Fig. 8, thenar responses in some of our other subjects show a larger response when monophasic current is directed towards instead of away from the recording electrodes. Moreover, the calculated distance of 17.4 mm between excitation sites falls well short of the 40 mm expected separation at threshold and the 26–36 mm separation seen previously with the same MC at suprathreshold intensity in vitro (Maccabee et al. 1993a; cf. Nilsson et al. 1992). Possible factors that may account for the above discrepancy include: (i) suprathreshold stimuli excite over regions instead of only at peak spatial derivatives (Roth & Basser, 1990); (ii) a special case of excitation by a second, closer virtual cathode and anode pair, which may occur when the coil and nerve are in close proximity (Basser, 1994); (iii) the lessening depth of the median nerve as it approaches the wrist; the larger thenar response to distally directed induced current observed in some subjects may be explained by the increasing proximity of the median nerve to the volar surface; (iv) when the median nerve is deeper in the forearm more proximally, it would be expected that any excitation by proximally directed induced current would occur more distally than if the nerve lay at uniform depth; and (v) where the tendons cover the distal median nerve, the conductance may be diminished compared with muscle covering the more proximal median nerve that would increase relatively the efficacy of proximal excitation (Kobayashi et al. 1997).
Primary and secondary sources
Applying to the glass tube preparation and possibly to the thenar recordings is the notion of primary and secondary sources in neuromagnetic stimulation (Roth et al. 1990; Tofts, 1990; Nagarajan & Durand, 1996). The primary source corresponds to the classical negative-going spatial derivative of the induced electric field. The secondary source arises from separated charges accumulating at inhomogeneties within the nerve bundle or at the surface of bone adjacent to nerve. Nevertheless, excitation still occurs at or near the peak of the measured spatial derivative sites along the axis of the nerve (Maccabee et al. 1993a; their Fig. 5, right) because the field measurement is the sum of the primary and secondary sources.
Broader implications
A magnetic stimulator generating induced fields with the configurations illustrated above has general properties. For example, induced polyphasic pulses of either polarity elicit the largest thenar responses to median nerve stimulation and when stimulating motor or sensory nerve roots at the cervical spine and motor roots at distal cauda equina (Maccabee et al. 1993b, 1996a). Moreover, in the proximal cauda equina of normal subjects, an induced monophasic pulse is effective only when directed caudo-rostrally. As expected, a polyphasic pulse whose induced second phase is directed caudo-rostrally elicits the largest amplitude response (Fig. 6 in Maccabee et al. 1996a). Similarly, polyphasic pulses applied over motor cortex elicit larger motor responses than monophasic pulses of either polarity (as inferred by Claus et al. (1990) using different stimulators), although the set of fibres excited are not necessarily identical.
Another application of the polyphasic pulse is suggested by the pull-down phenomenon. Although pull-down is virtually absent normally in human median nerve at normal temperatures, this need not be true in patients with axonal dysfunction in the peripheral nervous system, or when the excitation site is definable in the central nervous system. A pathological slowing of sodium channel activation too small to result in a detectable increase in response latency might be manifest by a significant pull-down with the D100-H35 versus the D100-H20 sequence.
While the MES-10 stimulator in its usual configuration induces only a damped polyphasic electric field in the volume conductor, other commercially available single-pulse stimulators induce predominantly monophasic fields. Monophasic pulses delivered by a round coil centred on the vertex more clearly differentiate excitation of left versus right motor cortex (Barker et al. 1987), and may critically distinguish excitation at a bend or nerve ending based on which direction of induced current is effective. However, the increasing use of repetitive magnetic stimulation further modifies the induced waveform. For technical reasons, all new repetitive stimulators available so far induce a cosine-shaped half-cycle preceded and followed by quarter-cycles of opposite polarity. The greater charge transfer of a half-cycle depolarization suggests that the current direction of the induced polyphasic pulse may become a significant factor in repetitive transcranial stimulation.
Acknowledgments
The authors wish to thank Ms Helen R. Watson and Ms Mary E. Lombardo for their secretarial assistance and Dr Giuseppe Condemi and Mr Bruce Hundley for providing dissected porcine phrenic nerves (supported by NIH grants HL20864 and HD28931, Dr Phyllis M. Gootman, Principal Investigator). We also thank Dr John Cadwell for his suggestions and ideas relating to computer simulation studies performed in this manuscript.
References
- Amassian VE, Eberle LP, Maccabee PJ, Cracco RQ. Modeling magnetic coil excitation in human cerebral cortex with a peripheral nerve immersed in a brain-shaped volume conductor: the significance of fiber bending in excitation. Electroencephalography and Clinical Neurophysiology. 1992;85:291–301. doi: 10.1016/0168-5597(92)90105-k. 10.1016/0168-5597(92)90105-K. [DOI] [PubMed] [Google Scholar]
- Barker AT, Freeston IL, Jalinous R, Jarratt JA. Magnetic stimulation of the human brain and peripheral nervous system: an introduction and the results of an initial clinical evaluation. Neurosurgery. 1987;20:100–109. doi: 10.1097/00006123-198701000-00024. [DOI] [PubMed] [Google Scholar]
- Barker AT, Garnham CW, Freeston IL. Magnetic nerve stimulation: the effect of waveform on efficiency, determination of neural membrane time constants and the measurement of stimulator output. In: Levy WJ, Cracco RQ, Barker AT, Rothwell J, editors. Magnetic Motor Stimulation: Basic Principles and Clinical Experience. Electroencephalography and Clinical Neurophysiology. suppl. Vol. 43. B.V.: Elsevier Science Publishers; 1991. pp. 227–237. [PubMed] [Google Scholar]
- Basser PJ. Focal magnetic stimulation of an axon. IEEE Transactions on Biomedical Engineering. 1994;41:601–606. doi: 10.1109/10.293248. [DOI] [PubMed] [Google Scholar]
- Basser PJ, Roth B. Stimulation of a myelinated axon by electromagnetic induction. Medical and Biological Engineering and Computing. 1991;29:261–268. doi: 10.1007/BF02446708. [DOI] [PubMed] [Google Scholar]
- Cadwell J. Optimizing magnetic stimulator design. In: Levy WJ, Cracco RQ, Barker AT, Rothwell J, editors. Magnetic Motor Stimulation: Basic Principles and Clinical Experience. Electroencephalography and Clinical Neurophysiology. suppl. Vol. 43. 1991. pp. 238–248. [PubMed] [Google Scholar]
- Claus D, Murray NMF, Spitzer A, Flugel D. The influence of stimulus type on the magnetic excitation of nerve structures. Electroencephalography and Clinical Neurophysiology. 1990;75:342–349. doi: 10.1016/0013-4694(90)90112-w. [DOI] [PubMed] [Google Scholar]
- Durand D, Ferguson AS, Dalbasti T. Induced electric fields by magnetic stimulation in non-homogeneous conducting media. Proceedings of the IEEE Engineering, Medicine and Biology Society. 1989;11:1252–1253. [Google Scholar]
- Grill WM, Mortimer JT. Stimulus waveforms for selective neural stimulation. IEEE Engineering in Medicine and Biology Magazine. 1995;14:375–385. 10.1109/51.395310. [Google Scholar]
- Hines M. A program for simulation of nerve equations with branching geometries. International Journal for Biomedical Computing. 1989;24:55–68. doi: 10.1016/0020-7101(89)90007-x. [DOI] [PubMed] [Google Scholar]
- Hiwaki O, Ueno S. Experimental and modelling studies on properties of nerve excitation elicited by magnetic stimulation. Proceedings of the IEEE Engineering, Medicine and Biology Society. 1991;13:853–854. [Google Scholar]
- Hodgkin AL, Huxley AF. The dual effect of membrane potential on sodium conductance in the giant axon of Loligo. The Journal of Physiology. 1952;116:497–506. doi: 10.1113/jphysiol.1952.sp004719. [DOI] [PMC free article] [PubMed] [Google Scholar]
- Katz B. Electric Excitation of Nerve. London: Oxford University Press; 1939. [Google Scholar]
- Kobayashi M, Ueno S, Kurokawa T. Importance of soft tissue inhomogeneity in magnetic peripheral nerve stimulation. Electroencephalography and Clinical Neurophysiology. 1997;105:406–413. doi: 10.1016/s0924-980x(97)00035-0. 10.1016/S0924-980X(97)00035-0. [DOI] [PubMed] [Google Scholar]
- Maccabee PJ, Amassian VE, Eberle LP, Cracco RQ. Magnetic coil stimulation of straight and bent amphibian and mammalian peripheral nerve in vitro: locus of excitation. The Journal of Physiology. 1993a;460:201–219. doi: 10.1113/jphysiol.1993.sp019467. [DOI] [PMC free article] [PubMed] [Google Scholar]
- Maccabee PJ, Amassian VE, Eberle LP, Rudell AP, Cracco RQ, Lai KS, Somasundaram M. Measurement of the electric field induced into inhomogeneous volume conductors by magnetic coils: application to human spinal neurogeometry. Electroencephalography and Clinical Neurophysiology. 1991;81:224–237. doi: 10.1016/0168-5597(91)90076-a. 10.1016/0168-5597(91)90076-A. [DOI] [PubMed] [Google Scholar]
- Maccabee PJ, Eberle LP, Amassian VE, Anselmi GD, Tatarian GT, Lipitz ME, Rozen T, Cracco RQ. Optimal polarity sequence for exciting peripheral nerve and spinal roots. Neurology. 1993b;43:A288. (abstract) [Google Scholar]
- Maccabee PJ, Lipitz ME, Desudchit T, Golub RW, Nitti VW, Bania JP, Willer JA, Cracco RQ, Cadwell J, Hotson GC, Eberle LP, Amassian VE. A new method using neuromagnetic stimulation to measure conduction time within the cauda equina. Electroencephalography and Clinical Neurophysiology. 1996a;101:153–166. doi: 10.1016/0924-980x(95)00264-l. 10.1016/0924-980X(95)00264-L. [DOI] [PubMed] [Google Scholar]
- Maccabee PJ, Nagarajan SS, Amassian VE, Durand DM, Eberle LP, Cracco RQ, Lai HS. Optimal waveform polarity and sequence for neuromagnetic excitation of peripheral nerve: in vitro and simulation study. Society for Neuroscience Abstracts. 1996b;22:62. [Google Scholar]
- McRobbie D, Foster MA. Thresholds for biological effects of time-varying magnetic fields. Clinical Physics and Physiological Measurement. 1984;5:67–78. doi: 10.1088/0143-0815/5/2/002. 10.1088/0143-0815/5/2/002. [DOI] [PubMed] [Google Scholar]
- Nagarajan SS, Durand D. A generalized cable equation for magnetic stimulation of axons. IEEE Transactions on Biomedical Engineering. 1996;43:1–9. doi: 10.1109/10.486288. 10.1109/10.477696. [DOI] [PubMed] [Google Scholar]
- Nagarajan SS, Durand DM, Warman EN. Effects of induced electric fields on finite neuronal structures: An end effect simulation study. IEEE Transactions on Biomedical Engineering. 1993;40:1175–1188. doi: 10.1109/10.245636. 10.1109/10.245636. [DOI] [PubMed] [Google Scholar]
- Nilsson J, Panizza M, Roth BJ, Basser PJ, Cohen LG, Caruso G, Hallett M. Determining the site of stimulation during magnetic stimulation of a peripheral nerve. Electroencephalography and Clinical Neurophysiology. 1992;85:253–264. doi: 10.1016/0168-5597(92)90114-q. 10.1016/0168-5597(92)90114-Q. [DOI] [PubMed] [Google Scholar]
- Panizza M, Nilsson J, Roth BJ, Basser PJ, Hallett M. Relevance of stimulus duration for activation of motor and sensory fibers: Implications for the study of H-reflexes and magnetic stimulation. Electroencephalography and Clinical Neurophysiology. 1992;85:22–29. doi: 10.1016/0168-5597(92)90097-u. 10.1016/0168-5597(92)90097-U. [DOI] [PubMed] [Google Scholar]
- Polson MJR, Barker AT, Freeston IL. Stimulation of nerve trunks with time-varying magnetic fields. Medical and Biological Engineering and Computing. 1982;20:243–244. doi: 10.1007/BF02441362. [DOI] [PubMed] [Google Scholar]
- Reilly JP. Peripheral nerve stimulation by induced electric currents: exposure to time-varying magnetic fields. Medical and Biological Engineering and Computing. 1989;27:101–110. doi: 10.1007/BF02446217. [DOI] [PubMed] [Google Scholar]
- Reilly JP, Freeman VT, Larkin WT. IEEE Transactions on Biomedical Engineering. 1985;32:1001–1011. doi: 10.1109/TBME.1985.325509. [DOI] [PubMed] [Google Scholar]
- Roth BJ, Basser P. Model of the stimulation of a nerve fiber by electromagnetic induction. IEEE Transactions on Biomedical Engineering. 1990;37:588–597. doi: 10.1109/10.55662. 10.1109/10.55662. [DOI] [PubMed] [Google Scholar]
- Roth BJ, Cohen LG, Hallett M, Friauf W, Basser PJ. A theoretical calculation of the electrical field induced by magnetic stimulation of a peripheral nerve. Muscle and Nerve. 1990;13:734–741. doi: 10.1002/mus.880130812. [DOI] [PubMed] [Google Scholar]
- Tofts PS. The distribution of induced currents in magnetic stimulation of nervous system. Physics in Medicine and Biology. 1990;35:1119–1128. doi: 10.1088/0031-9155/35/8/008. 10.1088/0031-9155/35/8/008. [DOI] [PubMed] [Google Scholar]
- van den Honert C, Mortimer JT. The response of the myelinated nerve fiber to short duration biphasic stimulating currents. Annals of Biomedical Engineering. 1979;7:117–125. doi: 10.1007/BF02363130. [DOI] [PubMed] [Google Scholar]
- Wada S, Kubota H, Maita S, Yamamoto I, Yamaguchi M, Andoh T, Kawakami T, Okumura F, Takenaka T. Effects of stimulus waveform on magnetic stimulation. Japanese Journal of Applied Physics. 1996;35:1983–1988. 10.1143/JJAP.35.1983. [Google Scholar]
- Warman EN, Grill WM, Durand D. Modeling the effects of electric fields on nerve fibers: Determination of elicitation thresholds. IEEE Transactions on Biomedical Engineering. 1992;39:12. doi: 10.1109/10.184700. [DOI] [PubMed] [Google Scholar]


