

Abstract
The present study examined whether the blood flow to exercising muscles becomes reduced when cardiac output and systemic vascular conductance decline with dehydration during prolonged exercise in the heat. A secondary aim was to determine whether the upward drift in oxygen consumption (V̇O2) during prolonged exercise is confined to the active muscles.
Seven euhydrated, endurance-trained cyclists performed two bicycle exercise trials in the heat (35 °C; 40–50% relative humidity; 61 ± 2% of maximal V̇O2), separated by 1 week. During the first trial (dehydration trial, DE), they bicycled until volitional exhaustion (135 ± 4 min, mean ± s.e.m.), while developing progressive dehydration and hyperthermia (3.9 ± 0.3% body weight loss; 39.7 ± 0.2 °C oesophageal temperature, Toes). In the second trial (control trial), they bicycled for the same period of time while maintaining euhydration by ingesting fluids and stabilizing Toes at 38.2 ± 0.1 °C after 30 min exercise.
In both trials, cardiac output, leg blood flow (LBF), vascular conductance and V̇O2 were similar after 20 min exercise. During the 20 min-exhaustion period of DE, cardiac output, LBF and systemic vascular conductance declined significantly (8–14%; P < 0.05) yet muscle vascular conductance was unaltered. In contrast, during the same period of control, all these cardiovascular variables tended to increase. After 135 ± 4 min of DE, the 2.0 ± 0.6 l min−1 lower blood flow to the exercising legs accounted for approximately two-thirds of the reduction in cardiac output. Blood flow to the skin also declined markedly as forearm blood flow was 39 ± 8% (P < 0.05) lower in DE vs. control after 135 ± 4 min.
In both trials, whole body V̇O2 and leg V̇O2 increased in parallel and were similar throughout exercise. The reduced leg blood flow in DE was accompanied by an even greater increase in femoral arterial-venous O2 (a-vO2) difference.
It is concluded that blood flow to the exercising muscles declines significantly with dehydration, due to a lowering in perfusion pressure and systemic blood flow rather than increased vasoconstriction. Furthermore, the progressive increase in oxygen consumption during exercise is confined to the exercising skeletal muscles.
The combination of exercise and environmental heat stress is believed to result in competition between the exercising skeletal muscle and the skin compartments for the available blood flow (Rowell, 1974, 1983, 1986; Nielsen et al. 1990). The prevailing hypothesis has been that during exercise with heat stress, blood flow to the active skeletal muscle would be reduced at the expense of the elevated skin blood flow (Rowell, 1974, 1983, 1986; Johnson & Rowell, 1975). Arguing against this proposal, previous studies in humans (Kirwan et al. 1987; Savard, 1988; Nielsen et al. 1990, 1993, 1997), rats (Laughlin & Armstrong, 1983) and miniature swine (Armstrong et al. 1987; McKirnan et al. 1989) have shown that blood flow to active skeletal muscles is either maintained or increased when heat stress is superimposed during exercise. In previous human studies, the cardiovascular system responded adequately to the additional demand of an elevated skin blood flow by increasing cardiac output (1–3 l min−1) and possibly reducing visceral blood flow (Savard et al. 1988; Nielsen et al. 1990, 1993, 1997). Further support for unaltered muscle perfusion in these previous studies was found in the observations that femoral arterial-venous O2 (a-vO2) difference, leg oxygen consumption (V̇O2) and lactate release were unchanged. These previous results, however, are in contrast to the significant reductions in blood flow to some exercising muscles found in sheep with heat stress and reduced cardiac output (Bell et al. 1983). One possibility for the discrepancy might be that systemic blood flow has to be impaired for muscle blood flow to decline.
In a previous study during exercise in the heat, progressive dehydration and concomitant hyperthermia were found to cause marked reductions in cardiac output (i.e. 3–4 l min−1) and smaller, but significant, reductions in mean arterial pressure (González-Alonso et al. 1995). With reduced cardiac output, skin blood flow declined significantly despite marked hyperthermia (González-Alonso et al. 1995). This reduced skin blood flow, however, only accounted for approximately one-third of the decline in cardiac output, indicating that blood flow to other tissues and organs also declines. It therefore seems likely that active skeletal muscle, as the major tissue receiving blood flow during exercise, becomes the main target of these dehydration-induced reductions in peripheral blood flow.
Another important question is whether dehydration and hyperthermia would compromise O2 delivery and O2 utilization by the active skeletal muscle during prolonged exercise. It is well documented that pulmonary V̇O2 continues to increase during moderately intense prolonged exercise (Gaesser & Pool, 1996). Evidence suggests that increases in whole body V̇O2 during submaximal cycling exercise correspond closely with increases in leg V̇O2 (Ahlborg et al. 1974; Poole et al. 1991, 1992). The progressive increase in leg V̇O2 in euhydrated subjects was related to increased O2 extraction and leg blood flow (Poole et al. 1991).
Therefore, the aim of this study was to determine whether blood flow to the exercising skeletal muscles becomes reduced and leg oxygen uptake compromised when cardiac output and blood pressure decline with dehydration during prolonged exercise in the heat.
METHODS
Subjects
Seven healthy endurance-trained males participated in this study. They had a mean (±s.d.) age, body weight, height, maximal heart rate and maximal V̇O2 (V̇O2,max) of 27 ± 2 years, 78.1 ± 7.4 kg, 184 ± 7 cm, 197 ± 11 beats min−1 and 4.9 ± 0.6 l min−1, respectively. The subjects were fully informed of any risks and discomforts associated with the experiments before giving their informed written consent to participate. The study conforms to the code of Ethics of the World Medical Association (Declaration of Helsinki) and was approved by the Ethics Committee of Copenhagen and Frederiksberg communities. All subjects had participated in experiments involving endurance performance in hot environments before undergoing this experiment. Furthermore, subjects acclimated to the heat and adapted to large volumes of fluid ingestion before the experimental trials by performing four practice trials (2 h cycling exercise at ∼60%V̇O2,max in a 35°C environment).
Experimental design
On two different occasions separated by 1 week, subjects exercised continuously on a cycle ergometer (Monark 829E) in the heat (35°C, 40–50% relative humidity, 1–2 m s−1 fan speed) at a power output (208 ± 21 W, 80–90 r.p.m.) that initially elicited 61 ± 2%V̇O2,max. On the first trial (dehydration trial, DE), they bicycled until volitional exhaustion (135 ± 4 min (±s.e.m.)), while developing significant dehydration and hyperthermia (3.9 ± 0.3% body weight loss, 39.7 ± 0.2°C oesophageal temperature, Toes). On the second trial (control), they bicycled for the same period of time while maintaining euhydration by taking in fluid and stabilizing oesophageal temperature at 38.2°C after 30 min exercise. During DE, subjects received only ∼0.8 l of fluid as 0.2 l of concentrated carbohydrate-electrolyte solution by mouth and ∼0.6 l of saline solution (0.9% NaCl) intravenously infused during the leg blood flow measurements. In so doing, they replaced 28% of the sweat losses and lost 3.07 ± 0.28 kg or 3.9 ± 0.3% of their body weight. During control, subjects received ∼4.3 l of fluid as 3.7 ± 0.1 l of diluted carbohydrate-electrolyte solution by mouth and ∼0.6 l of intravenously infused saline. This resulted in the complete maintenance of body weight. The same amount of carbohydrate and electrolytes was ingested in each trial (i.e. 99 g glucose and 1 g each of Na+, Cl− and K+). During control, the 3.7 l of carbohydrate-electrolyte solution was ingested in equal volumes at 20, 35, 50, 65, 80, 95 and 110 min of exercise. During DE, the 0.2 l of carbohydrate-electrolyte solution was ingested at 30, 60 and 90 min of exercise. The temperature of the oral fluid replacement was ∼38°C to minimize fluctuations in core temperature.
On the day prior to experimental testing, the hydration status of the subjects was standardized by having them adopt the same diet, exercise (1 h of low intensity cycling) and fluid intake regimen. The subjects reported to the laboratory approximately 3–4 h prior to the experiment, following the ingestion of a plentiful breakfast and 200–300 ml of fluid. Upon arrival, they rested in the supine position while 2 catheters were inserted, using the Seldinger technique, one in the femoral vein and another in the femoral artery of the right leg. Both catheters were positioned 1–2 cm proximal or distal from the inguinal ligament. A thermistor to measure venous blood temperature was inserted through the venous catheter (see leg blood flow section for further details).
After about 1 h of rest in the supine position, the subjects walked to another room, were weighed and sat in armchair while electrodes to measure 3-lead electrocardiogram were attached. Equipment for measuring forearm blood flow and skin blood flow was attached to the left forearm. After 15 min of seated rest, 10 ml blood samples were withdrawn simultaneously from the femoral artery and femoral vein for later determination of baseline blood variables. The subjects then entered a controlled-environment chamber (35°C, 40–50% relative humidity) and sat on a bicycle ergometer while resting cardiovascular measurements were obtained. They then started to exercise.
During exercise, heart rate, blood pressure, skin blood flow and oesophageal temperature were recorded continuously. Pulmonary V̇O2 was measured over a 5 min period beginning at 5, 40, 80, 105 and 125–135 min of exercise and during each determination of cardiac output. Cardiac output was measured in triplicate over a 10 min period following the V̇O2 measurement. Leg blood flow was measured in duplicate at 20, 50, 90, 120 and 135 ± 4 min of exercise. Forearm blood flow was measured 8–10 times over a 5 min period starting at 20, 50, 90, 120 and 135 ± 4 min of exercise. Arterial and venous blood samples (10 ml) were withdrawn simultaneously at 20, 60, 90, 120 and 135 ± 4 min of exercise. Upon completion of the exercise, catheters were removed and post-exercise naked body weight was recorded.
Oxygen consumption and cardiac output
Pulmonary V̇O2 was measured on-line with a Medgraphics CPX/D metabolic cart (Saint Paul, Minneapolis, MN, USA). Cardiac output was determined using the CPX/D computerized version of the CO2 rebreathing technique of Collier (1956) and adjusted for arterial haemoglobin concentration, arterial PO2 and arterial oxygen saturation (Sa,O2). Heart rate was obtained either from the continuously recorded electrocardiogram signal or from the record obtained with a PE 3000 Sports Tester (Polar Electro, Finland).
Blood pressure
Blood pressure was continuously monitored from the femoral artery by a transducer (Millar Instruments, Houston, TX, USA) placed in the inguinal region (40–60 cm below the heart). Systolic and diastolic blood pressures were computed as the maximum and the minimum values, respectively, of each pressure curve. Mean arterial blood pressure (MABP) was computed by integration of each pressure curve. Ten minute rolling averages of these variables were calculated (MacLab Chart v. 3.5/s software). Systemic vascular conductance was calculated as the quotient between the mean cardiac output and MABP and expressed as conductance units of l min−1 mmHg−1.
Leg blood flow
Femoral venous blood flow (i.e. leg blood flow) was determined by the constant infusion thermodilution technique described by Andersen & Saltin (1985). Both venous blood and infusate temperatures were measured continuously during saline infusion (20 s, 112 ml min−1; Harvard pump, Harvard Apparatus, Millis, MA, USA) via thermistors connected to a custom-made electronic box. The electronic box was interfaced to a computer (Macintosh Performa) using a data acquisition system (MacLab 8:s, ADInstruments, Sydney, Australia). Venous blood temperature was measured with a thermistor (model 94-030-2.5Fr T. D. Probe, Edwards Edslab, Baxter, Irvine, CA, USA) inserted, via the femoral venous catheter, below the inguinal ligament in the proximal direction. The thermistor probe was positioned 10 cm beyond the tip of the 8 cm catheter (7-Fr diameter, Cook, Denmark), which was perforated with 4 side-holes to facilitate infusate dispersion. Infusate temperature (2–3°C) was measured with a flow-through housing (model 93-505, Edslab) at the site where the infusate entered the venous catheter. Infusate temperature was corrected for the 0.6°C increase which occurs as the infusate travels from the measuring point to the tip of the catheter. At rest, infusate temperature was corrected by 1.0°C. Leg blood flow (LBF, expressed in ml min−1) was calculated according to the following formula, derived from a heat balance equation (Ganz & Swan, 1974; Andersen & Saltin, 1985):
where VI is infusate volume (in ml min−1), TB is temperature of the blood before saline infusion (in°C), TI is temperature of the infusate, TM is temperature of the blood-saline mixture during steady state (after 5 s infusion). SI and SB are the specific gravities of infusate and blood, respectively (1.005 and 1.045 g cm−3, respectively). CI and CB are the specific heats of infusate and blood, respectively (0.997 and 0.86 cal g−1°C−1, respectively). In this study, leg blood flow values represent the mean of 2 measurements.
Forearm and skin blood flows
Forearm blood flow was measured using venous occlusion plethysmography with a mercury-in-Silastic strain gauge (Whitney, 1953) as previously reported (Montain & Coyle, 1992; González-Alonso et al. 1995). Forearm blood flow values represent the mean of 8–10 single measurements. Skin blood flow was measured using a laser Doppler flowmeter (PF2B, Perimed, Stockholm). The laser Doppler probe was placed on the left forearm on the dorsal side, separated ∼2 cm from the plethysmographic strain gauge. Skin blood flow analysis was restricted to the data obtained immediately before the forearm blood flow measurement, when the forearm was placed in a standardized position. Forearm vascular conductance was calculated as the quotient between forearm blood flow and MABP and expressed as conductance units of ml (100 g)−1 min−1 mmHg−1. Cutaneous vascular conductance was calculated as the quotient between skin blood flow and MABP. All on-line physiological data (i.e. blood pressure, LBF, skin blood flow, forearm blood flow) were recorded at 100 Hz, using MacLab/8 s (ADInstruments, Australia) data acquisition system.
Blood analysis
Haematocrit was measured in triplicate after microcentrifugation and corrected for trapped plasma (0.98). Haemoglobin concentration and blood O2 saturation were determined spectrophotometrically (OSM-2 Hemoximeter, Radiometer, Copenhagen, Denmark). PO2, PCO2 and pH were determined using the Astrup technique (ABL30, Radiometer) and corrected for measured blood temperature, whereas [HCO3−] was calculated (Siggaard-Andersen, 1974). Total plasma protein concentration was determined by the biuret reaction (Boehringer kit). Plasma potassium concentration was measured using a flame photometer (Radiometer FLM3, Radiometer). Plasma noradrenaline and adrenaline concentrations were determined using a radio-enzymatic assay (Christiansen et al. 1980).
Calculations
The percentage change in blood volume and plasma volume was calculated using the equations of Dill & Costill (1974). Two-legged blood flow was calculated by multiplying leg blood flow by two. Blood flow to non-exercising tissues was calculated by subtracting 2-legged blood flow from cardiac output. Vascular conductance in non-exercising tissues was calculated by subtracting 2-legged vascular conductance from systemic vascular conductance. Leg O2 uptake (leg V̇O2) was calculated by multiplying the mean leg blood flow by the difference in concentrations of O2 between the femoral artery and vein. Two-legged V̇O2 was calculated by multiplying V̇O2 by two. Leg O2 delivery was calculated by multiplying the mean leg blood flow by femoral arterial O2 content. V̇O2 in non-exercising tissues was calculated by subtracting 2-legged V̇O2 from pulmonary V̇O2.
Statistical analysis
A 2-way (trial-by-time) repeated measures analysis of variance (ANOVA) was performed to test significance between and within treatments. Following a significant F test, pair-wise differences were identified using Tukey's honestly significant difference (HSD) post hoc procedure. When appropriate, significant differences were also identified using Student's paired t tests. The significance level was set at P < 0.05. Data are presented as means ±s.e.m. unless otherwise indicated.
RESULTS
Hydration status
Hydration was similar prior to both trials as indicated by similar body weights (mean range between trials, 78.5–78.8 (± 2.8) kg), plasma osmolality, plasma proteins, and arterial and femoral venous haemoglobin concentration (mean range between trials, 141–142 (± 3) g l−1). Between trial differences in hydration only emerged after 30–50 min of exercise and generally became significant after the first hour of exercise. Cardiac output, leg blood flow, skin blood flow and arterial blood pressure were also similar in both trials at rest and during initial phase of exercise (Table 1 and Fig. 1). Furthermore, blood gases, plasma catecholamines, whole body V̇O2 and 2-legged V̇O2 were in the same range.
Table 1.
Cardiovascular and core temperature responses at rest and during prolonged exercise in the heat (35°C) during dehydration and control trials
| Time (min) | V̇O2 (l min−1) | HR (beats min−1) | SV (ml) | SBP (mmHg) | DBP (mmHg) | Toes (°C) |
|---|---|---|---|---|---|---|
| Dehydration trial | ||||||
| Rest | 0.43 ± 0.03 | 74 ± 5 | 88 ± 5 | 139 ± 5 | 79 ± 4 | 37.1 ± 0.2 |
| 20 | 2.85 ± 0.13 | 150 ± 4 | 152 ± 11 | 178 ± 5 | 94 ± 5 | 38.1 ± 0.1 |
| 60 | 2.91 ± 0.13* | 164 ± 5*† | 135 ± 10*† | 176 ± 5 | 92 ± 6 | 38.6 ± 0.1 |
| 90 | 2.96 ± 0.12* | 173 ± 5*† | 124 ± 9*† | 176 ± 5 | 93 ± 5 | 38.9 ± 0.2 |
| 120 | 3.04 ± 0.13* | 180 ± 3*† | 111 ± 6*† | 170 ± 4*† | 90 ± 4† | 39.4 ± 0.2 |
| 135 ± 4 | 3.07 ± 0.14* | 186 ± 4*† | 105 ± 5*† | 168 ± 4*† | 89 ± 4*† | 39.7 ± 0.2 |
| Control trial | ||||||
| Rest | 0.45 ± 0.03 | 73 ± 4 | 93 ± 9 | 136 ± 8 | 80 ± 2 | 37.0 ± 0.1 |
| 20 | 2.88 ± 0.14 | 147 ± 4 | 151 ± 8 | 177 ± 5 | 99 ± 3 | 38.0 ± 0.1 |
| 60 | 2.94 ± 0.13* | 152 ± 4 | 147 ± 8 | 175 ± 5 | 95 ± 4 | 38.2 ± 0.1 |
| 90 | 2.98 ± 0.14* | 155 ± 4* | 148 ± 7 | 175 ± 5 | 96 ± 4 | 38.2 ± 0.1 |
| 120 | 3.02 ± 0.13* | 157 ± 5* | 146 ± 8 | 175 ± 6 | 96 ± 4 | 38.2 ± 0.1 |
| 135 ± 4 | 3.07 ± 0.14* | 158 ± 5* | 145 ± 8 | 176 ± 6 | 96 ± 4 | 38.3 ± 0.1 |
Values are means ±s.e.m. for 7 subjects. V̇O2, oxygen uptake; HR, heart rate; SV, stroke volume; SBP, systolic blood pressure; DBP, diastolic blood pressure; Toes, oesophageal temperature. Blood pressure was measured in the femoral artery and referenced to femoral height.
Significantly different from 20 min value (P < 0.05).
Significantly different from control (P < 0.05).
Figure 1. Cardiac output and blood flows during the dehydration and control trials.
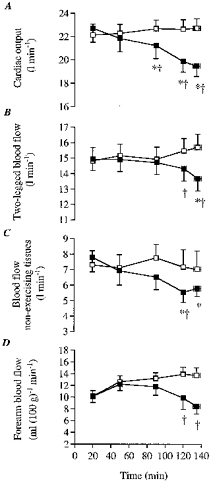
A, cardiac output; B, 2-legged blood flow; C, non-exercising tissue blood flow; D, forearm blood flow. Here and in subsequent figures: ▪, dehydration; □, control. * Significantly lower than 20 min value (P < 0.05). † Significantly lower than control (P < 0.05).
Blood and plasma volumes
Arterial blood and plasma volumes declined progressively during the 20 min-exhaustion period of DE (4–5 ± 1%; P < 0.05) whereas they were elevated by 2–3 ± 1% after the first hour of control and thereafter remained constant. Reflecting these differences in intravascular volume, femoral arterial and venous haematocrit, haemoglobin concentration, osmolality and total plasma protein content increased significantly over time during DE but tended to or declined significantly during control. After the first hour of exercise, all these variables were significantly (P < 0.05) higher during DE compared with control (Table 2). After 135 ± 4 min, arterial haemoglobin concentration was 6–7% higher during DE compared with control (P < 0.05), suggesting that blood volume during DE was reduced by 0.35–0.45 l, due largely to lower plasma volume. Because dehydration resulted in the same increase in [Hb] in both arterial and venous samples, the femoral venous [Hb] to femoral arterial [Hb] ratio was identical at all time points in both trials, oscillating within a very narrow range (i.e. 0.99- 1.00). This suggests that dehydration did not alter the arterial-to-venous blood volume distribution in the leg or the water efflux to tissue.
Table 2.
Femoral blood variables at rest and during prolonged exercise during dehydration and control trials
| pH | PO2 | PCO2 | [HCO3−] | Hct | ||||||
|---|---|---|---|---|---|---|---|---|---|---|
| Time (min) | Arterial | Venous | Arterial (mmHg) | Venous (mmHg) | Arterial (mmHg) | Venous (mmHg) | Arterial (mmol l−1) | Venous (mmol l−1) | Arterial (%) | Venous (%) |
| Dehydration trial | ||||||||||
| Rest | 7.41±0.01 | 7.35±0.01 | 109.1±3.6 | 25.6±1.5 | 37.5±1.2 | 49.5±1.5 | 24.0±0.6 | 27.0±0.7 | 44.6±0.5 | 44.7±0.9 |
| 20 | 7.37±0.01 | 7.26±0.00 | 99.8±3.8 | 13.3±0.3 | 41.4±1.2 | 67.8±2.1 | 23.4±0.7 | 29.3±0.8 | 45.6±0.7 | 46.1±0.9 |
| 60 | 7.39±0.01 | 7.28±0.01 | 101.3±3.2 | 12.1±0.6 | 39.0±1.4 | 65.1±2.2 | 22.9±0.7 | 29.0±0.7 | 45.5±0.9† | 46.3±1.0 |
| 90 | 7.39±0.01 | 7.30±0.02 | 105.8±3.2 | 11.7±0.1 | 38.4±1.6 | 64.7±2.1 | 22.6±0.7 | 29.0±0.7 | 45.6±1.0† | 46.4±0.9 |
| 120 | 7.42±0.02* | 7.31±0.01* | 108.3±3.9* | 10.5±0.8* | 34.1±1.7*† | 59.3±2.0* | 21.6±0.6*† | 28.3±0.5* | 46.2±0.9† | 46.6±0.9† |
| 135 | 7.43±0.01* | 7.32±0.01* | 108.8±6.0* | 10.7±0.9* | 33.7±1.3*† | 58.6±2.0* | 21.3±0.4*† | 27.2±0.9*† | 46.2±0.9† | 46.6±0.9† |
| Control trial | ||||||||||
| Rest | 7.40±0.01 | 7.36±0.01 | 104.6±2.8 | 24.9±2.1 | 38.3±1.1 | 48.4±0.8 | 24.2±0.5 | 27.2±0.4 | 46.7±0.8 | 44.5±0.7 |
| 20 | 7.37±0.01 | 7.27±0.01 | 98.8±1.1 | 13.2±0.5 | 41.5±1.2 | 67.0±1.6 | 23.4±0.7 | 29.1±0.6 | 45.3±0.6 | 45.4±0.5 |
| 60 | 7.39±0.01 | 7.28±0.01 | 103.1±1.7 | 12.7±0.5 | 40.2±1.0 | 65.3±1.6 | 23.0±0.5 | 28.8±0.5 | 44.5±0.6 | 45.2±0.6 |
| 90 | 7.39±0.01 | 7.29±0.01 | 105.6±0.8 | 12.6±0.9 | 39.6±1.2 | 61.8±2.3* | 22.8±0.4 | 28.5±0.6 | 44.1±0.7 | 44.7±0.7 |
| 120 | 7.39±0.01 | 7.29±0.01 | 103.0±1.6 | 12.7±0.9 | 39.6±1.4 | 61.8±2.3* | 23.0±0.5 | 28.7±0.5 | 44.4±0.7 | 45.0±0.7 |
| 135 | 7.39±0.01 | 7.29±0.01 | 102.2±0.8 | 11.4±0.7* | 39.4±1.2* | 61.4±1.5* | 23.3±0.5 | 28.8±0.5 | 44.6±0.8 | 45.3±0.8 |
| Hb | Sa,O2 | Osmolality | Total protein | [K+] | ||||||
|---|---|---|---|---|---|---|---|---|---|---|
| Time (min) | Arterial (g l−1) | Venous (g l−1) | Arterial (%) | Venous (%) | Arterial (mosmol kg−1) | Venous (mosmol kg−1) | Arterial (g l−1) | Venous (g l−1) | Arterial (mmol l−1) | Venous (mmol l−1) |
| Dehydration trial | ||||||||||
| Rest | 141±3 | 141±3 | 97.7±0.2 | 58.0±4.0 | 288±1 | 289±1 | 74±3 | 73±2 | 4.1±0.1 | 4.1±0.1 |
| 20 | 145±3 | 145±3 | 96.8±0.3 | 21.5±1.1 | 291±1 | 295±1 | 77±2 | 77±2 | 4.6±0.1 | 4.6±0.1 |
| 60 | 147±3† | 147±3† | 97.0±0.2 | 19.2±1.2 | 295±1† | 299±1*† | 78±1 | 79±2 | 4.7±0.1 | 4.8±0.1 |
| 90 | 149±3† | 148±3*† | 97.2±0.2 | 18.3±0.6* | 298±1*† | 302±1*† | 80±1 | 81±2 | 4.8±0.1 | 4.9±0.1 |
| 120 | 151±3*† | 149±3*† | 97.4±0.2 | 17.0±1.5* | 300±1*† | 305±1*† | 81±1* | 80±2 | 5.0±0.1* | 5.0±0.1* |
| 135 | 151±3*† | 150±3*† | 97.2±0.3 | 16.8±1.5* | 301±1*† | 308±2*† | 81±1* | 81±2 | 5.2±0.1*† | 5.1±0.0* |
| Control trial | ||||||||||
| Rest | 140±3 | 142±2 | 97.3±0.2 | 58.0±4.0 | 287±2 | 290±1 | 75±2 | 74±2 | 4.0±0.1 | 4.1±0.1 |
| 20 | 144±2 | 144±2 | 96.6±0.2 | 20.0±1.2 | 292±2 | 296±1 | 76±2 | 75±2 | 4.6±0.1 | 4.6±0.1 |
| 60 | 142±2 | 143±2 | 97.2±0.2 | 19.2±0.6 | 289±2 | 290±3* | 76±1 | 76±1 | 4.7±0.1 | 4.7±0.1 |
| 90 | 141±2 | 140±2 | 97.4±0.2 | 19.1±1.5 | 285±1* | 289±3* | 76±2 | 77±2 | 4.7±0.1 | 4.8±0.1 |
| 120 | 142±2 | 140±2 | 97.0±0.2 | 17.9±1.5 | 282±2* | 287±3* | 77±2 | 76±2 | 4.8±0.1 | 4.8±0.1 |
| 135 | 142±2 | 140±2* | 97.0±0.1 | 18.2±1.2 | 283±2* | 287±2* | 77±2 | 78±2 | 4.8±0.1 | 4.8±0.1 |
Values are means ±s.e.m. for 7 subjects. Hct, haemotocrit; Hb, haemoglobin; Sa,O2, oxygen saturation.
Significantly different from 20 min value (P < 0.05).
Significantly different from control (P < 0.05).
Cardiovascular response
Systemic and limb blood flow
During the 20 min-exhaustion period of exercise, cardiac output declined significantly during DE but it tended to increase during control (i.e. 0.6 ± 0.2 l min−1; not significant, n.s.). Thus, after 135 ± 4 min of DE, cardiac output was reduced by 3.3 ± 0.6 l min−1 compared with control (19.4 ± 0.9 vs. 22.7 ± 0.8 l min−1, respectively, P < 0.05; Fig. 1). During DE, blood flow to the legs declined significantly during the 20 min-exhaustion period of exercise (from 14.9 ± 0.7 to 13.7 ± 0.8 l min−1, P < 0.05). In contrast, 2-legged blood flow tended to increase during the same period of control (from 14.8 ± 0.8 to 15.7 ± 0.7 l min−1, n.s.; Fig. 1). After 135 ± 4 min of DE, blood flow to the legs was reduced by 2.0 ± 0.6 l min−1 compared with control (P < 0.05; Fig. 1). Forearm blood flow declined during DE to 8.4 ± 1.2 ml (100 g)−1 min−1 but was maintained throughout control (12.6–13.7 ml (100 g)−1 min−1). Therefore, after 135 ± 4 min, forearm blood flow was 39 ± 8% lower during DE compared with control (i.e. ∼5 ml (100 g)−1 min−1 lower, P < 0.05; Fig. 1). Similarly, laser Doppler skin blood flow declined significantly during DE (71 ± 4 vs. 100% at 135 ± 4 vs. 20 min, respectively, P < 0.05; n = 4). In contrast, laser Doppler skin blood flow was maintained throughout control.
Heart rate and stroke volume
In both trials, heart rate and stroke volume were similar at rest and during the first 20 min of exercise. During the 20 min-exhaustion period of DE, heart rate increased progressively until the end of exercise and approached maximal values (from 150 ± 4 to 186 ± 4 beats min−1, P < 0.05; Table 1). Conversely, stroke volume declined progressively from 152 ± 11 to 105 ± 5 ml beat−1 (P < 0.05). During control, heart rate increased from 147 ± 4 to 158 ± 5 beats min−1 (P < 0.05) but stroke volume did not decline significantly (Table 1).
Blood pressure and vascular conductance
During DE, systolic blood pressure and diastolic blood pressure (and consequently MABP) were constant during the first 90 min and thereafter declined significantly (5–8%, P < 0.05). Conversely, blood pressure did not decline throughout control (Fig. 2 and Table 1). Therefore, after 135 ± 4 min, systolic blood pressure and diastolic blood pressure (and consequently MABP) were 7–8 (± 3) mmHg lower during DE compared with control (i.e. 4–7% reduction, P < 0.05).
Figure 2. Mean arterial blood pressure and vascular conductances during the dehydration and control trials.
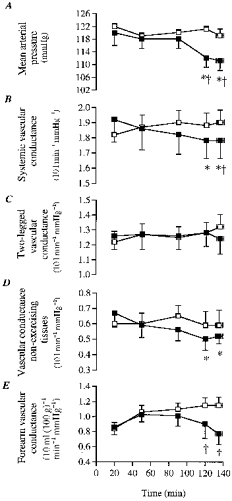
A, mean arterial blood pressure; B, systemic vascular conductance; C, 2-legged vascular conductance; D, non-exercising tissues vascular conductance; E, forearm vascular conductance. Conductance units in B, C, D and E were multiplied by 10 (e.g. 10 l min−1 mmHg−1). * Significantly lower than 20 min value (P < 0.05). † Significantly lower than control (P < 0.05).
Systemic vascular conductance declined significantly during DE (7 ± 3%) but tended to increase slightly during control. Thus, after 135 ± 4 min of exercise, systemic vascular conductance was reduced by 8 ± 3% during DE compared with control. However, leg vascular conductance did not change significantly either during DE or during control (Fig. 2). In contrast, forearm vascular conductance declined progressively during DE and was significantly lower than control after 120 min of exercise (33 ± 9% lower, P < 0.05; Fig. 2). Cutaneous vascular conductance showed the same pattern of response, declining during DE whereas being maintained during control.
Plasma catecholamines
During DE, both arterial noradrenaline and adrenaline concentrations increased progressively and were significantly elevated above the 20 min value after the first hour of exercise (Fig. 3). In contrast, during control arterial adrenaline did not increase significantly whereas noradrenaline was only significantly elevated above the 20 min value at the end of exercise. Thus, noradrenaline and adrenaline were higher during DE compared with control after the first hour of exercise (Fig. 3).
Figure 3. Arterial noradrenaline and adrenaline concentrations during the dehydration and control trials.
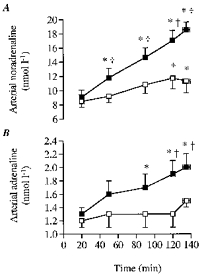
A, arterial noradrenaline concentration; B, arterial adrenaline concentration. * Significantly higher than 20 min value (P < 0.05). † Significantly higher than control (P < 0.05).
Whole body and leg O2 delivery, extraction and consumption
In both trials, pulmonary V̇O2 and 2-legged V̇O2 increased significantly (0.19–0.22 and 0.16–0.20 l min−1, respectively, P < 0.05) during the 20 to 120–135 min period of exercise (Fig. 4). Furthermore, no significant differences in between trial pulmonary V̇O2 or 2-legged V̇O2 were observed throughout exercise. Yet, a trend for a decrease in 2-legged V̇O2 was observed at the end of the dehydration trial when 2-legged blood flow was reduced by 2 l min−1 compared with control. The slopes of the increase in pulmonary V̇O2 and 2-legged V̇O2 were identical (slope, 0.002 l min−1). During the entire exercise period in both trials, 2-legged V̇O2 constituted most of the pulmonary V̇O2 (on average 74–75 (± 3)%).
Figure 4. Oxygen consumption during the dehydration and control trials.
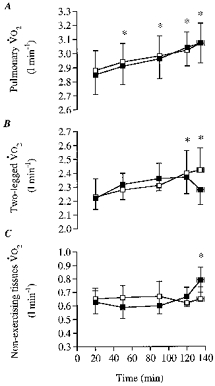
A, pulmonary oxygen consumption; B, 2-legged oxygen consumption; C, non-exercising tissues oxygen consumption. * Significantly higher than 20 min value (P < 0.05).
Leg O2 delivery was similar in both trials during the first 2 h of exercise as differences in blood flow were matched by proportional dehydration-induced arterial haemoconcentration (range, 1.41–1.46 l min−1). However, at the end of exercise, leg O2 delivery was significantly lower during DE compared with control (1.37 ± 0.06 vs. 1.48 ± 0.08 l min−1, respectively, P < 0.05).
During the 20 min-exhaustion period of DE, femoral arterial-mixed venous O2 difference increased progressively from 150 ± 50 to 168 ± 80 ml l−1 (P < 0.05, Fig. 5), respectively, whereas systemic a-v¯O2 difference increased from 126 ± 30 to 158 ± 40 ml l−1, respectively (P < 0.05). During control, femoral a-vO2 difference was also significantly higher after 120 min of exercise compared with the 20 min value (155 ± 90 vs. 150 ± 40 ml l−1, respectively, P < 0.05; Fig. 5). Nevertheless, after 50 min of exercise, femoral a-vO2 difference during DE was significantly (P < 0.05) higher than control (Fig. 5). During control, the 3% increase over time in femoral a-vO2 difference was solely due to increased O2 extraction (79 ± 1 to 81 ± 1% at 20 min vs. 135 ± 4 min, respectively, P < 0.05) in as much as arterial O2 content was maintained at ∼190 ml l−1 throughout exercise but femoral venous O2 content declined from 40 ± 3 to 35 ± 2 ml l−1 (Fig. 5). In contrast during DE, there was a 12% increase over time in femoral a-vO2 difference, which was due to both increased O2 delivery and extraction. During the 20 min-exhaustion period of DE, arterial O2 content increased from 193 ± 39 to 202 ± 38 ml l−1 (P < 0.05) due to the haemoconcentration whereas femoral venous O2 content declined from 43 ± 3 to 34 ± 4 ml l−1 (P < 0.05) and as a result O2 extraction increased from 78 ± 1 to 83 ± 2% (P < 0.05), respectively (Fig. 5).
Figure 5. Oxygen parameters measured during the dehydration and control trials.
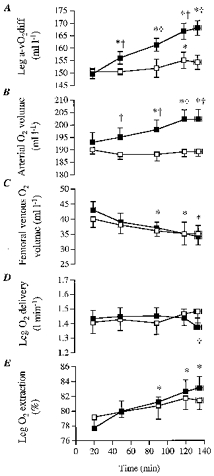
A, leg femoral arterial-to-venous oxygen difference (Leg a-vO2diff); B, arterial oxygen volume; C, femoral venous oxygen volume; D, leg oxygen delivery; E, leg oxygen extraction. * Significantly different from 20 min value during dehydration trial (P < 0.05). Femoral venous oxygen volume also declines significantly over time during control. † Significantly different from control (P < 0.05).
DISCUSSION
This study demonstrates that blood flow to active skeletal muscle becomes significantly reduced with dehydration when cardiac output and systemic vascular conductance decline during prolonged exercise in the heat. The lower muscle blood flow was associated with reduced perfusion pressure and systemic blood flow since muscle vascular conductance was unaltered throughout exercise. Oxygen delivery to the leg muscles was also unchanged during the first 2 h of exercise. Furthermore, the reduction in muscle blood flow was accompanied by an even greater increase in femoral a-vO2 difference, leading to an increase in leg V̇O2 that matched the upward drift in whole body V̇O2. This indicates that the active muscles are responsible for the upward drift in whole body oxygen consumption during prolonged exercise.
A major new finding was that blood flow to the legs was reduced by 2.0 ± 0.6 l min−1 (13% decrease, P < 0.05) in DE compared with control at the end of exercise. Thus, the lowering of blood flow to the exercising legs accounted for approximately two-thirds of the reduction in cardiac output (see Fig. 1). It should be mentioned that DE caused a gradual reduction in LBF that became significant at the point of fatigue. Furthermore, part of the significantly lower LBF at 120 and 135 ± 4 min in DE compared with control was due to the gradual non-significant increase in LBF during control (see Fig. 1).
There are several observations which strongly suggest that the decline in LBF (which comprises blood flow to all leg tissues) largely reflects reductions in active muscle blood flow. (i) Reductions in LBF were accompanied by greater elevations in the femoral a-vO2 difference, resulting in a progressive increase in leg V̇O2 similar to control values. This is only possible if O2 extraction and utilization in the active skeletal muscles increase. Furthermore, when LBF tended to increase during control, only a small, but still significant, increase in femoral a-vO2 difference was observed. (ii) Reductions in leg skin blood flow, if indeed they did occur, can only account for a small fraction of the total LBF reduction, as it represents only 5% of LBF (0.4–0.5 l min−1). (iii) Blood flow to the inactive muscle is thought to be 0.3–0.4 l min−1 (similar to resting LBF, ∼5% of LBF), and thus if it also declines in DE it could only account for a small fraction of the reduction in LBF. Therefore, 13% lower LBF with DE in the present study is taken to reflect a lower active skeletal muscle blood flow.
This is the first study to demonstrate significant reductions in blood flow to exercising skeletal muscle during prolonged exercise in humans. Previous studies in humans (Kirwan et al. 1987; Nielsen et al. 1990, 1993, 1997), rats (Laughlin & Armstrong, 1983) and miniature swine (Armstrong et al. 1987; McKirnan et al. 1989) have shown that blood flow to active muscles is either maintained or increased when heat stress is superimposed during exercise. This is in contrast to the significant reductions in blood flow to some exercising muscles found in sheep with heat stress (Bell et al. 1983). The main reason for the discrepancy might be that the heat stress used in human and most animal studies did not reduce cardiac output unlike the present study with dehydration and Bell et al. (1983). In previous human studies from this laboratory, it was shown that muscle blood flow in the working leg was not reduced compared with control values when heat stress was imposed during prolonged walking (Nielsen et al. 1990), knee-extension exercise (Savard et al. 1988) or moderate- and high-intensity bicycling exercise in the semirecumbent position (Nielsen et al. 1993, 1997). In all studies, the cardiovascular system responded adequately to the additional demand of an elevated skin blood flow by increasing cardiac output (1–3 l min−1) and possibly reducing splanchnic and renal blood flow as shown by others (Rowell et al. 1965, 1971; Ho et al. 1997). Further support for unaltered muscle perfusion in these previous studies was found in the observations that femoral a-vO2 difference, leg V̇O2 and lactate release were unchanged (Savard et al. 1988; Nielsen et al. 1990, 1993, 1997). The present design used upright, moderately intense prolonged exercise in the heat with the aim of taxing the cardiovascular system to the extent where cardiac output declines markedly (Sawka et al. 1979; Montain & Coyle, 1992; González-Alonso et al. 1995).
In the present study, the lowering in LBF is attributed to reductions in perfusion pressure and systemic blood flow because leg vascular conductance was unchanged by dehydration (see Fig. 2). We observed that LBF and mean arterial pressure were unaltered during the first 90 min of exercise despite the already marked dehydration and hyperthermia, but both variables declined similarly 7–8% (P < 0.05) during the last 15 min of exercise. This is in contrast to the significant decline in cardiac output (i.e. 1.5 l min−1) already observed after 90 min of exercise, indicating that blood flow to non-exercising body tissues declined earlier than blood flow to active skeletal muscle. The possibility that leg skin blood flow was reduced by 0.1–0.2 l min−1 does not affect the contention that muscle vascular conductance was unaltered throughout the dehydration trial, as leg skin blood flow only represented ∼5% of LBF. An unaltered muscle vascular conductance in the presence of significantly higher plasma catecholamines (see Fig. 3), suggests that neurally mediated vasoconstriction did not occur in the vessels perfusing the exercising skeletal muscle, even though sympathetic activity to the skeletal muscle might have been elevated. Presently, the marked increase in plasma noradrenaline with dehydration compared with control (up to 65% higher) was possibly, to a large extent, a reflection of an elevated leg noradrenaline spillover, as previously observed when LBF was reduced during incremental exercise with β-blockade (Pawelczyck et al. 1992). The observation that dehydration also resulted in significant increases in lactate production, plasma K+ and osmolality supports the notion that metabolic vasodilatation was elevated compared with control. Taken together, it appears that the maintained muscle vascular conductance with dehydration resulted from the counterbalance effect of increased vasodilator and increased vasoconstrictor activities (Vanhoutte et al. 1981).
Given that muscle vascular conductance was unaltered with dehydration, the reductions in vascular conductance in non-exercising tissues appear largely to account for the reductions in systemic vascular conductance. The skin, splanchnic and renal tissues appear to be the main compartments where reductions in vascular conductance occurred. In the present study, we observed significantly lower forearm (33 ± 9%) and skin vascular conductance with dehydration compared with control after 2 h of exercise (Fig. 2). Based on the assumption that a 5 ml (100 g)−1 min−1 lowering in forearm blood flow might represent up to 1 l min−1 reduction in whole body skin blood flow (Minson et al. 1998), it appears that the skin compartment might account for most of the decline in vascular conductance in non-exercising tissues (Fig. 2). With combined dehydration and hyperthermia, it seems likely that blood flow to splanchnic and renal tissues was also reduced compared with control and in the context of the present study might have contributed to most of the remaining 0.3 l min−1 lower blood flow to non-exercising tissues (Rowell et al. 1965, 1971). This indirect evidence suggests that the skin and visceral organs, rather than active skeletal muscle, might be the main targets of baroreflex regulation of arterial pressure with dehydration during prolonged exercise in the heat.
Another important finding of this study is that the increase in oxygen utilization by the exercising muscles was responsible for the well-characterized upward drift in whole body V̇O2, not only when maintaining systemic and limb blood flow with euhydration but also when blood flow declined significantly with dehydration. This is based on the observation that the progressive increase in 2-legged V̇O2 from the initial 20 min value during control and the first 2 h of the dehydration trial (fitting the equation y = 0.002 x+ 2.204; r2= 0.91) was identical to the increase in pulmonary V̇O2 (y= 0.002x+ 2.849; r2= 0.96) (see Fig. 4). This finding corroborates previous observations in euhydrated subjects during high intensity exercise and prolonged exercise (Ahlborg et al. 1974; Poole et al. 1991, 1992). In agreement, we observed that the progressive increase in leg V̇O2 when euhydrated was related to increased O2 extraction, as well as a 5% increase in LBF, which was generally of the same magnitude as the rise in cardiac output (Figs 1 and 5).
On the other hand, the present finding that the lowered LBF with dehydration compared with control was accompanied by a maintained O2 delivery and similar leg V̇O2 during the first 2 h of exercise is consistent with the adjustments observed when LBF is lowered with hyperoxia (Welch et al. 1977) or elevated with hypoxia and anaemia (Koskolou et al. 1997a, b). This therefore supports the notion that O2 delivery to contracting muscles is tightly regulated. In this study, the higher femoral a-vO2 difference with dehydration compared with control was due only to the higher arterial O2 content, secondary to the dehydration-induced haemoconcentration, since femoral venous O2 content declined similarly in both trials (see Fig. 5B and C). It was only at the end of exercise that leg O2 delivery was significantly lower with dehydration compared with control, and 2-legged V̇O2 tended to decline (Fig. 4). This trend for a lower 2-legged V̇O2 with dehydration was accompanied by an elevation in pulmonary V̇O2, indicating that V̇O2 of the non-exercising tissues had increased by 0.1 l min−1 (15–17%, P < 0.05; Fig. 4). This elevation in non-leg tissue V̇O2 with dehydration might have resulted from the combined increase in ventilation (13 l min−1, i.e. 21%), myocardium (12% higher rate-pressure product index) and liver metabolism (higher glucose production), as well as elevated postural muscle V̇O2, when becoming fatigued.
In conclusion, the present results demonstrate that blood flow to active skeletal muscle becomes significantly reduced with dehydration during prolonged exercise in the heat. However, dehydration did not alter muscle vascular conductance despite the marked elevations in circulating catecholamines, and possibly elevated sympathetic activity to the vessels perfusing the active skeletal muscle. The lower muscle blood flow was therefore associated with reduced perfusion pressure and systemic blood flow, rather than increased neural vasoconstriction. Reductions in vascular conductance in the skin and possibly splanchnic and renal tissues might largely account for the marked declines in systemic vascular conductance with dehydration and hyperthermia. It is postulated that the skin and visceral organs, rather than active skeletal muscle, might be the main targets of baroreflex regulation of arterial pressure with dehydration during prolonged exercise in the heat. Lastly, the lower muscle blood flow was accompanied by an unaltered O2 delivery and a greater increase in the femoral a-vO2 difference, leading to an increase in leg V̇O2 that matched the upward drift in whole body V̇O2 during the first 2 h of exercise. This indicates that the upward drift in whole body oxygen consumption during prolonged exercise is normally confined to the exercising skeletal muscles.
Acknowledgments
The excellent technical assistance of Ingelise Kring, Nina Pluszek, Betina Bolmgren, Christina Teller and Signe Andersen is acknowledged. Special thanks are given to Professor Bengt Saltin for his insightful suggestions on the manuscript, as well as his supervision of the project. The authors also thank Professor Loring B. Rowell for critique of the manuscript. This study was supported by grants from the European Commission and Team Danmark. J. G.-A. was supported by a Marie Curie Research Training Grant (FMBICT950007).
References
- Ahlborg G, Felig P, Hagenfeldt L, Hendler R, Wahren J. Substrate turnover during prolonged exercise in man: splanchnic and leg metabolism of glucose, free fatty acids and amino acids. Journal of Clinical Investigation. 1974;53:1080–1090. doi: 10.1172/JCI107645. [DOI] [PMC free article] [PubMed] [Google Scholar]
- Andersen P, Saltin B. Maximal perfusion of skeletal muscle in man. The Journal of Physiology. 1985;366:233–249. doi: 10.1113/jphysiol.1985.sp015794. [DOI] [PMC free article] [PubMed] [Google Scholar]
- Armstrong RB, Delp MD, Goljan EF, Laughlin MH. Progressive elevations in muscle blood flow during prolonged exercise in swine. Journal of Applied Physiology. 1987;63:285–291. doi: 10.1152/jappl.1987.63.1.285. [DOI] [PubMed] [Google Scholar]
- Bell AW, Hales JRS, King RB, Fawcett AA. Influence of heat stress on exercise-induced changes in regional blood flow in sheep. Journal of Applied Physiology. 1983;55:1916–1923. doi: 10.1152/jappl.1983.55.6.1916. [DOI] [PubMed] [Google Scholar]
- Christiansen NJ, Vestergaard P, Sørensen T, Rafaelsen OJ. Cerebrospinal fluid adrenaline and noradrenaline in depressed patients. Acta Psychiatrica Scandinavica. 1980;61:178–182. doi: 10.1111/j.1600-0447.1980.tb00577.x. [DOI] [PubMed] [Google Scholar]
- Dill DB, Costill D. Calculations of percentage changes in volumes of blood, plasma, and red blood cells with dehydration. Journal of Applied Physiology. 1974;9:247–248. doi: 10.1152/jappl.1974.37.2.247. [DOI] [PubMed] [Google Scholar]
- Gaesser GA, Pool DL. The slow component of oxygen uptake kinetics in humans. In: Holloszy J, editor. Exercise and Sport Sciences Reviews. Vol. 24. Baltimore: Williams & Wilkins; 1996. pp. 35–70. [PubMed] [Google Scholar]
- Ganz W, Swan HJC. Measurement of blood flow by the thermodilution technique. In: Bloomfield DA, editor. Dye Curves: The Theory and Practice of Indicator Dilution. Baltimore: University Park Press; 1974. pp. 245–266. [Google Scholar]
- González-Alonso J, Mora-Rodríguez R, Below PR, Coyle EF. Dehydration reduces cardiac output and increases systemic and cutaneous vascular resistance during exercise. Journal of Applied Physiology. 1995;79:1487–1496. doi: 10.1152/jappl.1995.79.5.1487. [DOI] [PubMed] [Google Scholar]
- Ho CW, Beard JL, Farrell C, Minson T, Kenney WL. Age, fitness and regional blood flow during exercise in the heat. Journal of Applied Physiology. 1997;82:1126–1135. doi: 10.1152/jappl.1997.82.4.1126. [DOI] [PubMed] [Google Scholar]
- Johnson JM, Rowell LB. Forearm skin and muscle vascular responses to prolonged leg exercise in man. Journal of Applied Physiology. 1975;39:920–924. doi: 10.1152/jappl.1975.39.6.920. [DOI] [PubMed] [Google Scholar]
- Kirwan JP, Costill DL, Kuipers H, Burrel MJ, Fink WJ, Kowaleski JE, Fielding RA. Substrate utilization in leg muscle of men after heat acclimation. Journal of Applied Physiology. 1987;63:31–35. doi: 10.1152/jappl.1987.63.1.31. [DOI] [PubMed] [Google Scholar]
- Koskolou MD, Calbet JAL, Rådegran G, Roach RC. Hypoxia and the cardiovascular response to dynamic knee-extensor exercise. American Journal of Physiology. 1997a;272:H2655–2663. doi: 10.1152/ajpheart.1997.272.6.H2655. [DOI] [PubMed] [Google Scholar]
- Koskolou MD, Roach RC, Calbet JAL, Rådegran G, Saltin B. Cardiovascular responses to dynamic exercise with acute anemia in humans. American Journal of Physiology. 1997b;273:H1787–1793. doi: 10.1152/ajpheart.1997.273.4.H1787. [DOI] [PubMed] [Google Scholar]
- Laughlin MH, Armstrong RB. Rat muscle blood flows as a function of time during prolonged slow treadmill exercise. American Journal of Physiology. 1983;244:H814–824. doi: 10.1152/ajpheart.1983.244.6.H814. [DOI] [PubMed] [Google Scholar]
- McKirnan MD, Gray CG, White FC. Plateau in muscle blood flow during prolonged exercise in miniature swine. Journal of Applied Physiology. 1989;66:2101–2108. doi: 10.1152/jappl.1989.66.5.2101. [DOI] [PubMed] [Google Scholar]
- Minson CT, Stacey LW, Cardell AF, Pawelczyk JA, Kenney WL. Age alters the cardiovascular response to direct passive heating. Journal of Applied Physiology. 1998;84:1323–1332. doi: 10.1152/jappl.1998.84.4.1323. [DOI] [PubMed] [Google Scholar]
- Montain SJ, Coyle EF. Influence of graded dehydration on hyperthermia and cardiovascular drift during exercise. Journal of Applied Physiology. 1992;73:1340–1350. doi: 10.1152/jappl.1992.73.4.1340. [DOI] [PubMed] [Google Scholar]
- Nielsen B, Hales JRS, Strange S, Christiensen NJ, Warberg J, Saltin B. Human circulatory and thermoregulatory adaptations with heat acclimation and exercise in a hot, dry environment. The Journal of Physiology. 1993;460:467–485. doi: 10.1113/jphysiol.1993.sp019482. [DOI] [PMC free article] [PubMed] [Google Scholar]
- Nielsen B, Savard G, Richter EA, Hargreaves M, Saltin B. Muscle blood flow and metabolism during exercise and heat stress. Journal of Applied Physiology. 1990;69:1040–1046. doi: 10.1152/jappl.1990.69.3.1040. [DOI] [PubMed] [Google Scholar]
- Nielsen B, Strange S, Christensen N, Warberg J, Saltin B. Acute and adaptive responses in humans to exercise in a warm, humid environment. Pflügers Archiv. 1997;434:49–56. doi: 10.1007/s004240050361. [DOI] [PubMed] [Google Scholar]
- Pawelczyck JA, Hanel B, Pawelczyck RA, Warberg J, Secher NH. Leg vasoconstriction during dynamic exercise with reduced cardiac output. Journal of Applied Physiology. 1992;73:1838–1846. doi: 10.1152/jappl.1992.73.5.1838. [DOI] [PubMed] [Google Scholar]
- Poole DC, Gaesser A, Hogan C, Knight DR, Wagner PD. Pulmonary and leg VO2 during submaximal exercise: implications for muscular efficiency. Journal of Applied Physiology. 1992;72:805–810. doi: 10.1152/jappl.1992.72.2.805. [DOI] [PubMed] [Google Scholar]
- Poole DC, Schaffartzik W, Knight DR, Derion T, Kennedy B, Guy HJ, Prediletto R, Wagner PD. Contribution of exercising legs to the slow component of oxygen uptake kinetics in humans. Journal of Applied Physiology. 1991;71:1245–1253. doi: 10.1152/jappl.1991.71.4.1245. [DOI] [PubMed] [Google Scholar]
- Rowell LB. Human cardiovascular adjustments to exercise and thermal stress. Physiological Reviews. 1974;54:75–159. doi: 10.1152/physrev.1974.54.1.75. [DOI] [PubMed] [Google Scholar]
- Rowell LB. Cardiovascular adjustments to thermal stress. In: Shepherd JT, Abboud FM, editors. Handbook of Physiology, section 2, The Cardiovascular System, Peripheral Circulation and Organ Blood Flow. part 2. III. Bethesda: American Physiological Society; 1983. pp. 967–1023. [Google Scholar]
- Rowell LB. Human circulation: Regulation during physical stress. New York: Oxford University Press; 1986. pp. 363–406. [Google Scholar]
- Rowell LB, Blackmon JR, Martin RH, Mazzerella JA, Bruce RA. Hepatic clearance of indocyanine green in man under thermal and exercise stresses. Journal of Applied Physiology. 1965;20:384–394. doi: 10.1152/jappl.1965.20.3.384. [DOI] [PubMed] [Google Scholar]
- Rowell LB, Detry J-MR, Profant GR, Wyss C. Splanchnic vasoconstriction in hyperthermic man - role of falling blood pressure. Journal of Applied Physiology. 1971;31:864–869. doi: 10.1152/jappl.1971.31.6.864. [DOI] [PubMed] [Google Scholar]
- Savard GK, Nielsen B, Laszczynska I, Larsen BE, Saltin B. Muscle blood flow is not reduced in humans during moderate exercise and heat stress. Journal of Applied Physiology. 1988;64:649–657. doi: 10.1152/jappl.1988.64.2.649. [DOI] [PubMed] [Google Scholar]
- Sawka MN, Knowlton RG, Critz JB. Thermal and circulatory responses to repeated bouts of prolonged running. Journal Applied of Physiology. 1979;19:833–838. [PubMed] [Google Scholar]
- Siggaard-Andersen O. The Acid-Base Status of the Blood. 4. Copenhagen: Munksgaard; 1974. [PubMed] [Google Scholar]
- Vanhoutte PM, Verbueren TJ, Webb RC. Local modulation of adrenergic neuroeffector interaction in the blood vessel wall. Physiological Reviews. 1981;61:151–247. doi: 10.1152/physrev.1981.61.1.151. [DOI] [PubMed] [Google Scholar]
- Welch HG, Bonde-Petersen F, Graham T, Klausen K, Secher N. Effects of hyperoxia on leg blood flow and metabolism during exercise. Journal of Applied Physiology. 1977;42:385–390. doi: 10.1152/jappl.1977.42.3.385. [DOI] [PubMed] [Google Scholar]