

Abstract
The effects of large reductions of [K+]o on membrane potential were studied in isolated rabbit ventricular myocytes using the whole-cell patch clamp technique.
Decreasing [K+]o from the normal level of 5.4 mm to 0.1 mm increased resting membrane potential (Vrest) from −75.6 ± 0.3 to −140.3 ± 1.9 mV (means ± s.e.m; n = 127), induced irregular, transient depolarizations with mean maximal amplitudes of 19.5 ± 1.5 mV and elicited action potentials in 56.7 % of trials. The action potentials exhibited overshoots of 37.9 ± 1.5 mV (n = 72) and sustained plateaux.
Addition of 0.1 mm La3+ in the presence of 0.1 mm[K+]o significantly increased Vrest but decreased the amplitude of transient depolarizations and suppressed the firing of action potentials.
Replacement of external Na+ or Cl− with N-methyl-D-glucamine or aspartate, respectively, or internal dialysis with 10 mm EGTA or BAPTA had little effect on low [K+]o-induced membrane potential changes.
Hyperpolarizing voltage clamp pulses to potentials between −110 and −200 mV activated irregular inward currents that increased in amplitude and frequency with increasing hyperpolarization and were depressed by 0.1 mm La3+.
The generation of transient depolarizations by low [K+]o can be explained as being a consequence of decreasing the inward rectifier K+ current (IK1) and the appearance of inward currents reflecting electroporation resulting from strong electric fields across the membrane.
In ventricular myocardial cells and Purkinje fibres, the inward rectifier K+ current (IK1) is the primary current determining resting membrane potential (Vrest; Noble, 1979). IK1 is highly dependent on [K+]o (Sakmann & Trube, 1984; Hille, 1992; Kubo, 1996); decreasing [K+]o hyperpolarizes cell membranes and reduces outward-going IK1, which inhibits spontaneous firing of action potentials by offsetting inadvertently generated arrhythmogenic inward currents. Decreasing [K+]o also inhibits Na+-K+ pump activity and increases [Na+]i (Hermans et al. 1995), which in turn increases [Ca2+]i by inhibiting Ca2+ extrusion via Na+-Ca2+ exchange. Thus, reduction of [K+]o may induce various abnormal electrical activities.
When exposed to strong electric fields, cell membranes may rupture, producing large increases in the membrane conductance (electroporation; Tsong, 1991). To date, electroporation has been used to introduce a variety of large, membrane impermeant molecules such as DNA and various enzymes and antibodies (Weaver, 1993) into cells. In the heart, electroporation of cardiac myocytes is a harmful complication when defibrillation countershock is applied to arrhythmic patients. Field stimulation involving electric fields of ∼100 V cm−1 produces microlesions in the sarcolemmas of cultured chick embryo myocardial cells enabling permeation of 4–10 kDa dextrans (Jones et al. 1987), causes injury to isolated rabbit ventricular myocytes (Knisley & Grant, 1995) and induces sustained depolarizations in isolated guinea-pig papillary muscles (Kodama et al. 1994). Since normal Vrest values in cardiac myocytes are in the range of −80 mV, they might not be expected to experience potentials of sufficient magnitude to elicit electroporation. The dielectric strength of normal resting membranes, however, is about 105 V cm−1, which is not far from the electric field strength that is sufficient to cause dielectric breakdown of the lipid bilayer (Tsong, 1991). In isolated frog ventricular myocytes, 5–10 ms voltage step pulses with amplitudes of 300–400 mV induced sudden conductance increases in cell-attached patches, presumably due to electroporation (O'Neil & Tung, 1991; Tovar & Tung, 1992). Given the randomness with which electroporation occurs, it could be anticipated that if longer test pulses were used, electroporation would be induced at less extreme voltages.
In the present study, we examined the effects of [K+]o reduction on membrane potential in rabbit ventricular myocytes and examined the extent to which large hyperpolarizations destabilize Vrest. When [K+]o was reduced to 0.1 mm, cells were hyperpolarized to about −140 mV and irregular depolarizations were observed. Corresponding voltage clamp steps induced irregular inward currents. This suggests that the electric field imposed on the membrane by an abnormal Vrest may affect the electrical activity of cardiac muscle by inducing electroporation. A preliminary report has been presented (Akuzawa et al. 1996).
METHODS
Single cell preparation
As described previously (Kawashima & Ochi, 1988), ventricular myocytes were isolated from the hearts of Japanese rabbits (1.6 kg) by an enzymatic treatment during Langendorff perfusion at 37°C. In short, rabbits were anaesthetized by intravenous injection of urethane (1.25 g kg−1) via the auricular vein; the ascending aorta was cannulated under artificial respiration; the heart was then excised and perfused sequentially with normal Tyrode solution for 5 min, Ca2+-free Tyrode solution for 5 min, collagenase solution for 20 min and Kraft-Brühe (KB) medium for 5 min. Thereafter, the ventricles were minced with scissors and gently shaken in a warmed, shaking water bath for several minutes. The cells were harvested by filtering the digested tissue fragments through a coarse metal filter and then stored in KB medium at 4°C until used.
Solutions and drugs
Normal Tyrode solution had the following composition (mm) : NaCl, 135; KCl, 5.4; CaCl2, 1.8; MgCl2, 1; Hepes, 5; glucose, 10; pH was adjusted to 7.40 by NaOH. Collagenase solution contained 30 mg ml−1 collagenase (Sigma type I) in 0.01 mm Ca2+-containing normal Tyrode solution. KB medium contained (mm): KOH, 110; taurine, 10; oxalic acid, 10; glutamic acid, 70; KCl, 25; KH3PO4, 10; EGTA-Tris, 5; Hepes-Tris, 5; glucose, 10; pH was adjusted to 7.40 by KOH. In low K+ solution, [KCl] in normal Tyrode solution was decreased as indicated. NMDG solution was made by replacing NaCl with isomolar N-methyl-D-glucamine chloride (NMDG). Aspartate solution was a Cl− deficient solution made by replacing NaCl with sodium aspartate. Standard pipette solution contained (mm): KCl, 140; MgCl2, 1; EGTA-Tris, 0.1 or 1; MgATP, 3; Hepes, 5; pH was adjusted to 7.35 by KOH. In 10 mm EGTA or BAPTA solution, KCl concentration in the standard pipette solution was reduced to 120 mm. Experiments were performed at room temperature (22–25°C).
Patch clamp procedures and instrumentation
Membrane potentials and currents were recorded using current-clamp and whole-cell patch clamp techniques, respectively (Hamill et al. 1981). Cells were dispersed on the glass bottom of a small chamber having a diameter of 5 mm and a depth of 1 mm and were superfused continuously by gravity at a rate of about 1 ml min−1. Patch pipettes were pulled from plain haematocrit capillary tubes made of soda lime glass (Chase Instruments Corp., NY, USA), coated with Silgard (Silpot 184, Dow Corning), and heat-polished under a microscope. Electrode tip resistances ranged from 2–4 MΩ when filled with the pipette solution. After establishing gigaohm seals, patch membranes were disrupted by applying negative pressure. Only cells with Vrest values more negative than −70 mV were employed for experiments. Either flowing or agar 3 m KCl electrodes placed at the exit of the chamber served as indifferent electrodes. Vrest values were corrected for liquid junction potentials that developed at the tip of the pipette in normal Tyrode solution (3 mV pipette negative; Neher, 1992). The patch clamp amplifiers used were an EPC-7 (List-Electronik, Darmstadt, Germany) and an EPC-8 (HEKA Electronik, Lambrecht, Germany), and rectangular command pulses were applied from an electrical stimulator (SET-1201, Nihon Kohden, Tokyo, Japan). Membrane voltages and currents were continuously recorded using a MacLab Chart system (Chart V.3.5/s, ADInstruments, Castle Hill, NSW, Australia) on a Macintosh computer (Power Macintosh 7500/100, Apple Computer); the sampling frequency was 4 kHz, and currents were filtered at 1 kHz with a Bessel-type filter. Data were later stored on Zip®100 disks.
Data analysis
The data analysis was conducted using Igor Pro (Wavemetrics Inc., OR, USA) and Patch Analyst Pro V1.21 (MT corporation, Tokyo, Japan) running on a Macintosh computer. Vrest values were measured as the most negative steady-state potential in each solution. Amplitudes of transient depolarizations were measured as the largest positive deflection (except for action potentials) from the preceding most negative potential. Values are expressed as means ± standard error of the mean (s.e.m.), and statistical analyses were performed using Student's t test for paired or unpaired samples. P values < 0.05 were considered statistically significant.
RESULTS
Hyperpolarizations, transient depolarizations and action potentials induced by reduction of [K+]o
Decreasing [K+]o from the normal value of 5.4 mm to 0.1 mm, either abruptly or in steps, increased resting membrane potential (Vrest) from −75.6 ± 0.3 to −140.3 ± 1.9 mV (means ±s.e.m.; n = 127), induced irregular, transient depolarizations with mean maximal amplitudes of 19.5 ± 1.5 mV and elicited action potentials in 56.7 % of the trials. In nominally K+-free solution, membrane potentials were significantly more negative (−154.7 ± 4.3 mV; n = 11) than when [K+]o= 0.1 mm (P < 0.05), but irregular transient depolarizations and action potentials occurred at similar rates (Table 1A and B).
Table 1.
Effect of [K+]o reduction on membrane potential under various ionic compositions
| Test solution | n | Vrest(con) (mV) | Vrest (test) (mV) | ΔVrest (mV) | Percentage of firing (mV) | |
|---|---|---|---|---|---|---|
| A | 0.1 K+ | 99 | −76.1 ± 0.3 | −137.7 ± 2.3 | 19.8 ± 1.6 | 62.6 |
| B | K+ free | 11 | −75.8 ± 0.6 | −154.7 ± 4.3* | 14.3 ± 3.1 | 54.5 |
| C | 0.1 K+ | 26 | −74.3 ± 0.9 | −144.0 ± 4.0 | 26.4 ± 3.0 | 100.0 |
| La3+, 0.1 K+ | 26 | −75.5 ± 0.8 | −157.6 ±1.3 * | 12.1 ± 1.2 * | 3.8 | |
| D | NMDG, 0.1 K+ | 12 | −73.4 ± 0.8 | −144.2 ± 4.8 | 19.2 ± 2.8 | 75.0 |
| E | Asp, 0.1 K+ | 9 | −75.4 ± 1.0 | −146.4 ± 5.8 | 23.1 ± 5.4 | 77.8 |
| F | 10 EGTAi, 0.1 K+ | 27 | −73.0 ± 0.3 | −134.2 ± 4.5 | 26.1 ± 4.4 | 70.4 |
| G | 10 BAPTAi, 0.1 K+ | 16 | −74.4 ± 0.4 | −147.0 ± 1.6 * | 29.0 ± 4.9 | 75.0 |
Test solutions in A–F were introduced after normal Tyrode solution. n, number of experiments; Vrest (con), resting membrane potential measured as the most negative potential (Vrest) in normal Tyrode solution given by means ±s.e.m.; Vrest (test), Vrest in the presence of low [K+]o; ΔVrest, depolarization amplitude as the largest positive deflection from Vrest; percentage of firing, percentage of the trials associated with firing of action potentials. 0.1 K+, 0.1 mm[K+]o; La3+, 0.1 mm La3+; Asp, aspartate; 10 EGTAi, in the presence of 10 mm EGTA in the pipette solution. 10 BAPTAi, in the presence of 10mm BAPTA in the pipette solution.
Denotes the significant differences compared with A, except for C where control experiments were done using the same cells.
When [K+]o was decreased from 5.4 to 0.1 mm stepwise, with intermediate [K+]o values of 2.7, 1.0 and 0.3 mm, corresponding stepwise increases in Vrest values were observed (Fig. 1). After superfusing cells with reduced [K+]o solution for 1–3 min, the most negative steady-state potential (Vrest) for each solution increased successively from −76.1 mV to −93.4, −118.0, −146.9 and −160.1 mV. Moreover, in the presence of 0.3 mm[K+]o, small transient depolarizations with maximal amplitudes of 6 mV were seen; further reduction of [K+]o to 0.1 mm increased both the frequency and amplitude of the transient depolarizations, and eventually an action potential was fired (Fig. 1A). Displayed on an expanded time scale, the time courses of the irregular depolarizations suggest that they were composed of multiple smaller depolarizations occurring asynchronously (Fig. 1B and C).
Figure 1. Effect of serial reduction of [K+]o on membrane potential.
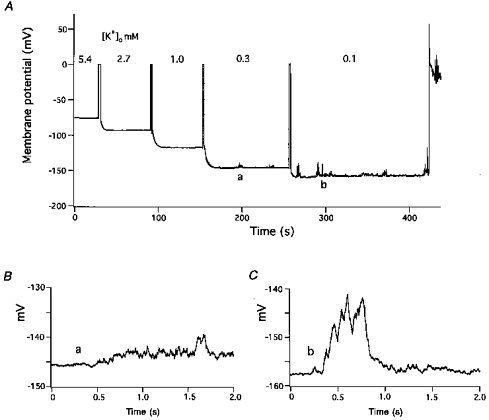
A, [K+]o was decreased stepwise from 5.4 to 2.7, 1, 0.3 and 0.1 mm. Membranes were briefly voltage-clamped at 0 mV just prior to the introduction of new solutions. At 0.3 mm, small noisy depolarizations appeared. At 0.1 mm, the transient depolarizations occurred more frequently, had larger amplitudes, and finally elicited an action potential. B and C, irregular, transient depolarizations displayed on expanded voltage and time scales. B, 0.3 mm[K+]o (labelled a in panel A) and C, 0.1 mm[K+]o (labelled b in panel A).
The results obtained from experiments in which [K+]o was decreased in stepwise fashion are summarized in Fig. 2. The magnitudes of the hyperpolarizations induced by decreasing [K+]o from 5.4 to 2.7 and then to 1.0 mm approximately coincided with the Nernst shift in equilibrium potential (EK) (Fig. 2A); Vrest values were compared with EK calculated for [K+]i= 100 mm (dotted line). Hyperpolarizations produced by decreasing [K+]o to 0.1 mm, however, were much smaller than the expected increase in EK. The amplitudes of the transient depolarizations and the frequency with which action potentials occurred were both dependent on the Vrest values (Fig. 2B and C). Maximal amplitudes of the transient depolarizations were 0.7 ± 0.1 mV (n = 38), 0.8 ± 0.1 mV (n = 19), 2.4 ± 0.5 mV (n = 35), 5.6 ± 0.7 mV (n = 27) and 18.3 ± 3.4 mV (n = 28) at 5.4, 2.7, 1.0, 0.3 and 0.1 mm[K+]o, respectively. In parallel with the increasing amplitudes of the transient depolarizations, low [K+]o-induced hyperpolarization generated action potentials 7.4 % (n = 27) of the time at 0.3 mm[K+]o and 35.7 % of the time at 0.1 mm (Fig. 2C).
Figure 2. Effect of reducing [K+]o on Vrest values, amplitudes of transient depolarizations and the frequency of action potential generation.
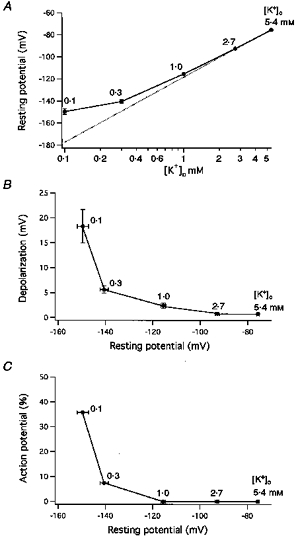
A, Vrest expressed as a function of [K+]o. Vrest was measured as the most negative steady-state membrane potential. [K+]o was decreased stepwise from 5.4 (n = 38) to 2.7 (19), 1.0 (35), 0.3 (27) and 0.1 mm (28). The dotted line plots the function: y = 59 × log[K+]o/100 (mV). B, amplitudes of maximal depolarizations obtained in various low [K+] solutions expressed as a function of Vrest. C, action potential frequency (% incidence) expressed as a function of Vrest.
Examination of low K+-induced action potentials on an expanded time scale revealed that they fired at a critical membrane potential of about −60 mV (indicated by an arrow in Fig. 3) which was attained following a series of slow irregular depolarizations or after a relatively rapid monotonic depolarization phase (Figs 3, 4B and 5Ab, Bb and Cb). In the presence of 0.1 mm[K+]o, action potentials exhibited overshoots with a mean amplitude of 37.9 ± 1.5 mV (n = 72). From the difference between Vrest values and the overshoot potential, the mean action potential amplitude was calculated to be 166.8 ± 3.2 mV, and the maximal rate of rise was 121.7 ± 5.3 V s−1 (range 56.8 and 165.9 V s−1). The action potentials also exhibited sustained plateaux at membrane potentials between −10 and −20 mV, which slowly repolarized over periods of tens of seconds (Fig. 4A). Possible Ca2+ overload induced by the sustained depolarization was prevented by reintroducing normal Tyrode solution. This caused rapid repolarization of the plateau by increasing the outward-going IK1 (Fig. 4); thereafter, over the course of 10–20 s, the membrane depolarized to normal Vrest values reflecting the increase in [K+]o.
Figure 3. Rising phase of low K+-induced action potentials.
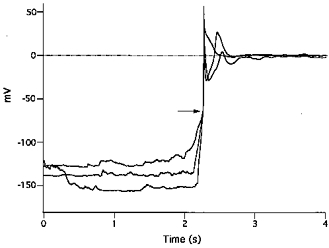
Three action potentials generated by exposure to 0.1 mm[K+]o solution are superimposed by synchronizing them at the steep rising phase. Irregular depolarizations gradually rose to a critical threshold around −60 mV (indicated by the arrow), and action potentials with rapid rising phases and overshoots were elicited.
Figure 4. Inhibition by La3+ of low [K+]o-induced irregular, transient depolarizations and action potentials.
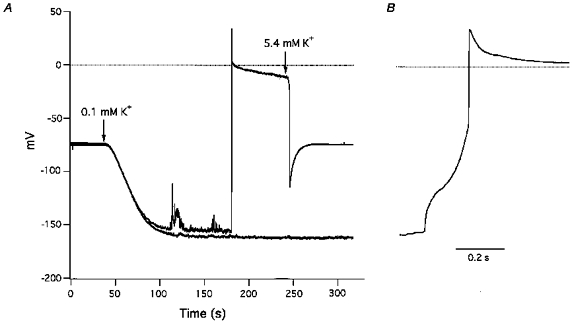
A, switching from 5.4 to 0.1 mm K+ solution at the first arrow caused gradual hyperpolarization, irregular, transient depolarizations and an action potential with a sustained plateau. The action potential was terminated by increasing [K+]o to 5.4 mm at the second arrow. Thereafter, introduction of 0.1 mm K+ solution together with 0.1 mm La3+ at the first arrow caused greater hyperpolarization, smaller transient depolarizations, and no action potential (lower sweep). B, rising phase of the action potential (shown in panel A) depicted on an expanded time scale.
Figure 5. Low K+-induced membrane potential changes in Na+-free and Cl−-free solutions and in the presence of 10 mm[EGTA]i.
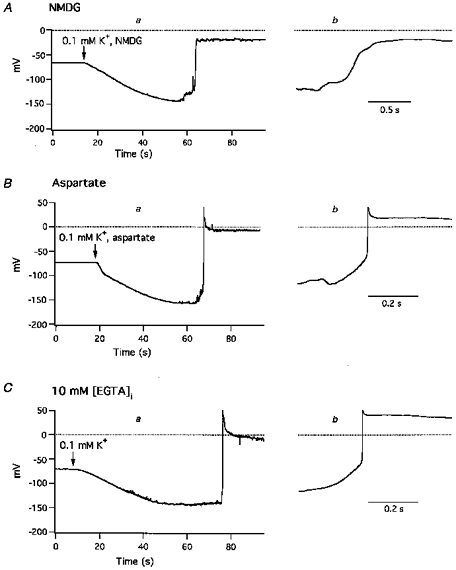
A, effect of 0.1 mm[K+]o in the absence of extracellular Na+; at the arrow, superfusion was switched from normal Tyrode solution to low K+, Na+-free (NMDG) solution. B, effect of 0.1 mm[K+]o in the absence of extracellular Cl−; at the arrow, superfusion was switched from normal Tyrode solution to low K+, Cl−-free (aspartate) solution. C, 0.1 mm[K+]o solution was introduced at the arrow, and membrane potentials were recorded with a pipette containing 10 mm EGTA. Introduction of 0.1 mm[K+]o caused hyperpolarization, irregular, transient depolarizations and sustained action potentials. Panels labelled a depict changes in Vrest values and an action potential on a slow time scale, and panels labelled b depict the rising phases of the action potential on a faster time scale.
Depression of transient depolarizations and action potentials by La3+
Because La3+ blocked hyperpolarization-activated inward currents (see below), the effects of La3+ on low K+-induced depolarizations and action potentials were examined by adding 0.1 mm La3+ to 0.1 mm K+ solution. Figure 4 shows a typical result recorded from a cell in which the first reduction of [K+]o to 0.1 mm elicited hyperpolarization, transient dopolarizations, and an action potential. In twenty-one other cells, a second application of 0.1 mm K+ solution elicited similar depolarizations (20.1 ± 4.1 mV vs. second challenge, 14.6 ± 1.8 mV; n = 21) and hyperpolarizations (−121.1 ± 6.1 vs.−115.9 ± 5.4 mV) and slightly decreased the action potential firing frequency (66.7 %). In contrast, when 0.1 mm K+ solution was applied a second time together with 0.1 mm La3+, depolarizations were much smaller, action potentials were blocked and hyperpolarizations were larger (Fig. 4A, Table 1C).
Effect of Na+ and Cl− replacement on low K+-induced depolarization
To study the ionic mechanism of low K+-induced depolarizations, external Na+ and Cl− concentrations were reduced by replacing them with larger surrogates. When sodium ions were replaced on a mole for mole basis with NMDG, reduction of [K+]o to 0.1 mm caused hyperpolarization and the appearance of irregular transient depolarizations similar to those seen when sodium ions were present (Fig. 5A, Table 1D). However, action potentials elicited in NMDG solution had a mean maximum rate of rise of only 5.1 ± 1.7 V s−1 (n = 11), much slower than when sodium ions were present (Fig. 5Ab). Another characteristic of low K+-induced action potentials in Na+-free solution was the frequent absence of an overshoot, although sustained plateaux were always seen (Fig. 5A). Replacement of Cl− with aspartate had little effect on 0.1 mm[K+]o-induced hyperpolarization, transient depolarizations or action potentials (Fig. 5B, Table 1E).
Effect of internal Ca2+ concentration on low K+-induced depolarizations
The effect of [Ca2+]i on low K+-induced depolarizations was examined by dialysing cells with EGTA or BAPTA from the pipette solution. In the presence of 10 mm[EGTA]i, or [BAPTA]i a more rapid chelating agent, 0.1 mm K+ solution elicited hyperpolarizations, transient depolarizations and elicited action potentials with amplitudes and frequencies similar to those seen under control conditions (Fig. 5C a and b, Table 1F and G). Nevertheless, for reasons which are not known, the hyperpolarization produced by 0.1 mm[K+]o was slightly, but significantly (P < 0.05), larger in the presence of 10 mm BAPTA.
Caffeine completely blocks transient depolarizations ascribable to cyclic Ca2+ release from sarcoplasmic reticulum (SR) in guinea-pig ventricular myocytes (Matsuda et al. 1982). Therefore, to determine the extent to which Ca2+ release from the SR contributes to the effect of reduced [K+]o, cells were pretreated with caffeine. In the presence of 10 mm caffeine and 0.1 mm[EGTA]i, 0.3 or 0.1 mm[K+]o solution induced hyperpolarizations of −138.9 ± 2.8 mV (n = 5), transient depolarizations of 35.6 ± 10.5 mV and fired action potentials in 80.0 % of trials. Thus, even a large concentration of caffeine did not depress low K+-induced depolarizations.
Activation of irregular inward currents by hyperpolarization
We hypothesized that the low K+-induced transient depolarizations were triggered by inward currents activated by the hyperpolarization. To confirm this possibility, voltage clamp experiments were performed. Figure 6 illustrates the membrane currents elicited by a series of 60 s hyperpolarization steps with increments of 10 mV applied from a holding potential of −100 mV. In the presence of 0.3 mm K+, steps to −110 or −120 mV were not accompanied by significant inward currents (Fig. 6A). Larger hyperpolarizations to −130 mV elicited brief inward current pulses, and at −140 mV, the amplitudes of the inward currents became larger than the outward-going IK1, resulting in net inward currents that caused depolarizations starting from this potential. The frequency and amplitude of the hyperpolarization-activated inward currents (Ihi) increased when membranes were further hyperpolarized to −150 and −160 mV. The same hyperpolarization steps applied in the presence of 0.1 mm[K+]o producing smaller steady currents in both the outward and inward directions than when applied in the presence of 0.3 mm K+, reflecting the decrease in IK1 conductance (Fig. 6B). Although all voltage steps were associated with Ihi in the presence of 0.1 mm[K+]o in this cell, their frequency and amplitude increased with increasing hyperpolarization, and net inward currents appeared between −130 and −150 mV. Display of Ihi on an expanded time scale showed that they consisted of flickering, irregular inward currents with variable amplitudes in the range of several tens of pico amperes (Fig. 6C). The presence of 10 mm EGTA (n = 19) in the pipette solution and replacement of Na+ with NMDG (n = 6), or Cl− with aspartate (n = 9), did not affect the activation of Ihi in the presence of 0.1 mm[K+]o.
Figure 6. Inward currents elicited by hyperpolarizations.
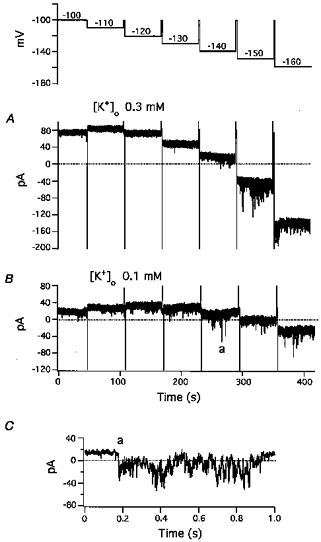
Command potentials for A and B are shown in the uppermost trace. From a holding potential of −100 mV, 60 s hyperpolarizing pulses were applied in 10 mV increments from −110 to −160 mV. A, currents in the presence of 0.3 mm[K+]o; B, currents in the presence of 0.1 mm[K+]o. Steady-state currents were primarily determined by IK1. Both inward and outward IK1 were much larger in the presence of 0.3 mm[K+]o. C, expanded sweep of the inward current labelled a in panel B demonstrating the irregular time course of the inward current.
Inhibition of hyperpolarization-activated inward currents by La3+
In preliminary studies, we ascertained that Mn2+, Ni2+, Cd2+, La3+ and Gd3 + all depressed Ihi. Among these metal cations, La3+ was the most effective Ihi blocker, therefore we utilized it as a tool to block Ihi. In a typical experiment in the presence of 0.1 mm[K+]o (Fig. 7), hyperpolarization steps with increments of 10 mV and durations of 30 s were applied from a holding potential of −80 mV in the presence and absence of 0.1 mm La3+. Small inward currents, several tens of picoamps in amplitude, appeared at membrane potentials between −129 and −158 mV, and a large inward current (> 1000 pA) appeared when the membrane was hyperpolarized to −177 mV (Fig. 7Aa and B). When the membrane was depolarized to the holding potential, there was an initial rapid decrease in the large Ihi due to the reduced driving force followed by a later, slower decline in Ihi that reflected the decline in conductance (Fig. 7B). Addition of La3+ inhibited the small Ihi with little effect on IK1 and prevented the appearance of the large Ihi (Fig. 7Ab).
Figure 7. Blockade by La3+ of hyperpolarization-activated inward currents.
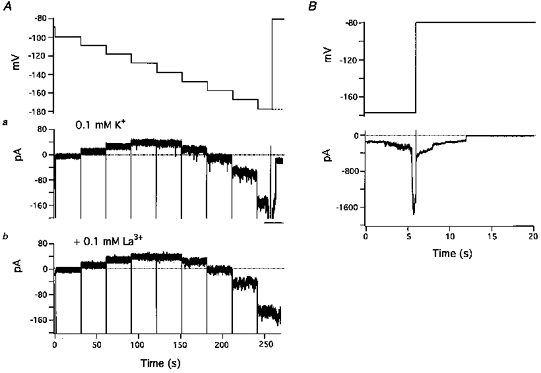
A, effect of La3+ on small noisy inward currents and IK1. The uppermost trace shows the command potentials. Membrane potential was hyperpolarized in a stepwise manner with a series of 30 s pulses in 10 mV increments from a holding potential of −80 mV. In the absence of La3+, the largest hyperpolarization step was interrupted because of the occurrence of a large inward current. The dashed line indicates the potential of the last step. Aa (control): small transient inward currents appeared in steps 4 to 9. Larger inward currents at −177 mV (step 9) were offscale at this gain (bar). Ab, in the presence of 0.1 mm[K+]o and 0.1 mm La3+ hyperpolarization-activated inward currents were suppressed. B, large inward current in Aa displayed on an expanded time scale and with reduced amplification.
Hyperpolarization-activated inward currents in the presence of 5.4 mm[K+]o
The effects of large hyperpolarizations were also examined in the presence of normal 5.4 mm[K+]o with 10 mm BAPTA in the pipette solution. When elicited by a series of 30 s hyperpolarization steps, IK1 was large and increased successively during hyperpolarization steps between −80 and −140 mV (Fig. 8). IK1 then decreased stepwise with further increases in hyperpolarization. This decrease in IK1 is explainable as resulting from the voltage-dependent block of the inward rectifier K+ current by external Na+ (Standen & Stanfield, 1979; Harvey & Ten Eick, 1989). Distinct Ihi were elicited by hyperpolarization steps to −170 mV; Ihi with amplitudes of several nanoamps appeared at −190 mV, and Ihi were offscale at −200 mV (Fig. 8A). In contrast, in the presence of 0.1 mm La3+, Ihi was negligible except for small currents elicited at −200 mV (Fig. 8B). In the presence of 5.4 mm[K+]o and 10 mm[BAPTA]i, large Ihi were elicited by 30 s hyperpolarization steps below −200 mV in seven out of nine cells, and in four trials, 0.1 mm La3+ depressed them all.
Figure 8. Hyperpolarization-activated inward currents (Ihi) elicited in the presence of 5.4 mm[K+]o.
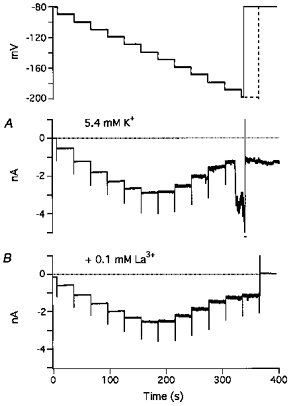
Command potentials for A and B are shown in the uppermost trace. From a holding potential of −80 mV, 30 s hyperpolarizing pulses were applied in 10 mV increments from −80 to −200 mV. Same voltage pulses were applied up to −190 mV but longer pulses were used at −200 mV in B (dashed line). A, currents elicited in the presence of 5.4 mm[K+]o. Ihi appeared as very small, noisy inward currents in all steps above −150 mV, rapidly increased in amplitude at −170 mV, and appeared as much larger currents at −190 mV. At −200 mV, Ihi (indicated by the bar) was offscale. Following depolarization to the holding potential, large, sustained, inward currents remained. B, in the presence of 5.4 mm[K+]o and 0.1 mm La3+, small Ihi appeared at the largest hyperpolarization.
Voltage dependence of Ihi
To obtain the voltage dependence of Ihi, peak amplitudes, estimated as the difference from the steady-state current during 30 s hyperpolarization steps, were plotted as a function of membrane potential (Fig. 9). The inward currents were usually small at potentials less negative than −120 mV. Increasing membrane potential to between −130 and −160 mV gradually increased inward current amplitudes and frequency. Further increases in membrane potential to −170 mV elicited Ihi with amplitudes of more than 1000 pA. La3+ (0.1 mm) inhibited the inward currents at all potentials (Fig. 9). The inhibition was statistically significant at the majority of potentials more negative than −110 mV. However, at membrane potentials of −140 and −150 mV, where large inward currents appeared sporadically, statistical significance was not obtained because of the large s.e.m. in the absence of La3+. Nevertheless, La3+ inhibited the peak amplitudes of Ihi evoked at −140 mV in eight out of ten experiments, and at −150 mV, La3+ inhibited Ihi in all ten experiments.
Figure 9. Voltage dependence and La3+-induced suppression of hyperpolarization-activated inward currents (Ihi).
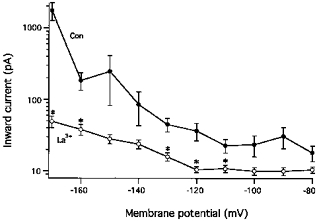
The peak amplitudes of Ihi, estimated as the deflection from the steady-current level during 30 s clamp steps, are plotted as a function of membrane potential. Data are taken from 10 experiments carried out in the presence of 0.1 mm[K+]o and in the absence (•) or presence (○) of 0.1 mm La3+. Mean values and s.e.m. are depicted. Significant differences between the paired data in the presence and the absence of La3+ are denoted by *.
DISCUSSION
We found that large reductions of [K+]o, which caused large increases in Vrest values, generated irregular transient depolarizations and fired action potentials in mammalian ventricular myocytes. The transient depolarizations occurred under conditions that suppress increases in [Ca2+]i. Correspondingly, voltage-clamping membranes at hyperpolarized potentials activated irregular inward currents both at low and normal [K+]o, and in the presence of low [K+]o their amplitudes were larger than those of the outward-going IK1. The ionic mechanism of the transient depolarizations and the involvement of electroporation in mediating hyperpolarization-activated inward currents (Ihi) will be discussed.
The influence of low [K+]o on resting potential, IK1 and transient depolarizations
Reduction of [K+]o from 5.4 to 1 mm hyperpolarized membranes to a degree consistent with the expected negative shift in EK (Fig. 2A). The failure of [K+]o reduction to produce comparable hyperpolarization in myocardial cells and Purkinje fibres in previous studies (Reiter et al. 1971; Eisner & Lederer, 1979; Sutko & Kenyon, 1983) is explainable by the non-homogeneous distribution of K+ within the intercellular spaces of multicellular preparations. In our study, the hyperpolarization produced by 0.1 mm[K+]o was considerably smaller than the shift in EK (Fig. 2A). This deviation of Vrest from EK is ascribable, in part, to the occurrence of Ihi, since La3+ hyperpolarized Vrest by inhibiting Ihi with little change in IK1 (Figs 4, 7 and 8, Table 1C).
IK1 conductance was decreased by reduction of [K+]o, and the voltage dependence of IK1 was shifted in a negative direction (Noble, 1979; Hille, 1992). Thus, in the presence of 0.1 mm[K+]o, even small Ihi could produce the net inward current necessary for depolarization from the hyperpolarized potential (Fig. 6). The time courses of the transient depolarizations were slow and irregular, indicating that they were compound potentials composed of numerous small depolarizations resulting from asynchronous inward currents (Fig. 1). The reduced IK1 conductance should have increased the membrane time constant, thereby facilitating summation of the component depolarizations and resulting in large, compound depolarizing responses. This explains, in part, the large increase in depolarization amplitude that occurred when [K+]o was decreased from 0.3 to 0.1 mm (Fig. 2).
Activation of irregular inward currents by hyperpolarization
In ventricular myocytes, delayed after-depolarizations (DADs) triggered by action potentials exhibit irregular depolarizations near the Vrest. In Purkinje fibres and myocardial cells, DADs are produced by transient inward currents generated by excessive release of Ca2+ from overloaded SR (Ferrier, 1976; Eisner & Lederer, 1979; Matsuda et al. 1982; Cannell & Lederer, 1986). The Ca2+ overload also causes fluctuations in Vrest without excitation in myocardial cells (Matsuda et al. 1982). In the present study, a large number of experiments were carried out in the presence of 0.1 mm[K+]o and 0.1 mm[EGTA]i. If the [K+]o necessary to produce half-maximal activation of the Na+ pump is near 1 mm in rabbit cardiac myocytes, as it is in rat and guinea-pig cells (Hermans et al. 1995), 0.1 mm[K+]o should cause considerable accumulation of Na+ in myocytes and, in turn, increase [Ca2+]i via Na+-Ca2+ exchange. However, neither internal dialysis of 10 mm EGTA or BAPTA nor application of caffeine depressed the transient depolarizations. In addition, the depolarization also occurred in the absence of extracellular Na+, which is indispensable as the charge carrier for the inward Na+-Ca2+ exchange current (Kimura et al. 1987). Thus, we conclude that transient inward currents triggered by release of Ca2+ from SR played little role in the transient depolarizations observed in the present study.
Ihi were characterized by hyperpolarization-dependent activation, an irregular time course and suppression by La3+. Ihi amplitudes gradually increased with increasing membrane potential. At potentials ranging from −120 and −200 mV, Ihi increased from several tens to several hundred picoamps and then further to several nanoamps (Figs 6–9). The probability that Ihi would occur also appeared to increase steeply with increasing hyperpolarization. The present study showed that the irregular time course of Ihi is reflected in the irregular time course of the low K+-induced transient depolarizations; further kinetic studies will be necessary, however, to quantify the voltage and time dependence of Ihi.
Involvement of electroporation and its inhibition by La3+
Their hyperpolarization-dependent activation and irregular time course suggested that Ihi were produced by transient rupture of cell membranes caused by the strong electric field associated with large hyperpolarizations. Cell membrane ruptures produced by electroporation have large pores allowing permeation of large molecules and, therefore, are not selective for any particular organic and inorganic ions (Jones et al. 1987; Teruel & Meyer, 1997). The fact that low [K+]o activated irregular depolarizations and inward currents in the presence of both NMDG and aspartate is consistent with the non-selective nature of the conductance induced by hyperpolarization.
Because the charge carrier for Ihi probably permeates through non-selective pores, it seems unlikely that the ions pass through the pores via binding to specific sites in a manner analogous to Ca2+ permeation through Ca2+ channels. Thus, it also seems unlikely that La3+ inhibits Ihi in the same way as it inhibits the voltage-gated Ca2+ current, i.e. by competitively binding to a Ca2+-binding site within the channel (Lansman et al. 1986). On the other hand, La3+ also accelerates fusion of acidic phospholipid membranes more effectively than Ca2+ and H+ by inducing a conformational change in the head region of the phospholipid that makes the membrane surface more hydrophobic (Ohki & Duax, 1986). La3+-induced increases in hydrophobicity may also accelerate the closure of electroporated pores. In addition, La3+-induced lipid packing, which is known to decrease ion channel conductance (Chanturiya & Nikoloshina, 1994), may also be involved in the inhibition of Ihi.
Implications of Vrest-dependent electroporation
Compared with the outward-going IK1, which may be as large as 0.5 nA in rabbit ventricular cells (Shimoni et al. 1992), Ihi was very small at normal Vrest values of −80 to −90 mV (Fig. 9). Therefore, it may be that Vrest-dependent electroporation has little direct effect on the electrical activity of ventricular myocytes. Nevertheless, because the pores are highly permeable to calcium and sodium ions, influx of those ions should be driven by the Vrest values determined by IK1 and may contribute to increased [Ca2+]i and indirectly affect both the electrical and mechanical activities of the myocytes. Moreover, although at normal Vrest in the presence of 5.4 mm[K+]o, the probability of inducing Ihi larger than the peak outward-going IK1 within a period of 30 s would seem to be very small, it may be considerable over periods of days or weeks. The large surface area of the numerous cardiac myocytes connected by intercellular electrical pathways could also increase the probability. Therefore, it may be that some sporadic extrasystoles are triggered by Vrest-dependent electroporation. Indeed, the reduction of IK1 elicited by noradrenaline via α1-adrenoceptors in rabbit ventricular myocytes (Fedida et al. 1991) could facilitate such arrhythmogenic excitation in that species.
During cardiac ischaemia, lysophosphatidylcholine (LPC), an amphiphilic lipid constituent of cell membranes, is released. LPC decreases IK1 by decreasing the single channel conductance (Kiyosue & Arita, 1986; Sato et al. 1993). LPC has also been reported to open non-selective pores permeable to Na+, K+, Ca2+ and NMDG, but not to aspartate, in guinea-pig ventricular cells (Magishi et al. 1996). Furthermore, in artificial lipid bilayers, LPC stabilizes hydrophilic pores produced by strong electric fields (Glaser et al. 1988). Thus, it may be that LPC promotes arrhythmogenic, Vrest-dependent electroporation in ischaemic hearts.
Finally, the present study indicates that electroporation induced by superfusion with low K+ solution is a potentially useful technique for introducing macromolecules such as cDNA and mRNA into cells without having to apply electrical pulses.
Acknowledgments
This research was supported by a Grant-in-Aid for Exploratory Research (No. 09877012) from the Ministry of Education, Science, Sports and Culture.
References
- Akuzawa M, Tateyama M, Masumiya H, Sonoda S, Ochi R. Inward current pulses elicited by hyperpolarization to trigger action potential in ventricular myocytes. Journal of Molecular and Cellular Cardiology. 1996;28:A31. [Google Scholar]
- Cannell MB, Lederer WJ. The arrhythmogenic current ITI in the absence of electrogenic sodium-calcium exchange in sheep cardiac Purkinje fibres. The Journal of Physiology. 1986;374:201–219. doi: 10.1113/jphysiol.1986.sp016075. [DOI] [PMC free article] [PubMed] [Google Scholar]
- Chanturiya AN, Nikoloshina HV. Correlations between changes in membrane capacitance induced by changes in ionic environment and the conductance of channels incorporated into bilayer lipid membranes. Journal of Membrane Biology. 1994;137:71–77. doi: 10.1007/BF00234999. [DOI] [PubMed] [Google Scholar]
- Eisner DA, Lederer WJ. Inotropic and arrhythmogenic effects of potassium-depleted solutions on mammalian cardiac muscle. The Journal of Physiology. 1979;294:255–277. doi: 10.1113/jphysiol.1979.sp012929. [DOI] [PMC free article] [PubMed] [Google Scholar]
- Fedida D, Braun AP, Giles WR. α1-Adrenoceptors reduce background K+ current in rabbit ventricular myocytes. The Journal of Physiology. 1991;441:673–684. doi: 10.1113/jphysiol.1991.sp018772. [DOI] [PMC free article] [PubMed] [Google Scholar]
- Ferrier GR. The effects of tension on acetylstrophanthidin-induced transient depolarizations and aftercontractions in canine myocardial and Purkinje tissues. Circulation Research. 1976;38:156–162. doi: 10.1161/01.res.38.3.156. [DOI] [PubMed] [Google Scholar]
- Glaser RW, Leikin SL, Chernomordik LV, Pastushenko VF, Sokirko AI. Reversible electrical breakdown of lipid bilayers: formation and evolution of pores. Biochimica et Biophysica Acta. 1988;940:275–287. doi: 10.1016/0005-2736(88)90202-7. [DOI] [PubMed] [Google Scholar]
- Hamill OP, Marty A, Neher E, Sakmann B, Sigworth FJ. Improved patch-clamp techniques for high-resolution current recording from cells and cell-free membrane patches. Pflügers Archiv. 1981;391:85–100. doi: 10.1007/BF00656997. [DOI] [PubMed] [Google Scholar]
- Harvey RD, Ten Eick RE. Voltage-dependent block of cardiac inward-rectifying potassium current by monovalent cations. Journal of General Physiology. 1989;94:349–361. doi: 10.1085/jgp.94.2.349. [DOI] [PMC free article] [PubMed] [Google Scholar]
- Hermans AN, Glitsch HG, Verdonck F. The antagonistic effect of and dihydro-ouabain on the Na+ pump current of single rat and guinea-pig cardiac cells. The Journal of Physiology. 1995;384:617–628. doi: 10.1113/jphysiol.1995.sp020691. [DOI] [PMC free article] [PubMed] [Google Scholar]
- Hille B. Ionic Channels of Excitable Membranes. 2. Sunderland, Massachusetts, USA: Sinauer Associates Inc.; 1992. [Google Scholar]
- Jones JL, Jones RE, Balasky G. Microlesion formation in myocardial cells by high-intensity electric field stimulation. American Journal of Physiology. 1987;253:H480–486. doi: 10.1152/ajpheart.1987.253.2.H480. [DOI] [PubMed] [Google Scholar]
- Kawashima Y, Ochi R. Voltage-dependent decrease in the availability of single calcium channels by nitrendipine in guinea-pig ventricular cells. The Journal of Physiology. 1988;402:219–235. doi: 10.1113/jphysiol.1988.sp017201. [DOI] [PMC free article] [PubMed] [Google Scholar]
- Kimura J, Miyamae S, Noma A. Identification of sodium-calcium exchange current in single ventricular cells of guinea-pig. The Journal of Physiology. 1987;384:199–222. doi: 10.1113/jphysiol.1987.sp016450. [DOI] [PMC free article] [PubMed] [Google Scholar]
- Kiyosue T, Arita M. Effects of lysophosphatidylcholine on resting potassium conductance on isolated guinea pig ventricular cells. Pflügers Archiv. 1986;406:296–302. doi: 10.1007/BF00640917. [DOI] [PubMed] [Google Scholar]
- Knisley SB, Grant AO. Asymmetrical electrically induced injury of rabbit ventricular myocytes. Journal of Molecular Cellular Cardiology. 1995;27:1111–1122. doi: 10.1016/0022-2828(95)90047-0. [DOI] [PubMed] [Google Scholar]
- Kodama I, Shibata N, Sakuma I, Mitsui K, Iida M, Suzuki R, Fukui Y, Hosoda S, Toyama J. Aftereffects of high-intensity DC stimulation on the electromechanical performance of ventricular muscle. American Journal of Physiology. 1994;267:H248–258. doi: 10.1152/ajpheart.1994.267.1.H248. [DOI] [PubMed] [Google Scholar]
- Kubo Y. Two aspects of the inward rectification mechanism. Effects of cytoplasmic blockers and extracellular K+ on the inward rectifier K+ channel. Japanese Heart Journal. 1996;37:631–641. doi: 10.1536/ihj.37.631. [DOI] [PubMed] [Google Scholar]
- Lansman JB, Hess P, Tsien RW. Blockade of current through single calcium channels by Cd2+, Mg2+ and Ca2+. Voltage and concentration dependence of calcium entry into the pore. Journal of General Physiology. 1986;88:321–347. doi: 10.1085/jgp.88.3.321. [DOI] [PMC free article] [PubMed] [Google Scholar]
- Magishi K, Kimura J, Kubo Y, Abiko Y. Exogenous lysophosphatidylcholine increases non-selective cation current in guinea-pig ventricular myocytes. Pflügers Archiv. 1996;432:345–350. doi: 10.1007/s004240050142. [DOI] [PubMed] [Google Scholar]
- Matsuda H, Noma A, Kurachi Y, Irisawa H. Transient depolarization and spontaneous voltage fluctuations in isolated single cells from guinea pig ventricles. Calcium-mediated membrane potential fluctuations. Circulation Research. 1982;51:142–151. doi: 10.1161/01.res.51.2.142. [DOI] [PubMed] [Google Scholar]
- Neher E. Correction for liquid junction potentials in patch clamp experiments. Methods in Enzymology. 1992;207:123–131. doi: 10.1016/0076-6879(92)07008-c. [DOI] [PubMed] [Google Scholar]
- Noble D. The Initiation of the Heartbeat. 2. Oxford: Clarendon Press; 1979. [Google Scholar]
- Ohki S, Duax J. Effects of cations and polyamines on the aggregation and fusion of phosphatidylserine membranes. Biochimica et Biophysica Acta. 1986;861:177–186. doi: 10.1016/0005-2736(86)90577-8. [DOI] [PubMed] [Google Scholar]
- O'Neil RJ, Tung L. Cell-attached patch clamp study of the electropermeabilization of amphibian cardiac cells. Biophysical Journal. 1991;59:1028–1039. doi: 10.1016/S0006-3495(91)82318-9. [DOI] [PMC free article] [PubMed] [Google Scholar]
- Reiter M, Seibel K, Stickel FJ. Sodium dependence of the inotropic effect of a reduction in extracellular potassium concentration. Naunyn-Schmiedeberg's Archives of Pharmacology. 1971;268:361–378. doi: 10.1007/BF00997062. [DOI] [PubMed] [Google Scholar]
- Sakmann B, Trube G. Conductance properties of single inwardly rectifying potassium channels in ventricular cells from guinea-pig heart. The Journal of Physiology. 1984;347:641–657. doi: 10.1113/jphysiol.1984.sp015088. [DOI] [PMC free article] [PubMed] [Google Scholar]
- Sato T, Arita M, Kiyosue T. Differential mechanism of block of palmitoyl lysophosphatidylcholine and of palmitoylcarnitine on inward rectifier K+ channels of guinea-pig ventricular myocytes. Cardiovascular Drugs and Therapy. 1993;7:575–584. doi: 10.1007/BF00877623. [DOI] [PubMed] [Google Scholar]
- Shimoni Y, Clark RB, Giles WR. Role of inwardly rectifying potassium current in rabbit ventricular action potential. The Journal of Physiology. 1992;448:709–727. doi: 10.1113/jphysiol.1992.sp019066. [DOI] [PMC free article] [PubMed] [Google Scholar]
- Standen NB, Stanfield PR. Potassium depletion and sodium block of potassium currents under hyperpolarization in frog sartorius muscle. The Journal of Physiology. 1979;294:497–520. doi: 10.1113/jphysiol.1979.sp012943. [DOI] [PMC free article] [PubMed] [Google Scholar]
- Sutko JL, Kenyon JL. Ryanodine modification of cardiac muscle responses to potassium-free solutions. Evidence for inhibition of sarcoplasmic reticulum calcium release. Journal of General Physiology. 1983;82:385–404. doi: 10.1085/jgp.82.3.385. [DOI] [PMC free article] [PubMed] [Google Scholar]
- Teruel MN, Meyer T. Electroporation-induced formation of individual calcium entry sites in the cell body and processes of adherent cells. Biophysical Journal. 1997;73:1785–1796. doi: 10.1016/S0006-3495(97)78209-2. [DOI] [PMC free article] [PubMed] [Google Scholar]
- Tovar O, Tung L. Electroporation and recovery of cardiac cell membrane with rectangular voltage pulses. American Journal of Physiology. 1992;263:H1128–1136. doi: 10.1152/ajpheart.1992.263.4.H1128. [DOI] [PubMed] [Google Scholar]
- Tsong TY. Electroporation of cell membranes. Biophysical Journal. 1991;60:297–306. doi: 10.1016/S0006-3495(91)82054-9. [DOI] [PMC free article] [PubMed] [Google Scholar]
- Weaver JC. Electroporation: a general phenomenon for manipulating cells and tissues. Journal of Cellular Biochemistry. 1993;51:426–35. doi: 10.1002/jcb.2400510407. [DOI] [PubMed] [Google Scholar]