Abstract
Computational modeling is a useful tool for spelling out hypotheses in cognitive neuroscience and testing their predictions in artificial systems. Here we describe a series of simulations involving neural networks which learned to perform their task by self-organizing their internal connections. The networks controlled artificial agents with an orienting eye and an arm. Agents saw objects with various shapes and locations, and learned to press a key appropriate to their shape. The results showed that: (1) Despite being able to see the entire visual scene without moving their eye, agents learned to orient their eye toward a peripherally presented object. (2) Neural networks whose hidden layers were previously partitioned into units dedicated to eye orienting and units dedicated to arm movements learned the identification task faster and more accurately than non-modular networks. (3) Nonetheless, even non-modular networks developed a similar functional segregation trough self-organization of their hidden layer. (4) After partial disconnection of the hidden layer from the input layer, the lesioned agents continued to respond accurately to single stimuli, wherever they occurred, but on double simultaneous stimulation they oriented toward and responded only to the right-sided stimulus, thus simulating extinction/neglect. These results stress the generality of the advantages provided by orienting processes. Hard-wired modularity, reminiscent of the distinct cortical visual streams in the primate brain, provided further evolutionary advantages. Finally, disconnection is likely to be a mechanism of primary importance in the pathogenesis of neglect and extinction symptoms, consistent with recent evidence from animal studies and brain-damaged patients.
Keywords: Computer Simulation, Humans, Neural Networks (Computer), Orientation, physiology, Perceptual Disorders, physiopathology, Psychomotor Performance, physiology, Visual Pathways, physiology
Keywords: Attention, Orienting, Genetic Algorithm, Brain lesions, Neglect
Introduction
Biological organisms live in an environment cluttered with a multitude of objects. To behave in a coherent and goal-driven way, organisms need to select stimuli appropriate to their goals, to quickly react to unexpected, dangerous predators. On the other hand, because of capacity limitations, they must be capable of ignoring other, less important objects. Thus, objects in the world compete for recruiting the organism’s attention, i.e. to be the focus of the organism’s subsequent behavior. Neural attentional processes resolve the competition (Desimone & Duncan, 1995), on the basis of the organisms’ goals and of the sensory properties of the objects, by giving priority to some objects over others. In ecological settings, agents usually orient towards important stimuli by turning their gaze, head and trunk towards them (Sokolov, 1963). This is done in order to align the stimulus with the part of the sensory surface with highest resolution (e.g., the retinal fovea). This allows further perceptual processing of the detected stimulus, for example its classification as a useful or as a dangerous object. Orienting movements are thus a typical form of “embodied” cognition (Ballard et al., 1997), that is a process in which body movements are necessary to the processing of information. Indeed, orienting movements make possible an optimization of processing resources, with a segregation of mechanisms dedicated to simple detection from resources performing more complex identification tasks, based on object shape, color, etc.
Not surprisingly, damage to the neural mechanisms of attention may result in severe disability. For example, human brain-damaged patients may become unable to process several stimuli when simultaneously presented (as in extinction and simultagnosia), or stimuli arising in a region of space contralateral to the brain lesion (spatial neglect). In these cases, a “wrong” object (that is, an object inappropriate to the current behavioral task) may win the competition and capture the patient’s attention. Thus, when patients with left unilateral neglect are presented with bilateral objects, they compulsorily orient their gaze towards right-sided stimuli, as if their gaze were “magnetically” captured by these stimuli (Gainotti et al., 1991); afterwards, patients find it difficult to disengage their attention from these stimuli in order to explore the left part of space (Bartolomeo & Chokron, 2002; D’Erme et al., 1992; Losier & Klein, 2001; Posner et al., 1984), so that their space exploration may remain confined to a few right-sided objects (Bartolomeo et al., 1999). Thus, unilateral neglect represents a typical case of a deficit of “embodied” attention, in keeping with proposals of shared mechanisms between movements of gaze and shifts of spatial attention (Hafed & Clark, 2002; Hoffman & Subramaniam, 1995; Rizzolatti et al., 1994).
Understandably, the brain mechanisms of attention and their impairments have evoked great interest in cognitive neuroscience. The most direct methods to explore these issues are neurophysiological studies in animals and neuroimaging and lesion studies in humans (see, e.g., Parasuraman, 1998). Computer simulations can complement these methods by constraining hypotheses about the normal and disordered function of attentional processes. Computational models force experimenters to make explicit assumptions and hypotheses, and to implement their details. The subsequent analysis of results can be conducted at a level of detail which would be difficult to achieve in other domains of cognitive neuroscience. The “ecological”, or Artificial Life approach adds further power to the connectionist modeling by means of simulating not only the brain and the nervous system, but also the body and the environment of artificial organisms (Langton, 1989; Parisi et al., 1990). Here we simulated artificial agents with an orienting eye and an arm. Agents saw different objects (smaller or larger) in various parts of their visual field. In order to obtain fitness, agents had to identify the object shape, by pressing the appropriate key with their arm (Fig. 1). It is important to note that only the correct identification of the target object (i.e. pressing the correct key) was rewarded with fitness. No particular strategy to achieve object identification, including orienting movements, was encouraged by the fitness function.
Figure 1.
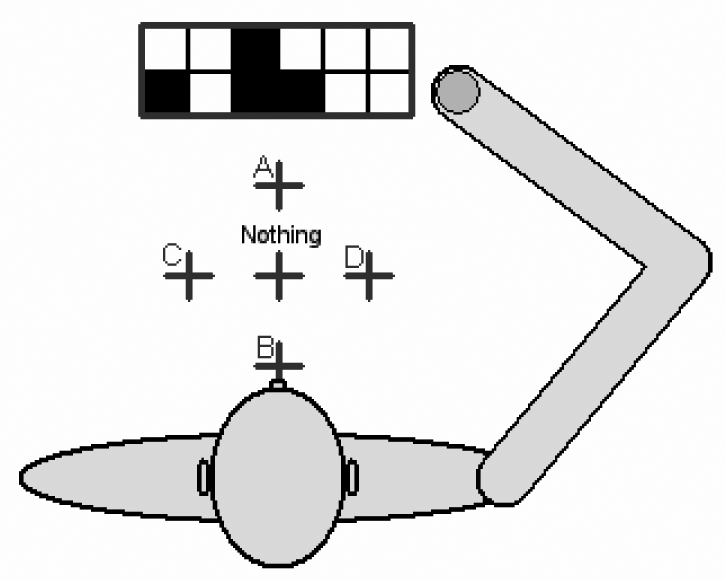
The agent with the display and the five response keys. The plus signs designate the five possible responses (objects A–D or no object presented).
Two objects could be simultaneously presented in different locations. In this case, the agents had to respond to the identity of the larger object. The agents’ behavior was controlled by artificial neural networks, whose connection weights were initially random. The best-performing agents reproduced, and their offspring had a similar weight matrix, except for 15% random mutations. After several thousands generations, the agents learned to perform their task. Thus, the neural networks self-organized their internal connections according to the principles of Darwinian evolution (Mitchell, 1997).
Methods
Each artificial agent had a two-segment arm, which it could move by varying the angle between shoulder and arm and the angle between arm and forearm. In front of the agent there was a display, divided up into 6*2 cells, and five keys (see Figure 1). There were 4 possible objects, which differed in size and shape (Figure 2). On any given trial, they could appear either one at a time or two at a time (one large and one small). The display was divided into a central portion, a left portion, and a right portion. The single object or the two objects seen during a trial could be located in any of the three portions of the display, with no more than one object per portion. Thus, there were 36 possible different configurations of the display (Figure 3), plus a further condition with no object presented.
Figure 2.

The four stimulus objects.
Figure 3.
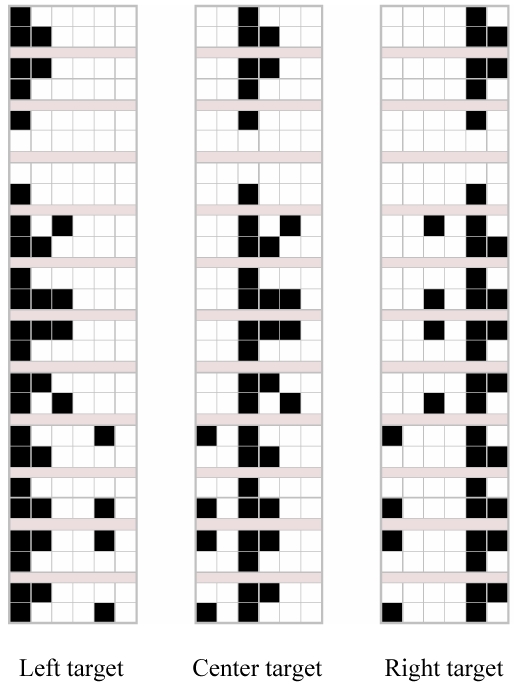
The 36 configurations of the screen that can be seen by the agent on any given trial (in addition, there was the case in which no object appears).
The agent responded to each of the displays by moving its arm in order to reach and press the appropriate key. There were 5 keys with the spatial arrangement described in Figure 1. Four of the 5 keys corresponded to each of the 4 object identities, the fifth (central) key was the response to an empty display. For single object presentations, the agent had to press the key corresponding to the object, whatever its position on the display. For double presentations, the agent had to press the key corresponding to the shape of the larger object, whatever the position of the two objects. When no target was presented, the central key had to be pressed.
The agent’s behavior was controlled by a feedforward multilayer artificial neural network using a logistic activation function:
| (1) |
where a(i) is the activation function of the unit i, and Neti is the net input of the unit, calculated as follows:
| (2) |
where oj is the output (activation) of the j-th unit connected to i, Wij is the weight of the connection between i and j, and bias(i) is the bias of the unit i.
The neural network was composed of 12 visual input units encoding the current content of the retina (4 units for the left portion of the retina, 4 units for the central portion, and 4 units for the right portion). The 4 objects were encoded by setting to 1 the input units corresponding to the filled cells of Figure 2, and setting the remaining units to 0. There were two additional proprioceptive input units, which encoded the current angle of the forearm with the shoulder and of the arm with the forearm. The two angles were measured in radiants in the interval between 0 and 3.14; these values became the activation levels of the two proprioceptive units. The proprioceptive units informed the agent about the current position of the arm, which could not be seen by the visual units.
The network had three output units. One of these encoded the movement of the agent’s single eye. Activation values between 0 and 0.3 produced a movement to the left; values between 0.3 and 0.7 engendered no movement; values between 0.7 and 1 produced a movement to the right. At the beginning of each epoch, the eye was in the central position, where the visual field of the eye (the back rectangle in Figures 1 and 4) exactly matched the display. Therefore, in the central starting position the agent could see the whole content of the display. A movement of the eye to the left or to the right produced a horizontal displacement of the visual field corresponding to two cells; in this condition, the agent was able to see only 2/3 of the display (Figure 4). In these cases, the visual input of the portion of the retina outside the display was set to 0.
Figure 4.
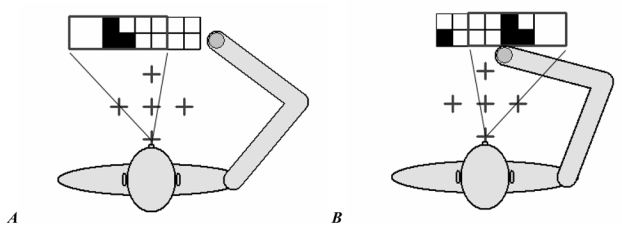
When the agent moved the eye to the left (A) or to the right (B), it could see only 2/3 of the display (the straight lines represent the outer limits of the agent’s visual field).
The remaining two output units coded for the movements of the arm. Their continuous activation value was mapped into the value of an angle which could vary from −0.17 to +0.17 radiants, and which was algebraically added to the current angle of the two arm segments. When the agent decided to stop its arm, i.e., when both arm output units had an activation value between 0.45 and 0.55, the trial ended and the distance between the “hand” (the end of the arm) and the target key was measured. In most situations, a single activation cycle was insufficient to correctly reach the target key, because the two angles often varied more than the maximum value permitted by the two output units. In these cases, the agent learned to perform a sequence of micro-movements in order to reach the target key (see Di Ferdinando & Parisi, 2004). The two proprioceptive input units were directly connected to the two output units coding for arm movements. In contrast, the visual input layer communicated with the output layer through a layer of internal (hidden) units. The characteristics of this internal layer varied in different simulations.
The connection weights of the agent’s neural network developed according to a genetic algorithm (Mitchell, 1997). A population of 100 agents competed for survival and reproduction. Each agent had a genotype encoding all the connections weights of the agent’s neural network. Each gene, represented by a real number, coded for each connection weight, with a 1:1 mapping. At the beginning of the evolutionary process (first generation), each agent in the population was assigned random genes, i.e., random weights for the connections of its neural network. Each agent was then tested for 20 trials. In each trial a random object was presented on the display, the eye looked centrally and the initial position of the arm was random. After each display presentation, the agent could move its eye and its arm in order to reach the target key. After 20 trials, a fitness value was calculated for each agent in the population, according to the following formula:
| (3) |
where k = 0.001, nCorrect = number of correct keypresses, nIncorrect = number of incorrect keypresses (i.e., when the agents reached a wrong key), Distancei = distance in pixels between target key and final hand position for the trial i, nTrials = number of trials (i.e., 20). A key was considered to be reached when the distance between it and the agent’s hand decreased below 10 pixels. If on a particular trial this distance was greater than 100 pixels, or if the arm did not stop after 60 steps, the distance in formula (3) was set to 100 pixels. At the end of each cycle, the 20 agents with the highest fitness values were selected for asexual reproduction, and they produced 5 copies of their genotype. Random genetic mutations occurred in the copy process, with a rate of 15% of the total genome; a quantity randomly selected in the interval between +1 and −1 was added to the current value of the gene to be mutated. In this way, a new generation of 20*5=100 individuals was generated, and the process was repeated until satisfactory performance was obtained. All the simulations were replicated 10 times, with 10 different initial random weight patterns.
Simulation 1: Emergence of orienting behavior
Previous work using the artificial life approach showed that artificial agents may develop orienting behavior in an ecological setting (Bartolomeo et al., 2002). In this study, the agents lived in an environment containing food and danger elements and reproduced selectively based on the capacity of each individual to eat food while avoiding danger. The results of simulations showed that when plentiful computational resources (many hidden units) were available for the perceptual discrimination between food and danger, peripheral vision was sufficient to trigger the appropriate response (eat or fly). However, with fewer hidden units the agents first oriented the central portion of their visual field to the peripheral stimulus, and only as a second step were they able to identify it. Thus, in this case the central portion of the sensory surface became a “fovea”, and the detection of a stimulus in peripheral vision triggered an orienting movement, before the agent could decide whether to eat or to avoid the object. This result suggests that capacity limitations can be solved by the emergence of attentional processes, in the form of bodily orienting. A potential ambiguity of this interpretation, however, is that the central portion of the sensory surface was also the agent’s “mouth”, the anatomical part used to “eat” the stimuli. Thus, agents might have found advantageous to orient toward the stimulus, because, in the event that it was food, agents needed just one further step to eat it. In the present simulation, we tried to replicate these preliminary results within the entirely different setting described above, in which there was no overlapping between sensory surfaces (the retina) and structures used for response (the arm). Crucially, moreover, in the present setting there was no need for the agents to orient towards a peripherally presented object, because at the beginning of each cycle they could see the whole display, and orienting in itself was not rewarded with fitness. If orienting emerges in the present setting, then one can be more confident that there is a powerful evolutionary pressure towards the development of this type of behavior.
Results
In a first set of simulations, information from all regions of the retina was set to arrive to all 8 internal units, which in turn were connected to both eye and arm units (Figure 5).
Figure 5.
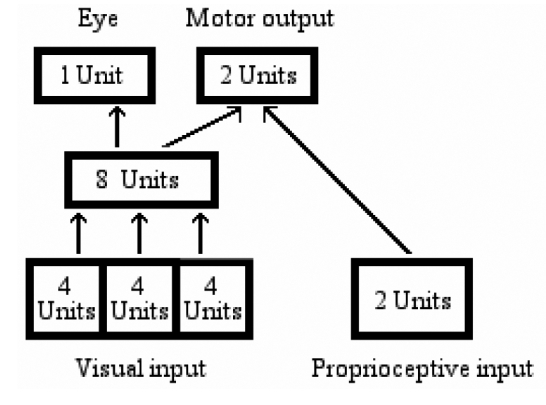
Network architecture for simulation 1.
Therefore, both the eye and the arm were controlled, at any given time, by information arriving both from the fovea and from the two peripheral regions of the retina. Because at any given cycle the arm had enough information arriving from all regions of the retina to decide which response button to reach, an eye-movement strategy was not in principle necessary. Despite this, orienting behavior did emerge. For laterally presented objects, agents learned to perform the task by first orienting their eye towards the stimulus. Only afterwards could they press the appropriate response key. When two objects were presented at the same time, the agents oriented towards the larger object, the one to which they had to respond. Similar results were obtained in control simulations with different mutation rates (8% or 10%), or number of hidden units (2, 4, 10, 12, 16), thus attesting to the robustness of the simulation. Within these boundary conditions (i.e., up to 16 hidden units), the earlier finding of that orienting behavior depends on capacity limitations (Bartolomeo et al., 2002) was not replicated.
For each replication of the simulation, we analyzed the best individual of the last generation. In particular, we calculated the percentage of time in which the agents moved their eye towards the object to be recognized (i.e., the currently perceived object for single-object trials, or the larger object for two-object trials). This behavior might be considered as an analogue of foveation, but with the caveat that the agents’ central retinal area did not have a better definition with respect to the peripheral area, in contrast to a real fovea. Taken together with the fact that, as mentioned previously, the agents can see the whole display when their eye is in its initial, central position, there seems no obvious requirement for foveation behavior to emerge. Despite these considerations, the 10 evolved individuals showed an orienting behavior on 83% of the trials on average (Table 1). The results displayed in Table 1 were obtained by identifying the 10 best individuals (one per each seed) at the end of the evolution, and by showing to each of them all the 37 possible input patterns, with 5 random starting positions of the arm, for a total of 185 trials.
Table 1.
Percentage of correct, incorrect and null reaching and percentage of foveating movements for the 10 best individuals in Simulation 1, for each of the 37 possible input patterns, with 5 random starting positions of the arm.
| Left target | Central target | Right target | Single stimulus | Double stimuli | Total | |||||||||||||||||||
|---|---|---|---|---|---|---|---|---|---|---|---|---|---|---|---|---|---|---|---|---|---|---|---|---|
| Seed | Corr. | Incorr. | Null | Fov. | Corr. | Incorr. | Null | Fov. | Corr. | Incorr. | Null | Fov. | Corr. | Incorr. | Null | Fov. | Corr. | Incorr. | Null | Fov. | Corr. | Incorr. | Null | Fov. |
| 1 | 83 | 0 | 17 | 83 | 95 | 0 | 5 | 33 | 97 | 0 | 3 | 0 | 83 | 0 | 17 | 50 | 96 | 0 | 4 | 33 | 92 | 0 | 8 | 39 |
| 2 | 95 | 0 | 5 | 100 | 93 | 0 | 7 | 100 | 95 | 0 | 5 | 92 | 88 | 0 | 12 | 100 | 98 | 0 | 3 | 96 | 95 | 0 | 5 | 97 |
| 3 | 100 | 0 | 0 | 100 | 100 | 0 | 0 | 100 | 93 | 0 | 7 | 33 | 100 | 0 | 0 | 83 | 97 | 0 | 3 | 75 | 98 | 0 | 2 | 78 |
| 4 | 85 | 0 | 15 | 100 | 88 | 0 | 12 | 100 | 77 | 0 | 23 | 92 | 58 | 0 | 42 | 100 | 96 | 0 | 4 | 96 | 84 | 0 | 16 | 97 |
| 5 | 100 | 0 | 0 | 100 | 100 | 0 | 0 | 100 | 100 | 0 | 0 | 100 | 100 | 0 | 0 | 100 | 100 | 0 | 0 | 100 | 100 | 0 | 0 | 100 |
| 6 | 83 | 0 | 17 | 100 | 92 | 0 | 8 | 92 | 92 | 0 | 8 | 92 | 67 | 0 | 33 | 83 | 100 | 0 | 0 | 100 | 89 | 0 | 11 | 94 |
| 7 | 65 | 7 | 28 | 8 | 82 | 0 | 18 | 17 | 82 | 0 | 18 | 58 | 70 | 7 | 23 | 42 | 79 | 0 | 21 | 21 | 75 | 2 | 23 | 28 |
| 8 | 100 | 0 | 0 | 100 | 100 | 0 | 0 | 100 | 100 | 0 | 0 | 100 | 100 | 0 | 0 | 100 | 100 | 0 | 0 | 100 | 100 | 0 | 0 | 100 |
| 9 | 100 | 0 | 0 | 100 | 100 | 0 | 0 | 100 | 100 | 0 | 0 | 100 | 100 | 0 | 0 | 100 | 100 | 0 | 0 | 100 | 100 | 0 | 0 | 100 |
| 10 | 100 | 0 | 0 | 100 | 100 | 0 | 0 | 100 | 100 | 0 | 0 | 100 | 100 | 0 | 0 | 100 | 100 | 0 | 0 | 100 | 100 | 0 | 0 | 100 |
| Mean | 91 | 1 | 8 | 89 | 95 | 0 | 5 | 84 | 94 | 0 | 7 | 77 | 87 | 1 | 13 | 86 | 97 | 0 | 4 | 82 | 93 | 0 | 7 | 83 |
Table 1 also shows that orienting improved accuracy of performance. A linear regression model, plotting accuracy versus orienting, accounted for 41% of the variance, F(l, 9) = 5.63, P < 0.05. In particular, the 4 agents which always foveated the target objects (% foveation = 100) were those always performing at ceiling (100% correct responses).
Thus, these artificial agents spontaneously developed an orienting strategy, using the peripheral area of the eye’s visual field only to locate the position and the size of the target object, and the central area1 to recognize its identity afterwards, thereby replicating the previous results obtained in an entirely different setting (Bartolomeo et al., 2002). Importantly, in the present setting agents received reinforcement (fitness) for identifying the correct targets, but they were not instructed nor encouraged in any way to orient towards the targets; yet, they developed such a strategy.
Additional control simulations (not shown here) employing agents with fixed eye demonstrated that also fixed-eye agents were able to eventually learn the same task2. If both orienting and non-orienting solutions existed, then why did the algorithm tend to discover orienting solutions? The orienting solutions may have been easier to find in the search of weight space. In addition, by centering objects in the fovea, agents managed to solve the spatial generalization problem: If objects can appear at any position on the retina, the classification problem is hard for a small network, particularly because the input space is not linearly separable. However, if objects are centered so that they always appear at the same location, the mapping between input and output becomes much easier to obtain. Importantly, the present agents managed to solve this perceptual problem by using eye orienting, i.e. a motor act. This may be considered as a typical example of “embodied cognition”, where goal-directed behavior is controlled not by building a detailed representation of the environment, but by using the external world as its own model and exploring it according to the agents’ needs (Ballard et al., 1997; Clark, 1997; O’Regan, 1992).
Emergence of functional specialization in the hidden layer
What were the “anatomo-functional” correlates of the agents’ “cognitive” acts of orienting and identifying? The activation patterns of the 8 internal units at the end of the learning phase indicated that a functional modularity had emerged.
Figure 6 shows the activation patterns for one of the 10 best individuals at the end of the evolutionary process, in response to each of the 36+1 possible visual inputs. The inputs can be sorted into three sets: 12 inputs in response to which the eye should not be moved (central target), 12 inputs requiring leftward responses (left-sided target), 12 inputs requiring rightward orienting (right-sided target), plus the single trial in which the display contains no objects. The activation patterns of some internal units (e.g., units 2 and 3 in Fig. 6) seemed to control the movements of the eye (i.e., co-varied with the target position, the information used to move the eye), whereas others (5, 7, and 8) seemed instead to control the movements of the arm (i.e., co-varied with the content of the visual field’s central portion, the information used to move the arm). To provide a numerical control for this putative functional specialization, we analyzed the variability of hidden units’ net inputs for foveal and for peripheral stimuli (the net input of a hidden unit is the sum of the products of input unit activation and the connection weights between input and hidden units; see Methods). The prediction was that a unit specialized for the identification of foveal stimuli would show greater variability in terms of its net input for foveal rather than for peripheral stimuli, even though there is no difference in terms of perceptual properties between the two cases. We calculated the net inputs’ SDs for the hidden units that, on inspection of their activation pattern, appeared to be specialized for target identification (e.g., units 5,7 and 8 in Fig. 6). The average SDs for the 10 seeds were as following: Foveal stimuli, 7.160; left-sided stimuli, 5.594 right-sided stimuli, 5.109. A repeated-measures analysis of variance indicated that the locus of stimulus presentation yielded different variability, F (2, 18) = 10.363, P = 0.001. Post-hoc tests (Fisher’s PLSD) showed that foveal stimuli generated more variable net input than peripheral stimuli, all Ps < 0.004, but there was no difference between left- and right-sided stimuli, P > 0.31. This analysis confirmed the hypothesis that these units are specialized for target identification and thus that a functional specialization emerged in the agents’ hidden layer, with units dedicated to peripheral processing/object detection and units dedicated to foveal processing/object identification.
Figure 6.
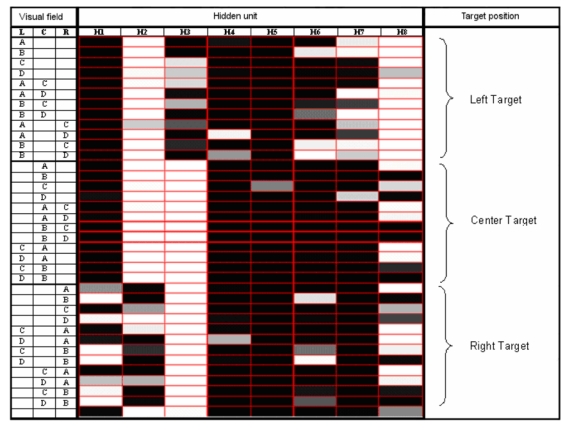
Activation value of the 8 hidden units in response to the 36+1 possible visual patterns, i.e. the possible contents of the eye’s visual field (L=Left area of the eye’s visual field; C=Central area; R=Right area). The patterns are grouped in three sets based on target position, plus the case in which no object was presented. Activation values are designed by a grey scale (black=0; white=l).
The observed self-organization of the hidden layer is reminiscent of analogous divisions of labor in the real brain. For example, in recent years much emphasis has been placed on the hypothesis that there are distinct cortical streams of visual processing in the primate brain, one concerned with object localization and the other concerned with object identification (Milner & Goodale, 1995; Mishkin et al., 1983). Previous computer simulations provided results relevant to this issue. Using a supervised learning algorithm, Rueckl, Cave and Kosslyn (1989) trained neural networks to classify and locate shapes. Networks were designed using either a non-modular architecture, with all the hidden units projecting to all the output units, or a modular architecture, with some hidden units projecting to the output units codifying for stimulus shape, and others projecting to the output units dedicated to stimulus location. When enough computational resources were allowed, modular networks achieved more efficient internal representations than non-modular networks. Our present experimental setting seemed particularly suited to the exploration of these issues, because the present artificial agents have to perform very different tasks when orienting toward a stimulus, which only requires its localization, or when identifying the stimulus in order to perform the appropriate action. Thus, we examined whether an analogous advantage for “hardwired” modularity would spontaneously emerge in the present setting, which employed a genetic learning algorithm.
Simulation 2: Hardwired modular architecture
In a second set of simulations, we used a modular network architecture to control the behavior of the agents. The internal layer of units was split into 2 different modules, one connected only to the single output eye unit and used to move the eye, and the other connected only to the 2 output arm units and used to move the arm. Each module consisted of 4 units. Whereas the eye module was connected to all the three portions of the retina, the arm module was connected only to the central portion. Thus, in order to correctly respond to the target, the agents had to first put the target object in the central portion of their visual field, and then move the arm toward the correct key. The architecture is shown in Figure 7.
Figure 7.
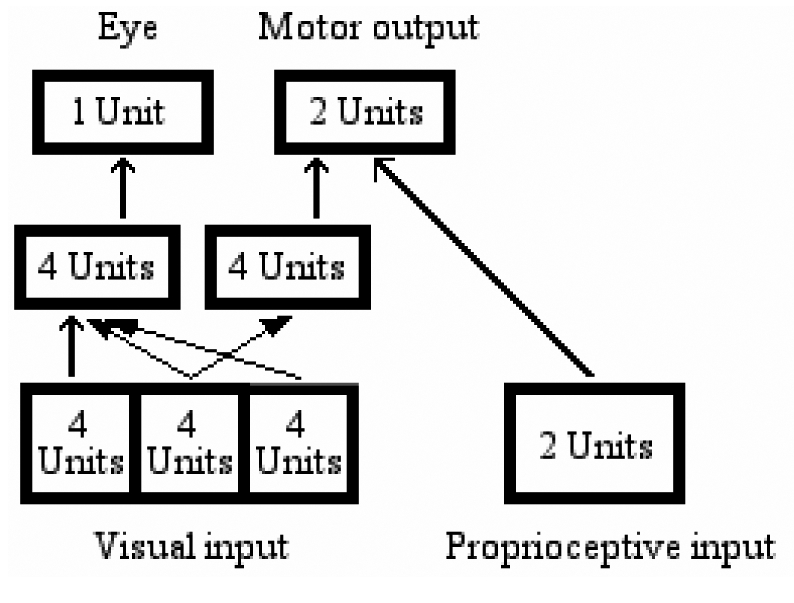
“Modular” architecture for simulation 2
Results
Figure 8 shows the development of the ability to reach the appropriate keys over 10,000 generations of the genetic algorithm, for the best individual in each generation of the modular and of the non-modular populations. Modular agents were faster in learning the task, and obtained higher fitness scores than non-modular ones. Control simulation showed that modular agents developed orienting strategies also with different mutation rates (8% or 10%). The mean fitness obtained over 10,000 generations (as analyzed for each step of 50 generations) was 0.84 for the modular networks and 0.69 for the non-modular ones, paired t (200) = 24.00, P = 8.48−61, two-tailed. Thus, hardwired modularity conferred a strong evolutionary advantage to agents otherwise identical to their non-modular counterparts.
Figure 8.
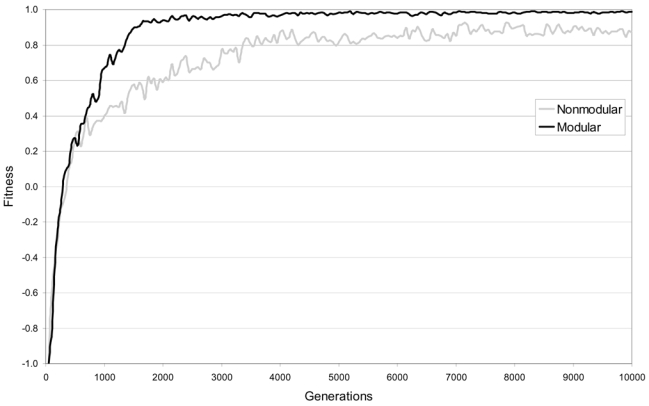
Learning curves for modular (black) and non-modular (gray) architectures.
Discussion
The results of simulations 1 and 2 demonstrated that if an agent has the capacity to move its eye, it will exploit this ability even if, in principle, the task could be solved without eye movements. Because a genetic algorithm was used for task learning, one can conclude that orienting behavior provides a substantial evolutionary advantage, at least in the present experimental setting (but see also Bartolomeo et al., 2002). Moreover, using a simulation setup similar to that used in the present work, Calabretta et al. (2004) showed that neural networks which develop orienting behavior are better able to generalize to new patterns, in particular to recognize objects in new positions. Simulation 2 confirmed and extended the results Rueckl et al. (1989), on the superiority of a modular architecture over a non-modular one in tasks involving “what” and “where” processing abilities. Of note, in Rueckl et al’s Exp. 1, modular networks were actually slower in learning than non-modular networks, contrary to their hypothesis. Only allocating more hidden units to the “what” module (Exp. 2) resulted in the hypothesized superiority of the modular network. Thus, the present Simulation 2, thanks to the use of an artificial life approach, provided a generalization of the Rueckl et al’s results.
In simulation 1, at the beginning of each trial the agent saw the entire display and therefore it could respond to the current input by pressing the appropriate key without moving the eye, as also shown by the control simulations in which fixed-eye agents were able to learn the task (see footnote 2). However, mobile-eye agents developed a different, two-step strategy, based on the emergence of a differentiation within the agent’s retina. The central portion of the retina developed the ability to process all the available visual information, like a fovea, whereas the two peripheral portions could extract only some of the information available, i.e. presence/absence, location and size of a stimulus, but not its shape/identity3.
To explore the principles according to which the modular networks self-organized their hidden layer, we analyzed the component units’ activation patterns in response to each of the 36+1 possible visual inputs (Figure 9). In modular networks, 4 internal units controlled the movements of the eye and 4 units controlled the movements of the arm. Notice that for the eye there were only two possible actions (“turn right” or “turn left”), encoded as a single input/output cycle in the network’s eye output unit, whereas the arm could move in five different ways (“press button A”, “press button B”, etc.), each of which was realized by several consecutive movements of the arm, encoded as a succession of input/output cycles in the arm output units. Even in the case of the arm, however, for each input there was a single activation pattern in the internal units, which remained constant for the entire length of the action. Thus, a single hidden activation pattern encoded for the entire action, even though the single component movements could vary as a function of the arm’s initial position and of the proprioceptive input during the movement.
Figure 9.
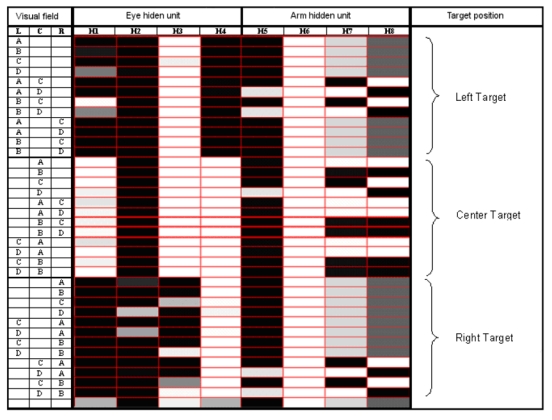
Analysis of the modular network’s internal units. Legend: See Fig. 6.
In the agent of figure 9, during trials with centrally presented objects, where no eye movement was needed, the 4 internal units dedicated to the eye movements assumed a “no-saccade” activation pattern of approximately 1011. On these same trials, the 4 internal units that controlled the arm showed 4 different activation patterns (approximately 0111, 0100, 0101, 1110), corresponding to the appropriate keypress responses. With peripherally presented objects, there was no 1:1 correspondence between object identity and activation pattern of the arm-movement units. In this case, the agent needed only to detect the presence and size of an object, in order to orient towards it4. Only after this step was performed could the agent identify the target object. Thus, the role of hidden units dedicated to arm movement was to recognize the identity of the target object only when the target object was in the central portion of the visual field. With left-sided presentation of a large object, or of a small object unaccompanied by other competing stimuli, the eye moved leftward before the agent chose the appropriate arm movement. On these trials, the 4 orienting units showed an activation pattern (0010, with the first unit being somewhat variable) coding for leftward eye movement. As soon as the eye had moved to the left, the input became identical to the already examined situation with a centrally presented object, and the 4 arm-movement units demonstrated the above mentioned patterns encoding for key reaching. When a large object, or a small unaccompanied object, was presented in the right portion of the display, the appropriate rightward eye movement was accomplished by the orienting units assuming the pattern 0001. Again, as soon as the eye was moved to the right, the agents reverted to the situation requiring no eye movement. All the information needed to move the arm was now available to the network, which responded to the 4 activation patterns controlling the arm movements by reaching toward the appropriate buttons. In the single trial in which no object was presented, the 4 units controlling the eye always assumed approximately the same no-saccade pattern (1011); the 4 units controlling the arm showed a fifth activation pattern (0110), which directed the arm to the appropriate “no-object-present” button. Thus, the hidden layer of the networks reflected the “cognitive” computations that the agents performed to solve their task.
Lesioning the networks
Damaging neural network models can inspire and constrain theories of normal and disordered behavior in real agents (see, e.g. Cohen et al., 1994; Monaghan & Shillcock, 2004; Mozer et al., 1997; Pouget & Sejnowski, 2001). To investigate the patterns of performance of lesioned artificial agents evolved through a genetic algorithm, we created different types of lesions in the modular networks, after completion of the learning phase. The main goal of this study was to model orienting behavior and its disorders, like extinction and spatial neglect. As a consequence, all the lesions shared two common properties: They involved only the gaze orienting module, and they impaired the ability to orient towards the left side. In the present study, we did not aim to provide an account of the hemispheric asymmetry in neglect. Therefore, the design of the present neural networks was symmetrical, and mirror-symmetric lesions would produce similar results on the opposite side (see Di Ferdinando et al., 2005; Monaghan & Shillcock, 2004).
Lesion 1: Deactivation of the hidden unit coding for leftward orienting
Lesions to neural networks can be implemented according to different methods. In a first lesion experiment, we lesioned the internal units of the neural network. To cancel any influence of a hidden unit on the agent’s behavior, its output value was set to 0, whatever the input the unit received. For each network, we identified the hidden unit responsible for leftward eye movements and lesioned it (see Figure 10). Then, we examined the lesioned agent’s behavior in response to each possible input.
Figure 10.
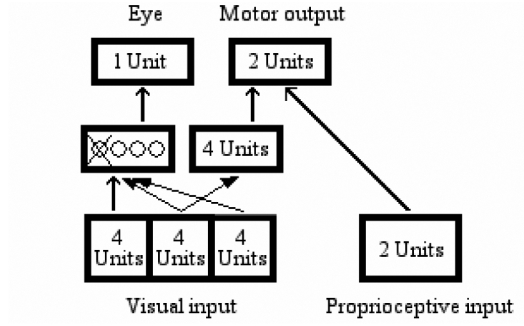
Lesion 1: Deactivating the single hidden unit responsible for the movement of the eye toward the left.
The resulting performance (Figure 11) was severely impaired, especially when the target object was in the left portion of the display. In cases where the lesioned unit was also active when the target was in the central part of the visual field, as in the network in Figure 9, these centrally presented objects were also inadequately processed. On the other hand, performance was normal for right-sided objects. Importantly, there was no difference in the performance for the cases in which there was one single object on the display, as compared to the cases where two competing objects were presented, independent of whether the competing object was centrally presented (“close competitors” in Figure 11), or occurred at the rightmost position (“far competitors”). Thus, the complete deactivation of the orienting units simulated situations in which the very occurrence of a stimulus goes undetected, like visual field defects, or some cases of profound left neglect, where patients’ behavior can simulate left hemianopia (Kooistra & Heilman, 1989).
Figure 11.
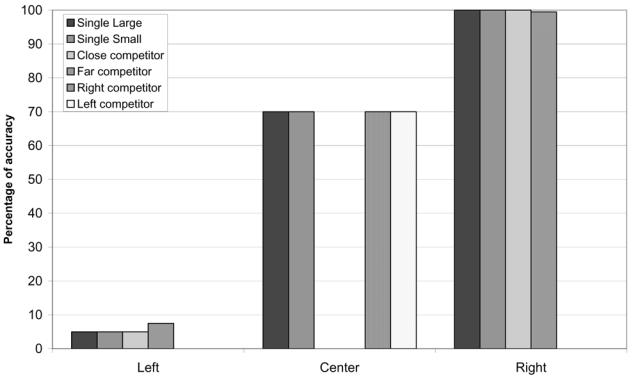
Performance of the agents in response to stimuli presented in different portions of the visual field, either in isolation or accompanied by other stimuli, after lesion of the hidden unit for leftward eye movements. In unlesioned networks accuracy was at ceiling for all stimuli.
Lesion 2: Adding noise to the network’s connections
Typically, left neglect symptoms are elicited by the presence of competing stimuli on the non-neglected side (see, e.g., Bartolomeo & Chokron, 2002; Bartolomeo et al., 2004; Mark et al., 1988).
Patients may compulsorily orient towards visual objects presented on the right side as soon as they appear (D’Erme et al., 1992; Gainotti et al., 1991). In cases in which there are no objects on the “good” side, signs of left neglect may simply disappear, to the point that patients can attain normal or nearly normal performance (Bartolomeo et al., 2004; Chokron et al., 2004). This “extinction-like” behavior in neglect (see Posner et al., 1984) was not captured by the deactivation of the left-orienting hidden units of the present networks. We speculated that a more gradual form of impairment might simulate the effect of competition between perceptual stimuli in neglect. To test this prediction, a second set of lesion experiments was conducted in which we added random noise between −20 and +20 to all the connections linking the left region of the retina with the 4 units which controlled the movement of the eye. All the other connections, from the fovea and from the right region of the retina, were left intact (Figure 12).
Figure 12.
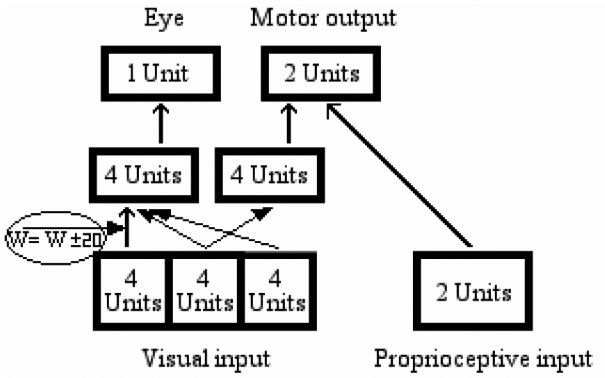
Lesion 2: Adding random noise to the network’s connections from the left visual field to the eye hidden module.
After this lesion, the agents’ performance was impaired not only when the target object was in the left portion of the display, but also when it was in the central or even in the right portion. When presented with left-sided stimuli, the lesion had different effects on the ability of agents to orient to left stimuli: In some cases agents did not orient toward a left target; in others, they oriented to the left for central or right-sided targets (Figure 13). This contrasts with the behavior of patients with neglect or extinction. Moreover, as for the previous type of lesion, there was no difference between the outcomes of single and double presentations, which was once again inconsistent with the behavior of most patients with neglect and of all extinction patients.
Figure 13.
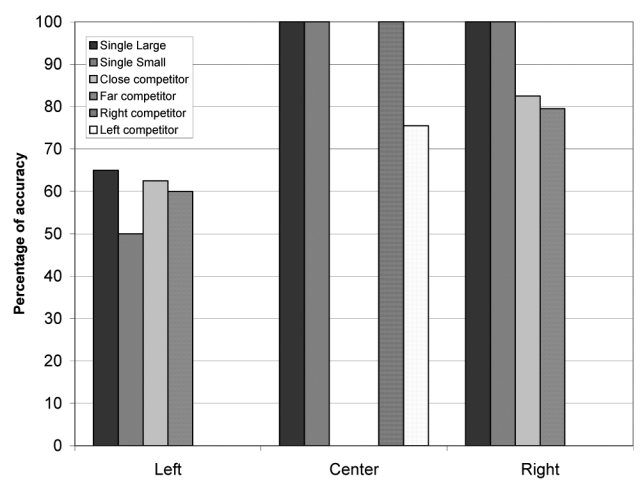
Performance of the agents after lesion 2.
Lesion 3: Decreasing the strength of the network’s connections
Intra-hemispheric disconnection between anterior and posterior regions of the right hemisphere may contribute to neglect symptoms, both in monkeys (Gaffan & Hornak, 1997) and in humans (Doricchi & Tomaiuolo, 2003), for example to the slowed processing of left-sided stimuli as compared to right-sided, non-neglected stimuli (see Bartolomeo & Chokron, 1999). To simulate disconnection, we reduced the weights of the 16 connections linking the 4 leftmost input units with the 4 internal orienting units to one third of their original value (Figure 14), thus decreasing their role in determining the activation level of the orienting units.
Figure 14.
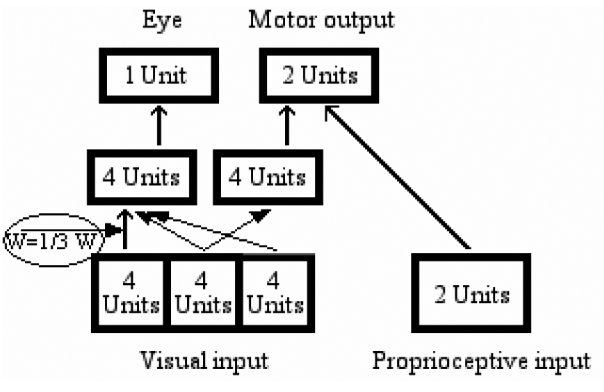
Lesion 3: decreasing the strength of the network’s connection from the left visual field to the eye hidden module.
Figure 15 shows the average performance of the 10 best individuals. Performance was impaired only for left-sided target objects, whereas it was normal for central or right-sided targets. Importantly, however, agents failed to orient towards left-sided objects only in specific conditions. Large objects were processed normally most of the time (90%), when presented in isolation. Single small objects evoked less accurate performance (70% correct). The presence of a competing object in the central or in the right portion of the display further decreased performance, which is the defining feature of sensory extinction. Correct responses were 47% for large left-sided objects presented with a small central object (close competitors in Figure 15), but only 13% when the competing small object was presented on the right side (far competitors). Similar results were obtained with 10% mutation rate.
Figure 15.
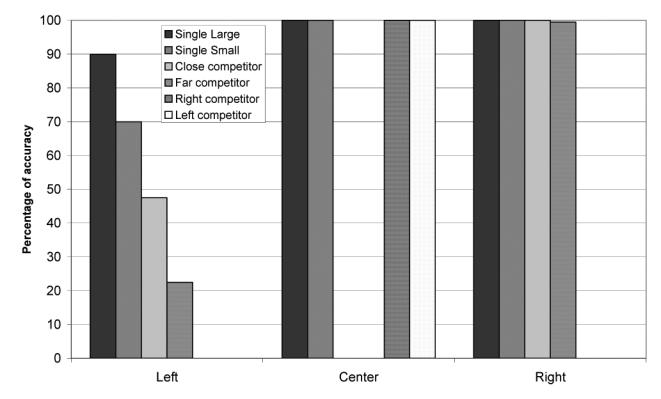
Performance of the agents after lesion 3.
Single-case analysis revealed examples strongly reminiscent of patients’ typical patterns of performance. For example, one individual always looked towards and responded correctly to a single, left-sided object, but when the display contained two objects it invariably responded to the object on the relative right, even if that object was in the central position. Thus, a left-sided object could be extinguished either by a right-sided object or by a central one. Importantly, the “extinction-like” behavior in neglect patients, that is the slowing of response times for left-sided stimuli preceded by right-sided ones, also occurs when the preceding stimulus is central (Bartolomeo et al., 2001; D’Erme et al., 1992; Posner et al., 1984), similar to the present results. Relative neglect is easy to understand in the present simulations if one considers that stimuli compete for selection as targets of orienting movements. If the processing of left-sided stimuli is impaired, but not nullified, by a lesion (e.g. by the disconnection described here), then another stimulus is more likely to win the competition, independent of its localization (right side or center). In a similar way, it is common clinical experience that left neglect is typically modulated by the objects’ salience, with less neglect for more salient left-sided objects. In a further analogy with the simulation results, right-sided, non-neglected objects are often crucial to trigger neglect behavior (Chokron et al., 2004; Mark et al., 1988). Importantly, non-neglected objects need not be presented in the patient’s right hemispace to cause left neglect; it is sufficient for them to appear on the relative right of the target (Bartolomeo et al., 2004; Driver & Pouget, 2000; Marshall & Halligan, 1989). A similar point can be made for visual extinction, where a left-sided stimulus can be extinguished by a competitor presented on its relative right in the same (left) hemifield (Di Pellegrino & De Renzi, 1995).
Simulation 2b: “Small” objects as targets
It might be argued that the observed effects of the lesions simply depended on lowering input gains from the left part of the retina, which would amount to making objects in the left part of the retina “smaller” (since the overall activation on the left is smaller); this would obviously give advantage to rightward stimuli, which would then result larger and consequently be chosen by the agent as a target. To control for this possibility, we performed an additional simulation with similar settings, except that the small, and not the large objects, were defined as targets. If the relative size of the objects determines performance, then the lesioned agents should now select the left-sided object, made smaller by the lesion. The new task resulted more difficult for the agents to learn, which led us to use a smaller mutation rate (8% rather than 15%) and a larger number of generations (50,000 rather than 10,000). The final accuracy was slightly inferior to that of the previous simulations (Figure 16a). Despite this, the results of the disconnection lesions were strikingly similar to the previous results (Figure 16b). Performance was impaired only for left-sided targets, whereas it remained normal for central or right-sided targets. Moreover, as in the original simulations the presence of a competing object in the central or in the right portion of the display produced a larger decrease in performance as compared to cases in which objects were presented in isolation. In particular, a more severe deficit was present with a far competitor than with a central (close) competitor. Thus, the results of this simulation run counter the possibility that the disconnection results merely depended on making objects in the left part of the retina smaller.
Figure 16.
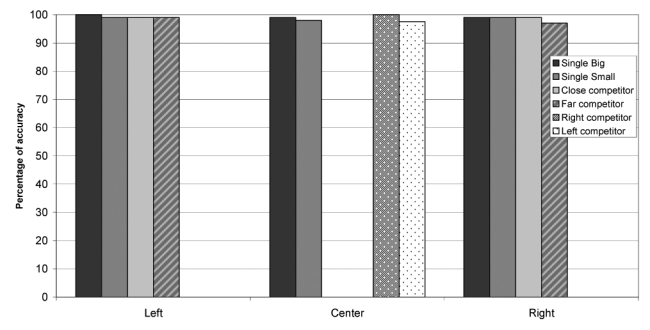
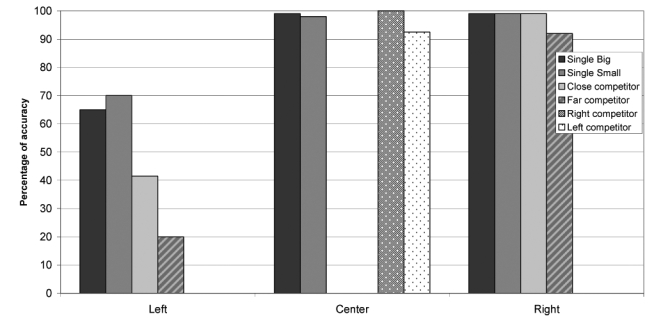
“Smaller” objects as targets. A, performance of normal agents; B, performance of the agents after lesion 3.
General Discussion
The present study is the among the first attempts to simulate orienting of attention and its disorders with “ecological” neural networks (see also Bartolomeo et al., 2002), i.e. with artificial agents which live in a simulated environment and which evolve following a genetic algorithm. Other previous studies employed supervised learning algorithms, or simulation settings in which most or all the parameters were pre-specified by the experimenter. These studies were able to simulate several key aspects of neglect behavior. Cohen, Romero, Farah and Servan-Schreiber (1994) demonstrated that the disproportionate slowing of response times for contralesional targets after an ipsilesional cue in parietal patients (Posner et al., 1984), and usually interpreted as a deficit of disengaging attention from the ipsilesional position, could result from interactions between different parts of the model, without the need to postulate a module dedicated to disengagement. Mozer and his co-workers (Mozer, 2002; Mozer & Behrmann, 1990; Mozer et al., 1997) lesioned a model of selective attention based on local interactions between adjacent units. In this model, an attentional layer selected the relevant parts of input displayed on a retina and transmitted the selected parts to further processing layers. Selection was biased in a bottom-up way, by the locations on the retina where a stimulus was present, and in a top-down manner, depending on the task demands. To simulate neglect, Mozer et al. damaged the bottom-up connections from the retina to the attentional layer, in a similar way to Lesion 3 in the present study. The damage was graded monotonically, most severe at the left extreme of the retina and least severe at the right. The damaged network simulated several neglect-related behaviors, such as neglect dyslexia (Mozer & Behrmann, 1990), rightward deviation in line bisection (Mozer et al., 1997) and object-based neglect (Mozer, 2002). In a model using a basis function to perform sensorimotor transformations, which presents specific analogies with the functioning of parietal neurons, Pouget and Sejnowski (1997, 2001) also simulated neglect behavior occurring after a gradient-shaped lesion. Anderson (1996, 1999) proposed a mathematical model of neglect, in which a salience system selects objects’ centers for the focus of an attentional ‘spotlight’. Damage to the right part (or ‘hemisphere’) of the salience system produced rightward deviation on bisection of long lines, whereas damage to the right part of the spotlight lead to misreading of the left part of words (‘neglect dyslexia’). Monaghan and Shillcock (2004) demonstrated that the fundamental asymmetry of unilateral neglect (more left neglect after right brain damage than the reverse), can result from low-level differences between the hemispheres, such as the possibility that left-hemisphere neurons have narrower receptive fields than right-hemisphere neurons (see Halligan & Marshall, 1994). In Monaghan and Shillcock’s (2004) setting, two-hemisphere neural networks with analogous differences in receptive fields, after unilateral damage, simulated patients’ deviations on line bisection with the typical left-right asymmetry. Di Ferdinando et al. (2005) reported a series of neural networks simulations which implemented different theories of neglect to verify their neuropsychological plausibility. The simulations, built following the basis functions approach developed by Pouget & Sejnowski (1997, 2001), showed that asymmetries are best explained by a right hemispheric dominance for spatial representations, expressed in terms of a higher number of neurons involved in spatial tasks.
Our simulation work departed from these approaches. We used neural networks embedded within a body and an environment, and trained by means of a genetic algorithm. In this approach, the selection process and the constant addition of new variability through random genetic mutations results in modification of the neural networks’ connection weights across generations. Our approach allowed us to simulate the emergence of visuomotor behavior (gaze orienting and perceptual object identification), as well as the production of the appropriate motor responses. Importantly, the simulated agents learned these behaviors, without direct supervision from the experimenter. In contrast to what happens with classical neural networks, the input and output patterns of ecological networks are not interpreted arbitrarily by the experimenters; instead, their “meaning” is determined by the interaction of the agent with its environment. Input patterns are the result of the action of the environment on the sensory systems of the agents, and output patterns modify the environment through the motor systems of the agents. In other words, the next input of the agent is determined by its actions (for example, if an agent does not move its eye toward a certain area of the environment, it may not perceive it), whereas in classical simulations the experience of neural networks is predetermined (it corresponds to the “training set”). Thus, the experimenters state only the principles of the interaction between the agents and the environment, but they have no role in interpreting the results of this interaction. As a consequence, ecological neural networks can move and perform actions that change the environment or the relationship between agents and environment, resulting in new input patterns. Therefore, they at least partially determine their own input (see Arbib, 1981, for analogies with biological systems).
The present experimental setting addressed the issue of modularity in the brain. Hardwired separation between hidden units dedicated to gaze orienting and hidden units specialized in object recognition, similar to the analogous functional specialization in the real brain, gave to the agents a consistent advantage in terms of speed of learning, thus confirming previous simulation results obtained with supervised learning (Rueckl et al., 1989) and genetic algorithms (Di Ferdinando et al., 2001). By damaging the “brains” of the artificial agents in specific ways, we observed patterns of impaired performance which captured crucial aspects of human neuropsychological conditions like neglect and extinction. The resulting impairments may be described as deficits of attention, in the sense of “biased competition” (Desimone & Duncan, 1995). After disconnection between the input and the hidden layers, lesioned agents were unable to orient to left-sided objects, but only when a competing right object was present. Thus, competition between objects in different spatial positions was biased in the sense that right-sided objects systematically won the race to recruit the agents’ attention. Similarly, human patients with extinction fail to acknowledge the presence of a contralesional stimulus only when a competing stimulus is administered at the same time on the same side as their brain lesion. Patients with left neglect show similar, if more severe, patterns of performance (Bartolomeo et al., 2004), because their attention is compulsorily and, as it were, “magnetically” captured by ipsilesional stimuli (D’Erme et al., 1992; De Renzi et al., 1989; Gainotti et al., 1991; Mark et al., 1988). Importantly, we observed this “attentional” bias only after a specific pattern of damage affecting the connections between input and hidden units. Damage to the connection weights was also found to yield neglect-related behavior in previous simulation studies (Cohen et al., 1994, simulation 3; Mozer, 2002; Mozer et al., 1997). The present lesioned agents did not simply suffer from an attenuated “perceptual” representation of the “neglected” input. They failed to orient towards it, despite normal processing at the most peripheral “sensory” level of analysis, which took place in the intact input units. Failure to orient to left-sided stimuli, probably resulting from an asymmetry of exogenous orienting processes (Corbetta & Shulman, 2002; Losier & Klein, 2001; Mesulam, 1999), constitutes a crucial mechanism leading to neglect behavior (Bartolomeo & Chokron, 2002). The present pattern of results supports previous suggestions that problems of communication between brain areas, for example between parietal and frontal regions, may contribute to unilateral neglect signs in animals (Gaffan & Hornak, 1997), as well as in humans (Doricchi & Tomaiuolo, 2003).
In a recent study partly inspired by the present simulation results, Thiebaut de Schotten et al. (2005) employed direct electrical cerebral stimulation, which transitorily inhibits the stimulated stricture, in human neurosurgical patients performing a line bisection task. Results showed that rightward deviations of the subjective middle of the line (a typical sign of left neglect) occurred upon stimulation of right-hemisphere cortical areas whose lesion is commonly associated with neglect (the supramarginal gyrus of the parietal lobe and the caudal part of the superior temporal gyrus); importantly, however, the strongest deviations occurred with white matter inactivation. Fiber tracking identified the inactivated site as the likely human homologue of the second branch of the superior longitudinal fasciculus, a parietal-frontal pathway described in the monkey by Schmahmann and Pandya (2006). A possibility consistent with the present simulation results is that parieto-frontal disconnection results in an interaction between (1) decreased salience of contralesional stimuli (parietal component), and (2) impairment of contralaterally–directed orienting movements (frontal component) (Bartolomeo, 2006). More in general, disconnections are likely to disrupt the integrated activity of several remote brain areas required for the emergence of conscious stimulus processing (Dehaene & Naccache, 2001). The present results indicate that simulation approaches with explicit consideration of bodily movements can offer new perspectives on the cognitive neurosciences of attention and its disorders.
Acknowledgments
This study was supported by a joint grant from the French institute for biomedical research (Inserm) and the Italian national research council (CNR). We thank Thomas Hope and three anonymous reviewers for helpful comments.
Footnotes
The central sector of the simulated retina might have emerged as a fovea because it was the only one that, independent of lateral gaze shifts, was always in line with a sector of the simulated space. However, we note that central foveas are the rule in natural settings, presumably because they do not entail any directional bias in foveation movements. Therefore, we believe that the emergence of a central fovea in our simulations is consistent with real settings.
We ran a set of simulations using the same network architecture as in figure 5, in which the eye output was ignored, and with the same parameters (mutation rate, number of generations, etc) used in simulation 1. In all the seeds, the agents succeeded in solving the task.
One might wonder whether orienting movements led to the development of the fovea, or vice-versa. This seems a typical chicken-and-egg problem. In natural settings, co-evolution of different but interacting characteristics is frequently observed, and it is often hard to say which one comes first (see, for example, the parallel evolution of particular species of fig trees and of their “private” species of wasps described in Dawkins, 1996).
Some displays were associated with both an eye and an arm movement. However, the pattern of activation in the arm units did not necessarily produce a key press, but only a movement towards a particular key. Thus, if on subsequent iterations there was an eye movement, then the arm activation pattern changed and the foveated object became the target of the arm movement. Thus, for example, the display with B on the left and C in the middle in Fig. 9 initially evoked a movement towards C, but, on subsequent iterations, B was foveated and the pattern of activation of the arm units changed to induce a reaching of the B key.
References
- Anderson B. A mathematical model of line bisection behaviour in neglect. Brain. 1996;119(Pt 3):841–850. doi: 10.1093/brain/119.3.841. [DOI] [PubMed] [Google Scholar]
- Anderson B. A computational model of neglect dyslexia. Cortex. 1999;35(2):201–218. doi: 10.1016/s0010-9452(08)70794-9. [DOI] [PubMed] [Google Scholar]
- Arbib MA. Perceptual structures and distributed motor control. In: Brooks VB, editor. Handbook of physiology: The nervous system ii. Motor control. Bethesda, MD: American Physiological Society; 1981. pp. 1449–1480. [Google Scholar]
- Ballard DH, Hayhoe MM, Pook PK, Rao RPN. Deictic codes for the embodiment of cognition. Behavioral and Brain Sciences. 1997;20(4):723–767. doi: 10.1017/s0140525x97001611. [DOI] [PubMed] [Google Scholar]
- Bartolomeo P. A parieto-frontal network for spatial awareness in the right hemisphere of the human brain. Archives of Neurology. 2006;63:1238–1241. doi: 10.1001/archneur.63.9.1238. [DOI] [PubMed] [Google Scholar]
- Bartolomeo P, Chokron S. Left unilateral neglect or right hyperattention? Neurology. 1999;53(9):2023–2027. doi: 10.1212/wnl.53.9.2023. [DOI] [PubMed] [Google Scholar]
- Bartolomeo P, Chokron S. Orienting of attention in left unilateral neglect. Neuroscience and Biobehavioral Reviews. 2002;26(2):217–234. doi: 10.1016/s0149-7634(01)00065-3. [DOI] [PubMed] [Google Scholar]
- Bartolomeo P, Chokron S, Siéroff E. Facilitation instead of inhibition for repeated right-sided events in left neglect. NeuroReport. 1999;10(16):3353–3357. doi: 10.1097/00001756-199911080-00018. [DOI] [PubMed] [Google Scholar]
- Bartolomeo P, Pagliarini L, Parisi D. Emergence of orienting behavior in ecological neural networks. Neural Processing Letters. 2002;15(1):69–76. [Google Scholar]
- Bartolomeo P, Siéroff E, Decaix C, Chokron S. Modulating the attentional bias in unilateral neglect: The effects of the strategic set. Experimental Brain Research. 2001;137(3/4):424–431. doi: 10.1007/s002210000642. [DOI] [PubMed] [Google Scholar]
- Bartolomeo P, Urbanski M, Chokron S, Chainay H, Moroni C, Sieroff E, et al. Neglected attention in apparent spatial compression. Neuropsychologia. 2004;42(1):49–61. doi: 10.1016/s0028-3932(03)00146-5. [DOI] [PubMed] [Google Scholar]
- Calabretta R, Di Ferdinando A, Parisi D. Ecological neural networks for object recognition and generalization. Neural Processing Letters. 2004;19:37–48. [Google Scholar]
- Chokron S, Colliot P, Bartolomeo P. The role of vision on spatial representations. Cortex. 2004;40(2):281–290. doi: 10.1016/s0010-9452(08)70123-0. [DOI] [PubMed] [Google Scholar]
- Clark A. Being there: Putting brain, body, and world together again. Cambridge, Mass: MIT Press; 1997. [Google Scholar]
- Cohen JD, Romero RD, Farah MJ, Servan-Schreiber D. Mechanisms of spatial attention: The relation of macrostructure to microstructure in parietal neglect. Journal of Cognitive Neuroscience. 1994;6(4):377–387. doi: 10.1162/jocn.1994.6.4.377. [DOI] [PubMed] [Google Scholar]
- Corbetta M, Shulman GL. Control of goal-directed and stimulus-driven attention in the brain. Nature Reviews Neuroscience. 2002;3(3):201–215. doi: 10.1038/nrn755. [DOI] [PubMed] [Google Scholar]
- D’Erme P, Robertson IH, Bartolomeo P, Daniele A, Gainotti G. Early rightwards orienting of attention on simple reaction time performance in patients with left-sided neglect. Neuropsychologia. 1992;30(11):989–1000. doi: 10.1016/0028-3932(92)90050-v. [DOI] [PubMed] [Google Scholar]
- Dawkins R. Climbing mount improbable. London: Penguin Books; 1996. [Google Scholar]
- De Renzi E, Gentilini M, Faglioni P, Barbieri C. Attentional shifts toward the rightmost stimuli in patients with left visual neglect. Cortex. 1989;25:231–237. doi: 10.1016/s0010-9452(89)80039-5. [DOI] [PubMed] [Google Scholar]
- Dehaene S, Naccache L. Towards a cognitive neuroscience of consciousness: Basic evidence and a workspace framework. Cognition. 2001;79(1–2):1–37. doi: 10.1016/s0010-0277(00)00123-2. [DOI] [PubMed] [Google Scholar]
- Desimone R, Duncan J. Neural mechanisms of selective visual attention. Annual Review in Neurosciences. 1995;18:193–222. doi: 10.1146/annurev.ne.18.030195.001205. [DOI] [PubMed] [Google Scholar]
- Di Ferdinando A, Casarotti M, Vallar G, Zorzi M. Hemispheric asymmetries in the neglect syndrome: A computational study. In: Cangelosi A, Bugmann G, Borisyuk R, editors. Modelling language, cognition and action. Singapore: World Scientific; 2005. pp. 249–258. [Google Scholar]
- Di Ferdinando A, Parisi D. Internal representations of sensory input reflect the motor output with which organisms respond to the input. In: Carsetti A, editor. Seeing, thinking and knowing. Dordrecht: Kluwer; 2004. pp. 115–141. [Google Scholar]
- Di Pellegrino G, De Renzi E. An experimental investigation on the nature of extinction. Neuropsychologia. 1995;33(2):153–170. doi: 10.1016/0028-3932(94)00111-2. [DOI] [PubMed] [Google Scholar]
- Doricchi F, Tomaiuolo F. The anatomy of neglect without hemianopia: A key role for parietal-frontal disconnection? NeuroReport. 2003;14(11):2239–2243. doi: 10.1097/00001756-200312020-00021. [DOI] [PubMed] [Google Scholar]
- Driver J, Pouget A. Object-centered visual neglect, or relative egocentric neglect? Journal of Cognitive Neuroscience. 2000;12(3):542–545. doi: 10.1162/089892900562192. [DOI] [PubMed] [Google Scholar]
- Gaffan D, Hornak J. Visual neglect in the monkey. Representation and disconnection. Brain. 1997;120(Pt 9):1647–1657. doi: 10.1093/brain/120.9.1647. [DOI] [PubMed] [Google Scholar]
- Gainotti G, D’Erme P, Bartolomeo P. Early orientation of attention toward the half space ipsilateral to the lesion in patients with unilateral brain damage. Journal of Neurology, Neurosurgery and Psychiatry. 1991;54:1082–1089. doi: 10.1136/jnnp.54.12.1082. [DOI] [PMC free article] [PubMed] [Google Scholar]
- Hafed ZM, Clark JJ. Microsaccades as an overt measure of covert attention shifts. Vision Research. 2002;42(22):2533–2545. doi: 10.1016/s0042-6989(02)00263-8. [DOI] [PubMed] [Google Scholar]
- Halligan PW, Marshall JC. Toward a principled explanation of unilateral neglect. Cognitive Neuropsychology. 1994;11(2):167–206. [Google Scholar]
- Hoffman JE, Subramaniam B. The role of visual attention in saccadic eye movements. Perception and Psychophysics. 1995;57(6):787–795. doi: 10.3758/bf03206794. [DOI] [PubMed] [Google Scholar]
- Kooistra CA, Heilman KM. Hemispatial visual inattention masquerading as hemianopia. Neurology. 1989;39(8):1125–1127. doi: 10.1212/wnl.39.8.1125. [DOI] [PubMed] [Google Scholar]
- Langton CG. Artificial life. Reading (MA): Addison Wesley; 1989. [Google Scholar]
- Losier BJ, Klein RM. A review of the evidence for a disengage deficit following parietal lobe damage. Neuroscience and Biobehavioral Reviews. 2001;25(1):1–13. doi: 10.1016/s0149-7634(00)00046-4. [DOI] [PubMed] [Google Scholar]
- Mark VW, Kooistra CA, Heilman KM. Hemispatial neglect affected by non-neglected stimuli. Neurology. 1988;38(8):640–643. doi: 10.1212/wnl.38.8.1207. [DOI] [PubMed] [Google Scholar]
- Marshall JC, Halligan PW. Does the midsagittal plane play any privileged role in “left” neglect? Cognitive Neuropsychology. 1989;6(4):403–422. [Google Scholar]
- Mesulam MM. Spatial attention and neglect: Parietal, frontal and cingulate contributions to the mental representation and attentional targeting of salient extrapersonal events. Philosophical Transactions of the Royal Society of London B. 1999;354(1387):1325–1346. doi: 10.1098/rstb.1999.0482. [DOI] [PMC free article] [PubMed] [Google Scholar]
- Milner AD, Goodale MA. The visual brain in action. Oxford: Oxford University Press; 1995. [Google Scholar]
- Mishkin M, Ungerleider LG, Macko KA. Object vision and spatial vision: Two cortical pathways. Trends in Neurosciences. 1983;6:414–417. [Google Scholar]
- Mitchell M. An introduction to genetic algorithms. Cambridge (MA): The MIT Press; 1997. [Google Scholar]
- Monaghan P, Shillcock R. Hemispheric asymmetries in cognitive modeling: Connectionist modeling of unilateral visual neglect. Psychological Review. 2004;111(2):283–308. doi: 10.1037/0033-295X.111.2.283. [DOI] [PubMed] [Google Scholar]
- Mozer MC. Frames of reference in unilateral neglect and visual perception: A computational perspective. Psychological Review. 2002;109(1):156–185. doi: 10.1037/0033-295x.109.1.156. [DOI] [PubMed] [Google Scholar]
- Mozer MC, Behrmann M. On the interaction of selective attention and lexical knowledge: A connectionist account of neglect dyslexia. Journal of Cognitive Neuroscience. 1990;2:96–123. doi: 10.1162/jocn.1990.2.2.96. [DOI] [PubMed] [Google Scholar]
- Mozer MC, Halligan PW, Marshall JC. The end of the line for a brain-damaged model of unilateral neglect. Journal of Cognitive Neuroscience. 1997;9(2):171–190. doi: 10.1162/jocn.1997.9.2.171. [DOI] [PubMed] [Google Scholar]
- O’Regan JK. Solving the “real” mysteries of visual perception: The world as an outside memory. Canadian Journal of Psychology. 1992;46(3):461–488. doi: 10.1037/h0084327. [DOI] [PubMed] [Google Scholar]
- Parasuraman R, editor. The attentive brain. Cambridge (MA): The MIT Press; 1998. [Google Scholar]
- Parisi D, Cecconi F, Nolfi S. Econets: Neural networks that learn in an environment. Network. 1990;1:149–168. [Google Scholar]
- Posner MI, Walker JA, Friedrich FJ, Rafal RD. Effects of parietal injury on covert orienting of attention. Journal of Neuroscience. 1984;4:1863–1874. doi: 10.1523/JNEUROSCI.04-07-01863.1984. [DOI] [PMC free article] [PubMed] [Google Scholar]
- Pouget A, Sejnowski TJ. Spatial transformations in the parietal cortex using basis functions. Journal of Cognitive Neuroscience. 1997;9(2):222–237. doi: 10.1162/jocn.1997.9.2.222. [DOI] [PubMed] [Google Scholar]
- Pouget A, Sejnowski TJ. Simulating a lesion in a basis function model of spatial representations: Comparison with hemineglect. Psychological Review. 2001;108(3):653–673. doi: 10.1037/0033-295x.108.3.653. [DOI] [PubMed] [Google Scholar]
- Rizzolatti G, Riggio L, Sheliga BM. Space and selective attention. In: Umilta C, Moscovitch M, editors. Attention and performance xv: Conscious and nonconscious information processing. Cambridge, MA: The MIT Press; 1994. pp. 231–265. [Google Scholar]
- Rueckl JG, Cave KR, Kosslyn SM. Why are “what” and “where” processed by separate cortical visual systems? A computational investigation. Journal of Cognitive Neuroscience. 1989;1:171–186. doi: 10.1162/jocn.1989.1.2.171. [DOI] [PubMed] [Google Scholar]
- Schmahmann JD, Pandya DN. Fiber pathways of the brain. New York: Oxford University Press; 2006. [Google Scholar]
- Sokolov EN. Higher nervous functions: The orienting reflex. Annual Review in Physiology. 1963;25:545–580. doi: 10.1146/annurev.ph.25.030163.002553. [DOI] [PubMed] [Google Scholar]
- Thiebaut de Schotten M, Urbanski M, Duffau H, Volle E, Lévy R, Dubois B, et al. Direct evidence for a parietal-frontal pathway subserving spatial awareness in humans. Science. 2005;309(5744):2226–2228. doi: 10.1126/science.1116251. [DOI] [PubMed] [Google Scholar]


