

Abstract
A theory has been proposed recently that asserts that the problem that people who stutter have arises when these speakers attempt to execute speech at a faster rate than planning processes allow. This leads speakers to complete words before the following one is ready. Plan unavailability usually happens on the more complex content words rather than the relatively simple function words. There are two ways of dealing with this situation when it arises. Speakers can (1) delay production of a content word by repeating prior function words or (2) carry on and attempt to produce the following content word and gamble that the remainder of the plan arrives while it is being executed. The former strategy does not lead speakers to persist in their dysfluency, while the latter does. It is proposed that the pressure on speech rate that leads speakers to adopt the latter strategy is particularly acute around adolescence. In this article two experiments are reported which test the effects of rate on fluency. In Experiment 1, fluent speakers are induced to produce stuttering-like dysfluencies on content words using a commentary task. A prediction of the theory is that procedures known to induce fluency have to produce local slowing of speech so that planning and execution can get back in synchrony. This prediction is confirmed for frequency-shifted feedback and when speakers who stutter have to sing in Experiment 2. Results are discussed in terms of the model for the etiology of stuttering based on plan unavailability. The implications of the results are also discussed with respect to the diagnosis of the disorder and how it can be treated.
Keywords: stuttering, speech rate, modification, fluency reversal
A common feature of childhood nonfluency is repetition of words that occupy early positions in utterances. The repetition usually happens on function words (pronouns, articles, prepositions, conjunctions and auxiliary verbs) rather than content words (nouns, main verbs, adverbs, and adjectives). On the face of it, dysfluency on function words is somewhat surprising as content words are phonologically more difficult than function words (Howell et al., 1999a). Therefore, in an example such as “I slipped,” the personal pronoun consists of a single vowel sound. The content word “slipped” starts with a more complex consonant string that includes consonants that emerge late in development (Sander, 1972). Maclay and Osgood (1959) noted that word repetition is also a common form of nonfluency in fluent adult speech. Although they did not explicitly comment that the repetitions occur on function words, the examples they give involve dysfluency on this class of words. The same dysfluency characteristic is exhibited by young people who stutter. Howell and Au-Yeung (1995), for example, reported that repetition of “and” when it occupies the initial position in a clause was more prevalent in young people who stutter than in older ones. The developmental differences in the Howell and Au-Yeung (1995) study suggest that there is a reduction in repetition of function words as speakers who stutter get older. If so, this could potentially hold important clues about how speech changes from normal nonfluency to persistent dysfluency. This phenomenon merits study, then, as it could have roles in elucidating the etiology of the disorder and potentially provide important diagnostic criteria to differentiate people who will persist in their stutter from people who will recover their fluency.
A suggestion has been made in the literature on the development of fluent speech concerning the role that word repetition serves. Clark and Clark (1977) proposed that word repetition occurs when the plan for a subsequent word or words is not available. Speakers repeat the preceding word until the plan for the subsequent word is complete. We have already observed that function words, in particular, are more prone to repetition when they occur in an early position in an utterance. The words for which the plan is not available are likely to be subsequently more complex content words. Thus, in our modification of Clark and Clark’s (1959) point of view, function words that appear before a content word are likely to be repeated because the plan for the following content word is not available. One test of the hypothesis is that repetition should occur only on function words that precede a content word. Au-Yeung et al. (1998) assessed this prediction. They used Selkirk’s (1984) phonological words to establish whether each function word appeared before or after the content word. Selkirk’s phonological words consist of a single content words with an optional number (which can be zero) of function word preceding and following it. Au-Yeung et al. (1998) tested five groups of speakers who stutter, between 2.5 and 40 years of age, and found that for all these groups, well over 90% of stuttering on function words occurred on those that preceded, as opposed to followed, content words.
This analysis showed the importance of function word position in relation to a content word. It is also important to know when stuttering occurs on function and when on content words and whether and how this changes as speakers persist in their stuttering to later ages. It is known from available evidence that dysfluency in young children occurs mainly on function words (Bloodstein and Gantwerk, 1967; Bloodstein and Grossman, 1981) but changes to occurring predominantly on content words in older speakers (Brown, 1945). Our hypothesis suggests that repetition of function words prevents stutterings occurring on content words. Conversely, dysfluencies on content words appear when speakers cease repeating function words. To test this, Howell et al. (1999b) examined whether repetition of function words and stuttering on content words occurred in an either/or manner. Phonological words were located for analysis that had at least one function word, then its content word and, optionally, further function words that followed the content word. These phonological words allowed stuttering on initial function words, on content words, or on both. At least 78% (across age groups) of all stutterings occurred within this type of phonological word, and, as in the analysis mentioned earlier (Au-Yeung et al., 1998), there was very little stuttering on function words that followed the content word. The crucial finding for assessing whether stuttering on function or content words occurs in complementary distribution was that in 95% of cases, stuttering occurred on either the initial function word or the content word, not both.
In the subsequent part of their study, Howell et al. (1999b) hypothesized that people who persist in their stutter deal with the situation when the plan for a content word is not available in a different way to fluent speakers. Speakers who are fluent or young people who stutter delay by repeating prior function words. Speakers who persist in their stutter cease delaying and attempt to utter a content word on the basis of a partial plan. Phonological words that showed a dysfluency on the initial function word or on the content word were examined to see whether dysfluencies on function words declined and that on content words increased as speakers who stutter get older. For the people who stutter, stuttering rate between these classes changed dramatically over age groups: Young people who stutter showed a high dysfluency rate on function words and a low rate on content words. Stuttering on function words declined and that on content words increased up to teenage, at which point most stuttering occurred on content words. There was no further change at ages beyond teenage. For fluent speakers, the rate of stuttering on function and content words was roughly constant over age groups. If, as Clark and Clark (1977) suppose, repetition serves the role of allowing more time for planning subsequent words (an essentially fluent tactic), advancing to the content words would be interpreted as showing that these older speakers who stutter attempt words for which complete plans are not available (stuttering tactic).
According to the preceding account, people who stutter do not have deficient central nervous system (CNS) structures compared with fluent speakers but adopt different procedures for executing speech plans. Speakers who stutter advance through an utterance at a faster rate than the planning processes allow. One finding that is consistent with this view is that, in many studies, global decreases in speech rate throughout an utterance have been found to lead to decreases in frequency of stuttering. Thus, Johnson and Rosen (1937) reported that the amount of stuttering declined during slow speech compared with normal rate speech. Other researchers who have confirmed this conclusion are Perkins et al. (1991), Starkweather (1985), and Wingate (1976). On the other hand, Kalinowski and his colleagues have reported results employing altered auditory feedback that have led them to question whether a slow rate is always necessary for fluency to improve (Kalinowski et al., 1993, 1995, 1996). The converse effect on fluency has been reported when speech rate is increased. Thus, Johnson and Rosen (1937) found that subjects had greater difficulty in speaking at fast rates compared to slower rates. Bloodstein (1987) also noted that high speaking rates can result in stuttering. Again, there are discrepant findings: although Kalinowski et al. (1993) found that when reading at a faster than normal rate, 7 of 9 subjects showed an increase in stuttering frequency, Kalinowski et al. (1995) obtained no difference in stuttering frequency between normal and fast rates. Consequently, Kalinowski et al. (1995) concluded that an increase in speech rate does not determine stuttering frequency with the same consistency as does a decrease in rate. Our account suggests a possible resolution of the discrepant findings reported by Kalinowski and colleagues. Both of these studies used a global measure of speech rate. Our account maintains that rapid rates of speech will lead to dysfluency only in local regions where the speech rate is high and the words that have to be produced are complex. The global rate can remain constant over conditions when speech rate is slowed in the problematic local regions if speakers use a narrower range of rate variations around the same global mean rate.
According to the preceding account, the plan will change from being available to being unavailable, depending on the local rate and the linguistic difficulty of the sounds (where the latter is associated with the content/function word distinction). Incidentally, the interplay between speech rate and word complexity explains why people who stutter are dysfluent intermittently. Theories that propose structural deficits in the CNS lead to stuttering (e.g., Fox et al., 1996) cannot explain this intermittency. Although most of the findings show that the global rate reduces the amount of stuttering and global rate increases lead to more stuttering, no test has been made as to whether local changes in speech rate affect stuttering as maintained in the account.
The present study tests some predictions concerning the association between local speech rate changes and variations in stuttering rate and explores the developmental implications of the model in the General Discussion. In Experiment 1, we examine whether stuttering-like dysfluencies can be induced in fluent speakers on content words when rate increases occur. Although this is a critical experimental test, most sufferers of stuttering want to know what they can do to achieve the reverse. To gain a better understanding about how rate is tied up with dysfluency on a content word, the second experiment examines whether rate “slowing” in people who stutter occurs with procedures known to lead to improvement in fluency. The account proposes that a necessary prerequisite for enhanced fluency is slowing the rate of the fast stretches of speech. It is known that when mean speech rate is slowed in various ways, stuttering decreases. Examples where rate slowing occurs include when speech breathing is controlled, when speaking takes place in time to a metronome, and under various form of altered auditory feedback (AAF) such as delayed auditory feedback (DAF). All of these techniques produce unnatural but readily apparent slowing. According to the preceding account, such a drastic change in rate is unnecessary, as only the fastest stretches around difficult content words need slowing. In the second experiment, techniques that enhance fluency and where rate change is more subtle, or less apparent, are examined. The two procedures investigated are frequency-shifted feedback (FSF) and singing. They are examined specifically to establish whether they reduce the relative frequency of rapid stretches of speech locally and globally.
EXPERIMENT 1
The theory predicts that pressure on speech rate lead to the speech plan not being available for output and that, when speakers attempt to produce speech based on an incomplete plan, stuttering will occur. This predicts that fluent speakers too will produce stuttering-like behavior when planning and execution are out of synchrony due to pressures on speech rate. Interpretation of a study by Blackmer and Mitton (1991) offers some support for this hypothesis. These authors reported an analysis of speech errors and repairs of fluent speakers recorded from late night radio chat shows. Howell and co-workers’ (1991) analysis shows how such dysfluencies relate to stutterings. Blackmer and Mitton (1991) did not differentiate repetition of function words (delaying) and stuttering on content words. Many examples they discuss, however, involve repetition of function words. An interesting point of similarity between their interpretation of their study and the current account is that they argued the repetitions occurred when the plan for a subsequent word is not available. According to our extension of Clark and Clark’s (1977) hypothesis, the rapid repetition of function words would lead to avoidance of problems on subsequent content words. If they do not delay production of a content word but attempt it instead on the basis of an incomplete plan, stuttering-like dysfluencies should occur. It is critical to determine whether rapid speech rate leads to dysfluencies on content words as well as function words, in order to establish that both the fluent and the stuttering tactics reflect different ways of coping with plan unavailability for the content word. If, as at present, there is evidence only that the fluent tactic occurs in fluent speakers when the rate is high, it would be possible to argue that the origin of dysfluency on content words arises for different reasons than that on function words.
In the following experiment, fluent speakers were required to produce a running commentary on a video cartoon. As speakers have to keep up with the action, this is likely to lead them to push on to content words rather than phillibuster on function words. The local units over which speech rate variation is measured are tone units [TU (Crystal, 1987)]. Once speech has been segmented into TUs, the speech rate of each TU is measured and each TU examined to ascertain whether it contains a stuttering on a content word. It is predicted that frequency of stuttered-like dysfluencies on content words will be highest in the TUs that are spoken at rapid rates.
Method
Subjects
Twelve undergraduates served as subjects. They were all male, had no history of speech or hearing problems, and were in the age range 18 years 6 months to 21 years 3 months (mean age, 19 years 4 months). They were paid for their participation.
Materials and Procedure
Subjects were required to produce a running commentary on a 5-min cartoon video while they were viewing it. The cartoon had periods of rapid and more gradual changes in action that were expected to lead to a natural variation in speech rate in the commentary. Recordings were made in the same sound-attenuated booth used by Howell et al. (1998). The speech was transduced with a Sennheiser K6 microphone positioned 6 in. in front of the speaker, in direct line with the mouth. The speech was recorded on DAT tape and transferred digitally to computer for further processing. The speech from the DAT tapes was down-sampled to 20 kHz.
The primary analyses were carried out by a single judge with 7 years’ experience marking speech. Reliability of all aspects of this judge’s performance was checked against a second judge with 20 years’ experience (see below). The commentary was transcribed in orthographic form and the function and content words were marked. The end of each word was then located. This ensured that any pauses or word-initiation attempts were included at the start of the subsequent word (for the purpose of this experiment, word repetitions were also treated as word-initiation attempts). The position where each word ended was located with the aid of two traveling cursors superimposed on the oscillographic display of the speech waveform. Each cursor position was independently adjusted with a mouse. The first cursor was initially placed at the start of the speech. The second cursor was positioned where the end of the first word was located, determined by crossing backward and forward around the end of the word (Osberger and Levitt, 1981). The end marker was stored. This end marker was used as the start of the next word and the end of the next word in the sequence was located in the same way described previously. Filled pauses were treated as words both here and when the words were assessed for dysfluency. The judge worked through the recordings of each speaker sequentially. Tone unit boundaries were determined using a procedure similar to that employed to locate word end points.
Assessment Procedures for Dysfluencies
Since dysfluencies were defined so as to exclude function word repetition, few dysfluencies extended over groups of words (Howell et al., 1997a). The exceptions are single word revisions and idea abandonments. Both happened infrequently (<1% of words) and were excluded based on inspection of the transcriptions. In idea abandonments, the low frequency probably arose because a commentary task was used. Filled pauses were noted during the assessment procedure and excluded from further analysis. Due to the concentration on content word dysfluencies, the dysfluencies that occur are mainly what Howell et al. (1997a) refer to as lexical dysfluencies; the dysfluency types that occurred were predominantly part-word and word repetitions, prolongations, and broken words.
Assessments of these dysfluencies were made as follows. As stated previously, words were defined as the interval from the end of one word to the end of the next. Each word in the speech of all 12 subjects was assessed. The test procedure required specifying a random presentation order for all words so that the global context in which all judgments were made was as constant as possible [thus minimizing range effects (Parducci, 1965)]. The first randomly selected word was heard in isolation. After a short pause, the test word was heard along with the word that had preceded it (the two words had the same timing and were in the same order as in the original recording). Consequently, silent pauses were apparent when they occurred between the context and the test word. The test word alone and this word with the word that preceded it could be heard as often as the judge required by hitting the return key on the computer keyboard. Thus, presentation of the test and context words was initiated by the judge, and the current trial ended and the next trial commenced after the judge entered his responses (detailed in the following paragraph). The full context was not available at the beginning of the recording (in these cases, only the word to be judged was played in isolation beforehand).
Assessments obtained about each word were a rating about how comfortably the word “flowed” and a categorization of the word as fluent, prolongation, repetition of word or part-word, or other dysfluency [see Howell et al. (1997b) for details of how this procedure was applied for assessing the speech of people who stutter]. The flow judgments were made after the categorization on a 5-point scale. The 5-point scale employs a Likert (1932) scale format in which the judge indicated the extent to which he agreed with the statement that “the speech is flowing smoothly” (1 = agree and 5 = disagree, with intermediate values showing levels of agreement). Thus, it represents a judge’s assessment of the speaker’s ability or inability to proceed with speech (Perkins, 1990). It was stressed that the rating scale was not a finer-grained indication of whether a word is fluent or dysfluent: a word high in “flow” might nevertheless be categorized as fluent, or vice versa. Howell et al. (1997b) have shown that interjudge agreement is high for repetitions. Agreement about prolongations is also satisfactory provided that words called prolongation and given ratings of 4 or 5 are selected (as in the analyses below).
Reliability Measures
The judge’s reliability in all aspects of assessment has been compared with a second judge who was provided with the first judge’s transcription and independently marked out the TUs in a stretch of stuttered speech, marked the word positions for assessment of the fluency categories, and determined the fluency categorization of each spoken word in the speech material. For the judgment of TUs, the interjudge reliability was good, with a mean agreement of 89% (the average of TUs identified by the first judge and agreed by the second, and vice versa). Interjudge agreement about content and function words, calculated in a similar way, was 96.7%. Discrepancies in word boundary placement were less than 4%. There was no differential bias in position of word markers, as the second judge was about as likely to place his word marker before the main judge’s as the reverse. Interjudge agreement about fluency categories was 92% (again calculated in a similar way to agreement for TUs).
Results
The hypothesis that there is a greater likelihood of stuttering on TUs that are spoken at different rates was tested as follows. First, all TUs that had a single dysfluency on a content word and all those where there were no dysfluencies were selected. These TUs were then divided into fast, medium, and slow rate. To do this, articulation rates were measured in terms of number of syllables per second (syll/sec). The duration of each TU was computed by removing all pauses between words and, in the case of a TU with a dysfluency on a content word, the dysfluent content word as well. The number of syllables in all fluent words in a TU was then divided by the duration of the TU to produce the speech rate (syll/sec). A speech rate of 4-5 syll/sec was classified as medium [based on fluent speakers’ speech rate found by Pickett (1980)]. Speech rates above and below the 4-5 syll/sec range were classified as fast and slow, respectively. The proportion of TU that had a content word that was stuttered at each rate division was then calculated for each speaker.
A one-way ANOVA was performed on the proportion of TU stuttered at each utterance rate. This showed that the stuttering rate on content words in fast tone units was significantly higher than in tone units spoken at slower rates [F(2,33) = 6.1, p < .01]. The average stuttering rate across speakers on content words was 8.5% for slow rate, 7.9% for medium rate, and 17% for fast rate.
Discussion
This experiment shows that fluent speakers under rate pressure produce stuttering-like dysfluencies on content words. According to the theory outlined in the Introduction, when speakers increase their speech rate in specific regions, this can lead them to having to execute speech before planning is complete. The main factor in the theory is that it makes a specific link between speech breakdown and the regions where the speech rate is high. Most other theories regard the origin of speech breakdown as occurring centrally rather than during execution. For example, the covert repair hypothesis (Postma and Kolk, 1993) maintains that speech problems occur when speakers generate erroneous plans and that dysfluency arises when speakers covertly repair them rather than the plan being incomplete at the time of its execution. Recomputation to produce a fluent plan would take time and, consequently, would lead to a slower rate when a dysfluency occurs and requires repairing. This is the opposite to what has been found here.
Positron emission tomography (PET) scan studies have apparently found differences in activity in central locations between speakers who stutter and fluent speakers and between conditions when speech is fluent and conditions when it is dysfluent. Fox et al. (1996), for example, suggest that the supplementary motor area operates differently during dysfluent speech. There are serious methodological difficulties with PET scan studies. As well as establishing activity differences in the supplementary motor area, there is also evidence from PET scan studies that activity in the cerebellum differs between fluency conditions. This is noteworthy, as the cerebellum is traditionally regarded as responsible for organizing execution of motor acts including rate factors which, according to the current theory, would be a likely location for execution level effects. In the General Discussion a theoretical model is described which is intended to explain the mechanism by which these activity differences in the cerebellum arise and to consider their role in wider aspects of speech control.
A final point about this experiment is that, in the past, there has been interest in methods that permit stuttering to be simulated in fluent speakers so that experimental tests can be performed about how stuttering arises. Cherry and Sayers (1956), for example, used delayed auditory feedback (DAF) for this purpose. The current results suggest that tasks requiring variation in speech rate may be an appropriate way of achieving this goal.
EXPERIMENT 2
When the speech rate is high, speakers tend to be dysfluent. Conversely, procedures that are known to enhance fluency should lead to a reduction in speech rate in a particular way. The prediction that rate needs to be slowed to achieve fluency appears to be at odds with reports that certain altered auditory feedback procedures [frequency-shifted feedback (FSF), in particular (Howell et al., 1987)] produces improvements without changing the rate (Stuart et al., 1996). As mentioned in the Introduction, the same global speech rate can be maintained while at the same time reducing the incidence of fast rate sections. Reducing the rate of the fast sections alone would lead to speech becoming fluent. In this experiment, changes in the distributional characteristics under selected fluency-enhancing conditions are examined. The procedure adopted follows Ohala (1975), who examined the relationship between central tendency and variance in situations involving feedback alterations (masking noise and anaesthesia) in fluent speakers. The experimental situation is based on Ohala’s. However, the data are treated differently to obtain a better impression about what happens in the tails (25th and 75th percentiles) of the rate distribution. FSF is examined and, as mentioned, it has been claimed that global rate is unaffected in this situation. Singing, which also improves fluency, is investigated, as rate has not been investigated. Both situations are examined in children who stutter.
Method
Subjects and Materials
Nine children who stutter participated. Ages of the speakers ranged from 9 years 3 months to 12 years no months (mean age, 10 years 2 months). There were eight boys and one girl. All speakers had been assessed by therapists and were enrolled for a 2-week intensive therapy course. None of the speakers had received therapy before. The recordings were made when they first attended the course, prior to any treatment. Frequency of stuttering was on average 10.9% of words (range, 6.8 to 14.3%).
Procedure
The children were brought into the experimental cubicle and read silently the sentence, “Cathy took some cocoa with the teletubbies,” which was used in all conditions. This was done to familiarize the subject with the sentence. The children had to read and sing this sentence (voice conditions) in two listening conditions (normal listening and frequency shifting), giving four conditions in all. In each of these conditions, the sentence was repeated until it had been produced fluently 30 times altogether. Any dysfluent productions were discarded. One boy was dropped, as he was unable to produce the required number of readings of the sentence under normal listening conditions without dysfluencies.
In the FSF conditions (speaking and singing), speech was shifted up by one-half octave using commercially available hardware (Digitech Model Studio 400). The sounds were delivered at the subject’s most comfortable level over headphones. The same apparatus was used in the normal listening conditions but with no frequency shift. In the normal speaking conditions, the children were told to read the sentence in whatever way they found natural. In the singing conditions, the tune was modeled by the experimenter. The order of conditions was counterbalanced to avoid adaptation differentially affecting fluency enhancing conditions.
Recordings of the speakers were made in the Amplisilence sound-attenuated booth. Speech was transduced with a Sennheiser K6 microphone positioned 6 in. in front of the speaker in direct line with the mouth. Productions were recorded on DAT tape, transferred digitally to computer, and down-sampled to 20 kHz for analysis.
Assessment Procedure
All listening tests were performed in this same sound-attenuated booth. The speech was assessed in a quiet room where the computer was located. Test sounds were played binaurally from computer via a Fostex 6301B amplifier. The sound level was set at a comfortable level for listening over headphones and the level was checked to ensure that it remained constant (the headphones used were Model RS 250-924). The positions of six segmentation points were located in each fluent reading of the sentence by each speaker. The segmentation points are indicated by a “!” at the appropriate point beneath the sentence:
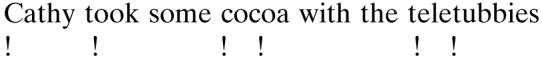
The segmentation points all occur in plosives, and onset of the plosive burst was marked. The two experienced speech researchers employed in Experiment 1 marked the segmentation points on all 30 utterances in each of the four conditions. Marking was done using the Osberger and Levitt (1981) procedure described in Experiment 1 for word end-point marking. The segmentation points of the two judges were close (less than 2 ms on average) and one judge’s markers were employed. The marker at the start of speech was used in conjunction with the subsequent five markers to specify five intervals (distance from the start of the speech to the first marker, distance from the start of the speech to the second marker, and so on). This follows the Ohala (1975) procedure in all essential details.
Results
The duration of each of the utterances between the first and the second marker was obtained. From these measures, the mean, shortest, and fastest interval and the 25th fastest and 75th fastest percentile points were calculated. This information is plotted as boxplots in Fig. 1. The plots are given over subjects, as there was a high degree of consistency between subjects. The boxplots in Fig. 1 show the interval between segmentation point 1 and segmentation point 2 for each of the four conditions indicated along the bottom axis. The line in the box represents the mean value and the extent of the box indicates the interquartile range. The extreme range of measurements is shown by the whiskers. The data for intervals between the first and the third, the first and the fourth, the first and the fifth, and the first and the sixth segmentation points are shown in Figs. 2 to 5, respectively.
Fig. 1.
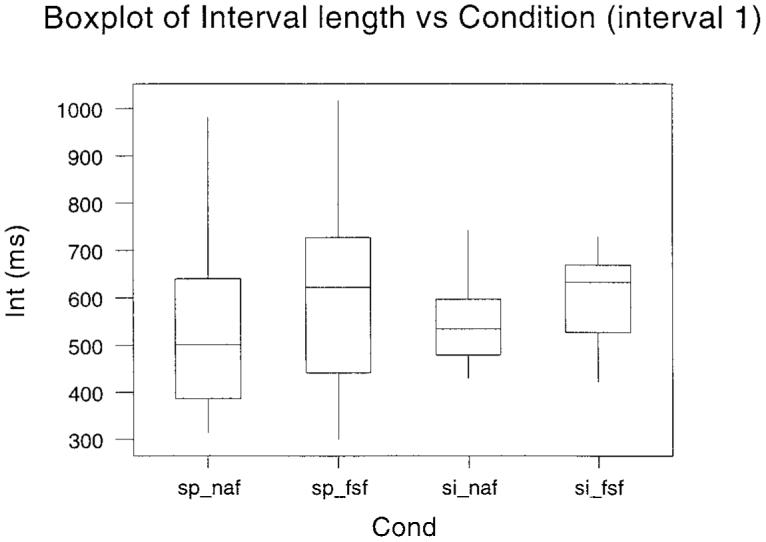
Boxplots of the interval between segmentation point 1 and segmentation point 2 for the four separate conditions conducted in Experiment 2. The experimental condition is given along the abscissa. The mean value is the bar within the box, and the box itself indicates the interquartile range. The range of measurements is shown by the whiskers.
Fig. 2.
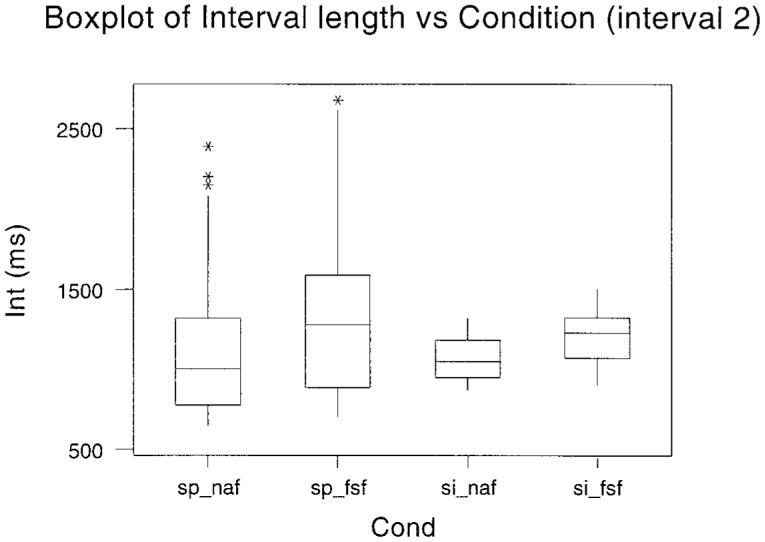
Boxplots of the interval between segmentation point 1 and segmentation point 3 for the four separate conditions conducted in Experiment 2. The experimental condition is given along the abscissa. The mean value is the bar within the box, and the box itself indicates the interquartile range. The range of measurements is shown by the whiskers.
Fig. 5.
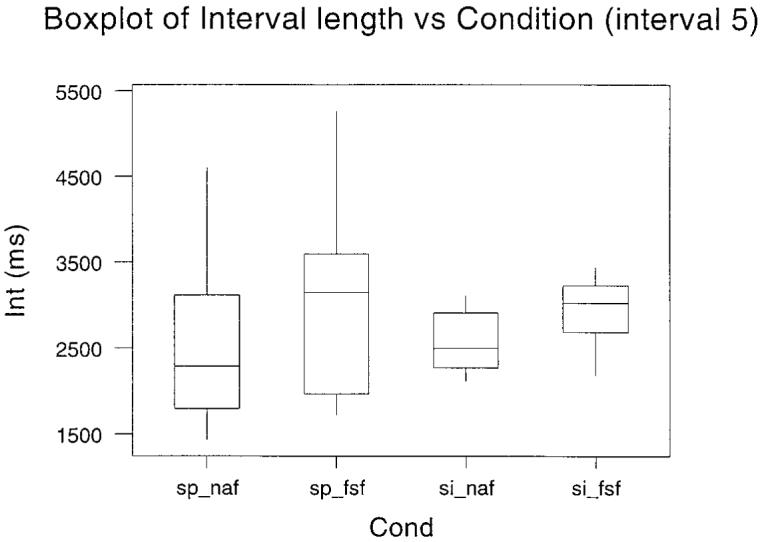
Boxplots of the interval between segmentation point 1 and segmentation point 6 for the four separate conditions conducted in Experiment 2. The experimental condition is given along the abscissa. The mean value is the bar within the box, and the box itself indicates the interquartile range. The range of measurements is shown by the whiskers.
Four separate tests were performed on the mean values for the individual subjects at each segmentation point: (a) Normal voice conditions were compared under normal and FSF listening conditions (sp_naf versus sp_fsf). (b) Sung voice conditions were compared also under normal and FSF listening conditions (si_naf versus si_fsf). (c) Speech and sung voice were compared when both were performed under the normal listening condition (sp_naf versus si_naf). (d) Speech and sung voice were compared when both were performed under the FSF listening condition (sp_fsf versus si_fsf). All comparisons were made by related t- tests (degrees of freedom was 6 in all cases). The t values are given in summary form in Table I. A one-tailed test was used and a p value <0.05 was taken as significant. An asterisk in parentheses indicates that the differences were significant at least at this level. Significant differences between means indicate that global slowing occurred due to listening (analyses a and b) or voice (analyses c and d) conditions. Under equivalent voice conditions, speech (row a) and sung voice (row b) were slowed under FSF for all intervals. This shows that FSF produces global slowing whether speech is spoken or sung. Under equivalent listening conditions, comparison of spoken and sung voice was not significant for any interval (row c) but sung voice was slowed significantly in comparison with spoken voice under FSF (row d). Thus, global slowing did not occur between speech and singing when normal voice was heard but did when FSF was heard.
Table I.
Summary of t Tests Performed on the Means in Experiment 2a
| Interval Between Start (1) and |
|||||
|---|---|---|---|---|---|
| 2 | 3 | 4 | 5 | 6 | |
| sp_naf sp_fsf | 3.30 (*) | 3.66 (*) | 3.99 (*) | 3.39 (*) | 3.67 (*) |
| si_naf si_fsf | 3.21 (*) | 3.06 (*) | 3.65 (*) | 2.91 (*) | 3.35 (*) |
| sp_naf si_naf | 1.36 | 1.75 | 1.44 | 1.88 | 1.80 |
| sp_fsf si_fsf | 3.21 (*) | 3.06 (*) | 3.65 (*) | 2.91 (*) | 3.35 (*) |
The interval between the start and each of the segmentation points is indicated at the top. The conditions compared are indicated in the left-hand column.
The abbreviations in the left column are as follows: sp_naf—spoken voice, normal listening; sp_fsf—spoken voice, FSF listening; si_naf—sung voice, normal listening; si_fsf—sung voice, FSF listening.
The 25th percentiles were chosen to test the hypothesis that fast tone units reduce in conditions known to enhance fluency. The 25th percentiles are a robust measure, as they are not susceptible to extreme outliers as for the values for the extreme bottom of the range. The 25th-percentile data were compared in the same way as the means. All differences in Table I were significant at the 5% level (again indicated by the asterisks in the parentheses). Results in Table I indicated that global slowing occurred for rows a, b, and d. Significant differences for these rows in Table II indicate that, perhaps not surprisingly, local slowing also occurred between these conditions. What is of particular interest is that the condition that showed no global slowing (row c in Table I) did show local slowing. This is the condition involving spoken and sung voice under normal listening conditions.
Table II.
Summary of t Tests Performed on the 25th-Percentile Points in Experiment 2a
| Interval Between Start (1) and |
|||||
|---|---|---|---|---|---|
| 2 | 3 | 4 | 5 | 6 | |
| sp_naf sp_fsf | 2.93 (*) | 3.44 (*) | 3.22 (*) | 2.94 (*) | 2.89 (*) |
| si_naf si_fsf | 2.94 (*) | 3.82 (*) | 3.90 (*) | 3.51 (*) | 4.10 (*) |
| sp_naf si_naf | 3.12 (*) | 3.52 (*) | 3.33 (*) | 3.63 (*) | 4.01 (*) |
| sp_fsf si_fsf | 3.04 (*) | 3.82 (*) | 3.90 (*) | 3.51 (*) | 4.10 (*) |
The interval between the start and each of the segmentation points is indicated at the top. The conditions compared are indicated in the left-hand column.
The abbreviations in the left column are as follows: sp_naf—spoken voice, normal listening; sp_fsf—spoken voice, FSF listening; si_naf—sung voice, normal listening; si_fsf—sung voice, FSF listening.
As mentioned under Method, the tune was modeled by the experimenter. In sung voice conditions, global rate differences might, then, reflect the rate that the model used. This did not appear to happen since spoken and sung voice did not differ in global rate (row c of Table I). Importantly, however, even though the same global rate was used between spoken and sung voice conditions under normal listening conditions, the subjects produced significant local slowing (the 25th percentile was significantly longer when subjects sung the material). As Figs. 1 to 5 show, no global slowing, but local slowing arose because the distribution of values around the mean reduced in the singing condition.
Discussion
Results of particular interest are what happens when listening condition changes from normal feedback to FSF when speakers are speaking (row a) and when voice condition changes from speaking to singing when hearing normal speech feedback (row c). Changing from hearing normal feedback to FSF produced global (Table I) and local (Table II) slowing. The global slowing that occurred is discrepant with Stuart et al. (1996). The current task is more sensitive than that employed by Stuart et al. (1996), though, on the other hand, less natural. Local slowing, in particular, has to occur according to our account as it did in these conditions.
Changing from speaking to singing when normal voice was heard did not produce global slowing. It did, however, result in the local slowing that is essential according to our explanation. Though changing to sung voice does not produce global slowing, changing from normal listening to FSF when singing produces global and local slowing (row b in Tables I and II). This suggests again that FSF is more effective at producing global slowing than is singing. Also, when changing from speaking to singing under FSF listening conditions, global and local slowing were observed (row d in Tables I and II). This suggests that the FSF listening condition interacts with voice condition leading to global as well as local slowing when voice is sung when FSF is heard. The critical test of the theory is that local slowing has to occur, which was observed in all the comparisons summarized in Table II.
GENERAL DISCUSSION
In the Introduction, the case was outlined for thinking that stuttering occurs when speech is produced at too fast a rate to keep planning and execution in synchrony that occurs predominantly on words in which phonological demand is high. The experiments reported tested this in two ways. Experiment 1 investigated whether fluent speakers exhibit stuttering-like dysfluencies on content words when they are required to speak rapidly. This experiment showed that this occurred and is consistent with the interpretation that planning and execution get out of synchrony when speech rate is high. The prediction tested in Experiment 2 concerned what happens to speech rate in conditions known to enhance people who stutter’s fluency. The prediction was made that in material where phonological demands was constant (achieved by using the same sentence), local speech rate slowing (at least) should occur in fluency-enhancing conditions. Analyses of a fluent sentence produced by children who stutter showed that the gross (global) rate slowed under FSF but not when singing. When a global rate change occurs, it should, according to the theory, lead to enhanced fluency. It is not necessary, however, for all of speech to be slowed—only the sections in which the rate is too high to keep planning and execution in synchrony.
We went on to examine what happens to the local distribution of sections of speech between segmentation points in an utterance. There was a reduction in sections of speech spoken rapidly relative to ordinarily spoken sections (revealed by the 25th percentile occurring at longer durations) for singing as well as FSF (which had shown a global change). This indicated that a local rate change occurred. Incidentally, results also showed that the 75th percentile in the singing/normal listening condition occurred at a lower value (a reduced range), which shows that a narrower range occurred around the same mean. This shows, as hypothesized in the Introduction, that global rate changes may not occur but, nevertheless, local changes that could lead to improved fluency could still occur. This effect might have occurred in Kalinowski’s studies that failed to find a global rate change in fluency-enhancing conditions.
One question that arises is why speakers who stutter tax their planning and execution systems by speaking too fast. The Howell et al. (1999b) research showing a shift from dysfluency on function words to stuttering on content words suggests that this happens just before adolescence. It may be that at around this age, speakers who stutter experience or suspect interlocutors may interrupt during periods where they are repeating function words. This then leads to them to drop the delaying tactic and attempt the content word. Currently, we do not have evidence whether this is so.
People who stutter speak too fast for planning to be completed and this leads to dysfluency. In this account, rate is not specified as part of the speech plan but is regulated during execution. The structure that is likely to subserve rate variation is the cerebellum. Consistent with this is the finding that activity differences have been observed in the cerebellum between fluent and dysfluent conditions both within and between speakers (Fox et al., 1996). If the PET scan data showing activity in the cerebellum is methodologically and statistically sound, why should cerebellar activity vary with a speaker’s fluency? The theory we have proposed suggests that the problem is in strategic use of rate changes, as opposed to an organic problem in this, or for that matter any other, CNS structure. We now want to provide more detail and apply the ideas to general phenomena associated with speech production. The basic assumption we make is that a check is made that the timing of actions, such as speech, is as intended. The mechanism that makes this check is general purpose, and when it determines that pairs of motor or sensory inputs are in synchrony there is no cross interference. An example that illustrates this is clapping in time with a song. This is a simple task and neither clapping nor singing is disrupted when the actions are synchronized. We propose that the comparison between two synchronized rhythmic events is done in the cerebellum (Kawato et al., 1987). The main difference between our view and Kawato et al.’s (1987) is that, according to our proposal, synchrony is detected by differencing pairs of inputs. An advantage of differencing is that it is a simple operation and so would be quick to perform (Kawato et al. propose that error trajectories are computed for corrective purposes).
In our preceding example, if the time for each clap is in synchrony with the syllable beat, there will be no difference. As the mechanism is general purpose, it can be used to check for synchrony between the planned and the executed forms of fluent speech: if the plan for a sound is in synchrony with an efferent copy of the form that is executed (i.e., being produced fluently), there will be no difference between the timing signals. A differencing mechanism like this cancels activity when speech is proceeding fluently so no further processing could occur subsequently. Beyond this point, speech would go on in open-loop mode that has been argued to occur in fluent speech (Borden, 1979). The check for a difference is made at the relatively low (cerebellar) level in the CNS. This contrasts with auditory monitoring views that consider that full perceptual processing is necessary to trigger the next sound in sequence (Fairbanks, 1955). Also, as a consequence that efferent copy is used and the simple difference processing which occurs at the low level in the CNS, this process would cause minimal slowing in comparison with an auditory monitoring account that requires full perceptual processing and taking corrective action.
As described to this point, the simple comparator described in the previous paragraph would produce a quiescent output when dealing with fluent speech. It would produce an alerting signal when speech is dysfluent according to the plan-execution model. If speakers attempt speech on the basis of a partial plan, the speech plan would continue to be updated in the time that the plan is being executed. When planned and executed forms are differenced, a discrepancy would be revealed. The differencing described in this case would provide an alerting signal in dysfluent regions. We propose that this processing leads to the increase in observed cerebellar activity in PET scan studies observed in conditions where speakers are dysfluent. This selective response and the relatively crude information it provides (that something has gone wrong, not exactly in what way speech has failed) again make it different from auditory feedback monitoring.
Some incidental observations about this proposal are appropriate before we describe how the mechanism would apply to AAF. First, it is not clear how activity in the cerebellum would appear according to the covert repair hypothesis. First, planning would occur at a more central level than the cerebellum. Such centralized activity would not account for cerebellar activity: assuming a central locus for planning, if people who stutter generate erroneous plans that can lead to dysfluencies, no difference would occur when a comparison of planned and executed form is made during fluent or dysfluent sections, as they would correspond. Second, concerning feedback monitoring accounts in general, note that altering the sound of the voice is a sufficient, but not a necessary condition for enhancing fluency. So, as discussed above, speech improves when speakers are induced to speak slowly even if their voice is not altered. Other evidence that suggests that peripheral auditory problems are not the main cause of stuttering are that peripheral hearing loss does not lead to stuttering (Harms and Malone, 1942) and no peripheral losses have been found that can be directly linked to stuttering (Howell et al., 1986).
To account for why stuttering persists, note that in fluent speech the cerebellum signals when a speaker is taxing the speech rate, which can lead to dysfluency. By definition, people who stutter experience appreciable amounts of dysfluent activity relative to fluent speakers that would activate the cerebellar mechanism like this. When people who stutter continue their speech attempt, they are demonstrably overriding the alerting signal. This would lead to adaptation of the synchronization detection mechanism. A recent experiment by Howell et al. (2000) has found that children who stutter have a backward masking deficit relative to control children. Further, the amount of deficit is correlated with the severity of stuttering. Backward masking is regarded as arising from central auditory processing rather than the peripheral processing dismissed as being associated with stuttering earlier. Could the backward masking deficit arise via the operation of the synchronization detection mechanism and, if so, does it offer any clues about how processing sound while speaking leads to improved fluency by slowing rate?
To address the first part of the question just posed, note that the components of a backward masking stimulus are asynchronized pairs of sounds that would activate the synchronisation detection mechanism. Backward masking stimuli consist of two components. Two things can happen to sounds during central auditory processing when the components are close together like the tone and masker in the backward masking condition; they can fuse or segregate (Bregman, 1990). The backward masking results may reflect differences in subjects’ ability to separate these sounds perceptually, with control subjects being more adept at this than children who stutter. The reason people who stutter are poorer at this is due to activity in the synchronization detection mechanism being suppressed during production in speakers who stutter. Suppression of this activity would generalize to other applications of this mechanism. When the mechanism is used in processing backward masking stimuli, the suppression would lead to poorer separability of the two components, which would then lead, in turn, to poorer backward masking performance. This account would explain why these speakers, in particular, are deficient in the backward masking task. The correlation between backward masking and speech production performance arises, then, through their use of this common mechanism. The main gain achieved by “explaining” a difference in thresholds as a difference in fusion performance at the cerebellar level is when simultaneous masking performance is considered. Simultaneous masking performance occurs at the periphery, where there is less possibility of separating the tone and masker and, so, no difference in threshold is expected between subject groups (as occurred).
Earlier, we proposed that people who stutter speak too fast to keep planning in synchrony with execution. The corollary of this is that if the speech rate is slowed, planning and execution would get back into synchrony and speech would proceed fluently. So can a case be made that, under altered auditory feedback conditions, slowing occurs? Altered auditory feedback sounds are created by temporal (Cherry and Sayers, 1956; Fairbanks, 1955; Ryan and van Kirk, 1974) or spectral (Howell et al., 1987) transformations of the voice. Both these transformations create situations favoring segregation of the speaker’s voice from the altered version (Bregman, 1990). This does not lead to slowing in and of itself. What it does do is to increase processing demand, which slows perceptual processing. The increased difficulty in perception leads to interference with the ongoing production that occurs when two tasks are performed concurrently (Shiffrin and Schneider, 1977). This slows motor performance, which allows time for planning and execution to get into synchrony. Planning processes would not be affected by the dual task situation that occurs, otherwise the sounds could still get out of synchrony. Slowing of speech would occur for all speakers (Ryan and van Kirk, 1974) but result in increased fluency only in people who stutter.
The implications of the findings for developmental diagnosis are that it underlines the need to check that speakers, particularly those around adolescence, are not taxing the speech rate. If this happens and a shift from stuttering on function words to stuttering on content words is occurring, speakers may be in danger of persisting in their disorder. The change in the pattern of dysfluencies around this age suggests that stuttering before this age is not firmly established. In their interview survey of stuttering children, Andrews and Harris (1964) concluded that most people who stutter start before age 6. This is not inconsistent with what we have proposed, as we are proposing only a point at which stuttering is more difficult to reverse, not at what age it starts. The Andrews and Harris (1964) data also suggest, as proposed here, that spontaneous recovery is unlikely after age 9, though we would put the age a little later than they do. The interpretation also has implications for programs of monitoring and intervention. A strong version of our interpretation is that before age 9, stuttering has not been established. High risk groups certainly need monitoring from a young age for the danger signs described. This does not mean, however, that early intervention is necessarily advisable at young ages.
In terms of treatment of stuttering, two big questions need answering: First, why is speech difficult to reverse to its fluent form after this transitional age but not at younger ages? The approach we are taking to address this question is to look at situations that vary in the amount of interference using different dual task procedures. Second, why, although temporary improvements can be brought about by many procedures that slow speech, does the fluent pattern not persist? We are investigating using FSF as a response prompt in conjunction with operant procedures to address this question.
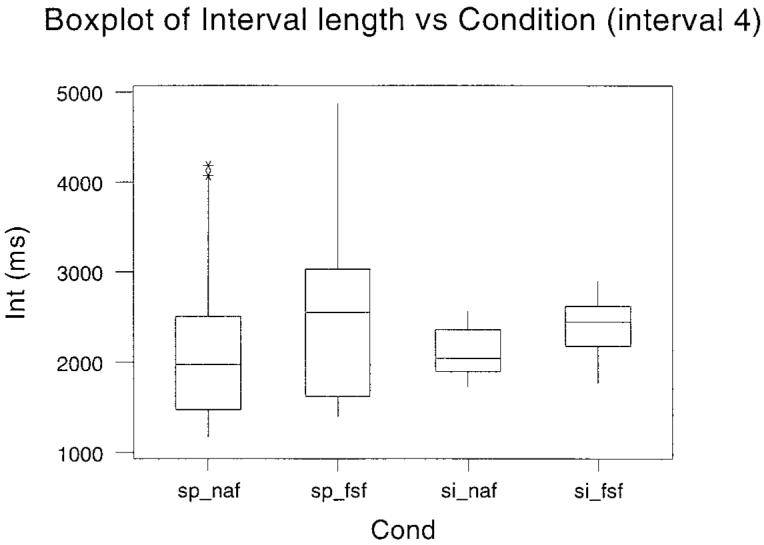
Fig. 3.
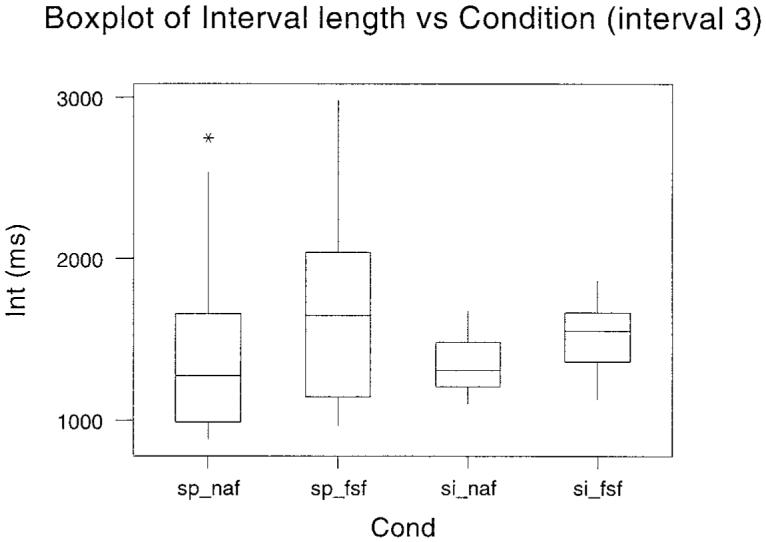
Boxplots of the interval between segmentation point 1 and segmentation point 4 for the four separate conditions conducted in Experiment 2. The experimental condition is given along the abscissa. The mean value is the bar within the box, and the box itself indicates the interquartile range. The range of measurements is shown by the whiskers.
Fig. 4.
Boxplots of the interval between segmentation point 1 and segmentation point 5 for the four separate conditions conducted in Experiment 2. The experimental condition is given along the abscissa. The mean value is the bar within the box, and the box itself indicates the interquartile range. The range of measurements is shown by the whiskers.
ACKNOWLEDGMENTS
This research was supported by a grant from the Wellcome Trust. The equipment for frequency shifting the voice was kindly provided by Joe Kalinowski and colleagues at East Carolina University.
REFERENCES
- Andrews G, Harris M. The syndrome of stuttering. London: Heinemann; 1964. [Google Scholar]
- Au-Yeung J, Howell P, Pilgrim L. Phonological words and stuttering on function words. J. Speech, Language Hear. Res. 1998;41:1019–1030. doi: 10.1044/jslhr.4105.1019. [DOI] [PMC free article] [PubMed] [Google Scholar]
- Blackmer ER, Mitton JL. Theories of monitoring and the timing of repairs in spontaneous speech. Cognition. 1991;39:173–194. doi: 10.1016/0010-0277(91)90052-6. [DOI] [PubMed] [Google Scholar]
- Bloodstein O. A Handbook on Stuttering. 4th ed. Chicago: National Easter Seal Society; 1987. [Google Scholar]
- Bloodstein O, Gantwerk BF. Grammatical function in relation to stuttering in young children. J. Speech Hear. Res. 1967;10:786–789. doi: 10.1044/jshr.1004.786. [DOI] [PubMed] [Google Scholar]
- Bloodstein O, Grossman M. Early stutterings: Some aspects of their form and distribution. J. Speech Hear. Res. 1981;24:298–302. [PubMed] [Google Scholar]
- Borden GJ. An interpretation of research on feedback interruption in speech. Brain Language. 1979;7:307–319. doi: 10.1016/0093-934x(79)90025-7. [DOI] [PubMed] [Google Scholar]
- Bregman AS. Auditory Scene Analysis: The Perceptual Organization of Sound. Cambridge MA: MIT Press; 1990. [Google Scholar]
- Brown SF. The loci of stutterings in the speech sequence. J. Speech Disord. 1945;10:182–192. [Google Scholar]
- Cherry C, Sayers B. Experiments on the total inhibition of stammering by external controls and some clinical results. J. Psychosom. Res. 1956;1:233–246. doi: 10.1016/0022-3999(56)90001-0. [DOI] [PubMed] [Google Scholar]
- Clark HH, Clark E. Psychology and Language. An Introduction to Psycholinguistics. New York: Harcourt; 1977. [Google Scholar]
- Crystal D. Clinical Linguistics. London: Edward Arnold; 1987. [Google Scholar]
- Fairbanks G. Selective vocal effects of delayed auditory feedback. J. Speech Hear. Disord. 1955;20:335–348. doi: 10.1044/jshd.2004.333. [DOI] [PubMed] [Google Scholar]
- Fox PT, Ingham RJ, Ingham JC, Hirsch T, Downs H, Martin C, Jerabek P, Glass T, Lancaster JL. A PET study of the neural systems of stuttering. Nature. 1996;382:158–162. doi: 10.1038/382158a0. [DOI] [PubMed] [Google Scholar]
- Harms MA, Malone JY. The relationship of hearing acuity to stammering. J. Speech Hear. Disord. 1942;4:363–370. [Google Scholar]
- Howell P, Au-Yeung J. Syntactic determinants of stuttering in the spontaneous speech of normally fluent and stuttering children. J. Fluency Disord. 1995;20:317–330. [Google Scholar]
- Howell P, Marchbanks RJ, El-Yaniv N. Middle ear muscle activity during vocalisation in normal speakers and stutterers. Acta Oto-Laryngol. 1986;102:396–402. doi: 10.3109/00016488609119423. [DOI] [PubMed] [Google Scholar]
- Howell P, El-Yaniv N, Powell DJ. Factors affecting fluency in stutterers when speaking under altered auditory feedback. In: Peters H, Hulstijn W, editors. Speech Motor Dynamics in Stuttering. New York: Springer; 1987. pp. 361–369. [Google Scholar]
- Howell P, Kadi-Hanifi K, Young K. Phrase revisions in fluent and stuttering children. In: Peters HGM, Hulstijn W, Starkweather CW, editors. Speech Motor Control and Stuttering. Amsterdam: Elsevier; 1991. pp. 409–414. [Google Scholar]
- Howell P, Au-Yeung J, Sackin S, Glenn K, Rustin L. Detection of supralexical dysfluencies in a text read by child stutterers. J. Fluency Disord. 1997a;22:299–307. doi: 10.1016/s0094-730x(97)00012-0. [DOI] [PubMed] [Google Scholar]
- Howell P, Sackin S, Glenn K. Development of a two-stage procedure for the automatic recognition of dysfluencies in the speech of children who stutter. 1. Psychometric procedures appropriate for selection of training material for lexical dysfluency classifiers. J. Speech Language Hear. Res. 1997b;40:1073–1084. doi: 10.1044/jslhr.4005.1073. [DOI] [PMC free article] [PubMed] [Google Scholar]
- Howell P, Staveley A, Sackin S, Rustin L. Methods of interval selection, presence of noise and their effects on detectability of repetition and prolongation. J. Acoust. Soc. 1998;104:3558–3567. doi: 10.1121/1.423937. [DOI] [PMC free article] [PubMed] [Google Scholar]
- Howell P, Au-Yeung J, Pilgrim L. Utterance rate and linguistic properties as determinants of speech dysfluency in children who stutter. J. Acoust. Soc. Am. 1999a;105:481–490. doi: 10.1121/1.424585. [DOI] [PMC free article] [PubMed] [Google Scholar]
- Howell P, Au-Yeung J, Sackin S. Exchange of stuttering from function words to content words with age. J. Speech Language Hear. Res. 1999b;42:345–354. doi: 10.1044/jslhr.4202.345. [DOI] [PMC free article] [PubMed] [Google Scholar]
- Howell P, Rosen S, Hannigan G, Rustin L. Deficits in auditory temporal resolution in children who stutter and its relation to dysfluency rate. Percept. Motor Skills. 2000;90:355–363. doi: 10.2466/pms.2000.90.2.355. [DOI] [PubMed] [Google Scholar]
- Johnson W, Rosen L. Effect of certain changes in speech pattern upon frequency of stuttering. J. Speech Disord. 1937;2:105–109. [Google Scholar]
- Kalinowski J, Armson J, Mieszkowski M, Stuart A, Gracco VL. Effects of alterations in auditory feedback and speech rate on stuttering frequency. Language Speech. 1993;36:1–16. doi: 10.1177/002383099303600101. [DOI] [PubMed] [Google Scholar]
- Kalinowski J, Armson J, Stuart A. Effect of normal and fast articulatory rates on stuttering frequency. J. Fluency Disord. 1995;20:293–302. [Google Scholar]
- Kalinowski J, Stuart A, Sark S, Armson J. Stuttering amelioration at various auditory feedback delays and speech rates. Eur. J. Disord. Commun. 1996;31:259–269. doi: 10.3109/13682829609033157. [DOI] [PubMed] [Google Scholar]
- Kawato M, Furakawa K, Suzuki R. A hierarchical neural-network model for control and learning of voluntary movement. Biol. Cybernet. 1987;57:169–185. doi: 10.1007/BF00364149. [DOI] [PubMed] [Google Scholar]
- Likert R. A technique for the measurement of attitudes. Arch. Psychol. 1932:140. [Google Scholar]
- Maclay H, Osgood CE. Hesitation phenomena in spontaneous English speech. Word. 1959;15:169–182. [Google Scholar]
- Ohala JJ. Temporal regulation of speech. In: Fant G, Tatham MAA, editors. Auditory Analyses and Perception of Speech. New York: Academic Press; 1975. pp. 431–453. [Google Scholar]
- Osberger MJ, Levitt H. The effect of timing errors on the intelligibility of deaf children’s speech. J. Acoust. Soc. Am. 1979;66:1316–1324. doi: 10.1121/1.383552. [DOI] [PubMed] [Google Scholar]
- Parducci A. Category judgement: A range-frequency model. Psychol. Rev. 1965;17:9–16. doi: 10.1037/h0022602. [DOI] [PubMed] [Google Scholar]
- Perkins WH. What is stuttering? J. Speech Hear. Res. 1990;55:370–382. doi: 10.1044/jshd.5503.370. [DOI] [PubMed] [Google Scholar]
- Perkins WH, Kent R, Curlee R. A theory of neuropsycholinguistic function in stuttering. J. Speech Hear. Res. 1991;34:734–752. doi: 10.1044/jshr.3404.734. [DOI] [PubMed] [Google Scholar]
- Pickett JM. The Sounds of Speech Communication: A Primer of Acoustic Phonetics and Speech Perception. Baltimore: University Park Press; 1980. [Google Scholar]
- Postma A, Kolk H. The Covert Repair Hypothesis: Prearticulatory repair processes in normal and stuttered disfluencies. J. Speech Hear. Res. 1993;36:472–487. [PubMed] [Google Scholar]
- Ryan BP, van Kirk B. The establishment, transfer, and maintenance of fluent speech in 50 stutterers using delayed auditory feedback and operant procedures. J. Speech Hear. Disord. 1974;39:3–10. doi: 10.1044/jshd.3901.03. [DOI] [PubMed] [Google Scholar]
- Sander EK. When are speech sounds learned? J. Speech Hear. Res. 1972;37:55–63. doi: 10.1044/jshd.3701.55. [DOI] [PubMed] [Google Scholar]
- Selkirk E. Phonology and Syntax: The Relation Between Sound and Structure. Cambridge, MA: MIT Press; 1984. [Google Scholar]
- Shiffrin RM, Schneider W. Controlled and automatic human information processing. II. Perceptual learning, automatic attending and general theory. Psychol. Rev. 1977;84:127–190. [Google Scholar]
- Starkweather C. The development of fluency in normal children. In: Gregory H, editor. Stuttering Therapy: Prevention and Intervention with Children. Memphis, TN: Speech Foundation of American; 1985. pp. 9–42. [Google Scholar]
- Stuart A, Kalinowski J, Armson J, Stenstrom R, Jones K. Stuttering reduction under frequency-altered feedback of plus and minus one-half and one-quarter octaves at two speech rates. J. Speech Hear. Res. 1996;39:396–401. doi: 10.1044/jshr.3902.396. [DOI] [PubMed] [Google Scholar]
- Wingate ME. Stuttering: Theory and Treatment. New York: Irvington-Wiley; 1976. [Google Scholar]