Abstract
A series of totally synthetic molecules that are structurally related to the marine natural product ecteinascidin 743 (Et 743) has been prepared and evaluated as antitumor agents. The most active of these, phthalascidin, is very similar to Et 743 with regard to in vitro potency and mode of action across a variety of cell types. The antiproliferative activity of phthalascidin (IC50 = 0.1–1 nM) is greater than that of the agents Taxol, camptothecin, adriamycin, mitomycin C, cisplatin, bleomycin, and etoposide by 1–3 orders of magnitude, and the mechanism of action is clearly different from these currently used drugs. Phthalascidin and Et 743 induce DNA–protein cross-linking and, although they seem to interact with topoisomerase (topo) I (but not topo II), topo I may not be the primary protein target of these agents. Phthalascidin and Et 743 show undiminished potency in camptothecin- and etoposide-resistant cells. Phthalascidin is more readily synthesized and more stable than Et 743, which is currently undergoing clinical trials. The relationship of chemical structure and antitumor activity for this class of molecules has been clarified by this study.
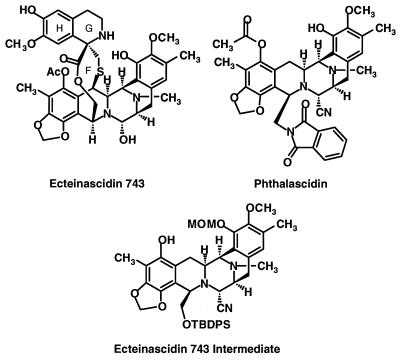
Ecteinascidin 743 (Et 743) is an exceedingly potent antitumor agent isolated from extracts of the marine tunicate Ecteinascidia turbinate that is currently undergoing phase II clinical trials as a result of its promising efficacy in preclinical antitumor tests (1–5). Although the detailed molecular mechanism of action still remains unclear, Et 743 has been reported to yield DNA sequence-selective alkylation of guanine N2 in the minor groove of duplex DNA (6). Additionally, bioassays for antimetabolic activities and enzyme inhibitions revealed Et 743 showed potent inhibition of DNA and RNA synthesis and of RNA polymerase activity but much less inhibition of DNA polymerase activity (7). Despite the minute human dosage of Et 743 currently being used in the clinic, ≈2 mg per person by i.v. infusion, the supply of this rare natural product is inadequate for large-scale studies. Consequently, a multistep total chemical synthesis has been developed to provide the amounts of Et 743 required for medical use (8). The availability of this synthetic process and the desirability of finding simpler and more stable structural relatives of Et 743 has led us to synthesize and evaluate new members of this class of substances. Described herein is the discovery of a number of compounds that significantly exhibit antitumor activity. The most potent of these, phthalascidin (Pt 650, Fig. 1), shows an antitumor profile and activity comparable to Et 743, including drug-induced DNA–protein cross-linking and changes in cell morphology. The data indicate that phthalascidin shares its principal mode of action with Et 743. Phthalascidin is easily made from the known synthetic intermediate (8) shown in Fig. 1 (in six chemical steps) and is considerably more stable in solution than Et 743.
Figure 1.
Structures of ecteinascidin 743, phthalascidin, and key synthetic intermediate.
MATERIALS AND METHODS
Synthetic Structural Analogs of Ecteinascidins.
Phthalascidin was synthesized from the key intermediate (8) shown in Fig. 1 by using the following steps: (i) phenol O-alkylation by using allylbromide (3.9 eq) and CsCO3 in dimethyformamide at 23°C for 2 h (93%); (ii) desilylation by using tetra-n-butylammonium fluoride (2.1 eq) in tetrahydrofuran at 23°C for 7 h (99%); (iii) phthalimido coupling using diethyl azodicarboxylate (1.1 eq), phthalimide (1.2 eq), and triphenylphosphine (1.2 eq) in tetrahydrofuran at 23°C for 2 h (91%); (iv) deallylation by means of bistriphenylphosphine palladium dichloride (0.05 eq), tri-n-butyltinhydride (2.7 eq) and acetic acid (10 eq) in methylene chloride at 23°C for 10 min (97%); (v) phenol O-acetylation using acetic anhydride (3.1 eq) in methylene chloride at 23°C for 30 min (94%); and (vi) methoxymethyl ether cleavage in trifluoroacetic acid/tetrahydrofuran/water (4:1:1) at 23°C for 7 h (94%). Replacement of the primary tert-butyldiphenylsilyloxy group of the intermediate shown in Fig. 1 by amino was effected starting from the phenolic allyl ether-primary alcohol described above by using the following steps: (i) tosylation of the primary hydroxyl by reaction with p-toluenesulfonic anhydride (3.5 eq), diisopropylethylamine (2 eq), and 4-N,N-dimethylaminopyridine (3 eq) in methylene chloride at 23°C for 13 h (69%); (ii) tosylate to azide conversion by using lithium azide (8 eq) in dimethyformamide at 70°C for 20 min (73%); (iii) reduction of azide to primary amino using DTT (10 eq) and triethylamine (10 eq) in methanol at 23°C for 17 h (56%). The primary amine was converted to amide derivatives in the standard way.
Materials.
Et 743 and all of the synthetic analogs evaluated in this study were synthesized from the intermediate shown in Fig. 1. Adriamycin, bleomycin, camptothecin, etoposide, mitomycin C, vincristine, and Taxol were purchased from Calbiochem, and cisplatin was purchased from Aldrich. [14C]Phthalascidin (specific activity, 10 mCi/mmol; total radioactivity, 8 μCi; 1 Ci = 37 GBq) was synthesized by reductive amination of the N12-H precursor by using NaBH3CN and [14C]formaldehyde (10 mCi/mmol; 1% aqueous solution, DuPont/NEN). [3H]Thymidine (20 Ci/mmol; aqueous solution at 1.0 mCi/ml, DuPont/NEN) was used for DNA radiolabeling. DMEM, RPMI 1640 media, fetal bovine serum, glutamine, and penicillin-streptomycin were obtained from Life Technologies (Grand Island, NY). Antibodies to topoisomerase (topo) I and II were purchased from TopoGEN (Columbus, OH).
Cells and Cell Culture Conditions.
Eight human cancer cell lines (A-549 lung carcinoma, NCI-H522 lung carcinoma, HCT116 colon carcinoma, COLO205 colon carcinoma, MCF-7 breast carcinoma, T-47D breast carcinoma, A375 malignant melanoma, and PC-3 prostate carcinoma) were purchased from American Type Culture Collection. These cells were cultured at 37°C in a humidified atmosphere of 5% CO2 in DMEM (A-549, HCT116, A375, and PC-3) or RPMI 1640 (NCI-H522, COLO205, MCF-7, and T-47D) medium supplemented with 10% fetal bovine serum, glutamine, and penicillin-streptomycin. P388 murine leukemia cell line was also obtained from American Type Culture Collection and maintained in RPMI medium. Camptothecin- and etoposide-resistant P388 clones were prepared by the following procedure. P388 cells were cultured at 50 nM (for camptothecin) and 100 nM (for etoposide), IC50 for both drugs. After 3 days, viable cells were collected and exposed to twice the IC50 concentrations for both drugs. Although the drug exposure time was varied between 3 and 7 days, the 2-fold dose escalation procedure was repeated until the drug concentration reached 6.4 μM for camptothecin and 1.6 μM for etoposide. Finally, cell cloning was performed to obtain genetically pure resistant clones.
Cell Growth Inhibition Assays.
Exponentially growing cells were seeded at ≈3.0–3.5 × 10³ (50 μL) cells per well in 96-well flat-bottomed microtiter plates and incubated at 37°C in a humidified atmosphere of 5% CO2/95% air for 24 h. P388 cells were seeded at ≈2.0–2.5 × 10³ (50 μL) cells per well. A test compound was first dissolved in DMSO at a suitable concentration and further diluted with the culture medium containing 10% fetal bovine serum. Serial dilutions (1:1,000) were prepared with the maximum concentration being 1/100 the original DMSO solution. Fifty microliters of the obtained dilutions each was transferred into the well of the above-described culture plate. The culture was then continued at 37°C under the 5% CO2 atmosphere for 3 days. Cell proliferation was quantified by using the CellTiter 96 AQueous Assay (Promega) (9, 10). Briefly, a mixture solution of MTS [Owen’s reagent: 3-(4,5-dimethylthiazol-2-yl)-5-(3-carboxymethoxyphenyl)-2-(4-sulfophenyl)-2H-tetrazolium inner salt] and phenazine methosulfate (PMS) was added to each well in the amount of 20 μL. The resulting mixtures were further incubated for 2.5 h. The absorbance was measured with a microplate reader at a test wavelength of 540 nm and a reference wavelength of 655 nm to serve as an index of the number of viable cells. The inhibitory ratio of the test compound was calculated according to the following formula: inhibition ratio (%) = 100 × (C − T)/C, where T is an absorbance of well containing a test compound and C is an absorbance of well containing no test compound. The IC50 was calculated by the least squares method.
Phase-Contrast Micrographs of Cells.
A375 cells were seeded at 5.0 × 10⁴ (1.0 ml) cells per well in 12-well culture plates and incubated at 37°C in a humidified atmosphere of 5% CO2/95% air for 24 h. Thereafter, the incubation was continued for another 24 h in the absence (control) or presence of Et 743 or phthalascidin. The two drugs were administered to the cells at three different concentrations (0.40, 2.0, and 10 nM). Finally, the cells were inspected by using conventional microscopy.
DNA–Protein Cross-Linking Assays.
The formation of a DNA–protein complex was determined by the K+/SDS precipitation method previously described (11, 12). A375 and A-549 cells (5.0 × 10⁴ cells in 1.0 ml of culture medium) were prelabeled with [3H]thymidine (1.0 μCi/ml) for 24 h in 12-well culture plates. Excess [3H]thymidine containing medium was removed, fresh medium was added, and the cells were exposed to varying doses of each drug sample for 1 h at 37°C. Only in the time course experiment by using several concentrations (1.28 nM–20 μM) of phthalascidin and 800 nM [14C]phthalascidin was the drug exposure time varied from 1 to 8 h. After incubation, the cells were lysed with 1.5% SDS containing 5 mM EDTA for 30 min at 65°C, and then one-fourth the total volume of 325 mM KCl was added to the lysate. The K+/SDS precipitates formed at 4°C were collected via centrifugation and washed twice with wash buffer (10 mM Tris, pH 8.0/100 mM KCl/2 mM EDTA) to remove protein–unbound radioactive DNA. The radioactivity in the precipitate was measured by using liquid scintillation counting.
Competition Binding Assays for DNA–Protein Cross-Linking Complex Formation.
A375 cells (5.0 × 10⁴ cells in 1.0 ml of culture medium) prelabeled with [3H]thymidine (1.0 μCi/ml) were exposed to [14C]phthalascidin (800 nM) for 2 h together with 8.0 μM of Et 743, phthalascidin, C18-O-methoxymethylphthalascidin (C18-OMOM-Pt 650), or C21-desoxyphthalascidin (C21-H-Pt 650). The subsequent experimental procedure was the same as described above.
Immunoblot Assays for the Detection of in Vivo Topo Cross-Linking.
A375 cells (1.0 × 10⁷ cells in 10 ml of culture medium) in exponential growth phase were treated with 4.0 μM Et 743, 4.0 μM phthalascidin, 5.0 μM camptothecin, or 50 μM etoposide and incubated for 2 h along with a negative control (no drug) (13–15). Drug treatment was terminated by complete removal of the medium and rapid addition of lysis buffer (3 ml of 1% sarkosyl). The lysate was layered onto a CsCl step gradient (2 ml each at 4 different CsCl solutions) and centrifuged in a Beckman SW41 rotor (31,000 rpm, 18 h, 25°C). Fractions (400 μl each) were carefully collected from the top by using a Pipetman. The DNA peak was located by reading the absorbance at 260 nm for each fraction (50 μl of each fraction was diluted to 0.5 ml of water to give a reading in the 0.1–1.0 range). Fifty microliters of the 15th and 16th fractions, which contained the bulk of the DNA, were diluted with 100 μl of 25 mM sodium phosphate buffer (pH 6.5). The diluted fractions (150 μL) were applied to a nitrocellulose membrane by using vacuum, which had been presoaked in 28 mM sodium phosphate buffer (pH 6.5). The nonspecific binding sites were blocked by treatment with 5% Blotto (50 mM Tris⋅HCl, pH 7.4/100 mM NaCl/5% nonfat dry milk) in TBS–T (20 mM Tris⋅HCl, pH 7.6/137 mM NaCl/0.1% Tween 20). The membrane was incubated with a rabbit polyclonal antibody to topo I or topo II as a primary antibody for 3 h. After three washings with TBS–T (10 min each), the membrane was incubated with goat anti-rabbit conjugated to horseradish peroxidase as a secondary antibody for 30 min. After washing with TBS–T, the final detection of the blot was carried out by using Amersham’s enhanced chemiluminescence (ECL) system.
RESULTS AND DISCUSSIONS
Structure–Activity Summary.
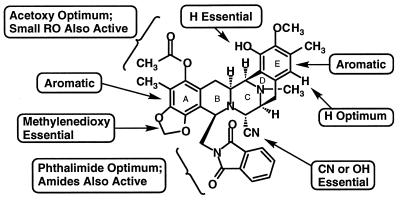
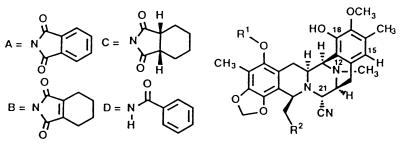
The correlations of structure with biological activity of ecteinascidin-like molecules are summarized in Fig. 2. All of the analogs were synthesized from the common Et 743 intermediate shown in Fig. 1. In the primary in vitro antitumor screening, four human solid cancer cell lines (i.e., A-549 lung carcinoma, HCT116 colon carcinoma, A375 malignant melanoma, and PC-3 prostate carcinoma) were used. In vitro antiproliferative activities of the compounds tested were determined after 3-day continuous drug exposure by using a metabolic assay in which the cellular reduction of a tetrazolium salt afforded a formazan in proportion to viable cell number and the formazans could be measured in an automated colorimeter. Structures and antiproliferative activities of the representative compounds are shown in Table 1.
Figure 2.
Phthalascidin and analogs; structure-activity summary.
Table 1.
Structure and antiproliferative activity of phthalascidin-related compounds
| Analog | R1 | R2 | Cell line
|
|||
|---|---|---|---|---|---|---|
| A-549 | HCT116 | A375 | PC-3 | |||
| Pt 650 | CH3C(O) | A | 0.95 | 0.38 | 0.17 | 0.55 |
| 1 | CH3C(O) | D | 3.2 | 0.59 | 0.35 | 0.64 |
| 2 | CH3C(O) | C | 1.5 | 0.85 | 0.27 | 1.1 |
| 3 | CH3C(O) | B | 1.2 | 0.61 | 0.35 | 0.75 |
| 4 | CH3OCH2C(O) | A | 1.6 | 0.87 | 0.31 | 0.90 |
| 5 | CH3S(O)2 | A | 1.7 | 0.58 | 0.29 | 0.86 |
| 6 | CH3CH2C(O) | A | 2.1 | 1.2 | 0.51 | 2.9 |
| 7 | CH3 | A | 3.1 | 1.4 | 0.55 | 3.1 |
| 8 | CH3CH2 | A | 3.9 | 1.7 | 0.97 | 2.4 |
| C15-Chloro-Pt 650 | 2.8 | 1.0 | 0.35 | 1.1 | ||
| C15-, C18-p-Quinone-Pt 650 | 1.7 | 0.80 | 0.45 | 0.68 | ||
| N12-[14C]-CH3-Pt 650 | 0.91 | — | 0.22 | — | ||
| C21-OH-Pt 650 | 1.0 | 0.61 | 0.20 | 0.53 | ||
| C21-H-Pt 650 | 2200 | 1100 | 610 | 850 | ||
| C18-OMOM-Pt 650 | 230 | 74 | 66 | 98 | ||
| Et 743 | 1.0 | 0.50 | 0.15 | 0.70 | ||
Values reported are IC50 in nM.
One recent study on the Et 743–DNA adduct by using NMR spectroscopy demonstrated that the Et 743 rings G–H subunit (spiro ring system on the 10-membered lactone bridge) protrudes from the minor groove of the double helix when the drug is bound to DNA (16). It has also been shown that modifying the G–H subunit changes the drug’s ability to inhibit cell division; thus, this functionality, at least in part, should play a key role in determining antiproliferative properties of the drug. One of the most important findings in our study is that a phthalimide moiety, instead of the 10-membered lactone bearing the G–H subunit, can convey virtually identical antitumor selectivity and cytotoxic potency as those displayed by Et 743. Although the replacement of the phthalimide group of phthalascidin by benzamide, cis-cyclohexane-1,2-dicarboxyimide, cis-cyclohexene-1,2-dicarboxyimide, and a great variety of other groups produced compounds with significant activity, phthalascidin exhibited the best antiproliferative activity in cell-based assays. For good activity, the phenolic hydroxyl group on the A subunit must be protected by a small group such as acetyl, propionyl, methoxyacetyl, methansulfonyl, methyl, or ethyl, acetyl being optimum. The protection of the other phenolic hydroxyl group on the E subunit resulted in diminished antitumor activity. As for the substituent at the C21 position, a cyano or a hydroxyl group is essential, suggesting that elimination of this functional group under physiological conditions results in a reactive iminium species that is responsible for covalent bond formation with the drug’s target, for example by DNA alkylation.
Antiproliferative Activity of Et 743 and Phthalascidin.
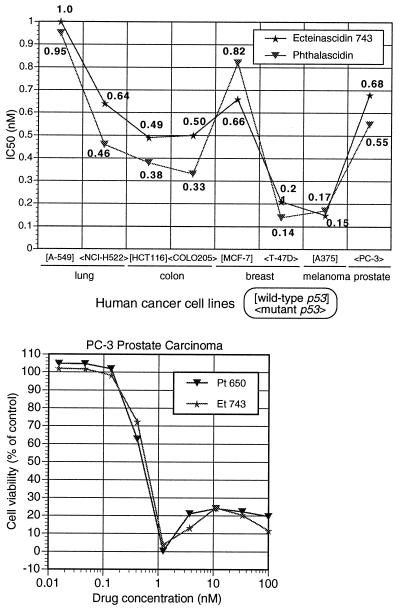
Extensive chemical syntheses and evaluation of antiproliferative activity have demonstrated that phthalascidin is the most potent analog and that it shows comparable antiproliferative profile to Et 743 against eight human cancer cell lines (Fig. 3). To assess the relationship between p53 tumor suppresser gene status and drug efficacy (17), wild-type (A-549, HCT116, MCF-7, and A375) and mutant (NCI-H522, COLO205, T-47D, and PC-3) cell lines were used in the assays. With respect to growth rate phenotype (17), both rapid growing cells (HCT116 and A375; doubling time <20 h) and slow growing cells (NCI-H522 and T-47D; doubling time >50 h) were included. After 3 days of continuous drug exposure, both phthalascidin and Et 743 afforded nearly identical IC50 values, less than 1.0 nM for all eight cancer cell lines. The most sensitive cell lines are A375 malignant melanoma and T-47D breast carcinoma, and the most resistant is A-549 lung carcinoma. There was no significant correlation between drug sensitivity and p53 genotype or cellular growth rate. In addition to common IC50 values, phthalascidin and Et 743 showed a similar dose-response curve. One reproducible characteristic of phthalascidin, Et 743, and the other potent analogs is that these molecules each have an optimum concentration range for bioactivity (typified by the data shown in Fig. 3), a phenomenon which also is revealed by phase-contrast microscopy of treated cells to determine cellular morphological changes and the pattern of cell death induced with phthalascidin and Et 743. At a concentration of 2.0 nM phthalascidin and Et 743, a significant level of cell death after 24 h of drug exposure was observed. On the other hand, the number of viable cells at 10 nM concentration appeared to be somewhat greater with both drugs than that at 2.0 nM, although the cellular morphology was altered to a flatter shape. Similar cellular results were observed in seven different cancer cell lines (data not shown).
Figure 3.
Antiproliferative activity of Et 743 and phthalascidin (Pt 650).
Antiproliferative Activity Comparison Between Phthalascidin and Several Clinically Used Anticancer Drugs.
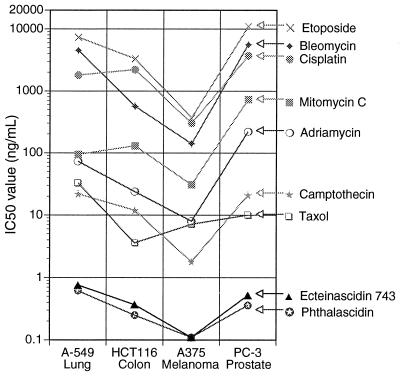
By using four cancer cell lines, growth inhibition potencies of phthalascidin and Et 743 were compared with several clinically used anticancer agents, such as adriamycin (DNA intercalator possessing DNA topo II inhibition activity), bleomycin (DNA-cleaving agent generating oxygen radical species), camptothecin (DNA topo I inhibitor), cisplatin (DNA alkylating agent), etoposide (DNA topo II inhibitor), mitomycin C (DNA alkylating agent), and Taxol (antimitotic agent causing microtubule stabilization). Phthalascidin and Et 743 showed outstanding activity, orders of magnitude more potent than these clinically used drugs (Fig. 4).
Figure 4.
Antiproliferative activity of several anticancer agents.
Phthalascidin also was tested in the NCI 60 Cell Line Human Tumor Screen (18), with an actual mean IC50 (GI50) of 0.93 nM. Phthalascidin and the above seven clinical drugs were subjected to compare analyses by using the mean graph profiles (19) of phthalascidin as the base. No significant correlation could be found [R2 = 0.44 with adriamycin, 0.17 with bleomycin, 0.30 with camptothecin, 0.21 with cisplatin, 0.43 with etoposide, 0.35 with mitomycin C, and 0.38 with Taxol. By contrast, the correlation coefficient between two structurally different topo II inhibitors, etoposide and 4′-(9-acridinylamino)methanesulfon-m-anisidide (m-AMSA), is 0.82]. The result of compare analyses implies that phthalascidin and Et 743 operate by a distinctly different biological mechanism than those utilized by the various clinical drugs, including mechanisms involving simple DNA alkylation.
Drug-Induced DNA–Protein Cross-Linking.
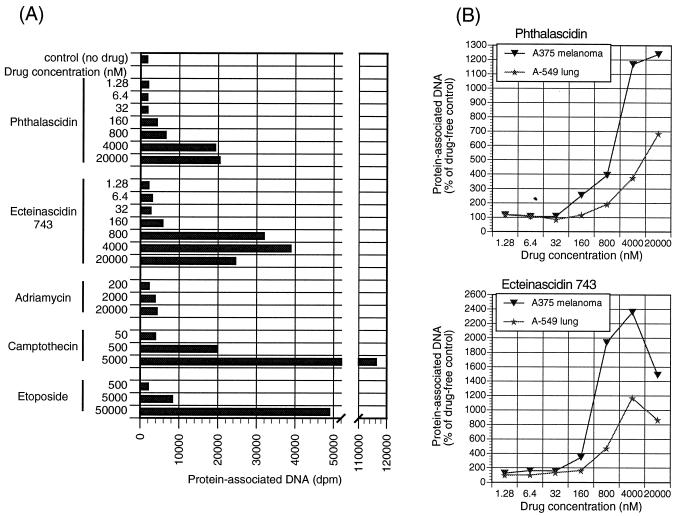
It has been reported that Et 743 is a novel DNA minor groove, guanine-specific alkylating agent (5, 6, 16). Although DNA alkylation is definitely one of the molecular bases of Et 743’s action, its exceedingly potent anticancer activity suggests the existence of another putative target, possibly a DNA-associating protein(s) with a function crucial for cell proliferation. The existence of facile DNA repair systems suggests that DNA alkylation alone may be insufficient for the expression of significant cytotoxic activity, and thus it is possible that drug-induced DNA–protein cross-linking occurs. DNA–protein cross-linking is likely to produce sufficiently serious DNA damage to generate an effective cell death signal. To assess drug-induced DNA–protein cross-linking, we used the K+/SDS precipitation method (11), which allows detection and isolation of covalent DNA–protein complexes. The method is based on the use of an ionic detergent (SDS) to neutralize the cationic sites of weakly bound proteins causing dissociation from the DNA helix. Proteins tightly or covalently bound to DNA that are not dissociable by SDS lead to the precipitation of the DNA fragment after addition of KCl; free nucleic acid does not precipitate. This method has been particularly useful in the detection of covalent binding of topo I and II to DNA. Because the detection of the DNA–topo covalent complex involved in the DNA unwinding process is greatly enhanced by topo inhibitors that can result in the trapping of the reaction (covalent) intermediate, the screening of topo enzyme inhibitors is also facilitated by this method (20). In our experiments, [3H]thymidine-prelabeled cells were exposed to several concentrations of the tested drugs, lysed with SDS, and treated with KCl to precipitate proteins. If a drug can induce DNA–protein cross-linking, the resulting precipitate after centrifugation and washing will contain protein-bound DNA. The measurement of radioactivity in the protein pellet is proportional to the amount of cross-linking. Adriamycin, camptothecin, and etoposide were used as positive controls. Two cancer cell lines were chosen as candidates for the experiment—A375, which was the most sensitive cell line to phthalascidin and Et 743, and A-549, which was the most resistant. The results, which are summarized in Fig. 5, demonstrate that phthalascidin and Et 743 induce DNA–protein cross-linking. In this experiment, drug exposure time was fixed at 1 h. All of the data points were taken at least three times in duplicate runs, and the average values are displayed in the figure. Fig. 5A shows that the extent of the cross-linking by Et 743 after 1 h of treatment is greater than that by phthalascidin. This difference is probably due to the fact that the C21-OH group of Et 743 dissociates to form the reactive iminium intermediate more rapidly than the C21-CN group of phthalascidin. Fig. 5B reveals that under identical experimental conditions and at the same drug concentrations, the magnitude of cross-linking is greater with A375 than with A-549. Thus, the cross-linking activity correlates positively with cell line sensitivity in the proliferation assay.
Figure 5.
Drug-induced DNA–protein cross-linking.
Phthalascidin (1.28 nM–20 μM) and [14C]phthalascidin (800 nM) were used for investigating the time dependency of phthalascidin-induced DNA–protein cross-linking. After drug treatment for 1, 2, or 4 h, 14C and 3H radioactivity in the precipitate were measured by using liquid scintillation counting. As shown in Fig. 6, the 14C and 3H radioactivity each increased with time, suggesting that phthalascidin-induced cross-linking occurs in a time-dependent manner to produce a ternary complex consisting of DNA, phthalascidin, and the cross-linked protein(s). The cross-linking results were similar with 8 h and 4 h of drug treatment (data not shown). Observation of cell death by microscopy indicates that the 4-h exposure experiment represents the limit for determining the precise time dependency of the drug–target interaction.
Figure 6.
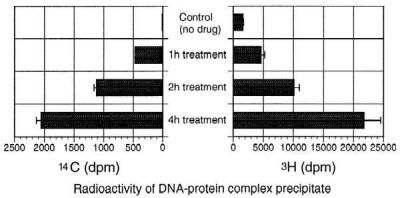
Time course experiment for [14C]phthalascidin (800 nM)-induced DNA–protein cross-linking.
Competitive Drug Binding in the Target DNA–Protein Complex.
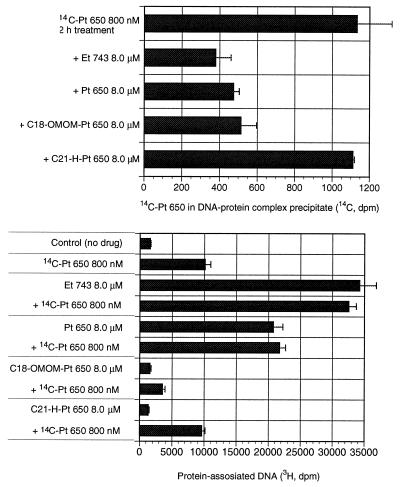
To show that phthalascidin and Et 743 share the same mechanism of action, competition binding assays were performed by using [14C]phthalascidin and [3H]thymidine-prelabeled A375 cells. The cells were treated for 2 h with 800 nM [14C]phthalascidin. Simultaneously, 8.0 μM Et 743, phthalascidin, C18-OMOM-Pt 650, and C21-H-Pt 650 were added to the separate wells. Et 743 and phthalascidin were expected to block by competition [14C]phthalascidin. C18-OMOM-Pt 650, three orders of magnitude less active than phthalascidin, still contains the C21-CN functionality, which is thought to be necessary for DNA alkylation (Table 1). C21-H-Pt 650 is four orders of magnitude less active than phthalascidin and should be incapable of alkylating DNA (Fig. 7). Et 743 and phthalascidin were shown to block by competition incorporation of [14C]phthalascidin into the protein–DNA precipitate. C18-OMOM-Pt 650 also was shown to block by competition [14C]phthalascidin and thus inhibited [14C]phthalascidin-induced cross-linking, but induced no DNA–protein cross-linking by itself. C21-H-Pt 650 did not block by competition [14C]phthalascidin, and the expected amount of [14C]phthalascidin-induced cross-linking was observed. These results strongly suggest that phthalascidin has the same mode of action as Et 743. It is possible that the C21-CN group is necessary for DNA alkylation and that the C18-OH group is necessary for binding to the protein component of the DNA–protein complex.
Figure 7.
Competition binding assays for DNA–protein cross-linking complex formation.
Evaluation of in Vivo Topoisomerase Cross-Linking.
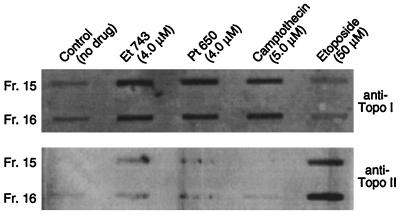
To determine whether phthalascidin- and Et 743-induced DNA–protein cross-linking depends on topo enzyme, an immunoblot assay for the detection of in vivo topo cross-linking was performed.§ A375 cells were exposed to 4.0 μM Et 743, 4.0 μM phthalascidin, 5.0 μM camptothecin, or 50 μM etoposide for 2 h and lysed with sarkosyl. The DNA was collected by using a CsCl step gradient centrifugation method. Western blot analysis using rabbit polyclonal antibody to topo I and topo II and detection using horseradish peroxidase showed that phthalascidin and Et 743 have no topo II cross-linking ability; however, topo I cross-linking is observed (Fig. 8). The high concentrations required for optimum DNA–topo I cross-linking (4 μM) suggest that topo activity may be only an auxiliary effect incidental to the primary mechanism of action of phthalascidin and Et 743. Experiments using camptothecin- and etoposide-resistant clones of P388 leukemia cells further support this hypothesis. Table 2 shows that phthalascidin and Et 743 are equally active against the three P388-derived cell lines (wild-type, etoposide-resistant mutant, and camptothecin resistant). Experiments with vincristine show that these mutations are not multidrug resistant-related.
Figure 8.
Immunoblot assays for the detection of in vivo topoisomerase cross-linking.
Table 2.
Antiproliferative activity against mutant P388 leukemia cells
| Drug | Cell line
|
||
|---|---|---|---|
| P388 | Etopor-P388 | Camptor-P388 | |
| Ecteinascidin 743 | 0.22 | 0.24 | 0.30 |
| Pt650 | 0.19 | 0.18 | 0.21 |
| Camptothecin | 53 | 42 | 3.5 × 10⁴ |
| Etoposide | 96 | 2.5 × 10³ | 3.4 × 10² |
| Vincristine | 1.9 | 2.1 | 3.3 |
Values reported are IC50 in nM.
The discovery of phthalascidin had its origins in the observation that simpler synthetic analogs of Et 743 lacking rings G and H (Fig. 1) and possessing various substituents on the nitrogen atom of the α-amino lactone subunit (ring F of Fig. 1) showed good antitumor activity. From this lead and the molecular geometry of Et 743 itself, the structure of phthalascidin was designed by using molecular modeling; it was the first member of the series to be synthesized and tested and remains the most promising.
Acknowledgments
This research was supported by the National Institutes of Health, General Medical Sciences, grants to E.J.C. and S.L.S. and by a grant from the Eisai Pharmaceutical Co. S.L.S. is an investigator of the Howard Hughes Medical Institute.
ABBREVIATIONS
- Pt 650
phthalascidin
- Et 743
ecteinascidin 743
- topo
topoisomerase
- A375
malignant melanoma
Footnotes
At a workshop in Boston sponsored by Pharma Mar on October 16, 1998, Yves Pommier of the National Cancer Institute reported evidence for an Et 743–topo I interaction.
References
- 1.Rinehart K L, Holt T G, Fregeau N L, Keifer P A, Wilson G R, Perun T J, Jr, Sakai R, Thompson A G, Stroh J G, Shield L S, et al. J Nat Prod. 1990;53:771–792. doi: 10.1021/np50070a001. [DOI] [PubMed] [Google Scholar]
- 2.Rinehart K L, Sakai R, Holt T G, Fregeau N L, Perun T J, Jr, Seigler D S, Wilson G R, Shield L S. Pure Appl Chem. 1990;62:1277–1280. [Google Scholar]
- 3.Rinehart K L, Holt T G, Fregeau N L, Stroh J G, Keifer P A, Sun F, Li L H, Martin D G. J Org Chem. 1990;55:4512–4515. [Google Scholar]
- 4.Wright A E, Forleo D A, Gunawardana P G, Gunasekera S P, Koehn F E, McConnell O J. J Org Chem. 1990;55:4508–4512. [Google Scholar]
- 5.Sakai R, Rinehart K L, Guan Y, Wang A H-J. Proc Natl Acad Sci USA. 1992;89:11456–11460. doi: 10.1073/pnas.89.23.11456. [DOI] [PMC free article] [PubMed] [Google Scholar]
- 6.Pommier Y, Kohlhagen G, Bailly C, Waring M, Mazumder A, Kohn K W. Biochemistry. 1996;35:13303–13309. doi: 10.1021/bi960306b. [DOI] [PubMed] [Google Scholar]
- 7.Sakai R, Jares-Erijman E A, Manzanares I, Elipe M V S, Rinehart K L. J Am Chem Soc. 1996;118:9017–9023. [Google Scholar]
- 8.Corey E J, Gin D Y, Kania R S. J Am Chem Soc. 1996;118:9202–9203. [Google Scholar]
- 9.Cory A H, Owen T C, Barltrop J A, Cory J G. Cancer Commun. 1991;3:207–212. doi: 10.3727/095535491820873191. [DOI] [PubMed] [Google Scholar]
- 10.Barltrop J A, Owen T C, Cory A H, Cory J G. Bioorg Med Chem Lett. 1991;1:611–614. [Google Scholar]
- 11.Trask D K, DiDonato J A, Muller M T. EMBO J. 1984;3:671–676. doi: 10.1002/j.1460-2075.1984.tb01865.x. [DOI] [PMC free article] [PubMed] [Google Scholar]
- 12.Mirzabekov A D, Bavykin S G, Belyavsky A V, Karpov V L, Preobrazhenskaya O V, Shick V V, Ebralidse K K. Methods Enzymol. 1989;170:386–408. doi: 10.1016/0076-6879(89)70058-6. [DOI] [PubMed] [Google Scholar]
- 13.Muller M T, Pfund W P, Mehta V B, Trask D K. EMBO J. 1985;4:1237–1243. doi: 10.1002/j.1460-2075.1985.tb03766.x. [DOI] [PMC free article] [PubMed] [Google Scholar]
- 14.Muller M T, Mehta V B. Mol Cell Biol. 1988;8:3661–3669. doi: 10.1128/mcb.8.9.3661. [DOI] [PMC free article] [PubMed] [Google Scholar]
- 15.Trask D K, Muller M T. Proc Natl Acad Sci USA. 1988;85:1417–1421. doi: 10.1073/pnas.85.5.1417. [DOI] [PMC free article] [PubMed] [Google Scholar]
- 16.Moore B M, II, Seaman F C, Hurley L H. J Am Chem Soc. 1997;119:5475–5476. [Google Scholar]
- 17.O’Connor P M, Jackman J, Bae I, Myers T G, Fan S, Mutoh M, Scudiero D A, Monks A, Sausville E A, Weinstein J N, et al. Cancer Res. 1997;57:4285–4300. [PubMed] [Google Scholar]
- 18.Boyd M R, Paull K D, Rubinstein L R. Cytotoxic Anticancer Drugs: Models and Concepts for Drug Discovery and Development. Boston: Kluwer; 1992. pp. 11–34. [Google Scholar]
- 19.Boyd M R, Paull K D. Drug Dev Res. 1995;34:91–109. [Google Scholar]
- 20.Yoshinari T, Mano E, Arakawa H, Kurama M, Iguchi T, Nakagawa S, Tanaka N, Okura A. Jpn J Cancer Res (GANN) 1993;84:800–806. doi: 10.1111/j.1349-7006.1993.tb02047.x. [DOI] [PMC free article] [PubMed] [Google Scholar]


