

Abstract
Both β1 and β2 auxiliary subunits of the BK-type K+ channel family profoundly regulate the apparent Ca2+ sensitivity of BK-type Ca2+-activated K+ channels. Each produces a pronounced leftward shift in the voltage of half-activation (V0.5) at a given Ca2+ concentration, particularly at Ca2+ above 1 μM. In contrast, the rapidly inactivating β3b auxiliary produces a leftward shift in activation at Ca2+ below 1 μM. In the companion work (Lingle, C.J., X.-H. Zeng, J.-P. Ding, and X.-M. Xia. 2001. J. Gen. Physiol. 117:583–605, this issue), we have shown that some of the apparent β3b-mediated shift in activation at low Ca2+ arises from rapid unblocking of inactivated channels, unlike the actions of the β1 and β2 subunits. Here, we compare effects of the β3b subunit that arise from inactivation, per se, versus those that may arise from other functional effects of the subunit. In particular, we examine gating properties of the β3b subunit and compare it to β3b constructs lacking either the NH2- or COOH terminus or both. The results demonstrate that, although the NH2 terminus appears to be the primary determinant of the β3b-mediated shift in V0.5 at low Ca2+, removal of the NH2 terminus reveals two other interesting aspects of the action of the β3b subunit. First, the conductance-voltage curves for activation of channels containing the β3b subunit are best described by a double Boltzmann shape, which is proposed to arise from two independent voltage-dependent activation steps. Second, the presence of the β3b subunit results in channels that exhibit an anomalous instantaneous outward current rectification that is correlated with a voltage dependence in the time-averaged single-channel current. The two effects appear to be unrelated, but indicative of the variety of ways that interactions between β and α subunits can affect BK channel function. The COOH terminus of the β3b subunit produces no discernible functional effects.
Keywords: K+ channels, Ca2+- and voltage-gated K+ channels, mSlo channels, voltage-dependent gating, inactivation
INTRODUCTION
Ca2+-regulated and voltage-activated BK-type K+ channels rapidly couple changes in local submembrane free Ca2+ to changes in cell electrical activity. Among different cells, large conductance Ca2+-regulated, voltage-activated K+ channel (BK)–type channels exhibit considerable functional diversity, part of which includes the broad range of Ca2+ sensitivities that are observed among different tissues (McManus 1991; Vergara et al. 1998). An important advance in understanding BK channel diversity arose when it was recognized that a major factor in defining the Ca2+ sensitivity of smooth muscle BK channels was the coassembly of an auxiliary β subunit (Garcia-Calvo et al. 1994; Knaus et al. 1994a,Knaus et al. 1994b; Giangiacomo et al. 1995; McManus et al. 1995) with the pore-forming α subunits encoded by the Slo loci. More recently, several additional β subunit family members have been identified (Wallner et al. 1999; Xia et al. 1999, Xia et al. 2000; Brenner et al. 2000; Meera et al. 2000; Uebele et al. 2000; Weiger et al. 2000), and it is increasingly clear that this family of auxiliary subunits plays a major role in defining the particular phenotypic properties of the BK channels in the tissues in which they are expressed. How the homologous, but functionally quite distinct, auxiliary subunits produce their effects remains unknown.
Functional BK channels result from the tetrameric assembly (Shen et al. 1994) of four Slo α subunits (Atkinson et al. 1991; Adelman et al. 1992; Butler et al. 1993). In addition, each BK channel may contain up to four auxiliary β subunits that likely occur in 1:1 stoichiometry with the α subunits (Knaus et al. 1994b; Ding et al. 1998). Compared with the pore-forming α subunit, β subunits are relatively small molecules (191–220 amino acids) thought to be composed of two transmembrane segments with an extracellular segment perhaps exhibiting a conserved topological arrangement defined by four conserved cysteines (Knaus et al. 1994a). Various β subunits differ in the length of the cytosolic NH2-terminal sequence and also in the length of the cytosolic COOH terminus. To date, only the functional effects of the β1 subunit has been studied in much detail (Nimigean and Magleby 1999; Cox and Aldrich 2000; Nimigean and Magleby 2000), and it remains an interesting question how the effects of the β1 subunit may compare with those of the other β subunits.
Of the four mammalian β subunits that have been identified, both the β1 and β2 produce large shifts to negative potentials in the activation range at a given Ca2+ (Wallner et al. 1995, Wallner et al. 1999; Xia et al. 1999; Brenner et al. 2000). The effects of the β1 subunit are particularly pronounced at Ca2+ above 1 μM, and in earlier work it was suggested that the apparent lack of effect of the β1 subunit at 0 Ca2+ (contaminant Ca2+ with 5 mM EGTA) on the conductance-voltage (G-V) curves for activation may be related to effects of the β1 subunit on Ca2+-dependent gating steps (Meera et al. 1996). More detailed evaluation of the effects of the β1 subunit revealed that the β1 subunit does exert effects on channel function even at 0 Ca2+, but that a slowing of channel activation exerted by the subunit minimizes the leftward shifts in the voltage of half-activation (Nimigean and Magleby 2000). In fact, the analysis of Cox and Aldrich suggested that, although the primary effects of the β1 subunit are to increase the stability of the open state, an increase in the Ca2+-binding affinity of both the closed and open states also occurs (Cox and Aldrich 2000). In contrast, a rapidly inactivating β3 construct (β3b) produces leftward shifts in the G-V curves for activation at lower Ca2+ than observed for either the β1 or β2 subunits (Xia et al. 2000). Our analysis of the blocking mechanism of the β3b subunit (Lingle et al. 2001) has shown that any blocking scheme in which recovery from inactivation during repolarization is extremely rapid will shift G-V curves measured from tail currents, independent of effects on gating equilibria. Although these other results provided an explanation for the shift in G-V curves at low Ca2+, it remains unknown whether the β3b subunit may have other effects on gating, independent of the blocking reaction.
Here, we examine in more detail the role of rapid inactivation in defining activation ranges and gating kinetics of α + β3b channels. Specifically, properties of channels containing the wild-type β3b subunit are compared with currents resulting from β3b subunits in which either the NH2 terminus, the COOH terminus, or both has been removed. Furthermore, we examine the properties of the β3b subunit before and after digestion with cytosolic trypsin. The results support the view that the unique shift in gating observed for the β3b subunit at lower Ca2+, when measured with tail currents, arises from the rapid blocking effect of the NH2 terminus. However, two additional interesting aspects of β3b behavior are revealed after removal of the NH2 terminus. First, the voltage dependence of activation exhibits multiple Boltzmann components, indicative that multiple, independent voltage-dependent transitions participate in the activation of the channel. Second, there is a marked outward rectification in the instantaneous current voltage-curve that is correlated with nonlinearities in the apparent single-channel current behavior. In comparison to the β1 and β2 subunits, the β3b subunit, in the absence of the NH2 terminus, produces only minor shifts in gating of currents relative to mSlo α alone, along with only minor effects on current activation or deactivation. Remarkably, these apparent minor effects of the β3b subunit on macroscopic gating ranges and macroscopic kinetics are associated with rather profound changes in fundamental properties of the underlying molecular transitions leading to channel activation.
MATERIALS AND METHODS
Expression Constructs and Methods of Expression in Xenopus Oocytes
The preparation of most constructs used in this work has been described (Xia et al. 2000; Lingle et al. 2001). Constructs in which the COOH- and NH2 termini were removed, previously termed β3b-D3 (COOH terminus deleted) and β3b-D4 (NH2 terminus deleted), are here called β3b-ΔC and β3b-ΔN, respectively. The construct with both NH2- and COOH termini removed (previously β3b-D5) is here called β3b-ΔNΔC. All constructs were expressed in Xenopus ooctyes as described previously (Xia et al. 1999). 10–50 nl of cRNA (10–20 ng/μl) was injected into stage IV Xenopus oocytes at α/β ratios of 1:1 or 1:2 by weight. After injection of RNA, oocytes were maintained in ND96 (96 mM NaCl, 2.0 mM KCl, 1.8 mM CaCl2, 1.0 mM MgCl2, and 5.0 mM HEPES, pH 7.5) supplemented with 2.5 mM sodium pyruvate, 100 U/ml penicillin, 100 mg/ml streptomycin, and 50 mg/ml gentamicin at 17°C.
We have noted that, among different sets of experiments, values for V0.5 for activation for a given construct may exhibit substantial variability. This has been true whether α alone was being expressed or α in conjunction with a β subunit. For example, among different sets of experiments performed over the period of a year, in some batches of oocytes, the V0.5 for activation for either α alone or α + β3b has been shifted as much as +30 mV relative to values reported earlier (Xia et al. 2000). Whereas in earlier experiments, the V0.5 for activation of α + β3b currents at 10 μM Ca2+ in some experiments has been as negative as −20 to −30 mV (Xia et al. 2000); in other batches of oocytes, the V0.5 at 10 μM Ca2+ has been just positive of 0 mV. We are unable to attribute the variation to problems with Ca2+ solutions, expression, or properties of the expression constructs. Similar variability in V0.5 for activation for α alone has been noted by other labs (Cox and Aldrich 2000) and remains unexplained. BK channels in native cells have also been noted to exhibit substantial variability in apparent Ca2+ dependence of activation (Moczydlowski and Latorre 1983; McManus and Magleby 1991). As a consequence, in this paper when comparisons are made between different constructs, we have used only data obtained over the same period of time with identical stocks of solutions. When possible, side-by-side comparisons of different constructs have been made on the same batch of oocytes.
Electrophysiology
Recording methods have been described previously (Xia et al. 1999; Xia et al. 2000; Lingle et al. 2001). All recordings used inside-out patches (Hamill et al. 1981). Currents were typically digitized at 10–50 kHz, although in some cases, 100- and 200-kHz sampling was used with filtering during current acquisition at 5–20 kHz (Bessel low-pass filter; −3 dB). All recordings were with symmetric K+ solutions. For inside-out recordings, the pipet extracellular solution was 140 mM potassium methanesulfonate (MES), 20 mM KOH, 10 mM HEPES, and 2 mM MgCl2, pH 7.0. Test solutions bathing the cytoplasmic face of the patch membrane contained 140 mM potassium MES, 20 mM KOH, 10 mM HEPES, pH 7.0, and one of the following: 5 mM EGTA (for nominally 0 Ca2+, 0.5 μM, and 1 μM Ca2+ solutions), 5 mM HEDTA (for 4 and 10 μM Ca2+ solutions), or no added Ca2+ buffer (for 60-, 100-, and 300-μM, and 5-mM Ca2+ solutions). The procedures for calibration of Ca2+ solutions have been described previously (Xia et al. 1999, Xia et al. 2000). Solutions were applied to inside-out patches with a local perfusion system (Solaro and Lingle 1992; Solaro et al. 1997).
Voltage commands and acquisition of currents were accomplished as described previously (Xia et al. 1999, Xia et al. 2000; Lingle et al. 2001). Current values were measured using ClampFit (Axon Instruments), converted to conductances, and then fit with a nonlinear least squares fitting program. As described in results, conductances were determined from tail currents, from the peak current at a given activation potential, and from steady-state current at a given activation potential. To construct families of conductance-voltage (G-V) curves, curves at Ca2+ concentrations of 4, 10, 60, or 300 μM were normalized to the same maximum. At concentrations of 0, 0.5, and 1 μM Ca2+, values were normalized relative to the maximum conductance observed in that patch with 10 μM Ca2+. Single G-V curves for activation were fit with a Boltzmann equation with the form:
 |
1 |
For some constructs, G-V curves were better described by two component Boltzmann functions. A variety of formulations of Boltzmann-type functions can be derived dependent on the particular model for channel activation. Here, for descriptive purposes, we have described the G-V curves with the following function containing two independent Boltzmann terms with terms defined as above:
 |
2 |
For ensemble variance analysis, at least 10 sweeps with a given stimulation condition were first acquired in 0 Ca2+ saline, followed by at least 60 sweeps at a given Ca2+. Clampfit 7.0 (Axon Instruments) was used to obtain an average current from the traces recorded in 0 Ca2+, and a separate average current from traces obtained in the presence of Ca2+. Mean BK current was the difference between these two averages. The current variance at any time point was calculated by Clampfit 7.0 from the set of sweeps in a particular [Ca2+]. The dependence of variance on mean current was fit with:
 |
3 |
where I is a particular measured value of mean current, Var(I) is the resulting variance, and N and i are the fitted values for number of channels in the patch and the single-channel current, respectively. For total amplitude histograms of all current values in a record, continuous records of channel activity were recorded from inside-out patches held at a fixed voltage and [Ca2+].
Experiments were done at room temperature (21–24°C). All salts and chemicals were obtained from Sigma-Aldrich.
RESULTS
Comparison of Currents Resulting from α Alone, α + β3b, α + β3b-ΔC, and α + β3b-ΔN
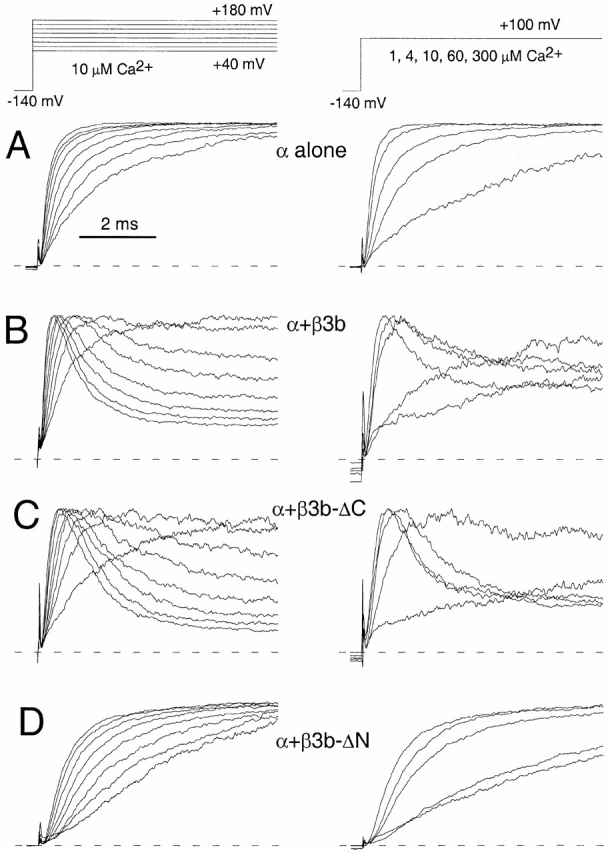
The following β3b constructs were examined. β3b corresponds to one of four β3 splice variants (Uebele et al. 2000) β3b-ΔC has an intact NH2 terminus, but no COOH terminus (Xia et al. 2000). β3b-ΔN has an intact COOH terminus, but no NH2 terminus (Xia et al. 2000). β3b-ΔNΔC lacks both NH2- and COOH termini. Message for various β subunit constructs was coexpressed with message for Slo α subunits in Xenopus oocytes. Representative currents recorded from inside-out patches are shown in Fig. 1 comparing properties of α alone, α + β3b, α + β3b-ΔC, and α + β3b-ΔN at 0, 1, 10, and 300 μM Ca2+. At 0 Ca2+, for both α + β3b and α + β3b-ΔC, although peak outward current is small, after activation at the most positive displayed potential (+140 mV), tail currents at −120 mV are quite substantial relative to those observed for either α alone or for α + β3b-ΔN. Furthermore, in both cases in which a β3b construct contains an intact NH2 terminus, at 10 μM Ca2+, there is substantial inward current at potentials negative to 0, in contrast to the situation with α alone or α + β3b-ΔN.
Figure 1.
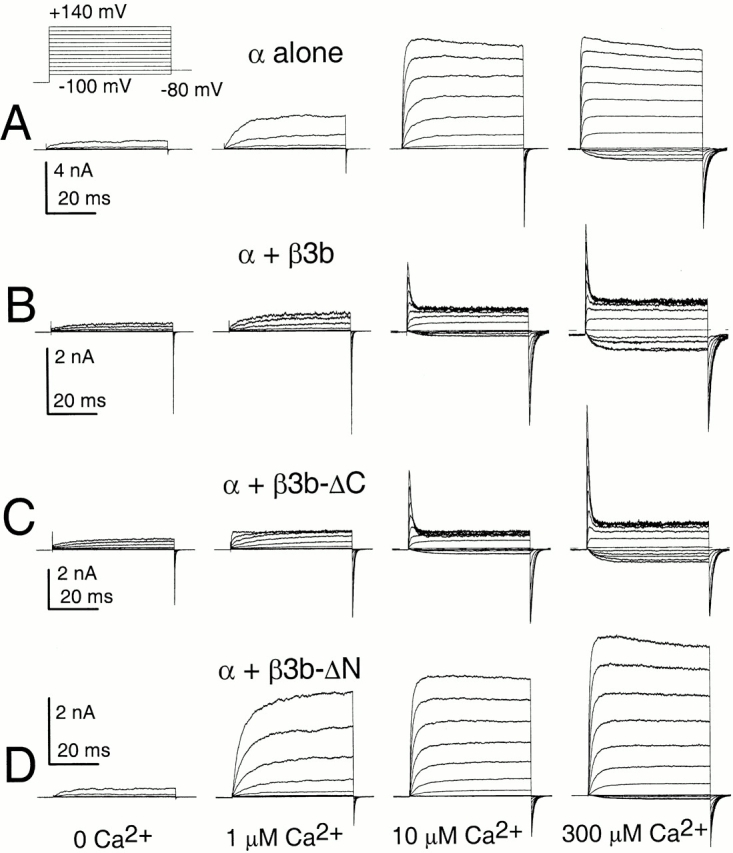
Activation of channels resulting from β3b constructs with or without the NH2- and COOH termini. In A, traces show currents obtained from an inside-out patch from a Xenopus oocyte injected with cRNA encoding the mouse Slo α subunit alone. Channels were activated by voltage steps from −100 to +180 mV after 20 ms at −140 mV; from left to right, panels show currents activated with 0, 1, 10, or 300 μM Ca2+. The voltage protocol is shown on the top. In B, traces show currents resulting from coexpression of α + β3b under conditions identical to those in A. In C, traces show currents resulting from α + β3b-ΔC coexpression, whereas, in D, currents reflect α + β3b-ΔN coexpression.
G-V curves for currents activated with either 10 or 300 μM Ca2+ are shown for each construct in Fig. 2. For α alone and α + β3b-ΔN, separate G-V curves are shown for measurements from tail currents (100 μs after the nominal voltage-step) and from the peak current activated during any given command step. For α + β3b and for α + β3b-ΔC, a third G-V curve is also plotted corresponding to measurement of the steady-state current at the end of each depolarizing command step. As shown previously, the α + β3b conductance measured from peak currents shows an interesting inflection or double hump, as also seen here for α + β3b-ΔC currents (Xia et al. 2000; Lingle et al. 2001).
Figure 2.

Properties of conductance-voltage curves measured for different β3b constructs. In A, conductance determined either from peak current or tail current is plotted as a function of activation potential at either 10 μM Ca2+ (•, tail; ○, peak) or 300 μM Ca2+ (♦, tail; ⋄, peak) for a representative patch expressing α alone. In each panel, the solid lines over the tail current G-Vs are the best fit of (see materials and methods), while lines over peak or steady-state current G-Vs simply connect the points. At 10 μM, V0.5 = 48.3 mV, with k = 17.7 mV; at 300 μM, V0.5 = −31.4 mV, with k = 17.2 mV. In B, both peak current and tail current G-V curves (symbols as in A) are plotted for α + β3b currents, along with the steady-state conductance (▴, 300 μM; ▵, 10 μM) determined at the end of each activation step. For tail current G-V curves, at 10 μM, V0.5 = −18.6 mV, with k = 15.9 mV; at 300 μM, V0.5 = −49.3 mV, with k = 18.1 mV. In C, peak, tail, and steady-state G-V curves (symbols as in A and B) are plotted as in B but for α + β3b-ΔC currents. At 10 μM, V0.5 = −4.9.1 mV, with k = 12.8 mV; at 300 μM, V0.5 = −50.6 mV, with k = 14.7 mV. In D, peak and tail current G-V curves (symbols as in A) are plotted for α + β3b-ΔN currents. For tail currents, a fit of yielded, at 10 μM, V0.5 = 52.3 mV, with k = 21.4 mV; and, at 300 μM, V0.5 = −19.3 mV, with k = 25.2 mV. A function with two Boltzmann terms () better fit the tail current G-V curves. For 10 μM, V10.5 = 42.0 mV (k1 = 15.7 mV) and V20.5 = 108.0 (k2= 27.0 mV) with Gmax1 contributing 72.8%. For 300 μM, V10.5 = −34.9 mV (k1 = 14.6 nmV) and V20.5 = 50.4 (k2= 34.2 mV) with Gmax1 contributing 67.4%.
For α alone, G-V curves obtained from either tail or peak current measurements are similar (Fig. 2 A), with a slightly smaller value for maximum tail current conductance compared with peak current values. This discrepancy probably arises from two factors: first, the use of the 100-μs time point for measurement of tail current conductance; and, second, a slow reduction in current that can occur at positive potentials, which may reduce the subsequent tail current amplitude relative to the peak current. α + β3b (Fig. 2 B) and α + β3b-ΔC (Fig. 2 C) currents exhibit behavior similar to each other, but distinct from α alone. Tail current G-V curves are shifted leftward at both 10 and 300 μM relative to α alone. The steady-state current G-V curves show a voltage-dependent reduction in conductance at positive voltages converging to a similar level of Ca2+-independent block at both 10 and 300 μM Ca2+. Furthermore, the conductance measured from peak current shows an inflection and an increase at positive potentials that may actually exceed the maximal conductance estimated from the tail currents (Xia et al. 2000). Among patches, there is considerable variability in the relative amplitude of the peak current relative to steady-state or tail current amplitudes. This may reflect, at least in part, the sensitivity of peak current amplitude to slight differences among patches in the relative rates of activation versus inactivation at a given Ca2+ and voltage.
In contrast, the noninactivating α + β3b-ΔN currents exhibit features unlike either α alone or α + β3b. The most pronounced characteristic of the α + β3b-ΔN G-V curves is that the maximal conductance for the peak currents greatly exceeds that for the tail currents, indicative of a nonohmic reduction in conductance upon repolarization. Moreover, both peak current and tail current G-V curves are less steep in comparison to those resulting from other subunit combinations, implying a weaker or more complicated voltage dependence of activation. This will be examined more extensively below.
For comparison of the Ca2+ dependence of entry into activated states for the different constructs, tail current G-Vs were determined at 0, 0.5, 1, 4, 10, 60, and 300 μM Ca2+ for each construct (Fig. 3). For α alone, α + β3b, and α + β3b-ΔC, each G-V curve was fit with a single Boltzmann function (see materials and methods, ). For α + β3b-ΔN currents, a single Boltzmann was used to fit G-V curves at 1 μM or less, whereas a function (see materials and methods, ) with two independent Boltzmann terms was used to fit G-V curves at 4, 10, 60, and 300 μM Ca2+. For each construct, there is a leftward shift in the curves as Ca2+ is elevated. For both α + β3b (Fig. 3 B) and α + β3b-ΔC (Fig. 3 C), G-V curves obtained at lower Ca2+ exhibit a leftward shift relative to α alone (Fig. 3 A) or with the α + β3b-ΔN (Fig. 3 D) construct. Similarly, at more elevated Ca2+, there is also a leftward shift of the G-V curves for α + β3b and α + β3b-ΔC relative to α alone. For the moment, in the absence of a specific model to account for the shape of the α + β3b-ΔN curves, the use of to fit the α + β3b-ΔN G-V curves simply provides a useful empirical description. The Boltzmann component defined in corresponding to activation at the more negative potentials corresponds to over 70% of the total conductance in the α + β3b-ΔN tail current G-V curves at 10, 60, and 300 μM Ca2+. This component was used for comparison to the other constructs.
Figure 3.
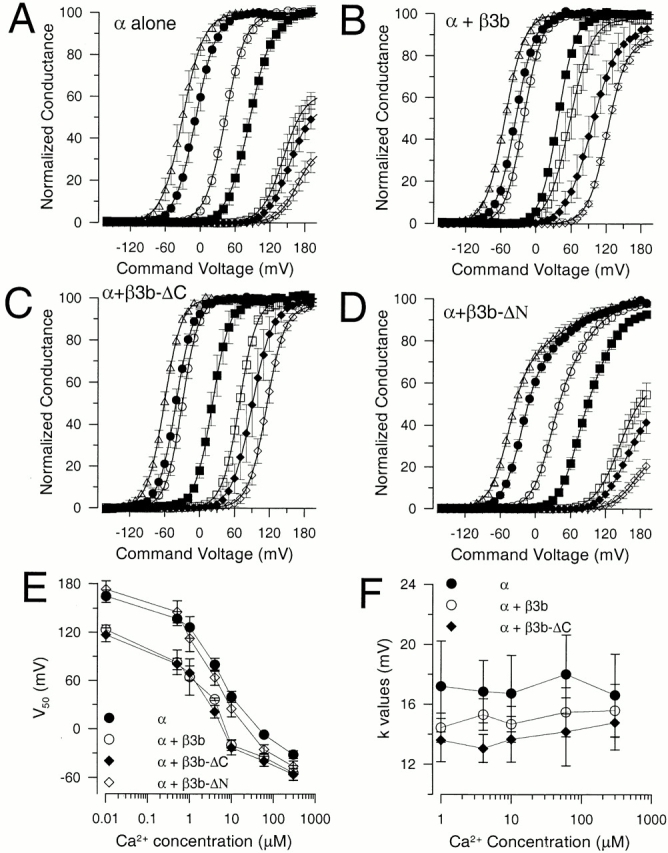
Ca2+ dependence of tail current conductance for different β3b constructs. In A, tail current G-V curves are plotted for 0 (⋄), 0.5 (♦), 1 (□), 4 (▪), 10 (○), 60 (•), and 300 μM Ca2+ (▵) for currents arising from α subunit alone. Each point shows the mean and SEM for a set of five patches. Values for V0.5 are 167.1, 153.7, 143.1, 85.4, 43.2, −7.7, and −30.3 mV, while values for k are 17.1, 18.5, 18.6, 19.2, 17.2, 17.6, and 18.0 mV for 0 through 300 μM, respectively. In B, tail current G-V curves are plotted as in A but for α + β3b currents for the same Ca2+ concentrations. Values for V0.5 were 122.1, 95.6, 57.6, 37.1, −21.6, −35.0, and −53.3 mV, while values for k were 16.4, 21.9, 18.4, 14.8, 15.3, 16.2, and 16.5 mV for 0 through 300 μM respectively. In C, tail current G-Vs are plotted for α + β3b-ΔC with values of V0.5 of 115.1, 90.4, 68.3, 22.0, −29.7, −40.6, and −60.5 mV, and values of k of 15.7, 17.5, 14.9, 15.0, 14.2, 15.0, and 14.7 mV for 0 through 300 μM, respectively. In D, tail current G-V curves are plotted for α + β3b-ΔN. Solid lines show fits of for points at 0, 0.5, and 1 μM, and fits of for 4, 10, 60 and 300 μM. For fits of , values of V0.5 were 178.7, 156.6, 124.6, 67.4, 41.4, 17.5, and −26.3 mV, and values for k were 19.2, 17.2, 16.7, 16.5, 18.0, 33.0, and 25.4 mV, for 0 through 300 μM, respectively. For fits of , at 4 μM, with Gmax1 contributing 42.5%, V0.5(1) = 66.1 mV (k = 14.0 mV) and V0.5(2) = 110.1 mV (k = 21.7 mV); at 10 μM, with Gmax1 = 57.4%, V0.5(1) = 25.0 mV (k = 15.1 mV) and V0.5(2) = 77.1 mV (k = 27.8 mV); at 60 μM, with Gmax1 = 68.9%, V0.5(1) = −23.1 mV (k = 15.3 mV) and V0.5(2) = 56.7 mV (k = 36.1 mV); and at 300 μM, with Gmax1 = 66.2%, V0.5(1) = −45.8 mV (k= 14.9 mV) and V0.5(2) = 37.9 mV (k = 41.9 mV) In E, the mean values for the V0.5 for activation for each construct (α, •; α + β3b, ○; α + β3b-ΔC, ♦; and α + β3b-ΔN, ⋄) are plotted as a function of Ca2+. Values for α + β3b-ΔN were taken either from the V0.5 for a fit of a single Boltzmann or, at 10, 60, and 300 μM, from the more negative V0.5 of the two Boltzmann components. Error bars indicate SD for each set of values with at least five determinations in each case. In F, the mean values for k, the parameter for voltage dependence of activation, is plotted as a function of Ca2+ for α alone (•), α + β3b (○), and α + β3b-ΔC (♦).
In Fig. 3 E, the V0.5 at each Ca2+ is plotted as a function of Ca2+ for each construct. This again shows the shift in gating at low Ca2+ for the two constructs with the intact NH2 terminus, but not for the β3b-ΔN construct. Another characteristic of currents resulting from either α + β3b or α + β3b-ΔC is a steeper voltage dependence of the tail current conductance relative to α alone (Fig. 3 F). This increase in voltage dependence has been explained by the rapid recovery from inactivation, such that the voltage dependence of the blocking process can contribute to the occupancy of activated states monitored by the tail currents (Lingle et al. 2001).
β3b Constructs Exhibit Outward Rectification in the Instantaneous I-V Curves
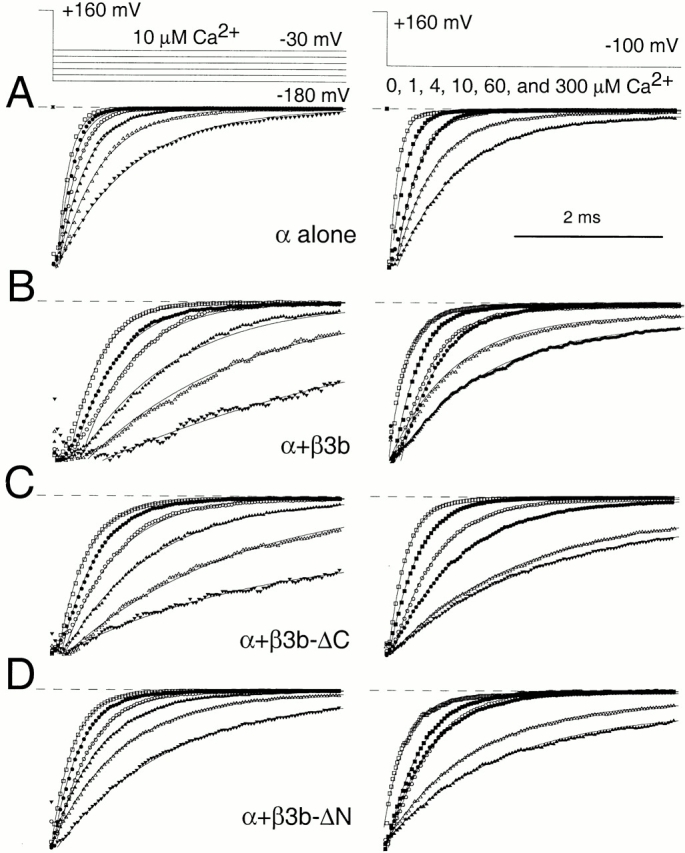
The maximal conductance estimated from the tail current G-V for the α + β3-ΔN currents is markedly less than the peak conductance observed at any command potential (Fig. 2 D), in contrast to the linearity of conductance for α alone (Fig. 2 A). To examine this non- ohmic current-voltage (I-V) behavior more explicitly, instantaneous I-V curves were generated for each construct. Current activation was elicited by a step to +160 mV, followed by repolarizing steps to potentials between −180 mV and +150 mV. As an estimate of the “instantaneous” current, the current level 100 μs after the nominal time of the repolarization step was measured (Fig. 4).
Figure 4.
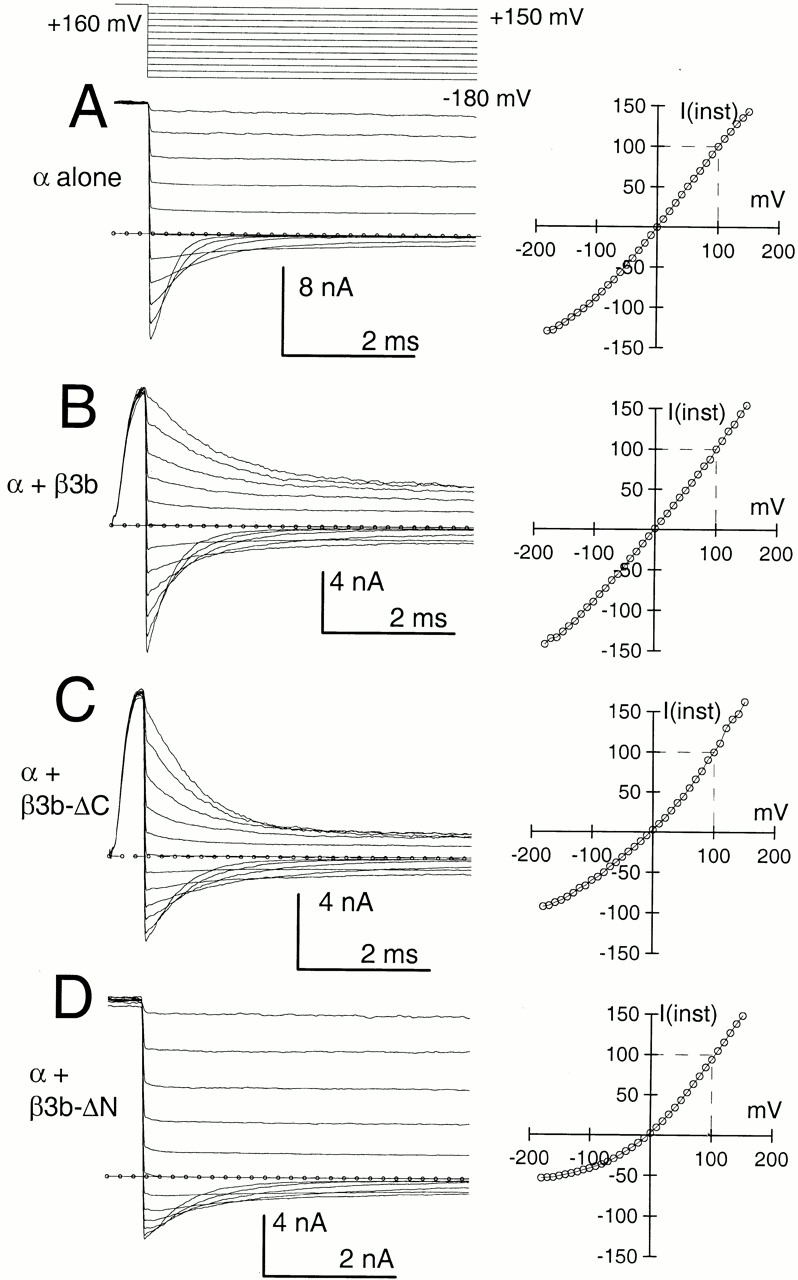
The β3b subunit results in a novel outward instantaneous current rectification that is most pronounced in the absence of the NH2 terminus. In A, traces on the left show currents resulting from α alone, activated by a voltage-step to +160 mV in the presence of 300 μM Ca2+, followed by repolarization to potentials between +150 mV and –180 mV. Measurement of current levels 100 μs after the nominal imposition of the repolarizing voltage step resulted in the plot on the right, in which current amplitudes were normalized to the amplitude measured at +100 mV. In B, traces are currents resulting from expression of α + β3b subunits. Here, the instantaneous I-V is largely linear over the entire range, (but see Lingle et al. 2001, in this issue). In C, traces show currents resulting from α + β3b-ΔC subunits. The instantaneous I-V shows a small outward rectification. We attribute the differences in the examples in B and C primarily to patch-to-patch variability in the relative rates of activation and inactivation at a given set of activation conditions. In D, traces show currents resulting from α + β3b-ΔN. The instantaneous I-V curve exhibits marked outward rectification with the conductance at +100 mV being at least twofold greater than at −100 mV.
For α alone (Fig. 4 A), current levels immediately after repolarizations from +160 mV are relatively similar at symmetrical potentials (Cui et al. 1997). The normalized instantaneous I-V curve (Fig. 4 A, right) is essentially linear with some decrease in conductance at potentials negative to −100 mV, probably reflecting rapid deactivation of current. For α + β3b (Fig. 4 B) and α + β3b-ΔC (Fig. 4 C), a complete description of the shape of the instantaneous I-V curve is more complicated. For α + β3b currents, the shape of the instantaneous I-V varies, dependent on the duration of the activation step (Lingle et al. 2001). For short activation steps, there is a slight outward rectification, whereas with longer activation steps, the instantaneous I-V curve exhibits inward rectification resulting from the rapid inactivation mediated by the NH2 terminus. In Fig. 4 B, after a 500-μs command step, an approximately linear I-V curve is observed. The properties of the instantaneous I-V curve for α + β3b-ΔC currents (Fig. 4 C) are similar to those for α + β3b. Specifically, the shape of the instantaneous I-V curve exhibits a shift from outward rectification (Fig. 4 C) to inward rectification as a function of the command step duration. Finally, when the NH2 terminus of the β3b subunit is removed (Fig. 4 D), the resulting instantaneous I-V curve exhibits marked outward rectification (Lingle et al. 2001, in this issue), which is not dependent on the activation step duration.
The above results and those reported elsewhere (Lingle et al. 2001, in this issue) show that instantaneous outward current rectification is an intrinsic characteristic of BK channels containing the β3b subunit and is not related to the presence or absence of the NH2 terminus. With inactivation intact, the outward rectification of open channels can only be observed with brief activation steps for both the β3b and the β3b-ΔC subunits. With longer activation steps, the rapid onset of the strong inward rectification resulting from the NH2 terminus masks the outward rectification.
Outward Rectification in the Instantaneous I-V Curve Correlates with Rectification in Single-channel Current Estimates
The shape of the instantaneous I-V curve for a population of channels should reflect something about the conductance of the open channels. Deviations from linearity might arise either from rapid gating processes, e.g., rapid channel block, resulting in a time-averaged reduction in the true single-channel current or some voltage-dependent effect on ion permeation (Moss and Moczydlowski 1996). We have shown that the steady-state inward rectification produced by the β3b subunit arises from a novel two-step blocking action of the NH2 terminus (Lingle et al. 2001, in this issue). However, the outward rectification remains unexplained. Although a complete analysis of the outward rectification is beyond the scope of this paper, here we seek to provide some basis for future investigation of this problem. In patches with only a few α + β3b channels, channel openings exhibit considerable kinetic complexity and single-channel openings are not well-resolved (Xia et al. 2000). Here, we have focused on channels arising from either α + β3b-ΔN or α + β3b-ΔNΔC in which either the NH2 terminus or both the NH2- and COOH termini have been deleted. Openings of α + β3b-ΔNΔC channels in a multichannel patch are shown in Fig. 5 under conditions of low open probability. To maintain open probability at levels such that most openings were to a single-channel level, channels were activated with 0 μM Ca2+ at +40, +80, and +100 mV, and 10 μM Ca2+ at −40, −80, and −100 mV. In 0 Ca2+, no openings were observed at −100 mV. Despite removal of both NH2- and COOH termini, openings of α + β3b-ΔNΔC channels exhibit a flickery opening behavior and, even at positive potentials, the average open channel current level (recording bandwidth of 10 kHz) was substantially less than what would be observed for openings arising from α subunits alone (∼250–270 pS).
Figure 5.
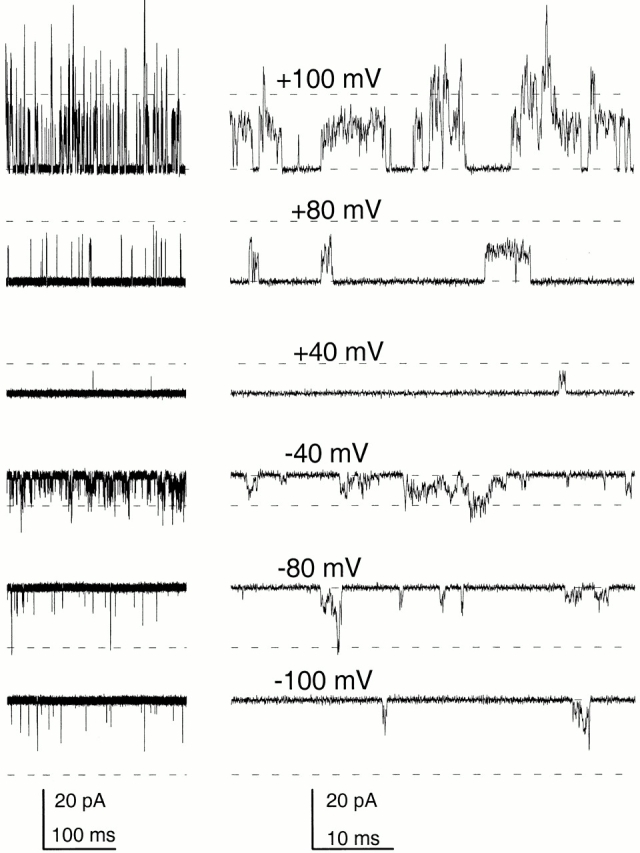
Channel openings resulting from α + β3b-ΔNΔC channels exhibit residual blocking behavior and an apparent nonlinearity in the average single-channel current level. Traces in each row show a lower and higher time base example of channel openings in an inside-out patch containing multiple α + β3b-ΔNΔC channels. Voltages are as indicated. At +100, +80, and +40 mV, the patch was bathed with 0 Ca2+, whereas at −40, −80, and −100 mV, the patch was bathed with 10 μM Ca2+. The dotted lines indicate the current level characteristic of α subunits alone, ∼250 pS. Even at +100 mV, α + β3b-ΔNΔC channels exhibit a flickery behavior, suggestive that a rapid blocking process is still present. For any individual channel burst, definition of an open level is unclear.
To estimate the average single-channel current amplitude, histograms of all digitized current values during steady-state recording at several potentials were generated. Histograms at symmetrical potentials were scaled and overlaid (Fig. 6) to allow comparison of the distributions of current values during openings. At positive potentials, histograms revealed a clear peak well separated from the peak corresponding to the closed channel level. At negative potentials, the distribution of current levels was markedly skewed, appearing as a secondary tail abutting the distribution of closed channel current levels. Only at −40 mV was there a hint of an actual peak in the open current levels near −3.2 pA. From the distributions at negative potentials, it is not possible to assign an average apparent single-channel current level. However, when the open channel current levels are compared at symmetrical potentials, it is clear that average current levels during openings at the negative potentials must be substantially reduced relative to those at the more positive potentials. The differences between the two distributions requires that, even if a true, unfiltered, completely open level were identical at both +100 and −100 mV, the average open channel current level is substantially less at −100 mV than it is at +100 mV. This is also the case at the other symmetric potentials. However, even at positive potentials, the average current level during channel openings is markedly less than expected for a fully open BK channel.
Figure 6.

Asymmetry of single-channel current amplitude distributions for α + β3b-ΔNΔC currents. Total amplitude histograms were generated from the records obtained from the patch used in Fig. 5. Amplitude histograms at symmetric voltages were scaled so that the bins with maximal counts were comparable for both inward and outward currents. The histograms at symmetric voltages were then overlaid to allow comparison of the current values during periods of open channel activity. In A, total amplitude histograms are compared at +60 and −60 mV. At +60 mV, a clear peak at ∼8 pA is observed, whereas at −60 mV current values show a hint of a peak ∼3–4 pA, with a strong skewing. In B, amplitude histograms at ±40 mV are compared with peaks at −3.2 pA (−40 mV) and +5.8 mV (+40 mV). In C, amplitude histograms at ±100 mV are compared with a peak for +100 mV at 16.5 pA and no clear peak at −100 mV. In D, amplitude histograms are compared at +80 and −80 mV, with a peak at +11.5 pA for +80 mV and no clear peak at −80 mV.
We also used an analysis of the variance and mean of currents activated by repeated steps to a given potential (Fig. 7) along with a similar analysis on the tail currents after repolarization. For α + β3b-ΔNΔC currents, at symmetrical potentials (Fig. 7A and Fig. B, ±60 mV) the initial slope of the variance versus mean relationship was consistently larger at the more positive potential, indicative that the underlying average single-channel current is greater at the more positive potential. At the most positive activation potentials (e.g., +140 mV with 10 μM Ca2+), the relationship between current variance and mean current exhibited a nicely parabolic relationship, in some cases approaching mean current levels near 90% of maximal activation (Fig. 7 D). The estimates of average single-channel current from the analysis of variance agree quite well with estimates from analysis of histograms of channel openings at low open probability. Because the channel openings, even at high bandwidth, exhibit a rapid flickery behavior (Fig. 5), the estimates of single-channel current amplitude should be considered indicative of the average current flowing through a single channel during a period of activity. Several factors including filtering and the kinetic behavior of the channels (Silberberg and Magleby 1993) can influence the shape of the variance versus mean curves. However, we found that, at either 10 or 20 kHz recording bandwidth, the initial slope of the variance versus mean relationship was relatively unchanged.
Figure 7.
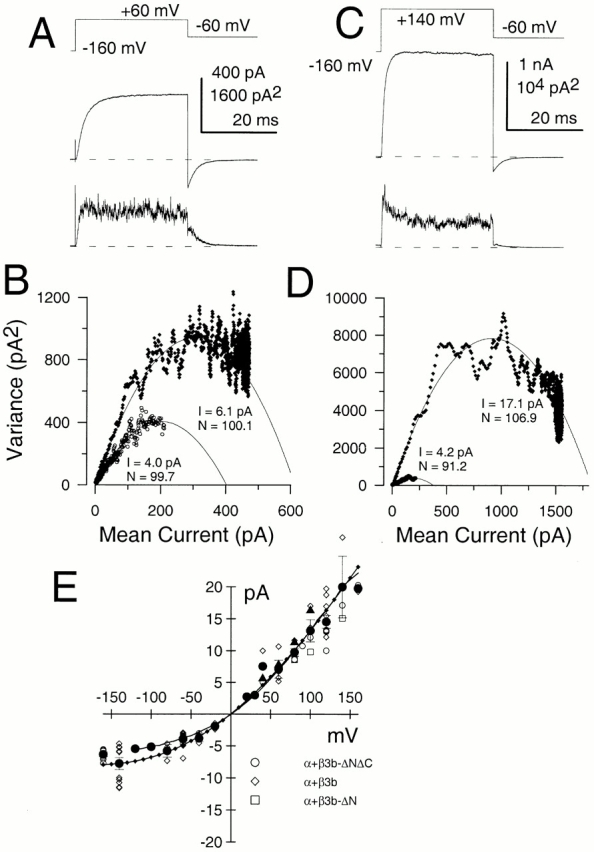
Ensemble variance analysis reveals nonlinearity in single-channel current estimates. In A, the indicated voltage protocol was used to repeatedly activate α + β3b-ΔNΔC currents with 10 μM Ca2+. The top current trace shows the average current from 75 sweeps, while the bottom trace shows the variance of all current values around the mean. In B, the current variance was plotted as a function of mean current at +60 mV (♦) and during repolarization to −60 mV (○). The initial slope of the variance versus mean relationship is steeper at +60 mV, indicative of a larger single-channel current amplitude. The solid lines are fits of in the materials and methods, where N and i are the fitted values for number of channels and single-channel current, respectively. At +60 mV, N = 100.1 and i = 6.1 pA, whereas at −60 mV, N = 99.7 and i = 4.0 pA. In C, mean current and variance determined for 90 sweeps are shown for the same patch with currents activated by a step to +140 mV with 10 μM Ca2+. In D, at +140 mV (♦), N = 106.9 and i = 17.1, whereas, at −60 mV (○), N = 91.2 with i = 4.2 pA. Currents were sampled at 5 μs per point at a bandwidth of 10 kHz. At +140 mV, the ensemble variance analysis would suggest that average open probability for these channels at 10 μM Ca2+ was 0.85, whereas at +60 mV, the average open probability was 0.79. These values are generally consistent with the near maximal activation of conductance observed in Fig. 3 D for the α + β3b-ΔN currents at +60 mV. In E, estimates of average open channel current obtained by different methods are plotted as a function of voltage. Open symbols correspond to individual ensemble variance analysis estimates. Values were obtained from α + β3b-ΔNΔC (○), α + β3b (⋄), and α + β3b-ΔN (□) currents, with no obvious differences among constructs. Mean values (•, and SD) for all variance analysis estimates for the three constructs were also determined at each potential. Mean values were calculated based on 2–16 estimates at each potential. The plot also includes estimates (▴) of single-channel current amplitude from the amplitude histograms shown in Fig. 6. The solid line is an instantaneous I-V curve for the α + β3b-ΔN currents (see Fig. 9 A in Lingle et al. 2001, in this issue) with the values normalized to the single-channel current value at +100 mV. The line with diamonds corresponds to the function: I(V) = V · G/(1 + K(0)exp−zFV/RT), with G = 173 pS, K(0) = 0.7 and z = 0.2, suggesting a limiting single-channel conductance of 173 pS.
Fig. 7 E summarizes estimates of the single-channel current amplitudes at different potentials from analysis of current variance for patches containing β3b, β3b-ΔN, and β3b-ΔNΔC constructs. In addition, the α + β3b-ΔN instantaneous I-V curve was normalized to be identical in amplitude to the single-channel current amplitude at +100 mV. This equivalence of the instantaneous I-V curve to the curvature in the estimates of average single-channel current amplitude supports the view that the outward rectification results from the anomalous voltage dependence in the apparent single-channel conductance. The existence of this outward rectification in α + β3b-ΔNΔC currents indicates that neither the NH2- nor COOH terminus participates in the rectification behavior. We imagine two possible explanations for the nonlinearity. First, the extracellular loop of the β3b subunit may exert a blocking effect on current flow or permit block by an exogenous factor. Second, the β3b subunit may modulate the gating behavior of the α subunit.
The outward rectification in the instantaneous I-V curve, no matter what the mechanism, accounts for the discrepancy between maximum conductances in the tail and peak current G-V curves for both α + β3b-ΔN and α + β3b-ΔNΔC currents. This rectification would also be expected to contribute to a difference in shape in the G-V curves measured by either method. Let us presume for the moment that activation of currents resulting from α + β3b-ΔN is similar to that for α alone, being reasonably well-approximated at a single Ca2+ concentration by a single Boltzmann which shifts leftward as Ca2+ is increased. In conjunction with a process resulting in outward rectification of the instantaneous I-V curve, we would expect that the G-V curve arising from the measurement of peak current should exhibit an upward creep even after maximum current activation is achieved. In contrast, the tail current G-V would only exhibit a single Boltzmann shape, since tail currents are measured at a single potential. Because the current rectification is instantaneous, it would not participate in the estimates of activation of conductance using tail currents. Yet, the G-V curves resulting from measurement of α + β3b-ΔN (and β3b-ΔNΔC) tail currents do exhibit a double Boltzmann shape. This suggests that some other process unrelated to instantaneous current rectification must underlie the unusual shape of the tail current G-V curves.
The Role of Instantaneous Current Rectification in Accounting for the Shape of α + β3b-ΔN and α + β3b-ΔNΔC G-V Curves
Peak and tail G-Vs for both α + β3b-ΔN and α + β3b-ΔNΔC currents are compared in Fig. 8. In both cases, G-V curves constructed from either tail or peak currents exhibit similar shapes, not well-described by single Boltzmann functions. Although at lower Ca2+, the curves are reasonably described by a single Boltzmann, at more elevated Ca2+ the bottom portion of each curve shifts in an approximately parallel leftward fashion, whereas the top portion of each curve exhibits an unusual upward creep.
Figure 8.
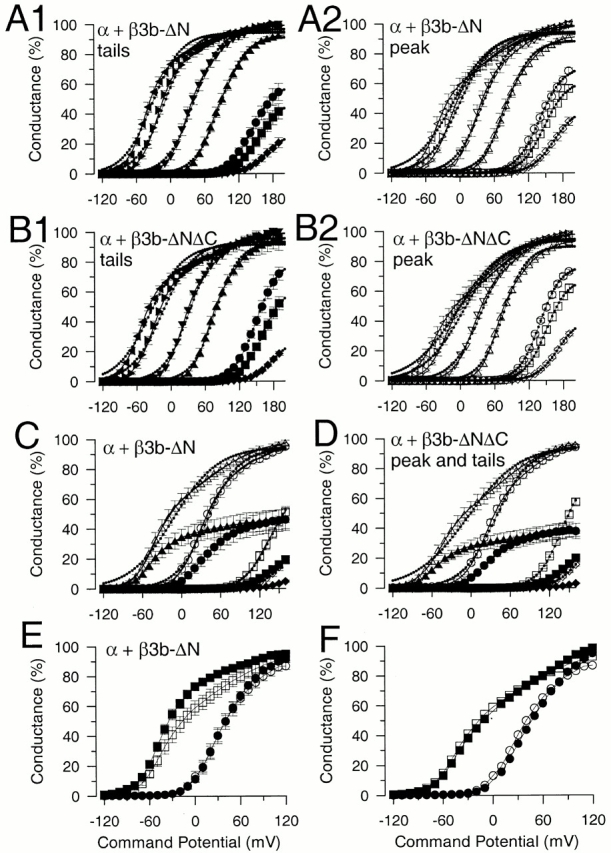
Comparison of families of peak and tail current G-V curves for both α + β3b-ΔN and α + β3b-ΔNΔC. In A, normalized G-V curves obtained from α + β3b-ΔN tail (A1; same as Fig. 3D) and peak (A2) currents are plotted for 0 (♦, ⋄), 0.5 (▪, □), 1 (•, ○), 4 (▴, ▵), 10 (▾, ▿), 60 (▸, ▹), and 300 (◂, ◃) μM Ca2+. Error bars are SEM for seven patches. Lines with small dotted circles represent fits of to each G-V curve, whereas a solid line shows the fit of , and 300 μM Ca2+. In B, G-V curves obtained from α + β3b-ΔNΔC tail (B1) and peak (B2) currents (4 patches) are plotted along with the fits of and . In C, normalized peak (open symbols) and tail current G-V curves for α + β3b-ΔN are compared for 0 (♦, ⋄), 1 (▪, □), 10 (•, ○), and 300 μM Ca2+ (▴, ▵). For each patch, the maximum tail current conductance was normalized to the maximum conductance estimated from the peak current. Error bars for the tail current estimates are larger here than in A because of additional variability in the relative amount of maximal tail to peak current conductance among patches. Fits of and to the peak current G-V curves are shown for 10 and 300 μM Ca2+ to emphasize that fails to describe the G-V curves at higher Ca2+. In D, relative amplitude of peak and tail current G-Vs are compared for α + β3b-ΔNΔC currents with symbols as in C. In E, the normalized peak (solid symbols) and tail current G-V curves for α + β3b-ΔN currents obtained at 10 and 300 μM Ca2+ are overlaid to emphasize the difference in shape between peak and tail G-V curves that is particularly pronounced at higher Ca2+. In F, a corrected tail current conductance (•, 10 μM Ca2+; ▪, 300 μM Ca2+) at each potential based on the measured tail current conductance and the nonlinearity of the instantaneous I-V curves (Fig. 7 E) was determined for α + β3b-ΔN currents. At each potential, tail current conductances (as in Fig. 7 E) were scaled by a factor defined by the idealized instantaneous I-V curve in Fig. 8, with the instantaneous conductance at −100 mV set to 1. Actual peak conductance values are also plotted (○, 10 μM; □, 300 μM).
We fit each G-V curve obtained at higher Ca2+ (4,10, 60, and 300 μM Ca2+) with containing two independent Boltzmann terms (as in Fig. 3 D). This makes no assumptions about the mechanism by which the G-V curves are generated, but allows us to compare the shape of the G-V curves. G-V curves for α + β3b-ΔN tail currents along with fits of either or are shown in Fig. 8 A1, whereas peak current G-V curves are shown in Fig. 8 A2. Similarly, tail and peak current G-V curves for α + β3b-ΔNΔC are shown in Fig. 8, B1 and B2, respectively. For both constructs, at 4 and 10 μM, both peak and tail current G-V curves were better fit by the two Boltzmann terms, but parameter estimates were not well-defined. At 60 and 300 μM, G-V curves were clearly better described by than and values are given in Table for both α + β3b-ΔN and α + β3b-ΔNΔC. Despite some uncertainty in the parameter estimates, when comparing the peak and tail current G-V curves, the values obtained for V0.5 for each component and their associated voltage dependencies exhibited reasonable agreement. The one parameter exhibiting the greatest consistent deviation between peak and tail current G-V curves was the ratio of the two components; the amplitude of the Boltzmann component with the more positive V0.5 was relatively larger in the peak current G-V curve than in the tail current G-V curve. The difference in relative amplitude of the two Boltzmann terms between peak and tail current G-V curves is qualitatively consistent with the difference expected from curvature in the instantaneous I-V curve. Yet, the fact that two Boltzmann terms are still required indicates that the shape of the tail current G-V curves arises from the intrinsic activation properties of the α + β3b-ΔN (and α + β3b-ΔNΔC) channels.
Table 1.
Parameters Obtained from Fitting Peak and Tail Current G-Vs with Two Independent Boltzmann Terms
| α + β3b-ΔNtail currents | α + β3b-ΔNpeak currents | α + β3b-ΔNΔCtail currents | α + β3b-ΔNΔCpeak currents | |
|---|---|---|---|---|
| 60 μM | ||||
| A1/A2 | 2.13 | 1.65 | 1.88 | 0.97 |
| V0.5(1) | −23.8 | −18.3 | −31.2 | −26.7 |
| k1 | 15.3 | 16.3 | 16.6 | 16.2 |
| V0.5(2) | 54.9 | 68.5 | 66.8 | 62.2 |
| k2 | 37.2 | 39.6 | 42.4 | 38.8 |
| 300 μM | ||||
| A1/A2 | 1.93 | 1.00 | 1.98 | 0.8 |
| V0.5(1) | −45.6 | −42 | −54.0 | −47.1 |
| k1 | 15.0 | 14.9 | 17.2 | 17.5 |
| V0.5(2) | 39.3 | 45.4 | 62.8 | 49.2 |
| k2 | 43.4 | 40.23 | 44.4 | 39.7 |
The dual component Boltzmann shape of the G-V curves might arise for a number of reasons. One trivial explanation would be that expression of the β3b-ΔN subunit is insufficient to populate all α subunits, such that the G-V curves arise from channels with differing stoichiometry. Several arguments can be made against this. First, we have examined α + β3b-ΔNΔC currents with β/α injection ratios (by weight) of 1:1, 2:1, and 5:1 with no noticeable differences in the results. Second, neither Boltzmann component exhibits the properties that would be expected for channels arising from α subunits alone. Third, if the unusual shape of the G-V curves arose from a combination of channels with differing stoichiometry, the shape of the curves should be preserved at each Ca2+ and simply shift in a parallel fashion along the voltage axis. The novel shape of the G-V curves might also arise by any mechanism resulting in heterogeneity of channel function, such as differential phosphorylation (Reinhart et al. 1991; Tian et al. 2001) or oxidation/reduction (Wang et al. 1997; Tang et al. 2001) within the channel population or by endogenous expression of unknown modifying factors within the oocytes. Some of the arguments above would also exclude these latter possibilities. However, perhaps the strongest argument that the unusual G-V curves do not arise from heterogeneity within the channel population is that the shape of the G-V curves over a range of Ca2+ has been quite consistent over a large number of patches, irrespective of the amount of channel expression and size of the currents. Furthermore, this behavior is never observed with currents arising from the α subunit alone, and has not been observed with either the β1 or β2 subunits. Although it is not possible to exclude alternative explanations for the shape of the G-V curves, the more likely possibility is that the shape of the G-V curves results from an effect of the β3b subunit on the activation energetics of the BK channel complex.
Do Standard Models of BK Activation Allow for Two Component G-V Curves?
Two sorts of general models have been used to examine the steady-state activation of conductance of BK channels as a function of voltage- and Ca2+. In broad measure, a 10-state Monod-Wyman-Changeau (MWC) model can describe the steady-state activation of conductance arising from either α alone or from coexpression of α + β1 (Cox et al. 1997; Cox and Aldrich 2000). Yet, despite its utility in accounting for steady-state conductance, the 10-state model fails to account for other gating properties of BK channels particularly at low Ca2+ (Nimigean and Magleby 2000). Another category of model that better accounts for both single-channel properties of BK channels and the macroscopic behavior both as a function of Ca2+and voltage is a 50-state two-tiered model (Horrigan et al. 1999; Rothberg and Magleby 1999; Cox and Aldrich 2000).
For the 10-state MWC model, an expression for the dependence of conductance on voltage and Ca2+ is defined (Cox et al. 1997) by:
 |
4 |
with B = [(1 + Ca/Kc)/(1 + Ca/Ko)]4. L(0) represents the open-to-closed equilibrium constant in the absence of an applied voltage, Q represents the equivalent gating charge associated with this equilibrium, Kc the closed-conformation Ca2+ dissociation constant, and Ko the open conformation Ca2+ dissociation constant (with F, R, and T having their usual meanings). At any given Ca2+ concentration, this equation reduces to a simple Boltzmann and, thus, cannot describe the type of behavior observed here.
For 50-state models, one particular formulation has been quite effective in accounting for the Ca2+ and voltage dependence of conductance arising from either α subunits or α + β1 subunits (Cox and Aldrich 2000). The key assumption used in the analysis of Cox and Aldrich was that voltage sensor movement does not directly influence Ca2+ binding and vice versa. Thus, no matter what conformational changes occur in association with voltage-sensor movement, Ca2+ binding remains the same until the channel opens. This assumption allows a relatively simple expression for the dependence of conductance on voltage and Ca2+ (Cox and Aldrich 2000):
 |
5 |
where B is as defined above, L(0) is the open-to-closed equilibrium constant when no voltage sensors are active and no Ca2+ binding sites are occupied, Q, is the gating charge associated with this closed to open equilibrium, Vhc, is the voltage at which a single voltage sensor is active half the time when the channel is closed, Vho, is the voltage at which a single voltage sensor is active half the time when the channel is open, and Z is the equivalent gating charge associated with each voltage-sensor's movement.
To evaluate the ability of this model to account for the activation of α + β3b-ΔN and α + β3b-ΔNΔC currents, we directly fit families of G-V curves with . This resulted in a reasonable fit of families of G-V curves arising from α alone (Fig. 9 A1) with values given in Table . Values differ from those identified by Cox and Aldrich 2000, but this is to be expected given the variability in such families of G-V curves. When was used to fit α + β3b-ΔN (Fig. 9 B1) or α + β3b-ΔNΔC current (Fig. 9C1), the fitting procedure converged on a set of best fit values (Table ). However, although the resulting fit generally described the shift in the G-V curves with Ca2+, the best fit curves did not adequately describe the double Boltzmann shape of the G-V curves particularly at higher Ca2+. Alternative seed values for the fit and independent simulations using other software also failed to identify values that resulted in families of curves exhibiting the shape of the observed G-V curves at higher Ca2+. Thus, the particular assumptions of the 50-state model used here do not describe the behavior of α + β3b-ΔN or α + β3b-ΔNΔC currents at higher open probability and Ca2+.
Figure 9.
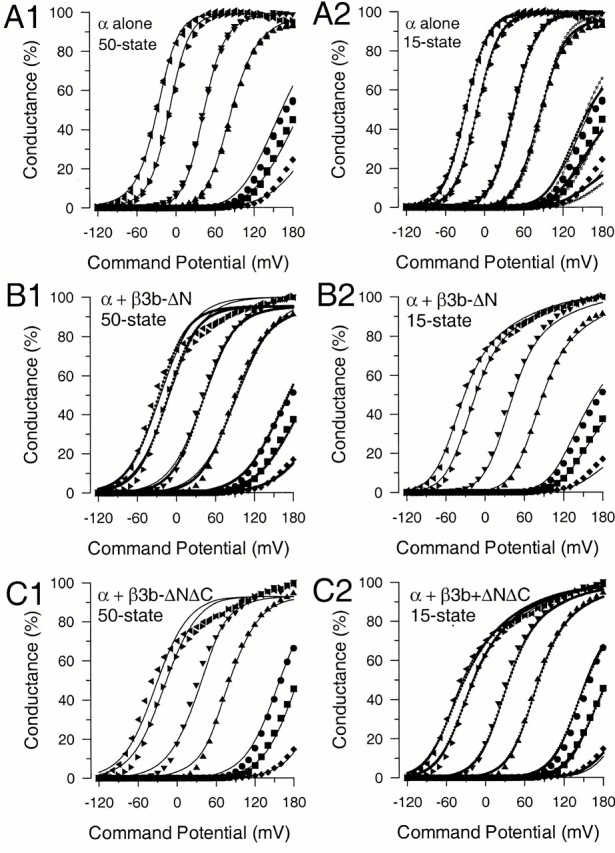
Coupling of voltage-dependent charge movement of closed states to changes in Ca2+ binding affinity can account for the unusual shape of the α + β3b-ΔN G-V curves. In A1, points show G-V curves arising from α alone while the lines show the best fit with the 50-state model () in which voltage sensor movement does not affect Ca2+ affinity. Best fit values are given in Table . In A2, defined by the 15-state model (Fig. 1) was used to fit the α alone G-V curves. With all parameters not constrained, the value for Kx was indeterminate. Fixing Kx near the value for Kc yielded the fit shown by the solid line. In an alternative fit (dotted line), it was assumed that the charge moved during voltage-sensor movement (Q1) and that during the closed-to-open transition (Q2) were identical to that revealed by the fit to G-V curves arising from α + β3b-ΔN. In this case, the value for Kx converged to a value near that for Kc. Best fit values are given in Table . The fit corresponding to the line with open circles resulted when all parameters except Kc and Kx were constrained to values that resulted from fitting the α + β3b-ΔN curves in B2. In B1, G-V curves resulting from α + β3b-ΔN were fit with (50-state model). Two fits are shown: one in which the peak conductance was constrained to be 100%, and the other with all parameters unconstrained. In B2, G-V curves resulting from α + β3b-ΔN were fit with (15-state model), with all values unconstrained. In comparison to the best fit for α alone, values for Kx approach that for Ko. In C1, mean G-V values for α + β3b-ΔNΔC were fit with with all values unconstrained. In C2, G-V values for α + β3b-ΔNΔC were fit with , in one case with all values unconstrained (dotted line) and the other (solid line) with values for V(0) and L(0) constrained to those obtained in the fit to the α + β3b-ΔN data.
Table 2.
Fitting of Families of G-V Curves by 50-state Activation Models
| (50-state) | α alone | α + β3b-ΔN | α + β3b-ΔNΔC | α alone# | |
|---|---|---|---|---|---|
| Ko (μM) | 1.44 | 1.40‡ | 1.40 | 0.82 | 0.80 (0.8–0.88) |
| Kc (μM) | 29.46 | 15.66 | 12.48 | 11.52 | 7.42 |
| Vhc (mV) | 52.56 | 141.8* | 106.5 | 340.0 | 141.8 (135–155) |
| D | 6.87 | 17.5* | 22.55 | 14.2 | 17.5 (10–20) |
| L(0) | 6.02 × 10⁵ | 2.9 × 10⁵ | 5.49 × 10⁶ | 4.46 × 10⁵ | 2.9 × 10⁵ (0.25–1.0 × 10⁶) |
| Q | 0.594 | 0.38 | 0.221 | 0.15 | 0.40 (0.35–0.45) |
| Z | 0.602 | 0.20 | 0.418 | 0.70 | 0.51 (0.51–0.59) |
| SSQ | 1,168 | 2,830 | 2,112 | 2,260 | |
‡Values for Vhc, D, and L(0) were fixed to those obtained by Cox and Aldrich for α alone.
We next turned to alternative models that might be expected to generate two Boltzmann components. Models in which the voltage dependence of activation is separated into two independent transitions can produce G-V curves with two Boltzmann components. For example, two simple cases,
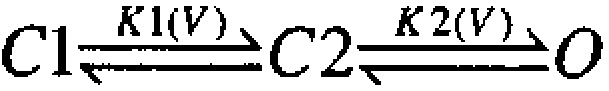
and
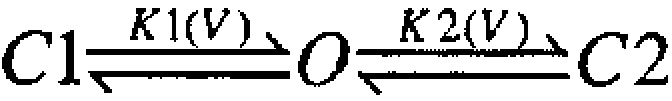
, can result in families of G-V curves exhibiting this type of shape where K1(V) might vary in some fashion with Ca2+, whereas K2(V) is independent of Ca2+. Similarly, for Shaker K+ channels, a model that qualitatively mimics the behavior of individual G-V curves seen here involves four independent and identical voltage-dependent transitions (Koren et al. 1990; Zagotta and Aldrich 1990; Gonzalez et al. 2000), followed by a final concerted opening transition also exhibiting voltage dependence:

.
Based on these considerations, we used a simple extension of the MWC 10-state model in which two separate voltage-dependent transitions precede channel opening
where terms are analogous to those defined previously. Horizontal reaction steps reflect Ca2+ binding equilibria where Kc, Kx, and Ko correspond to Ca2+ dissociation constants for channels either when closed (Kc), following a voltage-dependent conformational change preceding channel opening (Kx) or following channel opening (Ko), where V(0) corresponds to the zero voltage equilibrium between C1 and C1* at 0 Ca2+ and L(0) corresponds to the zero voltage equilibrium between C1* and O at 0 Ca2+. This model results in the following expression for steady-state open probability:
 |
6 |
where D = [(1 + Ca/Kx)/(1 + Ca/Ko)]4 and B = [(1 + Ca/Kc)/(1 + Ca/Ko)]4 . Q1 and Q2 are the net charge associated with movement from C1 to C1* and C1* to O1, respectively. Although Fig. 1 can be viewed as a subset of a general 50-state model, it differs from the specific 50-state model evaluated by Cox and Aldrich 2000 in that Ca2+ binding affinity is allowed to change as a consequence of voltage-sensor movement.
Scheme S1.

was used to fit families of G-V curves obtained for α alone (Fig. 9 A2), α + β3b-ΔN (Fig. 9 B2), and α + β3b-ΔNΔC (Fig. 9 C2) with the resulting parameter values given in Table . For both α + β3b-ΔN and α + β3b-ΔNΔC, fitting resulted in convergence on a set of values that accounts for the unusual shapes of the G-V curves. However, confidence limits on some of the parameters are not particularly well-defined, in particular for both V(0) and L(0). Yet, this procedure indicates that a model of the type given in Fig. 1 can reproduce the essential features of the data. A comparison of the values obtained from fitting either α + β3b-ΔN or α + β3b-ΔNΔC indicates that V(0) differs by over twofold in the two cases. Although the parameter limits on these estimates suggest that this difference is not meaningful, we refit the α + β3b-ΔNΔC data while constraining the values of V(0) and L(0) to those obtained in fitting the α + β3b-ΔN data. The resulting values are shown in Table and plotted in Fig. 9 C2. Given the variability that arises among different sets of patches, the present results suggest the G-V curves for α + β3b-ΔN and α + β3b-ΔNΔC currents are essentially indistinguishable.
Table 3.
Fitting of Families of G-V Curves by 15-state Activation Model
| (15-state) | α alone | α + β3b-ΔN | α + β3b-ΔNΔC | |||
|---|---|---|---|---|---|---|
| Ko (μM) | 1.42‡ | 1.34§ | 0.99 | 0.869 | 0.60 | 0.69‖ |
| Kx (μM) | 27.3* | 21.98 | 25.01 | 3.177 | 2.04 | 2.46 |
| Kc (μM) | 26.42 | 25.90 | 26.50* | 26.50 | 25.22 | 22.9 |
| V(0) | 40.95 | 387.1 | 915* | 915.0 | 2,348 | 915* |
| Q1 | 0.92 | 1.13* | 1.13* | 1.13 | 1.058 | 0.96 |
| L(0) | 366.2 | 49.15 | 61.07* | 61.07 | 52.51 | 61* |
| Q2 | 0.63 | 0.333* | 0.333* | 0.333 | 0.37 | 0.4 |
| SSQ | 1,221 | 1,424 | 1,701 | 637 | 765 | 852 |
*Value was constrained to that indicated. In all cases, Gmax converged to values near 100%.
‡Value for Kx was fixed to a value near the value to which Kc converged. With Kx unconstrained, values of Kx near that for Kc to those much larger had no substantial effect on fit quality.
§Values for Q1 and Q2 were constrained to those obtained from fits to the α + β3b-ΔN data, assuming that the same amount of net charge is moved during any given conformational change in the channel protein.
‖Values for V(0) and L(0) were constrained to those obtained from the fit to α + β3b-ΔN.
A critical element in obtaining families of curves that approximate the α + β3b-ΔN and α + β3b-ΔNΔC data is that the value for Kx must be fairly close to that for Ko. According to the assumptions of this analysis, this would imply that the channel can undergo a voltage-dependent conformational change preceding channel opening that results in a substantial change in the Ca2+ binding affinity of the channel. Thus, the major portion of the channel conformational change that results in the apparent higher Ca2+ affinity of open channels actually precedes channel opening.
Although the shape of the G-V curves for α alone does not require that multiple independent voltage-dependent transitions participate in activation, we examined what set of values for might describe the data for α alone. Not unexpectedly, with all parameters unconstrained, convergence did not occur; the value for Kx tended to drift to very large values. If Kx was constrained to a value near Kc (i.e., no change in Ca2+ affinity with voltage sensor movement), a reasonable fit was obtained (values in Table ). We also tested the assumption that the net charge moved during each of the gating transitions for α + β3b-ΔN must be identical to that for α alone. In this case, with Q1 and Q2 constrained, also converged to a set of values in which Kx was quite similar to Kc. Furthermore, when all parameters except Ko and Kx were constrained to the values obtained for the fit to the α + β3b-ΔN G-Vs, not only was a reasonable fit obtained, but Kx was similar to Kc, whereas Ko was similar to that obtained with α + β3b-ΔN (Table ). At least based on this simplistic model, the differences between α alone and α + β3b-ΔN can be accounted for by one parameter, i.e., Kx. This allows the possibility that multiple, independent voltage-dependent transitions do participate in gating of α alone, but that with α alone the Ca2+ binding affinity of the closed channel is relatively unaltered.
A characteristic of both and , when used to fit families of G-V curves, is that there are many local minima and parameters are strongly correlated. As a consequence, very different sets of parameter values can yield curves that do not deviate all that much from the best fit values. The reasonable strategy used by Cox and Aldrich 2000 to define their set of values for α alone was to take advantage of estimates for particular parameters obtained from independent methodologies (Horrigan and Aldrich 1999; Horrigan et al. 1999). Of course, this requires that the parameter be reasonably consistent among different sets of data. Because the parameters given by or are not well-defined by families of G-V curves, we attach less importance to the exact parameter estimates than to the fact that simply does a much better job in approximating the unusual shape of the G-V curves. Clearly, the 15-state model is an unrealistic description of the set of both voltage-dependent and Ca2+-dependent transitions known to occur for this family of channels. Therefore, it would be inappropriate to make specific mechanistic interpretations about the molecular events affected by the β3b subunit at this point. Rather, the analysis here simply suggests that multiple voltage-dependent transitions probably participate in the gating of BK channels and that the β3b subunit appears to allow visualization of those separate voltage-dependent steps.
Why does a 15-state model reproduce the appropriate behavior, whereas the 50-state model does not? Although Fig. 1 is a subset of a general 50-state model, the formulation of Cox and Aldrich 2000 is a very specific form of 50-state model. The key assumption in was that voltage sensor movement does not directly influence Ca2+ binding and vice versa (Cox and Aldrich 2000). In Fig. 1, we have proposed that a voltage-dependent conformational change preceding channel opening does result in a change in Ca2+ binding. This difference in assumption underlies the ability of , but not , to account for the results. 50-state activation models with different starting assumptions can also be made (Rothberg and Magleby 1999, Rothberg and Magleby 2000). Since some form of 50-state model is a more realistic approximation of the behavior of BK channels than a 15-state model, it will be interesting to test whether alternative 50-state models may describe the current data in a way that might allow a better assessment of the molecular transitions influenced by the β3b subunit. Alternatively, the 15-state model is also a subset of a general three-tiered model that may better describe some aspects of BK channel gating (Rothberg and Magleby 2000).
We have shown that the G-V curves arising from α + β3b-ΔN (and α + β3b-ΔNΔC) currents exhibit two novel characteristics. First, there is the marked outward rectification of the instantaneous I-V curve. Second, G-V curves measured from tail currents are not described adequately by single Boltzmann functions, suggesting that two separable voltage-dependent processes may contribute to the shape of the G-V curves. We have argued that these two phenomena are unrelated processes: tail currents are all measured at a single potential, such that voltage dependence in the instantaneous I-V should not contribute to curvature in the tail current G-V curve. If so, it should be possible to approximate the peak current G-V curve by simply scaling the tail current G-V curves at each potential by a factor defined by the curvature in the instantaneous I-V curve. Fig. 8 E plots the normalized peak and tail current G-Vs for α + β3b-ΔN currents at both 10 and 300 μM Ca2+. The difference in shape between the G-Vs at a given Ca2+ is more apparent at the higher Ca2+. We propose that the differences can be accounted for by the curvature of instantaneous I-V curve. To demonstrate this possibility, the tail current G-V curves obtained at 10 and 300 μM Ca2+ for the α + β3b-ΔN currents were scaled by the relative conductance defined by the instantaneous I-V curve. We assigned the relative conductance at the tail current potential (−100 mV) to be 1. For comparison, the relative conductance at +100 mV is 2.4. Scaling of the tail current G-Vs by the relative conductance predicted by the instantaneous I-V curves yields curves that agree reasonably well with the peak current G-V curves (Fig. 8 F).
From the above results and analysis, we draw the following conclusions. First, the β3b subunit, at least when it is lacking the NH2 terminus, appears to separate the activation behavior of the resulting BK channels into distinct voltage-dependent transitions. Second, the β3b subunit results in a rapid flickery behavior of the single channels that produces a nonlinearity in the instantaneous I-V curves. This curvature is present both with and without the presence of the NH2 terminus, although the additional rapid blockade produced by the NH2 terminus tends to mask the presence of the outward rectification in the instantaneous I-V curve. Third, the COOH terminus has no obvious functional effects.
Activation Kinetics of β3b Constructs
α + β3b currents exhibit a faster time to peak than expected based on the intrinsic channel closed to open transition steps (Xia et al. 2000). The rapid inactivation process, thus, masks any effects of the β3b subunit on channel activation. Here, we examine the effects of the β3b subunit on activation behavior when the NH2- or COOH terminus have been removed. Normalized current activation traces either as a function of command potential (at 10 μM Ca2+) or as a function of Ca2+ (at +100 mV) are shown in Fig. 10 for each construct. Fig. 10 A shows the characteristic behavior of α alone. The behavior of α + β3b-ΔC (Fig. 10 C) is largely identical to that of α + β3b (Fig. 10 B). In contrast, currents arising from α + β3b-ΔN (Fig. 10 D) exhibit markedly slower activation relative to either α alone or to α + β3b or α + β3b-ΔC. This suggests that the β3b subunit does exert some effects on transitions involved in current activation.
Figure 10.
Normalized current activation time course as a function of voltage or Ca2+ for each β3b construct. In A, on the left, currents resulting from expression of α alone in an inside-out patch were activated at 10 μM with the indicated voltage-protocol. Each current was fit with a single exponential function, and the currents were then normalized to the maximal current activated at each command potential. On the right, currents were activated at +100 mV with 1, 4, 10, 60, and 300 μM Ca2+. Currents were again normalized to the maximal current amplitude activated at the command potential. In B, similar normalized currents are shown for α + β3b. In C, normalized currents are shown for α + β3b-ΔC. These appear essentially identical to those for α + β3b. In D, normalized currents are shown for α + β3b-ΔN. Even at the strongest activation conditions (+180, 10 μM Ca2+ on the left and +100 mV, 300 μM Ca2+ on the right), the α + β3b-ΔN currents activate more slowly than any of the other constructs.
The rising phase of current under various conditions was fit with single exponential functions for each construct and the time constants for current activation were plotted as a function of voltage for each construct ([Fig. 11 A] α alone; [Fig. 11 B] α + β3b; [Fig. 11 C] α + β3b-ΔC; [Fig. 11 D] α + β3b-ΔN). For α + β3b and α + β3b-ΔC, when discernible inactivation of currents was observed, the rising and falling phases of the currents were fit with a double exponential function. In general, at the highest Ca2+ where activation is fast relative to the onset of inactivation, the activation time constant exhibits a similar dependence on voltage for all constructs. This suggests that the intrinsic voltage dependence of the transitions governing the activation rate is similar in all cases. For both α alone and for α + β3b-ΔN, the voltage dependence of the activation time constant is relatively similar at all Ca2+. In contrast, for both α + β3b and α + β3b-ΔC, at lower Ca2+, there is a seemingly anomalous increase in slope of the relationship between activation time constant and command potential. This behavior is not indicative of the underlying activation transitions, but reflects the fact that the apparent activation time course is influenced by the rates of inactivation steps (Xia et al. 2000). α + β3b and α + β3b-ΔC exhibit similar behavior in this regards.
Figure 11.
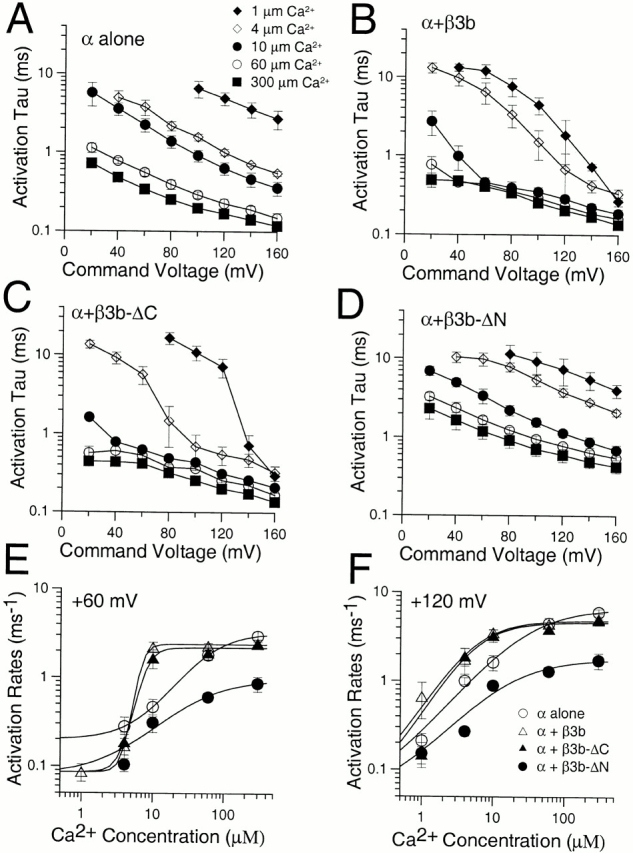
Comparison of activation time constants for α, α + β3b, α + β3b-ΔC, and α + β3b-ΔN. In A, the time constant of activation, τa, for currents arising from expression of the α subunit alone is plotted as a function of command potentials for 1 (♦), 4 (⋄), 10 (•), 60 (○), and 300 (▪) μM Ca2+ for 5–7 patches at each [Ca2+]. Error bars indicate standard deviation. In B, τa is plotted for α + β3b currents. Note the apparent faster time constant for α + β3b currents relative to α alone. Symbols in B–D are identical to those in A. In C, τa is plotted for α + β3b-ΔC currents, showing the similarity with α + β3b currents. In D, τa is plotted for α + β3b-ΔN currents. At all potentials and Ca2+, α + β3b-ΔN currents appear to activate more slowly than those arising from α alone. In E, apparent activation rates at +60 mV were calculated and plotted as a function of Ca2+ for each of the four sets of currents (α, ○; α + β3b, ▵; α + β3b-ΔC, ▴; and α + β3b-ΔN, •). Solid lines represent a fit of k(Ca) = k(0) 1 k max/(1 + ([Ca2+]/K)n) where k(0) is the activation rate at 0 Ca2+, k max is the maximal Ca2+-dependent increase in activation rate, K is the concentration of half effect, and n is the Hill coefficient. For α, α + β3b, α + β3b-ΔC, and α + β3b-ΔN, respectively, the maximal k(Ca) was 3.24, 2.34, 2.18, and 0.96 ms−1, K was 54.7, 6.7, 7.8, and 37.8 μM, and n was 1.4, 6.3, 4.5, and 1.01. Confidence limits on estimates of K and n were large, but at +60 mV the steeper Ca2+ dependence of the apparent activation rate for α + β3b and α + β3b-ΔC currents is clear. In F, apparent activation rates are plotted as in E but for currents measured at +120 mV. For α, α + β3b, α + β3b-ΔC, and α + β3b-ΔN, the maximal k(Ca) was 6.6, 4.9, 4.6, and 1.8 ms−1, respectively, K was 29.1, 5.5, 5.6, and 15.6, respectively, and n was 0.99, 1.33, 1.39, and 0.99, respectively. At +120 mV, the relatively faster intrinsic rate of activation of the β3b and β3b-ΔC constructs compared with +60 mV reduces the effect of inactivation on the apparent activation rate. Note that at both +60 and +120 mV, the limiting maximal k(Ca) for α + β3b-ΔN currents is less than that for any of the other constructs.
For all constructs, the activation time constants begin to reach a limiting value near 300 μM Ca2+. The activation time constants were converted to rate constants and plotted versus Ca2+ at +60 mV (Fig. 11 E) and +120 mV (Fig. 11 F) for each construct. Comparison of α alone to α + β3b-ΔN indicates that the β3b subunit in the absence of the NH2 terminus produces a marked slowing of the limiting activation time constant. Furthermore, over a range of Ca2+ that includes 4 and 10 μM, the presence of an intact NH2 terminus (α + β3b and α + β3b-ΔC) results in an apparently faster activation rate in comparison to α alone or α + β3b-ΔN. The difference in limiting activation time constant between β3b constructs with or without the NH2 terminus may seem surprising, but probably arises because the rising phase of current when rapid inactivation is intact is not well-described by an exponential or combination of exponentials. Thus, the values for α + β3b and α + β3b-ΔC should be considered apparent activation rates.
Deactivation Kinetics of β3b Constructs
Fig. 12 compares the normalized deactivation time course for each construct as a function of voltage (Fig. 12, left column) at 10 μM Ca2+, and as a function of Ca2+ (Fig. 12, right column) at −100 mV. The deactivation time course was fit with a single exponential function to yield the deactivation time constant (τd). For both α + β3b and α + β3b-ΔC constructs, the falling phase of the current deactivation is preceded by a brief increase in inward current that corresponds to a tail of rapid unblocking from inactivation (Lingle et al. 2001, in this issue). The presence of this rapid unblocking component has little impact on the deactivation time course itself, since removal of the unblocking phase with trypsin does not slow the subsequent deactivation time course (Lingle et al. 2001). τd is plotted for each construct in Fig. 13 (A–D) as a function of voltage for each Ca2+. Among different constructs, the dependence of τd on voltage is similar, with a slight trend toward steeper voltage dependence at higher Ca2+. To compare the behavior of the different constructs, the time constants were converted to rate constants and the rate of deactivation as a function of Ca2+ was plotted for each of two voltages ([Fig. 13 E] −80 mV; [Fig. 13 F] −160 mV). Comparison of α alone to currents arising from coexpression of α with any of the β3b constructs reveals that the β3b subunit, irrespective of the presence or absence of the NH2 terminus, slows the deactivation rate ∼1.5–2-fold relative to that for α alone. There is little difference among the three β3b constructs, indicative that neither the NH2- nor COOH terminus slow the return to closed states. We also examined deactivation rates for α alone versus α + β1 over a range of voltages at both 10 and 300 μM Ca2+. In contrast to the modest effect of the β3b subunit on current deactivation, the β1 subunit slows the deactivation rate by ∼10-fold (data not shown).
Figure 12.
Tail current deactivation is similar for β3 currents with or without NH2- and COOH-terminals. In A, normalized tail currents are shown for the α subunit alone. On the left, traces show tail currents evoked with 300 μM Ca2+ at potentials from −180 to −30 mV (voltage protocol on the top). On the right, traces show tail currents evoked at −100 mV with 0, 1, 4, 10, 60, and 300 μM Ca2+. Points show every second or fourth digitized data value, while lines are single exponential fits to the current decay. For −180, −150, −120, −90, −60, and −30, the fitted τd was 0.16, 0.21, 0.26, 0.38, 0.56, and 1.01 ms, respectively. For 0, 1, 4, 10, 60, and 300 μM, τd was 0.12, 0.21, 0.30, 0.30, 0.52, and 0.85 ms, respectively. In B, traces show normalized tail currents for α + β3b currents. Note the delay before the exponential decay of the tail current observed at more positive deactivation potentials and higher Ca2+. For −180, −150, −120, −90, −60, and −30, τd was 0.41, 0.58, 0.70, 1.33, 2.16, and 4.8 ms, respectively. For 0, 1, 4, 10, 60, and 300 μM, τd was 0.25, 0.34, 0.53, 0.46, 0.88, and 1.24 ms, respectively. In C, normalized tail currents are shown for α + β3b-ΔC. Again note the delay in current decay before the onset of exponentiality. For −180, −150, −120, −90, −60, and −30, the fitted τd was 0.39, 0.48, 0.71, 1.2, 2.32, and 2.74 ms, respectively. For 0, 1, 4, 10, 60, and 300 μM, τd was 0.25, 0.39, 0.60, 0.93, 1.76, and 1.96 ms, respectively. In D, normalized tail currents are shown for α + β3b-ΔN. Note the absence of the delay before exponentiality. For −180, −150, −120, −90, −60, and −30, the fitted τd was 0.29, 0.37, 0.47, 0.67, 0.96, and 1.51 ms, respectively. For 0, 1, 4, 10, 60, and 300 μM, τd was 0.30, 0.47, 0.58, 0.60, 1.21, and 1.56 ms, respectively.
Figure 13.
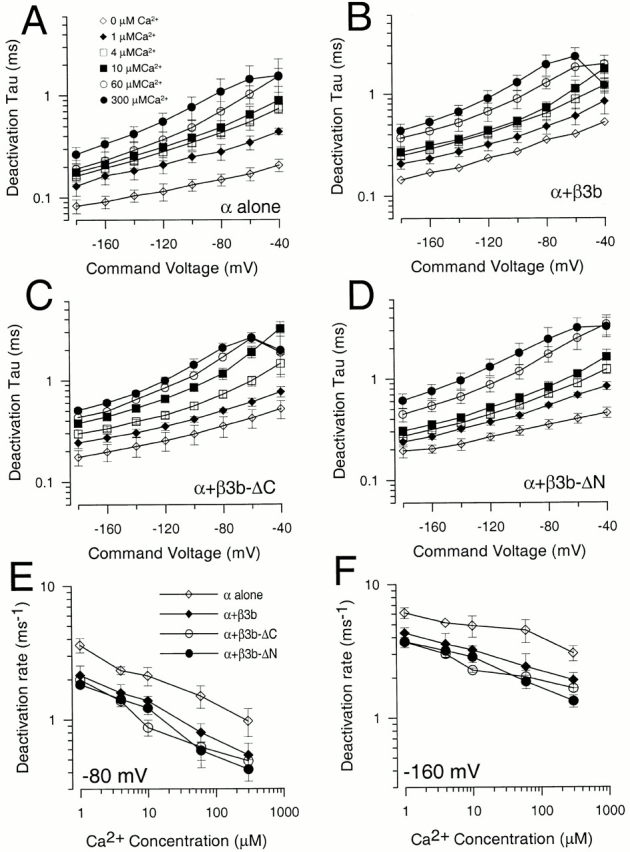
Comparison of deactivation time constants for different β3b constructs. In A, deactivation time constants (τd) obtained from single exponential fits to the tail current time course (Fig. 7) are plotted as a function of repolarization potential for currents from α subunit alone for 0 (⋄), 1 (♦), 4 (□), 10 (▪), 60 (○), and 300 (•) μM. In B, τd is plotted as a function of voltage for α + β3b currents with symbols as in A. In C, τd is plotted as a function of voltage for α + β3b-ΔC currents. In D, τd is plotted as a function of voltage for α + β3b-ΔN currents. In E, the deactivation rate measured at −80 mV is plotted as a function of Ca2+ for each construct (α, ⋄; α + β3b, ♦; α + β3b-ΔC, ○; and α + β3b-ΔN, •). In F, the deactivation rate measured at −160 mV is plotted as a function of Ca2+ with symbols as in E. Current deactivation for α alone is ∼1.5–2-fold faster than for currents resulting from any β3b construct.
Effects of Trypsin on Behavior of α + β3b Mutants
Inactivation mediated by the β3b subunit can also be removed by brief cytosolic application of trypsin. Comparison of α + β3b currents before and after trypsin offer the potential advantage that changes in relative current amplitudes and properties of activation and deactivation time course can be made on the same patch. Fig. 14 A shows α + β3b currents activated at 0, 1, and 10 μM Ca2+ before and after trypsin. After trypsin digestion, the currents exhibit a markedly slower apparent rise time, a much larger peak outward current level, and a more modest increase in tail current amplitude. After trypsin, at a given Ca2+ there is a shift in the tail current G-V curve to more positive voltages and a decrease in the apparent voltage dependence of current activation (Fig. 14 B). The change in shape of the G-V curves is particularly apparent at 10 and 300 μM Ca2+, and the tail current G-V is now better fit with the two Boltzmann function given in . The shift in V0.5 is more prominent at lower Ca2+, almost disappearing at higher Ca2+ (Fig. 14 C). This weaker voltage dependence and positive shift in V0.5 are similar to what is observed for α + β3b-ΔN currents.
Figure 14.
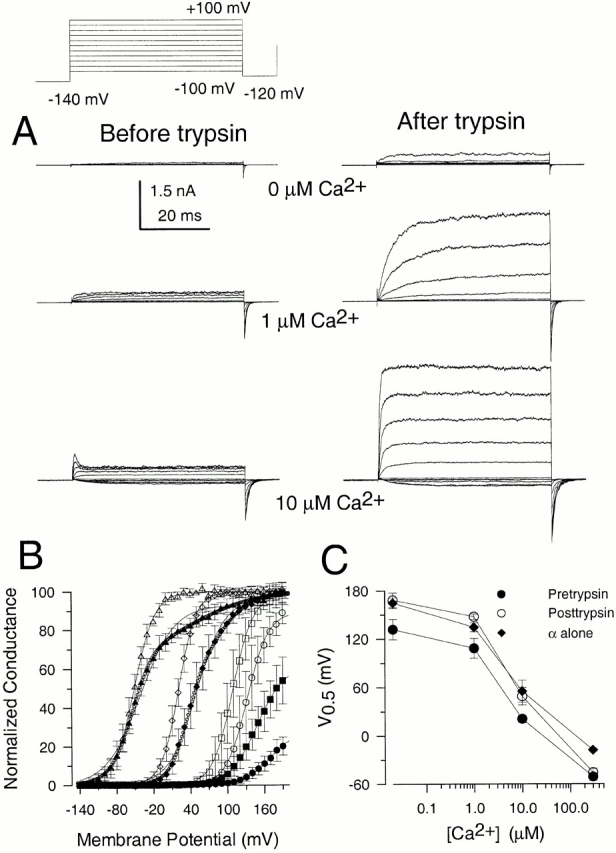
Removal of inactivation by trypsin shifts the V0.5 for activation at low Ca2+ to higher values and results in a weaker apparent voltage dependence of activation. In A, traces show α + β3b currents activated with the indicated voltage-protocol before (left column) and after (right column) removal of inactivation by brief trypsin application to the cytosolic face of the inside-out patch. Concentrations were 0, 1, and 10 μM Ca2+ as indicated. In B, normalized tail current G-V curves are plotted for a different set of five α + β3b patches before (open symbols) and after (solid symbols) trypsin application for 0 (•, ○), 1 (▪, □), 10 (♦, ⋄), and 300 (▴, ▵) μM Ca2+. Solid lines are fits of . Before trypsin, values for V0.5 were 132.3, 108.9, 21.1, and −51.2 mV for 0, 1, 10, and 300 μM Ca2+, respectively. After trypsin, V0.5 values were 170.2, 148.0, 50.1, and −41.3 mV for 0, 1, 10, and 300 μM, respectively. Average value of k before trypsin for this set of patches was 16.5 ± 1.3 mV (mean ± SD) and, after trypsin, 23.9 ± 2.6 mV. The solid line with smaller circles was the fit of to currents obtained at 10 and 300 μM Ca2+. For 10 μM Ca2+, Gmax1 = 60.0, k1 = 14.8 mV, V10.5 = 34.3 mV, Gmax2 = 40.0, k2 = 26.6 mV, and V20.5 = 89.3 mV. For 300 μM, Gmax1 = 70.2, k1 = 17.7 mV, V10.5 = −54.9 mV, Gmax2 = 29.8, k2 = 47.1 mV, and V20.5 = 53.2 mV. In C, mean values for V0.5 obtained from fits of at four different [Ca2+] are plotted as a function of [Ca2+] for the five patches with α + β3b currents shown in B both before (•) and after (○) trypsin was applied to remove inactivation. Error bars are SD. The V0.5 for four patches (♦) expressing only α alone was also determined from the same batch of oocytes.
The effects of removal of inactivation on outward current amplitude and apparent activation time course are shown in Fig. 15. Trypsin results in a large increase in outward current that is most prominent at positive potentials. Comparison of currents before and after trypsin indicates that, with inactivation intact, outward current is reduced at almost the earliest time points, which is consistent with the rapid inactivation process. Normalization of the currents before and after trypsin application (Fig. 15 A for 10 μM Ca2+ at +40 mV, and Fig. 15 B for 1 μM Ca2+ at +100 mV) shows that the apparent time to peak is substantially faster when inactivation is intact. Thus, although the current increase per unit time is slower before trypsin application, the rapid blocking equilibrium results in a faster apparent time to peak (Xia et al. 2000). In Fig. 15 C, apparent time constants of current activation are plotted for 1 and 10 μM Ca2+ as a function of command potential, showing that trypsin results in a marked slowing of the apparent activation time constant. In contrast, removal of inactivation by trypsin has no discernible effect on the time course of current deactivation (Lingle et al. 2001, in this issue). The effect of trypsin on α + β3b currents is essentially equivalent to the omission of the NH2 terminus from the β3b subunit.
Figure 15.
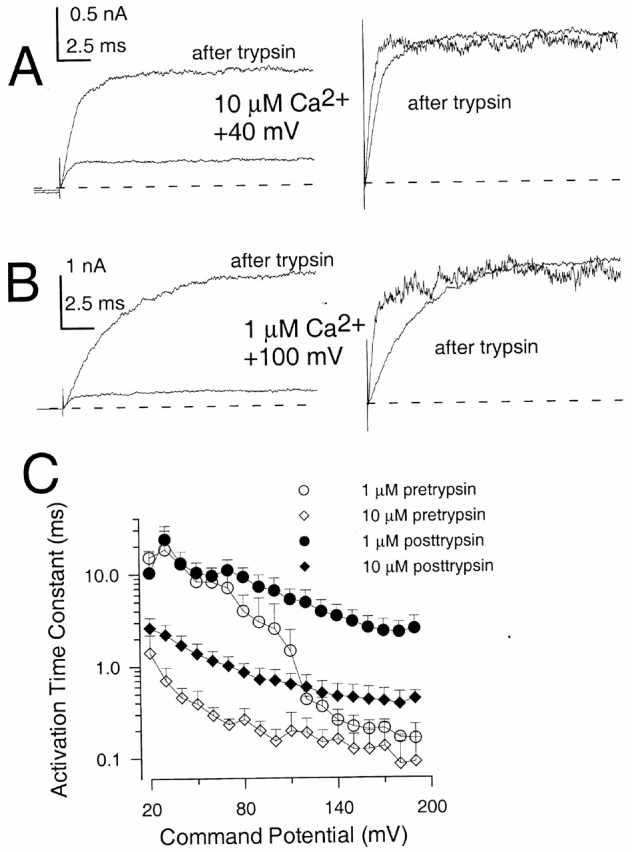
Removal of inactivation by trypsin slows the time to peak for activation of current, but has little effect on deactivation. In A, traces on the left show α + β3b currents for a patch activated with 10 μM Ca2+ by a step to +40 mV before and after trypsin application. At +40 mV with 10 μM Ca2+, there is no detectable time-dependent inactivation but just current rectification. On the right, the normalized currents are overlaid to show the faster apparent activation before trypsin-mediated removal of inactivation. In B, traces on the left show currents activated with 1 μM Ca2+ at +100 mV. The normalized currents on the right show a markedly faster time-to-peak of currents before trypsin application. In C, time constants of current activation were plotted as a function of command voltage for currents activated with either 1 or 10 μM Ca2+ either before (○, 1 μM; ⋄, 10 μM) or after (•, 1 μM; ♦, 10 μM) trypsin-mediated removal of inactivation. With inactivation intact, there is a faster apparent rate of current activation at low and moderate [Ca2+]. Points are mean and SD for three patches.
In a limited number of patches, the effect of trypsin on α alone was also examined with inconsistent results. In three patches, no change in G-V curves were observed, whereas, in three other patches, a negative shift as large as −30 mV was observed at 10 μM Ca2+. For α + β3b-ΔN currents, no change in V0.5 was observed with trypsin in four patches, whereas for α + β3b-ΔNΔC, no change in V0.5 was observed with trypsin in six patches. Thus, any positive shifts in G-V curves after trypsin treatment of patches with α + β3b currents are unlikely to result from effects on the α subunit alone.
DISCUSSION
One of the important functional roles exerted by certain members of the KCNMB auxiliary subunit family is to define the range of voltages over which a BK channel gates at a given Ca2+. Both the β1 and β2 subunits shift the voltage of half activation of conductance about −60 to −100 mV at Ca2+ concentrations above ∼10 μM relative to that observed for currents arising from the α subunit alone (McManus et al. 1995; Wallner et al. 1995, Wallner et al. 1999; Xia et al. 1999; Brenner et al. 2000). The present study was motivated, in part, by the observation that the β3b subunit shifts the V0.5 for gating at low Ca2+ relative to β1 and β2, while being less effective at higher Ca2+ (Xia et al. 2000). It has also been shown that the shift at low Ca2+ most likely results from the rapid inactivation mechanism, such that the tail current G-V reflects the overall equilibrium between closed channels and those that are either open or inactivated, rather than the closed-open equilibrium alone (Lingle et al. 2001, in this issue). Thus, the question of the extent to which the β3b subunit may have other effects on gating of BK channels in the absence of the NH2-terminal blocking mechanism has remained unanswered.
The present results have clarified several important aspects of the β3b subunit. First, without the NH2 terminus, the β3b subunit produces a rather modest shift in the V0.5 for activation in comparison to β1 or β2 subunits. However, there are anomalous aspects to the properties of the G-V curves that distinguish currents resulting from the α subunit alone from those resulting from coexpression of α with β3b-ΔN. Second, the lack of substantial effect of the β3b subunit on the V0.5 for activation is correlated with only minor effects of the subunit on gating kinetics. However, the present results clearly show that, in comparison to the α subunit alone, β3b subunits lacking the NH2 terminus do deactivate and activate a bit more slowly over the range of voltages and Ca2+ we have studied. The slowing of deactivation and, to some extent, activation are qualitatively similar to effects produced by the β1 and β2 subunits (Brenner et al. 2000), although much weaker than the effects produced by the latter subunits. Third, the COOH terminus appears to have no obvious functional effect on activation, deactivation, or inactivation. Fourth, the β3b subunit results in an outward instantaneous current rectification that is particularly apparent after removal of the NH2 terminus.
The β3b Subunit Has Effects on BK Channel Gating Independent of the NH2 Terminus
Previous work showed that shifts in tail current G-V curves observed for α + β3b currents particularly at lower Ca2+ may arise from the rapid block and unblock mediated by the β3b NH2-terminal (Lingle et al. 2001, in this issue). The present results support this interpretation by showing that when the NH2 terminus is removed from the β3b subunit, either by omission of residues from the expressed construct (β3b-ΔN) or by treatment with trypsin, the tail current G-V curves at low Ca2+ are shifted toward values more characteristic of those seen for α alone. Thus, blockade by the NH2 terminus appears to account for much of the shift in the G-V curves relative to those seen for α alone. However, the slope of the G-V curves for β3b subunits when the NH2 terminus has been removed (either β3b-ΔN, β3b-ΔNΔC, or β3b after trypsin) is markedly less voltage-dependent than for α alone and exhibits a shape better described by multiple Boltzmann components. Our analysis of the actions of the β3b constructs suggests that, in channels containing the β3b-ΔN (or β3b-ΔNΔC) subunit, the Ca2+- and voltage dependence of the steady-state conductance is better described by a simple activation model in which activation is separable into two distinct voltage-dependent steps. In contrast to one formulation of the 50-state, two-tiered activation model in which voltage dependence was separately assigned to both movement of the voltage-sensors and to the closed-open transitions (Horrigan et al. 1999; Cox and Aldrich 2000), the 15-state model used here assumes that Ca2+ affinity of the closed channel can be altered in conjunction with voltage-dependent conformational changes within the closed channel. We know of no a priori reason justifying either sort of assumption, but clearly the present results better support the view that coupling of voltage-dependent conformational changes and Ca2+ affinity may occur. However, we expect that a two-tiered 50-state model with assumptions different from those used here might provide a more realistic model of BK gating that would also account for the present observations. It should also be noted that Rothberg and Magleby have found in their analysis of single BK channels at a fixed voltage that three-tiered models, of which Fig. 1 is a subset, better describe some aspects of BK channel gating than models lacking intermediate closed states (Rothberg and Magleby 1999).
The unusual aspects of the Ca2+ and voltage dependence of activation of α + β3b-ΔN currents indicate that the β3b subunit has effects on the energetics of current activation that are independent of the NH2 terminus. However, given the unusual shapes of the G-V curves that arise from coexpression of α + β3b-ΔN, it is natural to ask two distinct questions. First, are the effects on current activation energetics mediated by the β3b-ΔN subunit mechanistically distinct from effects of the β1 and β2 subunits? Second, could the effects of the β3b-ΔN subunit be some de novo effect of the mutant subunit, unrelated to the effects of the native β3b subunit; e.g., something that might result from an inappropriate folding or interaction between the β3b-ΔN peptide and the α subunit?
Regarding the first question, it is clear that the β3b subunit does not shift gating in a manner similar to the β1 subunit. Furthermore, a model in which voltage sensor movement does not alter Ca2+ binding affinity does a reasonable job of accounting for the effects of the β1 subunit on activation (Cox and Aldrich 2000). However, we have observed both in our own data and that of others (e.g., Cox and Aldrich 2000) that G-V curves obtained both without or with β subunits often exhibit a creep at fractional activation values in excess of 0.8 that deviate from the predictions of either 10-state MWC models (Cox et al. 1997) or the 50-state model (Cox and Aldrich 2000). Such creep might arise from unknown experimental factors, e.g., offsets from ion accumulation at high activation probabilities. However, at higher Ca2+ (300 μM), such creep in G-V curves also occurs for currents activated near K+ reversal potentials where ion flux is minimal and ion accumulation unlikely to be a problem. Thus, although for both α alone and α + β1 such creep is minor, it may be a true property of the G-V curves. For α + β3b-ΔN (and α + β3b-ΔNΔC) currents, the separation into multiple voltage-dependent components is more pronounced. Thus, it is possible that the β3b subunit is only more effective than the other β subunits in revealing that multiple, independent voltage-dependent transitions may occur during gating of BK channels.
Whether the properties of the α + β3b-ΔN currents are indicative of the underlying effects of the β3b subunit can only be answered indirectly. Clearly, the shape of the tail current G-V curves arising from the α + β3b currents are well-described by a single Boltzmann, whereas those for the α + β3b-ΔN exhibit a more complicated shape. Our explanation for this is that the G-V curves arising from α + β3b reflect not only the underlying activation behavior of the channel, but also occupancy of inactivated states, which may tend to obscure the properties of the activation equilibrium (Lingle et al. 2001, in this issue). Experimentally, one test does indicate that the β3b-ΔN and β3b-ΔNΔC constructs interact with the α subunit in a way similar to the β3b subunit itself. Removal of inactivation by trypsin results in currents that exhibit the two key properties exhibited by the α +β3b-ΔN currents: (1) marked rectification in the instantaneous I-V curves; and (2) the unusual multiple component shape of the G-V curves.
The β3b Subunit Exhibits an Outward Rectification Unrelated to the Rapid Blocking Actions of the β3b NH2 Terminus
A remarkable aspect of the present results is the outward rectification in the instantaneous I-V curve observed for the β3b constructs. Typically, nonlinearity in a channel I-V relationship results either from voltage-dependent effects on ion permeation (Moss and Moczydlowski 1996) or from voltage-dependent rapid kinetic effects that limit the time-averaged single-channel current. The analysis of the apparent single-channel current amplitudes shows that some rapid kinetic process that reduces average single-channel current at more negative potentials is responsible for this outward rectification. The flickery nature of the single-channel openings even in the relatively unblocked condition at positive potentials suggests that a voltage-dependent, rapid blockade of the channel is occurring. However, it is also possible that this behavior could arise from a β3b subunit-induced allosteric modulation of gating behavior.
Neither the NH2- nor COOH termini participate in this rapid blocking process, since the β3b-ΔNΔC construct also exhibits similar rectification. The direction of the rectification raises the possibility that the extracellular domain of the β3b subunit may in some way contribute to the outward rectification. Work in progress confirms that the extracellular loop, but not the transmembrane segments, of the β3b subunit is responsible for the instantaneous outward current rectification (Zeng, X.H., X.-M. Xia, and C.J. Lingle, manuscript in preparation).
To our knowledge this is the only example of a potassium channel that exhibits strong outward current rectification under conditions of symmetrical K+ concentrations. What is probably most remarkable is that this instantaneous current rectification arises not from an intrinsic property of the pore-forming α subunit, but only through association with an auxiliary subunit. Clearly, expression of particular β subunit family members may be the critical determinant of the BK channel properties in the cells in which they are expressed. These results now add instantaneous current rectification to the list of fundamental characteristics of BK channels that are defined by the identity of the associated auxiliary β subunits.
Acknowledgments
We thank Lynn Lavack and Jamie Thorpe for preparation and injection of oocytes.
This work was supported by the National Institutes of Health grant DK46564 to C. Lingle.
Footnotes
Abbreviations used in this paper: BK, large conductance Ca2+-regulated, voltage-activated K+ channel; 0 Ca2+, contaminant Ca2+ with 5mM EGTA; MWC, Monod-Wyman-Changeaux.
References
- Adelman J.P., Shen K.Z., Kavanaugh M.P., Warren R.A., Wu Y.N., Lagrutta A., Bond C.T., North R.A. Calcium-activated potassium channels expressed from cloned complementary DNAs. Neuron. 1992;9:209–216. doi: 10.1016/0896-6273(92)90160-f. [DOI] [PubMed] [Google Scholar]
- Atkinson N.S., Robertson G.A., Ganetzky B. A component of calcium-activated potassium channels encoded by the Drosophila slo locus. Science. 1991;253:551–555. doi: 10.1126/science.1857984. [DOI] [PubMed] [Google Scholar]
- Brenner R., Jegla T.J., Wickenden A., Liu Y., Aldrich R.W. Cloning and functional characterization of novel large conductance calcium-activated potassium channel beta subunits, hKCNMB3 and hKCNMB4. J. Biol. Chem. 2000;275:6453–6461. doi: 10.1074/jbc.275.9.6453. [DOI] [PubMed] [Google Scholar]
- Butler A., Tsunoda S., McCobb D.P., Wei A., Salkoff L. mSlo, a complex mouse gene encoding “maxi” calcium-activated potassium channels. Science. 1993;261:221–224. doi: 10.1126/science.7687074. [DOI] [PubMed] [Google Scholar]
- Cox D., Aldrich R. Role of the β1 subunit in large-conductance Ca2+-activated K+ channel gating energetics. Mechanisms of enhanced Ca2+ sensitivity. J. Gen. Physiol. 2000;116:411–432. doi: 10.1085/jgp.116.3.411. [DOI] [PMC free article] [PubMed] [Google Scholar]
- Cox D.H., Cui J., Aldrich R.W. Allosteric gating of a large conductance Ca-activated K+ channel. J. Gen. Physiol. 1997;110:257–281. doi: 10.1085/jgp.110.3.257. [DOI] [PMC free article] [PubMed] [Google Scholar]
- Cui J., Cox D.H., Aldrich R.W. Intrinsic voltage dependence and Ca2+ regulation of mslo large conductance Ca-activated K+ channels. J. Gen. Physiol. 1997;109:647–673. doi: 10.1085/jgp.109.5.647. [DOI] [PMC free article] [PubMed] [Google Scholar]
- Ding J.P., Li Z.W., Lingle C.J. Inactivating BK channels in rat chromaffin cells may arise from heteromultimeric assembly of distinct inactivation-competent and noninactivating subunits. Biophys. J. 1998;74:268–289. doi: 10.1016/S0006-3495(98)77785-9. [DOI] [PMC free article] [PubMed] [Google Scholar]
- Garcia-Calvo M., Knaus H.G., McManus O.B., Giangiacomo K.M., Kaczorowski G.J., Garcia M.L. Purification and reconstitution of the high-conductance, calcium-activated potassium channel from tracheal smooth muscle. J. Biol. Chem. 1994;269:676–682. [PubMed] [Google Scholar]
- Giangiacomo K.M., Garcia-Calvo M., Hans-Gunther K., Mullmann T.J., Garcia M.L., McManus O. Functional reconstitution of the large-conductance, calcium-activated potassium channel purified from bovine aortic smooth muscle. Biochemistry. 1995;34:15849–15862. doi: 10.1021/bi00048a031. [DOI] [PubMed] [Google Scholar]
- Gonzalez C., Rosenman E., Bezanilla F., Alvarez O., Latorre R. Modulation of the Shaker K(+) channel gating kinetics by the S3-S4 linker. J. Gen. Physiol. 2000;115:193–208. doi: 10.1085/jgp.115.2.193. [DOI] [PMC free article] [PubMed] [Google Scholar]
- Hamill O.P., Marty A., Neher E., Sakmann B., Sigworth F.J. Improved patch-clamp techniques for high-resolution current recording from cells and cell-free membrane patches. Pflügers Arch. 1981;391:85–100. doi: 10.1007/BF00656997. [DOI] [PubMed] [Google Scholar]
- Horrigan F.T., Aldrich R.W. Allosteric voltage gating of potassium channels II. Mslo channel gating charge movement in the absence of Ca2+ . J. Gen. Physiol. 1999;114:305–336. doi: 10.1085/jgp.114.2.305. [DOI] [PMC free article] [PubMed] [Google Scholar]
- Horrigan F.T., Cui J., Aldrich R.W. Allosteric voltage gating of potassium channels I. Mslo ionic currents in the absence of Ca2+ . J. Gen. Physiol. 1999;114:277–304. doi: 10.1085/jgp.114.2.277. [DOI] [PMC free article] [PubMed] [Google Scholar]
- Knaus H.G., Folander K., Garcia-Calvo M., Garcia M.L., Kaczorowski G.J., Smith M., Swanson R. Primary sequence and immunological characterization of beta-subunit of high conductance Ca2+-activated K+ channel from smooth muscle J. Biol. Chem 269 1994. 17274 17278a [PubMed] [Google Scholar]
- Knaus H.G., Garcia-Calvo M., Kaczorowski G.J., Garcia M.L. Subunit composition of the high conductance calcium-activated potassium channel from smooth muscle, a representative of the mSlo and slowpoke family of potassium channels J. Biol. Chem. 269 1994. 3921 3924b [PubMed] [Google Scholar]
- Koren G., Liman E.R., Logothetis D.E., Nadal-Ginard B., Hess P. Gating mechanism of a cloned potassium channel expressed in frog oocytes and mammalian cells. Neuron. 1990;4:39–51. doi: 10.1016/0896-6273(90)90442-i. [DOI] [PubMed] [Google Scholar]
- Lingle C., Zeng X.-H., Ding J.-P., Xia X.-M. Inactivation of BK channels mediated by the NH2 terminus of the β3b auxiliary subunit involves a two-step mechanismpossible separation of binding and blockade. J. Gen. Physiol. 2001;117:583–605. doi: 10.1085/jgp.117.6.583. [DOI] [PMC free article] [PubMed] [Google Scholar]
- McManus O.B. Calcium-activated potassium channelsregulation by calcium. J. Bioenerg. Biomembr. 1991;23:537–560. doi: 10.1007/BF00785810. [DOI] [PubMed] [Google Scholar]
- McManus O.B., Helms L.M., Pallanck L., Ganetzky B., Swanson R., Leonard R.J. Functional role of the beta subunit of high conductance calcium-activated potassium channels. Neuron. 1995;14:645–650. doi: 10.1016/0896-6273(95)90321-6. [DOI] [PubMed] [Google Scholar]
- McManus O.B., Magleby K.L. Accounting for the Ca(2+)-dependent kinetics of single large-conductance Ca(2+)-activated K+ channels in rat skeletal muscle. J. Physiol. 1991;443:739–777. doi: 10.1113/jphysiol.1991.sp018861. [DOI] [PMC free article] [PubMed] [Google Scholar]
- Meera P., Wallner M., Jiang Z., Toro L. A calcium switch for the functional coupling between alpha (hslo) and beta subunits (Kv, cabeta) of maxi K channels. FEBS Lett. 1996;385:127–128. doi: 10.1016/0014-5793(96)83884-1. [DOI] [PubMed] [Google Scholar]
- Meera P., Wallner M., Toro L. A neuronal beta subunit (KCNMB4) makes the large conductance, voltage- and Ca2+-activated K+ channel resistant to charybdotoxin and iberiotoxin. Proc. Natl. Acad. Sci. USA. 2000;97:5562–5567. doi: 10.1073/pnas.100118597. [DOI] [PMC free article] [PubMed] [Google Scholar]
- Moczydlowski E., Latorre R. Gating kinetics of Ca2+-activated K+ channels from rat muscle incorporated into planar lipid bilayers. Evidence for two voltage-dependent Ca2+ binding reactions. J. Gen. Physiol. 1983;82:511–542. doi: 10.1085/jgp.82.4.511. [DOI] [PMC free article] [PubMed] [Google Scholar]
- Moss G.W., Moczydlowski E. Rectifying conductance substates in a large conductance Ca2+-activated K+ channelevidence for a fluctuating barrier mechanism. J. Gen. Physiol. 1996;107:47–68. doi: 10.1085/jgp.107.1.47. [DOI] [PMC free article] [PubMed] [Google Scholar]
- Nimigean C.M., Magleby K.L. The beta subunit increases the Ca2+ sensitivity of large conductance Ca2+-activated potassium channels by retaining the gating in the bursting states. J. Gen. Physiol. 1999;113:425–440. doi: 10.1085/jgp.113.3.425. [DOI] [PMC free article] [PubMed] [Google Scholar]
- Nimigean C.M., Magleby K.L. Functional coupling of the beta(1) subunit to the large conductance Ca2+-activated K+ channel in the absence of Ca2+. Increased Ca2+ sensitivity from a Ca2+-independent mechanism. J. Gen. Physiol. 2000;115:719–736. doi: 10.1085/jgp.115.6.719. [DOI] [PMC free article] [PubMed] [Google Scholar]
- Reinhart P.H., Chung S., Martin B.L., Brautigan D.L., Levitan I.B. Modulation of calcium-activated potassium channels from rat brain by protein kinase A and phosphatase 2A. J. Neurosci. 1991;11:1627–1635. doi: 10.1523/JNEUROSCI.11-06-01627.1991. [DOI] [PMC free article] [PubMed] [Google Scholar]
- Rothberg B.S., Magleby K.L. Gating kinetics of single large conductance Ca2+-activated K+ channels in high Ca2+ suggest a two-tiered allosteric gating mechanism. J. Gen. Physiol. 1999;114:93–124. doi: 10.1085/jgp.114.1.93. [DOI] [PMC free article] [PubMed] [Google Scholar]
- Rothberg B.S., Magleby K.L. Voltage and Ca2+ activation of single large-conductance Ca2+-activated K+ channels described by a two-tiered allosteric gating mechanism. J. Gen. Physiol. 2000;116:75–99. doi: 10.1085/jgp.116.1.75. [DOI] [PMC free article] [PubMed] [Google Scholar]
- Shen K.Z., Lagrutta A., Davies N.W., Standen N.B., Adelman J.P., North R.A. Tetraethylammonium block of slowpoke calcium-activated potassium channels expressed in Xenopus oocytesevidence for tetrameric channel formation. Pflügers Arch. 1994;426:440–445. doi: 10.1007/BF00388308. [DOI] [PubMed] [Google Scholar]
- Silberberg S.D., Magleby K.L. Preventing errors when estimating single channel properties from the analysis of current fluctuations. Biophys. J. 1993;65:1570–1584. doi: 10.1016/S0006-3495(93)81196-2. [DOI] [PMC free article] [PubMed] [Google Scholar]
- Solaro C.R., Ding J.P., Li Z.W., Lingle C.J. The cytosolic inactivation domains of BKi channels in rat chromaffin cells do not behave like simple, open-channel blockers. Biophys. J. 1997;73:819–830. doi: 10.1016/S0006-3495(97)78114-1. [DOI] [PMC free article] [PubMed] [Google Scholar]
- Solaro C.R., Lingle C.J. Trypsin-sensitive, rapid inactivation of a calcium-activated potassium channel. Science. 1992;257:1694–1698. doi: 10.1126/science.1529355. [DOI] [PubMed] [Google Scholar]
- Tang X.D., Daggett H., Hanner M., Garcia M.L., McManus O.B., Brot N., Weissbach H., Heinemann S.H., Hoshi T. Oxidative regulation of large conductance calcium-activated potassium channels. J. Gen. Physiol. 2001;117:253–274. doi: 10.1085/jgp.117.3.253. [DOI] [PMC free article] [PubMed] [Google Scholar]
- Tian L., Duncan R.R., Hammond M.S., Coghill L.S., Wen H., Rusinova R., Clark A.G., Levitan I.B., Shipston M.J. Alternative splicing switches potassium channel sensitivity to protein phosphorylation. J. Biol. Chem. 2001;276:7717–7720. doi: 10.1074/jbc.C000741200. [DOI] [PubMed] [Google Scholar]
- Uebele V., Wade T., Bennett P., Swanson R., Lagrutta A. A novel family of alternatively spliced BK β-subunits Biophys. J. 78 2000. 91(Abstr.) [Google Scholar]
- Vergara C., Latorre R., Marrion N.V., Adelman J.P. Calcium-activated potassium channels. Curr. Opin. Neurobiol. 1998;8:321–329. doi: 10.1016/s0959-4388(98)80056-1. [DOI] [PubMed] [Google Scholar]
- Wallner M., Meera P., Ottolia M., Kaczorowski G.J., Latorre R., Garcia M.L., Stefani E., Toro L. Characterization of and modulation by a beta-subunit of a human maxi KCa channel cloned from myometrium. Receptors Channels. 1995;3:185–199. [PubMed] [Google Scholar]
- Wallner M., Meera P., Toro L. Molecular basis of fast inactivation in voltage and Ca2+-activated K+ channelsa transmembrane beta-subunit homolog. Proc. Natl. Acad. Sci. USA. 1999;96:4137–4142. doi: 10.1073/pnas.96.7.4137. [DOI] [PMC free article] [PubMed] [Google Scholar]
- Wang Z.W., Nara M., Wang Y.X., Kotlikoff M.I. Redox regulation of large conductance Ca(2+)-activated K+ channels in smooth muscle cells. J. Gen. Physiol. 1997;110:35–44. doi: 10.1085/jgp.110.1.35. [DOI] [PMC free article] [PubMed] [Google Scholar]
- Weiger T.M., Holmqvist M.H., Levitan I.B., Clark F.T., Sprague S., Huang W.J., Ge P., Wang C., Lawson D., Jurman M.E. A novel nervous system beta subunit that downregulates human large conductance calcium-dependent potassium channels. J. Neurosci. 2000;20:3563–3570. doi: 10.1523/JNEUROSCI.20-10-03563.2000. [DOI] [PMC free article] [PubMed] [Google Scholar]
- Xia X.M., Ding J.P., Lingle C.J. Molecular basis for the inactivation of Ca2+- and voltage-dependent BK channels in adrenal chromaffin cells and rat insulinoma tumor cells. J. Neurosci. 1999;19:5255–5264. doi: 10.1523/JNEUROSCI.19-13-05255.1999. [DOI] [PMC free article] [PubMed] [Google Scholar]
- Xia X.-M., Ding J., Zeng X.-H., Duan K.-L., Lingle C. Rectification and rapid activation at low Ca2+ of Ca2+-activated, voltage-dependent BK currentsconsequences of rapid inactivation by a novel β subunit. J. Neurosci. 2000;201:4890–4903. doi: 10.1523/JNEUROSCI.20-13-04890.2000. [DOI] [PMC free article] [PubMed] [Google Scholar]
- Zagotta W.N., Aldrich R.W. Voltage-dependent gating of Shaker A-type potassium channels in Drosophila muscle. J. Gen. Physiol. 1990;95:29–60. doi: 10.1085/jgp.95.1.29. [DOI] [PMC free article] [PubMed] [Google Scholar]