

Abstract
Besides the physical limits imposed on photon absorption, the coprocessing of visual information by the phototransduction cascade and photoreceptor membrane determines the fidelity of photoreceptor signaling. We investigated the response dynamics and signaling efficiency of Drosophila photoreceptors to natural-like fluctuating light contrast stimulation and intracellular current injection when the cells were adapted over a 4-log unit light intensity range at 25°C. This dual stimulation allowed us to characterize how an increase in the mean light intensity causes the phototransduction cascade and photoreceptor membrane to produce larger, faster and increasingly accurate voltage responses to a given contrast. Using signal and noise analysis, this appears to be associated with an increased summation of smaller and faster elementary responses (i.e., bumps), whose latency distribution stays relatively unchanged at different mean light intensity levels. As the phototransduction cascade increases, the size and speed of the signals (light current) at higher adapting backgrounds and, in conjunction with the photoreceptor membrane, reduces the light-induced voltage noise, and the photoreceptor signal-to-noise ratio improves and extends to a higher bandwidth. Because the voltage responses to light contrasts are much slower than those evoked by current injection, the photoreceptor membrane does not limit the speed of the phototransduction cascade, but it does filter the associated high frequency noise. The photoreceptor information capacity increases with light adaptation and starts to saturate at ∼200 bits/s as the speed of the chemical reactions inside a fixed number of transduction units, possibly microvilli, is approaching its maximum.
Keywords: vision, retina, information, neural coding, graded potential
INTRODUCTION
The ability to adapt to mean illumination allows a photoreceptor to gather and process information about relative light changes (contrasts) over a vast range of intensities without saturating its steady-state membrane potential. The process of adaptation itself involves both the workings of the phototransduction cascade and the photoreceptor membrane. The phototransduction cascade is a signal pathway where a photoisomerized photopigment activates a cascade of intracellular biochemical reactions, which modulates the opening of light-sensitive ion channels on the photoreceptor membrane. Its output is the light (or transduction) current. In turn, the photoreceptor membrane has additional voltage-sensitive ion channels, which together with its capacitance shape the changes in the light current into a voltage response. There are many physical factors that can constrain the fidelity of the photoreceptor voltage responses: the physics of photon absorption, the delays and reproducibility of chemical reactions in the transduction cascade, and the stochasticity in the ion channel kinetics. So what kind of coding strategies do photoreceptors use against the noise, and how reliable are their graded voltage responses as neural representations of the dynamic contrast stimulation?
Drosophila photoreceptors have been successfully used as a model system for analyzing insect phototransduction. Recently, the transduction dynamics in dark-adapted photoreceptors have been extensively studied by patch-clamping dissociated cells (for reviews see Hardie and Minke 1995; Scott and Zuker 1998), but the physiology and response properties of light-adapted photoreceptors have been largely ignored. The reason for this is simple: the in vitro preparation does not readily survive prolonged light stimulation; on the other hand, although the in vivo intact fly preparation can survive hours of light adaptation, its small size has made intracellular recordings very difficult. Consequently, only limited data, such as some basic noise analysis of the elementary responses (i.e., quantum bumps) during light adaptation are available (Wu and Pak 1978; Johnson and Pak 1986). This report is an extensive in vivo study of the response and membrane properties and light adaptation dynamics in Drosophila photoreceptors at 25°C using linear signal and noise analysis with natural-like contrast stimulation. We found that the stronger light adaptation greatly improves the photoreceptors' information capacity. At low light intensity levels, the fidelity of photoreceptor responses is limited by the photon shot noise. Amplification of single photon responses into individual detectable events leads to noisy voltage responses, whose slow speed is set by the slow rate of the transduction reactions and matches the filter properties of the photoreceptor membrane. Such low frequency signaling keeps the photoreceptor information capacity low. On the other hand, in bright illumination, the Poisson properties of the light provide a high fidelity contrast stimulus. The voltage responses consist of a multitude of small and fast bumps, the photoreceptor membrane provides faster signaling, but the bump latency distribution remains relatively unaffected and this now sets the ultimate speed limit of the voltage responses. Further light adaptation does not improve the signaling fidelity when the rate of the chemical reactions is already at its maximum in the majority of the transduction units. Consequently, the photoreceptor information capacity starts to saturate ∼200–300 bits/s at a mean photon absorption rate of 3 × 10⁵ photons/s.
MATERIALS AND METHODS
Animals and Preparation
Flies, normal wild-type red-eyed Drosophila melanogaster, were obtained from a laboratory culture and reared at a constant temperature of 25°C.1–7-d-old flies were mounted with their head protruding from the open tip of a conical holder, whose hollow copper core was shielded outside with a ceramic insulator. Flies were fixed by their backs to the copper tip with a mixture of beeswax and heat sink paste, and the proboscis was stretched to eliminate vergence eye movements. This left the abdomen intact for ventilation, allowing the fly to survive for up to 2 d. A hole, the size of a few ommatidia, was cut manually in the dorsal cornea with a sharp razor edge and sealed with Vaseline. The holder was mounted on top of a ceramic recording platform, where its copper core fitted tightly to a Peltier element with heat sink paste. Underneath the Peltier element, inside the ceramic cylinder, a large copper rod functioned as a heat sink.
Temperature
The fly's body temperature was measured with a thermocouple mounted in the copper core next to the fly and could be changed in seconds from 10 to 35°C by a custom-designed feedback-controlled power source driving the Peltier temperature. The room temperature was monitored with a separate thermocouple. Control measurements from the fly's head revealed that the head temperature followed the temperature of the copper holder with ≤1°C accuracy over the temperature range. This paper presents photoreceptor data recorded at 25°C, whereas the companion paper (Juusola and Hardie 2000 in this issue) investigates the effect of temperature on photoreceptor signaling over a 15°C temperature range.
Microelectrodes and Recording Criteria
The microelectrodes were pulled with horizontal pullers (model P-97 or P-2000; Sutter Instrument Company) from fiber-filled borosilicate or quartz glass capillaries (Clark) with an inner and outer diameter of 0.5 and 1.0 mm, respectively. Electrodes were back-filled with 3 M KCl and coated with Vaseline. The resistance of the microelectrodes inside a cell varied between 120 and 250 MΩ. Because recording from small photoreceptors requires very sharp microelectrodes with good electrical properties, the resistance of the electrodes with a suitable shape (short shank with rapid taper to minimize the effects of intramural capacitance) was measured before the actual experiments in a grounded salt drop. This selection greatly increased the odds of good recordings. The time constant of the electrodes (τe) in tissue after a dual capacitance compensation of the amplifier (model SEC-10L; npi Electronic) was <10 μs, giving a high cut-off frequency of >20 kHz. Microelectrodes were mounted on a manual micromanipulator (model HB3000R; Huxley Bertram) and entered the compound eye through the previously prepared small hole. A blunt reference microelectrode, filled with fly Ringer's (containing in mM: 120 NaCl, 5 KCl, 10 TES, 1.5 CaCl2, 4 MgCl2, and 30 sucrose), was mounted on the back of the fly's head close to the eye.
Membrane potentials were recorded with the amplifier operating in the compensated current-clamp (CC) or balanced bridge mode. The recordings were carried out from green-sensitive R1-6 photoreceptor cells that are the dominant input to the Drosophila visual system (Strausfeld 1989). Because we used red-eyed flies instead of the commonly used white-eyed mutations, which lack all the screening pigments, and provided the light stimuli through a small point source (see Light Stimulation), the effects of extracellular field potentials on the recordings were minimal. The maximum extracellular field potentials evoked by saturating light flashes measured in the retina were typically <5 mV. A successful photoreceptor penetration was seen as a 60–75-mV drop in the electrode potential and vigorous responses to low intensity light pulses. The input resistance of the photoreceptors in the dark was 700 ± 540 MΩ (n = 9) and in fully light-adapted conditions, which depolarized the membrane 25–40 mV above the resting potential, 320 ± 100 MΩ (n = 4). These values are much higher than those previously reported from intracellular recordings (Wu and Pak 1978; Johnson and Pak 1986), but similar to those measured using patch-clamp electrodes (Hevers and Hardie 1995). By injecting a pseudorandomly modulated current into the cell and calculating the resulting membrane impulse response, we could estimate the membrane time constant. In the dark, membrane charging could be approximated with a single exponential time constant, τm ∼20 ms; when depolarized by a bright light background, τm was reduced to between 1 and 3 ms. However, often in light-adapted conditions, membrane charging was better fitted with two exponentials, probably indicating activation of separate voltage- and/or light-sensitive conductances. Before stimulus modulation experiments, the cells were allowed to dark adapt and seal properly for 2–10 min. Only data from photoreceptors with saturating impulse responses ≥60 mV, minimum dark input resistance of 300 MΩ, and dark resting potential below −60 mV are presented in detail in this study. These photoreceptors allowed stable recordings sometimes for several hours and, therefore, were used in a number of different experiments. Each of the experiments was repeated with a minimum of five cells unless stated otherwise. All the statistics are given as mean ± SD.
Recording Procedures
The stimulus generation, data acquisition, and signal analysis was performed by a custom written program (BIOSYST, M. Juusola, 1997-9) based on the MATLAB programming language (Mathworks) and an interface package for National Instruments boards (MATDAQ, H.P.C. Robinson, 1997-9).
Light Stimulation
Light stimuli were provided with a green high intensity light-emitting diode (Marl Optosource) driven by a custom-built LED driver. The light output of the LED was monitored continuously with a pin diode circuit. The light output range of >6 log units was calibrated by counting the number of single photon responses (bumps; Lillywhite and Laughlin 1979) during prolonged dim illumination (Juusola et al. 1994). The LED light output was attenuated by neutral density filters (Kodak Wratten) to provide five different adapting backgrounds in ∼1–log unit steps indicated by BG0, BG-1, BG-2, BG-3, and BG-4. The lowest adapting background applied, BG-4, was estimated to be ∼300 effective photons/s and the highest intensity, BG0 (no filter), was ∼3 × 10⁶ photons/s. A Cardan arm system allowed free movement of the light source at a constant distance (85 mm) from the eye's surface; the light source subtended ∼2°.
Light contrast (c) was defined as a change in the light intensity (ΔY) divided by the mean light background (Ymean) (Fig. 1 A, a):
 |
1 |
Figure 1.

Analyzing voltage responses to pseudorandomly modulated constant–variance light contrast stimulus at 25°C. (A, a) The contrast stimulus had a Gaussian probability distribution with an average value of 0.35 superimposed on the adapting background of BG0. (b) The contrast-evoked voltage responses, rV(t)i, were averaged to obtain (c) the signal, sV(t), and (d) the superimposed noise, nV(t)i. The millivolt scales apply for both the time traces and their corresponding histograms. Sampling frequency was 1 kHz, and the record duration was 10 s for every 10 trials. (B) By taking the FFT from the stimulus, response, signal and noise traces, we could calculate the corresponding power spectra (a, b, c and d, respectively). Because each contrast stimulus was measured as the LED output and recorded simultaneously with the corresponding voltage responses, we could estimate the variance in the stimulus (i.e., the stimulus noise). This is very small and close to the size of the bit-noise of the A/D converter. (a) Its power spectrum is indicated as C-noise and compared with the corresponding contrast stimulus power spectrum, |〈C(f )〉|2. (c) The signal power (continuous line) was rectified (dotted line) by the stimulus power spectrum. (d) Electrode noise, |〈Ne(f )〉|2, was subtracted from the total noise, |〈NV(f )〉|2 (thick line), to reveal the photoreceptor noise (thin line). This procedure brought the photoreceptor noise to zero above 100 Hz as indicated by an exclamation point. (e) SNR V (f )was calculated with . The continuous thick line is the SNR (calculated without signal correction, see c), the dotted line is the SNR from the stimulus-corrected signal power (see c); and the thin line is the SNR when electrode noise had been removed from the noise power (see d). Errors related to the removal of the electrode noise artificially pushed the SNR above 100 Hz to infinity. From SNR V (f ), we estimated both (g) the linear coherence function, γSNR 2 f, and (f) the cell's information capacity, by using and , respectively. Using the true, stimulus-corrected SNR V (f ), the estimated information capacity was here ∼3% higher than that calculated from the uncorrected SNR V (f ) (dotted and continuous lines, respectively). See materials and methods for more details. (C) From the signal and stimulus we calculated (a) the coherence, γexp 2 f; the frequency response, i.e., (b) gain and (c) phase, PV(f ), and minimum phase, Pmin(f ); and (d) the impulse response, kV(f ), function as described in materials and methods.
In case of pseudorandom contrast modulation (band-limited signal of a Gaussian amplitude distribution and spectrally white up to a 150 Hz; Fig. 1 B, a) ΔY is defined as the SD of the stimulus modulation (Juusola et al. 1994). This type of stimulus allows rapid measurement of system characteristics over a wide frequency bandwidth, and has the additional advantage of roughly resembling natural light contrasts encountered by a flying fly (Laughlin 1981).
Current Stimulation
To measure the light adaptational changes in the membrane impedance, we injected pulses or pseudorandomly modulated current into photoreceptors via the recording microelectrode (Weckström et al. 1992b) at all light intensity levels including darkness (Fig. 2 A, a). Electrodes that had suitable electrical properties (input resistance <180 MΩ) were used, and their capacitance was carefully compensated before the current injection experiments. Currents of up to 0.4 nA were injected though the electrodes to generate mean voltage changes <80 mV. The use of a switched clamp amplifier allowed us to record and monitor the true intracellular photoreceptor voltage and current during current and/or light stimulation (Juusola 1994).
Figure 2.

Analyzing voltage responses to pseudorandomly modulated constant–variance current stimulus. The data are from the same light-adapted photoreceptor at BG0 at 25°C as in Fig. 1. (A, a) The injected current stimulus had a Gaussian probability distribution and here varied between −0.2 and +0.2 nA. (b) Voltage responses, rV(t)i, were averaged to obtain (c) the signal, sV(t), and (d) the noise, nV(t)i, superimposed on it. nV(t)i contained any noise induced by the voltage-sensitive membrane and phototransduction noise. Sampling frequency was 1 kHz and the record duration was 10 s for 10 trials. (B) Because of the switched current clamp, we obtained true recordings of the current being injected into a photoreceptor and could calculate the variance of the current stimulus (i.e., stimulus noise). This variance was very small, again at the bit resolution limit of the A/D converter, and its power was ∼10−4 of that of the average power of the injected current waveform. Current stimuli with different bandwidth produced similar results (data not shown). By taking the FFT from the stimulus, response, signal, and noise traces, we could calculate the corresponding power spectra (a, b, c, and d, respectively). (e) SNR V (f ) was calculated with . From SNR V (f ), we could estimate both (g) the linear coherence function, γSNR 2 f, and (f) the cell's information capacity by using and , respectively. The information capacity of the membrane was much higher than that of transduction. See materials and methods for more details. (C) From the signal and stimulus, we calculated (a) the coherence, γexp 2 f; the frequency response, i.e., (b) gain, Z(f ), and (c) phase, PV(f ), and (d) the impulse response functions, z(t), as described in materials and methods. From input impedance (Z(f ), i.e., gain) we took the DC value as the mean input resistance of the cell, here 450 MΩ. The membrane time constant (τm) was approximated by fitting an exponential to z(t), here 1.98 ms.
Data Acquisition
Current and voltage responses were low-pass filtered at 0.1–2 kHz together with the corresponding LED output (model KEMO VBF/23 low pass elliptic filter). The signals were sampled at 0.5–10 kHz, digitized with a 12-bit A/D converter (model PCI-MIO-16E-4; National Instruments), and stored on a hard disk (Pentium II, 450 MHz). The sampling was synchronized to the computer-generated stimulus signal and records of the three signals were stored during each recording cycle. The length of records varied from 100 ms to 10 s, but during pseudorandom stimuli was ≥4 s (see Fig. 1 and Fig. 2, which show 0.5-s-long samples out of 10-s-long stimuli). A 2-s steady light background stimulus was maintained between stimulus sequences to provide equal light adaptation conditions for each run. The recording system, including the microelectrode, had a frequency response with a 3-dB high frequency cut-off at 10 kHz or higher and, therefore, had negligible effect on the results.
At different mean light backgrounds, the photoreceptor performance was tested using repeated presentations of the same pseudorandom Gaussian stimulus (light contrast and/or current). Each experiment proceeded from the weakest to the strongest adapting background. After stimulation, cells were re-dark–adapted. Recordings were rejected if the same sensitivity was not recovered by dark adaptation.
Processing of Voltage Responses in Time Domain
Repeated presentations (10–30 times) of virtually identical pseudorandom light contrast, c(t), or current, i(t), (Fig. 1 A and 2 A, a) evoked slightly variable voltage responses, rV(t)i (Fig. 1 A and 2 A, b; where V stands for voltage), due both to the recording noise and the stochastic nature of the underlying biological processes. Averaging the responses gave the noise-free light contrast or current-evoked photoreceptor voltage signal, sV(t) (Fig. 1 A and 2 A, c). Subtraction of the signal, sV(t), from the individual responses, rV(t)i, gave the noise component of each individual response period (Fig. 1 A and 2 A, d; compare with Juusola et al. 1994):
 |
2 |
Additionally, to avoid a possible bias of the noise estimates by the relatively small number of samples, the noise was recalculated using a method that did not allow signal and noise to be correlated. For example, when an experiment consisted of 10 trials, 9 of the trials were used to compute the mean and the other to compute the noise. This was repeated for each possible set of 9 responses giving 10 noncorrelated noise traces. These two methods gave similar noise estimates with very low variance. Errors due to residual noise in sV(t) were small and proportional to (noise power)/√n, where n is 10 (Kouvalainen et al. 1994). The signal-to-noise ratio in the time domain, SNRV, was estimated by dividing the signal variance by the corresponding noise variance.
Signal and Noise Power Spectra and SNRV(f )
sV(t) and nV(t)i were segmented into 50% overlapping stretches and windowed with a Blackman-Harris four term window (Harris 1978) before their corresponding spectra, SV(f )i and NV(f )i, were calculated with an FFT algorithm. Signal and noise power spectra, |〈SV(f )〉|2 and |〈NV(f )〉|2, respectively, where || denotes the absolute value and 〈〉 denotes the average over the different stretches of the signal and noise data, were calculated as real-valued functions (see Fig. 1 B and 2 B, c and d). In the same way the stimulus presentations c(t)i and i(t)i and the individual voltage responses, rV(t)i, yielded the power spectra |〈C(f )i〉|2, |〈I(f )i〉|2, and |〈RV(f )i〉|2 (see Fig. 1 B and 2 B, b and a, respectively). The variability in the stimulus was estimated by subtracting the average stimulus from the individual stimulus records (see above) and calculating the corresponding noise spectrum (Fig. 1 B and 2 B, a). It appears that the stimulus noise constituted <10−4 of the stimulus power. The variability in the photoreceptor responses was much larger and, hence, not caused by the variability in the stimulus.
The signal-to-noise ratio in the frequency domain, SNRV(f ) (Fig. 1 Band 2 B, e), of the photoreceptor potential was determined by dividing its signal power spectrum, |〈SV(f )〉|2, by its noise power spectrum, |〈NV(f )〉|2 (Fig. 1 B and 2 B, c and d; Juusola et al. 1994):
 |
3 |
The shape of the derived signal power spectra showed some degree of ripple, following the slight unevenness in the stimulus power spectra. Since this effect can lead to reduction in the photoreceptor SNRV(f ) at the stimulus frequencies that carry less power, the signal power spectrum was corrected by the stimulus power spectrum (Fig. 1 B, c, the dotted line):
 |
4 |
with ≪C f≫av 2 being the mean of the light contrast power spectrum over the frequency range investigated (i.e., 0–200 Hz). In most cases, the stimulus-corrected signal power spectrum overlapped smoothly that of the measured one. However, sometimes at low adapting backgrounds, we found that the stimulus-corrected signal power was noisier than the uncorrected signal power. In such cases, this smoothing procedure was not used.
Electrode recording noise power spectrum, |〈Ne(f )〉|2, calculated from the voltage noise (measured in the extracellular space after pulling the electrode from the photoreceptor), was not routinely subtracted from the data as the levels were very low compared with signal power, |〈SV(f )〉|2, and noise power, |〈NV( f )|2, and therefore made little difference to estimates of the photoreceptor SNR or information capacity at the frequencies of interest.
Information Capacity
From the signal-to-noise ratio, the information capacity (H) can be calculated (Shannon 1948; Fig. 1 B and 2 B, f):
 |
5 |
The dimension of the information capacity is bits/s. Because of the unreliability of the signal at frequencies above j = 150 Hz, the upper frequency limit of the integral was not taken to infinity (∞) but j.
Because the voltage responses at high adapting backgrounds are not purely Gaussian, but slightly skewed towards hyperpolarizing values (see results) the information capacity estimates determined here can only be considered as upper bounds of the true information capacity (Juusola and French 1997). On the other hand, at low adapting backgrounds, where the voltage responses are dominated by large and slow elementary responses, the signal is Gaussian, whereas the noise distribution is slightly skewed towards depolarizing values, resulting in an underestimation of the true information capacity. The information capacity estimates are further influenced by the fact that, as explained in the previous section, the photoreceptor noise power includes the electrode noise. This causes a slight underestimation of the true information capacity values.
The information capacity calculated from the input-corrected signal power spectra (Fig. 1 B, c; and see ) was only slightly larger than the uncorrected value, on average less than 10% (Fig. 1 B, f: dotted line versus continuous line).
Coherence
The coherence function for a purely linear coding scheme is calculated from the signal-to-noise ratio (Bendat and Piersol 1971; Theunissen et al. 1996; Haag and Borst 1997):
 |
6 |
In a perfectly linear, noise-free system, the coherence is expected to equal 1 for all frequencies. Here, we have a case where noise is added to the signal as it travels through the photoreceptor filter to produce a response. The coherence function, γSNR 2 f (see Fig. 1 and Fig. 2B, Fig. g), follows the changes in its signal to noise ratio, SNRV(f ) (see Fig. 1 B and 2 B, e). On the other hand, the coherence function for the noise-free voltage signal, γexp 2 f (see Fig. 1 C and 2 C, a), is calculated as (Bendat and Piersol 1971):
 |
7 |
Hence, we can compare the linear coherence, γSNR 2 f (), to the noise-free coherence, γexp 2 f () and, thus, expose any nonlinearities of the dynamic voltage responses.
Frequency and Impulse Responses
After frequency domain averaging of the stimulus and signal spectra of different segments, the photoreceptor frequency response, TV(f ) (), and impulse response, kV(t) (or first-order Wiener kernel; ), as well as membrane impedance and impulse response, Z(f ) and z(t), respectively, and coherence function, γexp 2 f (; Fig. 1 C and 2 C, a–d), were calculated from the autospectrum of the corresponding input (contrast, 〈C(f )· C*(f )〉 or current 〈I(f ) · I*(f )〉 stimulus) and output (photoreceptor signal, 〈SV(f ) · S*V(f )〉) and their cross-spectrum (〈SV(f ) · C*(f )〉 or 〈SV(f ) · I*(f )〉), where the asterisk denotes the complex conjugate, and 〈〉 is the average over the different stretches of the input and output data. For voltage signals to light contrasts:
 |
8 |
The frequency response, TV(f ), is a complex-valued quantity that can be expressed in terms of a gain, the ratio of the photoreceptor response amplitude to the stimulus amplitude (contrast gain: G V f=G V C f=T V C f, Fig. 1 C, b; or injected current: impedance, Z V f=G V I f=T V I f; Fig. 2 C, b), and a phase, PV(f ), the phase shift between the stimulus and the response (Fig. 1 and Fig. 2, Cc):
 |
9 |
where Im is the imaginary and Re is the real part of the cross-spectrum. Photoreceptors are not minimum phase systems, but include a pure time delay, or dead-time (French 1980; Juusola et al. 1994; de Ruyter van Steveninck and Laughlin 1996b; Anderson and Laughlin 2000). The minimum phase of a photoreceptor is calculated from the Hilbert transform, FHi, of the natural logarithm of the contrast gain function GV(f ) (de Ruyter van Steveninck and Laughlin 1996b):
 |
10 |
(for more details see Bracewell 2000). The frequency-dependent phase shift caused by the dead-time, φ(f ), is the difference between the measured phase and the estimated minimum phase (see Fig. 1 C, c):
 |
11 |
The dead-time was estimated over the flat frequency range (here 10–90 Hz) of φ(f )/(2πf ), where f is the frequency in Hz.
The impulse responses, kV(t) or z(t), which characterize the linear filtering properties of a photoreceptor to contrast or current stimulation in the time domain, were calculated as an inverse FFT of the corresponding frequency responses. For voltage signals to light contrasts:
 |
12 |
Light Current
Because in the light-adapted state both the membrane impedance and photoreceptor voltage responses behave linearly (as judged by the near unity coherence functions in Fig. 1 and Fig. 2, Ca; see also Results) we can calculate the phototransduction cascade's (or light current's) frequency response, TI(f ), and impulse response, kI(t), using linear systems analysis techniques. A first order approximation of the light current signal, sI(t), can be derived by deconvolving the impulse response of the membrane, z(t) (Fig. 2 C, d), from the corresponding contrast-evoked photoreceptor voltage signal, sV(t) (Fig. 1 A, c), both recorded in the same photoreceptor at the same mean light intensity and temperature:
 |
13 |
Then TI(f ) and kI(t) can be computed from the light contrast stimulus, C(f ), and the light current signal, SI(f ), as described in and , respectively.
RESULTS
We investigated the response properties of Drosophila photoreceptors to light contrast and current stimulation in the dark and at five different adapting backgrounds at different temperatures. We show here data measured at 25°C (Fig. 1 and Fig. 2). This was the rearing temperature of the pupae but, more importantly, in temperature gradient tests Drosophila have shown strong behavioral preference to dwell at ambient temperatures between 23 and 25°C (Sayeed and Benzer 1996). We found that the general adaptational changes in photoreceptor response dynamics, as described below, were not restricted to a certain temperature (see also companion paper Juusola and Hardie 2000, in this issue). Here our aim was twofold: (1) to define the light adaptation dynamics of Drosophila photoreceptors as a reference database for future studies of Drosophila eye mutations, and (2) to illustrate how the phototransduction cascade and photoreceptor membrane coprocess the photoreceptor voltage responses. To accomplish the latter task properly, the voltage responses of a photoreceptor to light contrast stimulation and current injection were measured in the same cell at the same mean light background. As will be demonstrated below, the dynamic response characteristics of light-adapted photoreceptors vary relatively little from one cell to another and are very similar across animals under similar illumination and temperature conditions. We illustrate our data and analysis with results from typical experiments starting with impulse and step stimuli and progressing to more natural-like stimulation. The data are from five photoreceptors, whose symbols are maintained throughout the figures of this paper.
Voltage Responses of Dark-adapted Photoreceptors
The photoreceptor voltage responses to light stimuli were first studied after 5–30 min of dark-adaptation. Fig. 3 A shows typical voltage responses to 1-ms light impulses of increasing relative intensity: (0.093, 0.287, 0.584 and 1, where 1 equals ∼10,000 effectively absorbed photons; note that the light intensity of the brightest impulse is ∼3.3 times that of BG0). Photoreceptors respond with increasing depolarizations, sometimes reaching a maximum size of ∼75 mV, before returning towards the dark resting potential (−60 to −75 mV). The latency of the responses decreases with increasing stimulus intensity, and often their early rising phases show a spikelike event or notch similar to those reported in the axonal photoreceptor recordings of blowflies (Weckström et al. 1992a).
Figure 3.

Voltage responses of dark- (A and B) and light-adapted (C) Drosophila photoreceptors. (A) Impulse responses to increasing light intensities (relative intensities: 0, 0.093, 0.287, 0.584, and 1). The time to peak decreases with increasing light intensity. An arrow indicates how the rising phase of the voltage responses often shows a fast depolarizing transient similar to those reported in recordings of blowfly axon terminals (Weckström et al., 1992). (B) Typical voltage responses to hyperpolarizing and depolarizing current pulses indicating a high membrane resistance. Hyperpolarizing responses to negative current approximate a simple RC charging, whereas the depolarizing responses to positive currents are more complex, indicating the activation of voltage-sensitive conductances. (C) The changing mean and variance of the steady-state membrane potential reflects the nonlinear summation of quantum bumps at different light intensity levels. The more intense the adapting background, the higher and less variable the mean membrane potential.
Fig. 3 B shows voltage responses of a dark-adapted photoreceptor to 100-ms-long current pulses (maximum magnitude 0.4 nA). The photoreceptors demonstrate strong, time-dependent, outward rectification, because of the increased activation of voltage-sensitive potassium channels starting approximately at the resting potential (Hardie 1991b). The depolarizing pulses elicit voltage responses with an increasingly square wave profile, with the larger responses to stronger currents peaking and rapidly returning to a steady depolarization level. By contrast, hyperpolarizing pulses evoke slower responses, which resemble passive RC charging. The input resistance appears to vary from 300 to 1,200 MΩ between cells, yielding a mean cell capacitance of 52 ± 18 pF (n = 4).
Voltage Responses to Mean Light Intensities
Fig. 3 C shows 10-s-long traces of the membrane potential recorded in darkness and at different light intensity levels 20 s after stimulus onset. Because of the high membrane impedance (≥300 MΩ), dark-adapted photoreceptors appear relatively noisy. Some of this voltage fluctuation represents instrumental noise due to using high resistance electrodes, but most is photoreceptor noise, possible sources being stochastic channel openings, noise from feedback synapses in the lamina, or spontaneous photoisomerizations. This was concluded because the electrode noise measured in extracellular compartments was much smaller than that of the photoreceptor dark noise. No further attempts were made to identify the dark noise source. Dim light induces a noisy depolarization of a few millivolts because of the summation of irregularly occurring single photon responses (bumps). At higher light intensity levels, the voltage noise variance is much reduced and the mean membrane potential saturates at 25–40 mV above the dark resting potential. The steady-state depolarization at the brightest adapting background, BG0 (∼3 × 10⁶ photons/s), is on average 39 ± 9% (n = 14) of that of the photoreceptor's maximum impulse response in darkness.
Voltage Responses to Dynamic Contrast Sequences
Since a fly's photoreceptors in its natural habitat are exposed to light intensity fluctuations, the signaling efficiency of Drosophila photoreceptors was studied at different adapting backgrounds with repeated presentations of an identical Gaussian light contrast stimulus, here with a mean contrast of 0.32. Although the contrast in natural sceneries is non-Gaussian and skewed, its mean is close to this value (Laughlin 1981; Ruderman and Bialek 1994). Averaging 10–30 voltage responses gives a reliable estimate of the photoreceptor signal for a particular background intensity. The noise in each response is determined by subtracting the average response (the signal) from the individual voltage response.
Fig. 4 shows 1-s-long samples of the 10-s-long contrast stimulus (sampling at 500 Hz, filtering at 250 Hz), photoreceptor voltage signal (Fig. 4 A) and noise (Fig. 4 B) with their corresponding probability distributions (Fig. 4 C) at different adapting backgrounds. The size of the voltage signal measured from its variance (Fig. 4 D; the symbols depict individual photoreceptors) increases (5 ± 1)2 times when the mean light intensity increases 104-fold, before it saturates as does the mean membrane potential (i.e., μ (in millivolts); Fig. 4 E). Concurrently the signal resolution for finer temporal details in the stimulus also improves greatly, seen as the increasing transients in the signal waveform (Fig. 4 A). As the signal content changes, so does its spread. The signal probability distribution (Fig. 4 C, continuous line) is Gaussian under dim light conditions, but slightly skewed to hyperpolarizing values at brighter adapting backgrounds (BG-1 and BG0), suggesting that compressive nonlinearities either in the phototransduction cascade or membrane dynamics affect depolarizing voltage responses (see later IV: Photoreceptor Membrane during Natural-like Stimulation).
Figure 4.
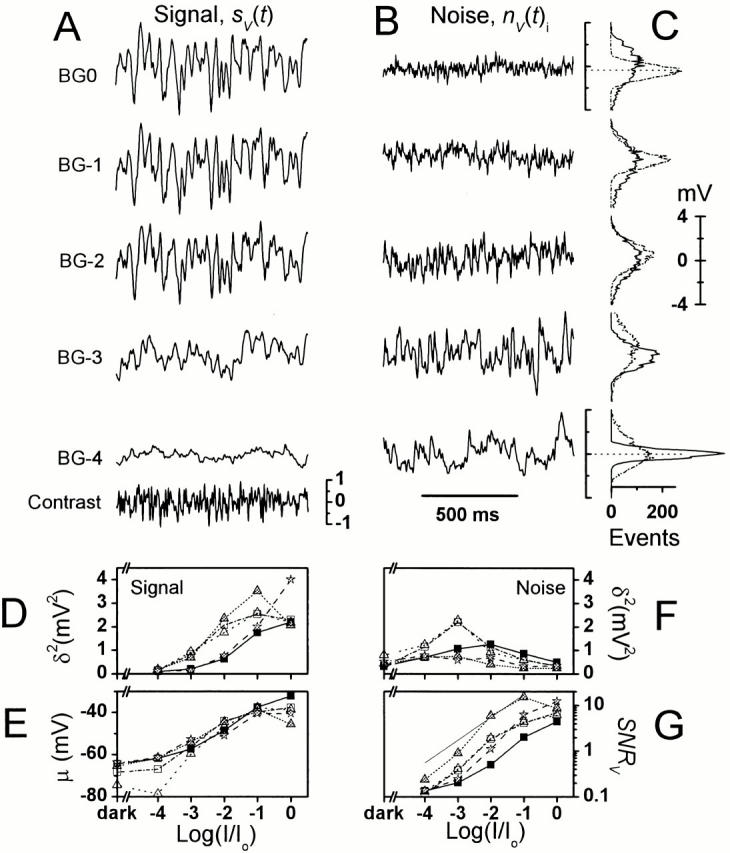
Photoreceptor responses to light contrast modulation at different adapting backgrounds. (A) Waveform of the average response, i.e., the signal, sV(t). (B) A trace of the corresponding voltage noise, nV(t)i. (C) The noise has a Gaussian distribution (dots) at all but the lowest adapting background, whereas the signal distribution (continuous line) changes from Gaussian at low adapting backgrounds to increasingly skewed at higher adapting backgrounds. (D) The average signal variance increases over 15-fold from BG-4 to BG0 and its (E) mean, μ, elevates by 28 mV, whereas (F) the mean noise variance decreases after peaking at BG-3 as the adapting background increases. (G) The changes in the signal and noise variance lead to a continuously improving photoreceptor SNRV as the light background is intensified. The thin line indicates 0.1 of the Poisson limit (Y) for the photoreceptor SNR.
The photoreceptor voltage noise (Fig. 4 B) increases with the mean light intensity until around BG-3 or BG-2, showing some cell to cell variability (Fig. 4 F), initially exceeding the corresponding signal, before rapidly diminishing at bright adapting backgrounds, BG-1 and BG0. The variance and power spectrum of the voltage noise in a single photoreceptor behaves alike whether the cell is stimulated only with a constant light background or with a Gaussian contrast stimulus superimposed on it (Fig. 4 B and Fig. 3 C are from the same cell; the thorough examination of the noise power spectra is shown later in Fig. 8). The probability distribution of the voltage noise is positively skewed (Fig. 4 C, dotted line) under dim light conditions, most likely because of infrequent photon absorption, seen as bursts of responses rising from near dark-adapted potentials, but is Gaussian at brighter backgrounds, where the noise is dominated by small, but numerous bumps (see later Bump Noise Analysis).
Figure 8.

Current injection and contrast stimulation experiments in a single photoreceptor at BG-1, BG-2, and BG-3. The photoreceptor voltage signals to (A) Gaussian current injection and (B) light contrast stimulation, and examples of the corresponding voltage noise traces. Both the contrast and current stimulation lasted 10 s and was repeated 10 times. (C) The signal probability density distributions to the light contrast (black areas) and to the current injection (scattered dots with Gaussian fits) at three different adapting backgrounds relative to the resting potential accordingly indicated by 0 mV. BG-1 depolarizes the photoreceptors ∼20 mV above the resting potential. The photoreceptor responses to the light contrast stimulation are increasingly skewed with increasing light adaptation, but remain Gaussian to a constant current injection. (D) The power spectra of the photoreceptor voltage noise, |〈NV( f )〉|2, at any given light background remains remarkably similar regardless of the Gaussian contrast (superscript c) and the current (superscript I) stimuli modulating the membrane potential. The corresponding photoreceptor dark-noise power spectrum is plotted together with the light-induced noise power at BG-3.
Because the photoreceptor voltage response to the contrast stimulus increases with the adapting light intensity while the noise decreases, the signal-to-noise ratio (Fig. 4 G), SNRV, calculated by dividing the signal variance by the corresponding noise variance, improves in the different investigated photoreceptors between 30 to 90 times with intensifying light adaptation. As previously reported in larger flies (Howard et al. 1987; Anderson and Laughlin 2000) the increase in SNRV is roughly proportional to the square root of intensity, which is consistent with a photon noise-limited Poisson process. However, at the highest intensities the SNRV flattens, presumably because of biological constraints such as the restricted number of transduction units, attenuation by the intracellular pupil (Howard et al. 1987), and the saturating speed of the phototransduction reactions (see also Juusola and Hardie 2000, in this issue).
The Signal and Noise Dynamics in the Frequency Domain
To see how the frequency content of the photoreceptor voltage signal and noise changes during light adaptation, the signal and noise power spectrum, and their derivatives (signal-to-noise ratio and information capacity) were compared at different adapting backgrounds.
Fig. 5 A illustrates the light adaptational changes in the photoreceptor signal power spectrum, |〈SV( f)〉|2. Under dim light conditions, most of the signal power occurs at low frequencies, but brightening the adapting background shifts the power towards high frequencies and attenuates its low frequency end. The shape of the corresponding photoreceptor noise power spectrum, |〈NV( f)〉|2 (Fig. 5 B), is dominated by the frequency domain characteristics of the average bump waveform (the elementary response dynamics are explained later in Bump Noise Analysis), but also includes a small contribution of instrumentation noise and channel noise. At dim light conditions (BG-4), |〈NV(f )〉|2 resembles |〈SV(f )〉|2 but has more power. In brighter conditions, the noise power sinks over the whole signal bandwidth and at bright light intensities (from BG-2 to BG0) is less than the signal power over all frequencies from 1 Hz to the steep roll off. The general signal and noise dynamics during light adaptation closely resemble those reported by Juusola et al. 1994 in Calliphora photoreceptors, but are shifted to a much lower frequency range.
Figure 5.

Photoreceptor response dynamics at different adapting backgrounds. (A) Signal power spectra, |〈SV(f )〉|2, (B) noise power spectra, |〈NV(f )〉||2, and (C) SNRV(f ) calculated via the FFT as explained in materials and methods. (D) The information is log2[1 + SNRV(f )] and (E) the information capacity is the integral of the information over all frequencies (). (F) Bump noise (continuous lines) was isolated by subtracting the photoreceptor noise power spectrum estimated in darkness (the thin line in B) from the ones estimated at different adapting backgrounds, and fitted with single Lorentzians (dotted lines). This gives us the two parameters, n and τ, for calculating the bump shape (G) and the effective bump duration (H) at different mean light intensity levels. The bump event rate (I) is calculated as described in the text (see ). Note how increasing light adaptation compresses the effective bump waveform and rate. The thick line represents the linear rise in the photon output of the light source.
The photoreceptor signal-to-noise ratio spectrum, SNRV(f ), is calculated by dividing the signal power spectrum by the noise power spectrum. The photoreceptor performance improves with increasing mean light intensity, with the bandwidth of high SNRV(f ) (Fig. 5 C) and information, H (Fig. 5 D), progressively shifted towards high frequencies. As light adaptation expands the bandwidth of reliable signaling, the average information capacity increases from ∼30 bits/s at the background of BG-4 to ∼200 bits/s at BG0 (Fig. 5 E). At the brightest adapting background, the average information capacity hence is ∼0.2 times that measured by de Ruyter van Steveninck and Laughlin 1996a at 20–22°C in Calliphora photoreceptors under similar illumination conditions, which is consistent with the suggestion that Drosophila processes visual information more slowly than the fast-flying flies (Skingsley et al. 1995; Weckström and Laughlin 1995).
Bump Noise Analysis
|〈NV(f )〉|2 contains information about the average waveform of discrete voltage events caused by the single photon absorptions, i.e., quantum bumps (compare with Wong and Knight 1980). To reveal how the average bump shape changes with light adaptation, the photoreceptor noise power spectrum at different adapting backgrounds was analyzed as follows.
We assume that the measured voltage noise of light-adapted photoreceptors contains light-induced noise and instrumental as well as intrinsic noise, which are independent and additive. Hence, by subtracting the photoreceptor noise power spectrum estimated in darkness, N V D f 2, from the photoreceptor noise power spectra at different adapting backgrounds, |〈NV( f)〉|2, we can estimate the light-induced voltage noise power, |〈B V ( f)〉|2, at the different mean light intensity levels (Fig. 5 F):
 |
14 |
From this voltage noise power the effective bump duration (T) can be calculated (Dodge et al. 1968; Wong and Knight 1980; Juusola et al. 1994), assuming that the shape of the bump function, bV(t) (Fig. 5 G), is proportional to the Γ-distribution:
 |
15 |
The two parameters n and τ can be obtained by fitting a single Lorentzian to the experimental power spectrum of the bump voltage noise (Fig. 4 F):
 |
16 |
where Γ̃ indicates the Fourier transform. The effective bump duration, T (i.e., the duration of a square pulse with the same power), is then:
 |
17 |
Fig. 5 H shows how light adaptation reduces the bump duration from an average of 50 ms at the adapting background of BG-4 to ∼10 ms at BG0.
The mean bump amplitude (α) and the bump rate (λ) are estimated with a classic technique for extracting rate and amplitude information from a Poisson shot noise process called Campbell's theorem. The bump amplitude is as follows (Wong and Knight 1980):
 |
18 |
Consequently, this means that the amplitude-scaled bump waveform (Fig. 5 G) shrinks dramatically with increasing adapting background. This data is used later to calculate how light adaptation influences the bump latency distribution. The bump rate, λ (Fig. 5 I), is as follows (Wong and Knight 1980):
 |
19 |
In dim light conditions, the estimated effective bump rate is in good agreement with the expected bump rate (extrapolated from the average bump counting at BG-5 and BG-4.5; data not shown), namely 265 bumps/s vs. 300 bumps/s, respectively, at BG-4 (Fig. 5 I). However, the estimated rate falls short of the expected rate at the brightest adapting background (BG0), possibly because of the increased activation of the intracellular pupil mechanism (Franceschini and Kirschfeld 1976), which in larger flies (compare with Lucilia; Howard et al. 1987; Roebroek and Stavenga 1990) limits the maximum intensity of the light flux that enters the photoreceptor.
Frequency Response Analysis
Because the shape of photoreceptor signal power spectra, |〈SV(f )〉|2 (i.e., a frequency domain presentation of the average summation of many simultaneous bumps), differs from that of the corresponding bump noise power spectra, |kBV(f )〉|2 (i.e., a frequency domain presentation of the average single bump), the photoreceptor voltage signal contains additional information that is not present in the minimum phase presentation of the bump waveform, Γ̃Vf (in this model, the bump starts to arise at the moment of the photon capture; Wong et al. 1980). This information, which includes the bump latency distribution and possible dynamic nonlinearities in light adaptation, can be extracted by calculating the photoreceptor frequency response, TV(f ), and coherence, γ2(f ), functions at different mean light intensity levels.
The gain part of the frequency response function, GV(f ) (Fig. 6 A), resembles the corresponding signal power spectrum (Fig. 5 A) at the same adapting background, indicating that the photoreceptor is operating linearly. As the photoreceptor signal shows increased contrast gain and broadened bandwidth with increasing mean light intensity, its 3-dB cut-off frequency (the point at which the gain falls to half of the maximum) shifts towards higher frequencies (Fig. 6 B) saturating on average ∼25 Hz at the brightest adapting background.
Figure 6.
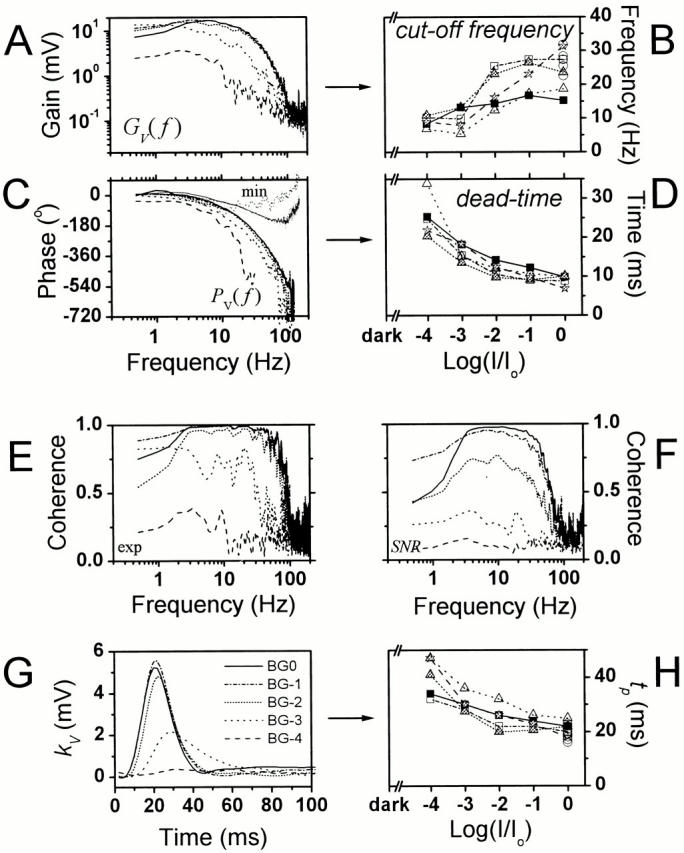
Photoreceptor frequency responses at different adapting backgrounds. (A) According to the increasing gain function, the photoreceptor voltage responses to light contrast modulation increase in size and become faster with light intensity. (B) The acceleration of the voltage response is seen as their cut-off frequency will increase with light adaptation. (C) This is also seen in the phase of the frequency response functions, which indicates that the photoreceptor voltage responses lag the stimulus less at higher mean light intensity levels. Since the minimum phase, Pmin(f ), calculated from the gain part of the frequency response function differs from the measured phase, PV(f ), the Drosophila voltage responses to a light stimulus contain a pure time delay, or dead-time (D). The photoreceptor dead-time reduces with light adaptation from values close to 20 ms at BG-4 to ∼10 ms at BG0. The photoreceptor voltage responses operate linearly as revealed by both (E) the measured, γexp 2 f, and (F) the estimated, γSNR 2 f, coherence functions. (G) The linear impulse response, kV(t), is larger and faster (H; time to peak, tp) at high adapting backgrounds than at low light intensity levels. The data are from the same photoreceptor as in Fig. 4 and Fig. 5. The symbols indicate the same cells as in Fig. 4 and Fig. 5.
The corresponding phase, PV(f ) (Fig. 6 C), shows that the voltage signal lags the stimulus less as the mean light intensity increases. Furthermore, by comparing PV(f ) to the minimum phase, Pmin(f ) (Fig. 6 C), derived from the gain part of the frequency response function, it becomes obvious that the photoreceptor voltage signals contain a pure time delay. This pure time delay, i.e., dead-time (Fig. 6 D), depends on the mean light intensity. It is largest (∼25 ms) at the dimmest adapting background of BG-4 and exponentially reduces to ∼10 ms at BG0. Similar adaptive dead-times have been observed in Calliphora photoreceptors (Juusola et al. 1994; de Ruyter van Steveninck and Laughlin 1996b), but with twice as fast dynamics as in the Drosophila eye.
The coherence function, γexp 2 f (Fig. 6 E), an index of the system's linearity, is close to unity over the frequency range at BG0, indicating that the photoreceptor signals are approximately linear under these conditions. The low coherence values at low mean intensity levels are largely a result of the noisiness of the signal estimates when the rate of photon absorptions is low, since the coherence improves with increased averaging or selecting more sensitive photoreceptors. However, because the photoreceptor signal bandwidth is narrow at low adapting backgrounds, the coherence values are already near zero at relatively low stimulus frequencies. The high degree of linearity at bright illumination, as seen in the coherence, indicates that the skewed distribution of the signals causes a small nonlinear effect on the signal amplification during dynamic stimulation. A similar behavior has been encountered in the blowfly (Calliphora) photoreceptors (Juusola et al. 1994). There, it was later shown that adding a nonlinearity (second-order kernel or static polynomial component) into a dynamic linear photoreceptor model (linear impulse response) causes no real improvement as judged by the mean square error (Juusola et al. 1995).
When a photoreceptor operates as a linear system, one can calculate the coherence function from the SNRV(f ). As shown above (Fig. 4), at low adapting backgrounds, the photoreceptor voltage responses are small and noisy. Accordingly their linear coherence estimates, γSNR 2 f (Fig. 6 F), are significantly lower than the coherence, γexp 2 f (Fig. 6 E), calculated from the signal (i.e., the averaged voltage response). At the brightest adapting backgrounds, the photoreceptor voltage responses are highly reproducible, having significantly reduced noise content. The discrepancy between the two independent coherence estimates is then much less. From such a comparison, one can deduce, for example, that the drop in the low frequency coherence is a consequence of both the significant low frequency noise content and the speed of adaptation (a dynamic nonlinearity), which progressively reduces the gain of the low frequency voltage responses, as the photoreceptor adapts to higher mean light intensity levels.
The linear impulse response, kV(t), defined as the photoreceptor voltage responses to a pulse of unit contrast given at various backgrounds, was calculated from the same data (Fig. 6 G). Its amplitude increases with the mean light intensity, appearing to saturate at the adapting backgrounds above BG-2, whereas its latency and total duration are reduced. The time to peak of the impulse response (tp) is halved from ∼40 ms measured at the lowest mean light intensity to ∼20 ms at the brightest adapting background (Fig. 6 H). Also, the rise time of the impulse response decreases with the increase in the adapting background.
Bump Latency Distribution
Because of the dead-time and the variance in timing of individual bumps, the shape and the time course of the impulse response and the average bump are different. These timing irregularities form the bump latency distribution, which can be estimated accurately from the existing data at different adapting backgrounds (see also Henderson et al. 2000, who describe the bump dynamics in dark-adapted photoreceptors). The adapting bump model (Wong et al. 1980), assuming that the processes are linear, states that convolving the bump waveform, b(t), measured at a certain light intensity level, by its corresponding latency distribution, l(t), produces the photoreceptor impulse response, kV(t):
 |
20 |
where ⊗ denotes convolution. Above, we have calculated the linear impulse responses (Fig. 6 G) and estimated the corresponding bump waveforms (Fig. 5 G) of individual photoreceptors at different adapting backgrounds. Thus, the bump latency distributions can be reconstructed by removing, or deconvolving, the bump waveforms from the impulse responses. To minimize the effects of voltage noise on the recordings, the bump latency distributions were first calculated by using fitted expressions for both the impulse response and bump waveform data. The normalized photoreceptor impulse response, k V;norm(t) is well fitted by a log-normal function, (Payne and Howard 1981):
 |
21 |
where tp is the time to peak of the impulse response, and a is the width factor. Fig. 7 A shows typical log-normal expressions of a photoreceptor impulse response at different adapting backgrounds (fitted to data in Fig. 6 G), whereas Fig. 7 B shows the corresponding normalized ΓV(t)-bump waveforms (; Fig. 5 G) of the same photoreceptor. By deconvolving the latter expressions from the former, we obtain a smooth bump latency distribution estimate for different mean light intensity levels (Fig. 7 C).
Figure 7.

The bump latency distribution stays relatively unchanged at different adapting backgrounds. Removing the bump shape from the corresponding impulse response by deconvolution reveals the bump latency distribution. (A) The log-normal approximations of the photoreceptor impulse responses. (B) The normalized Γ(t) distribution fits of the bump shape; and (C) the corresponding bump latency distributions at different mean light intensity levels. (D) The normalized bump latency distributions (as seen in C). Additionally, these were calculated from the voltage and light recordings as explained in (E) and and (F).
The bump latencies appear to have a rather similar distribution at different adapting backgrounds. This becomes more obvious when the latency distributions are normalized (Fig. 7 D). According to these estimates, apart from the lowest adapting background, where the original photoreceptor data is too noisy to provide accurate results, the first bump starts to appear ∼10 ms after the flash with a peak in the distribution ∼8 ms later. The peak and the width of these latency distribution estimates vary relatively little, suggesting that the general shape of the bump latency distribution was maintained at different adapting backgrounds. Because the fitted expressions could only estimate the true bump and impulse waveforms, these findings were further checked against the latency distributions calculated from the raw data using two different techniques described below.
Fig. 7 E shows normalized bump latency distributions at different adapting backgrounds calculated by first dividing the photoreceptor frequency response, TV(f ), by the corresponding photoreceptor noise spectrum, |〈NV(f )〉|, and taking the inverse Fourier transformation of this product:
 |
22 |
This approximation is justified because the bump noise clearly dominates the photoreceptor noise, as was shown by the noise power spectra in the Fig. 5 B. Furthermore F −1[|B V (f )|] provides a minimum phase representation of bV(t) (Wong and Knight 1980). Here, the shape of the bump latency distribution was free of any systematic error relating to the data fitting, but was influenced by the low level of instrumental noise remaining in the noise spectra. The noisy data at the lowest adapting background did not allow a reasonable estimate of the latency distribution, and this trace was not normalized. Since these estimates closely resemble those of the other methods, any transducer noise and instrumental noise in |〈NV(f )〉| could only have had a marginal effect on the calculations.
Another way to calculate the bump latency distribution is shown in Fig. 7 F. First, the estimated ΓV(t)-bump waveform (Fig. 7 B) was deconvolved from the actual 10–30 nonaveraged traces of the recorded voltage response data, rV(t)i, to produce corresponding timing trails, dV(t)i, of the bump events:
 |
23 |
Then the impulse, l(t), calculated between the corresponding contrast stimulus and the bump timing cross-spectrum, is the bump latency distribution (see and ):
 |
24 |
Once again the bump latency distribution estimates (Fig. 7 F) showed relatively small differences from one light intensity level to another, being in line with the other estimates. Again, the data at the lowest mean light were too noisy for a reasonable estimate.
Photoreceptor Membrane during Natural-like Stimulation
In Drosophila and many other insect photoreceptors, the interplay between the opening and closing of light channels (Trp and Trpl) and voltage-sensitive ion channels (for K+ and Ca2+) shapes the voltage responses to light. The more open channels there are at one moment on a cell membrane, the lower its impedance, the smaller its time constant (i.e., τ = RC) and the faster the signals it can conduct (for review see Weckström and Laughlin 1995). To investigate how the speeding up of the voltage responses with light adaptation is related to the dynamic properties of the membrane, which are also expected to change with light adaptation, we recorded photoreceptor voltage responses to both Gaussian contrast stimulation and current injections at different adapting backgrounds from single cells (Fig. 8).
Fig. 8 A shows 1-s-long samples of the photoreceptor signal, s V I t, and noise, n V I t, traces evoked by repeated presentations of pseudorandomly modulated current stimuli with an SD of 0.1 nA at three different adapting backgrounds. Fig. 8 B shows similar samples of the light-contrast induced signal, s V C t, and noise, n V C t, recorded from the same photoreceptor immediately after the current injection at the same mean light intensity levels. The amplitude of the injected current was adjusted to generate voltage responses that were at least as large as those evoked by light contrast stimulation. This was important because we wanted an unambiguous answer to the question whether the photoreceptor membrane could skew the dynamic voltages to pseudorandom current injection, and thus be responsible for the slight skewness seen in the photoreceptor responses to dynamic light contrast at high mean light intensity levels (Fig. 4 C).
The size of s V I t reduces slightly with increasing light adaptation (Fig. 8 A). The higher adapting background depolarizes the photoreceptor to a higher potential, and, thus, lowers the membrane resistance due to the recruitment of more light- and voltage-dependent channels. Hence, the same current stimulus produces smaller voltage responses. On the other hand, when the mean light intensity is increased, the contrast evoked s V C t increases (Fig. 8 B). This is due to the logarithmic increase in the bump number, although the average size of bumps is reduced. During both the current and light contrast stimulation, n V I t and n V C t were about the same size and behaved very much in the same way, getting smaller with increasing mean light intensity (Fig. 8A and Fig. B).
Fig. 8 C shows typical probability distributions of voltage signals to dynamic contrast stimulation and current injection at the three selected adapting backgrounds. Since the current injection produced signals that had always purely Gaussian distributions (scattered squares fitted with Gaussian; n = 15), the skewness seen in the corresponding light contrast–evoked signals (filled histograms) is unlikely to have originated from voltage-dependent ion channels on the membrane (delayed rectifier and A-type potassium channels; Hardie 1991b), but presumably mirrors some earlier asymmetry in the phototransduction cascade's response to light increments and decrements.
Since the process of driving the photoreceptor voltage with dynamic stimulation may itself add or reduce noise and nonlinearities to the signaling (as reported in spider mechanoreceptors by Juusola and French 1997), we checked the measured photoreceptor voltage noise during dynamic stimulation against that during constant light stimulation. No such discrepancy is found here. The photoreceptor voltage noise power spectra, evoked either by a specified mean light background solely, i.e., |〈NV( f)〉|2; a dynamic light contrast superimposed on the same light background, ≪N V C f≫2; or a pseudorandom current injection at the same light background, ≪N V I f≫2, are remarkably similar (Fig. 8 D). Since the shape of the noise power spectra changes with the increasing mean light intensity (Fig. 5 B), this indicates that the photoreceptor voltage noise is dominated by the bump noise.
Light Adaptation Accelerates the Dynamics of Both Light Responses and Photoreceptor Membrane
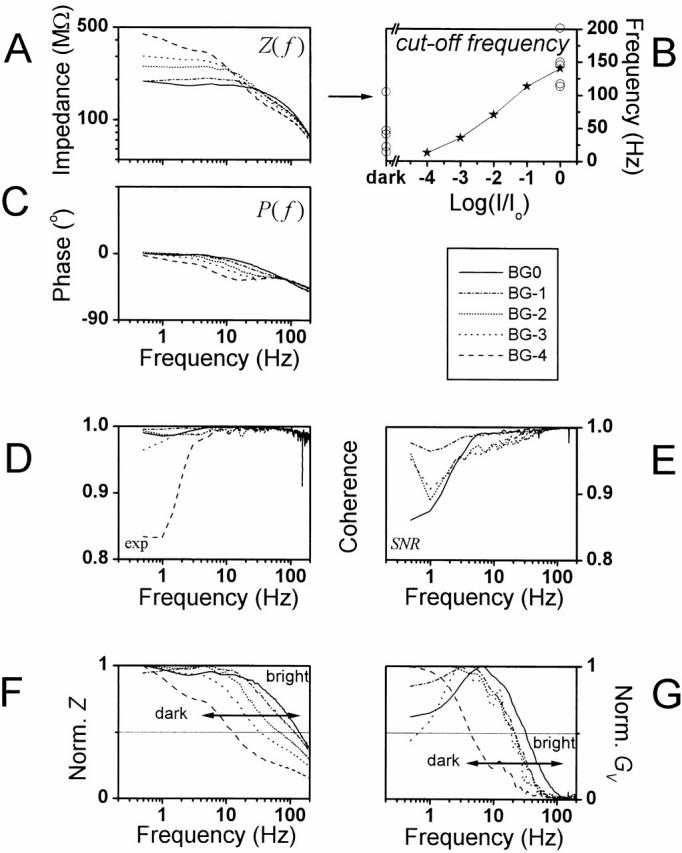
To establish how the signal conduction properties of the photoreceptor membrane compare to the speed of the light contrast–evoked voltage responses, the membrane impedance, Z(f ), and the corresponding light frequency response, TV(f ), were calculated at different adapting backgrounds from the previous data. The photoreceptor membrane impedance function (Fig. 9 A) is reduced at brighter backgrounds, covers a broader frequency band, and lags the stimulus slightly less (Fig. 9 C) than at dim illumination. This is of course due to the increasing depolarization, or rather the increased number of open light- and voltage-sensitive ion channels, lowering both the membrane resistance and its time constant, thus, allowing faster signaling. This is further illustrated in Fig. 9 B, which shows how the 3-dB cut-off frequency of the photoreceptor membrane impedance increases with the mean light intensity. In darkness, the mean cut-off frequency of the membrane is 45 ± 36 Hz (n = 5) and shifts to 145 ± 32 Hz (n = 6) at 3 × 10⁶ photons/s.
Figure 9.
The photoreceptor membrane characteristics at different light adaptation levels. The photoreceptor impedance, Z(f ), calculated from the current injection and the resulting voltage responses, is reduced (A, gain), it is accelerated (B, 3-dB cut-off frequency) and it lags the stimulus less (C, phase) when it is shifted towards higher frequencies with increasing light adaptation. Regardless of the adapting background the membrane operates linearly over the studied frequency range (in D,γexp 2 f and in E,γSNR 2 f; coherence close to unity). Both the normalized impedance (F) and the gain of the contrast-induced voltage responses (i.e., light response), (G) demonstrate a gradual shift of their bandwidth towards high frequencies. The cut-off frequency of the impedance is always much higher than that of the light responses in the same photoreceptor at the same adapting background; in this particular photoreceptor, 3.1, 1.9, 3.2, 5.1, and 4.2 times higher, when going from BG-4 to BG0.
The photoreceptor membrane operates linearly when converting the Gaussian current modulation into voltage responses. The membrane coherence function, calculated between the current stimulus and the corresponding voltage signal (Fig. 9 D), approaches unity (from 0.84 to 0.9999), being lowest at frequencies below 5 Hz. On the other hand, the coherence estimates, which are calculated from the photoreceptor membrane signal-to-noise ratios (Fig. 9 E; see also Fig. 2 B, g), are affected by the corresponding photon noise of each particular adapting background, but still maintain values close to unity indicating highly linear operation.
Fig. 9 (F and G) compares the gain parts of the light contrast– and current injection–induced photoreceptor frequency responses measured at different mean light intensities. The traces are normalized to show how the increased light adaptation speeds up the response dynamics. Light adaptation accelerates the dynamics of both the light responses and membrane impedance, as seen by their expanding frequency ranges. However, the bandwidth of the photoreceptor membrane always extends further than that of the corresponding light response. This suggests that during normal diurnal light conditions, the speed of the chemical reactions in the phototransduction cascade is not limited by the electrical properties of the light-adapted photoreceptor membrane. To demonstrate this more directly, we attempted to derive the light-induced current by deconvolving the effect of the membrane impedance.
Adaptive Filtering by Phototransduction Cascade and Membrane Improves Signaling
Because light-adapted photoreceptors respond to both dynamic contrast and current stimulation with linear voltage responses, we can derive the output of the phototransduction cascade, i.e., the light current by deconvolving the membrane impedance impulse response, z(t) (Fig. 2 C, d), from photoreceptor voltage responses, rV(t)i, to light contrast stimulation, measured in the same cell at the same mean light:
 |
25 |
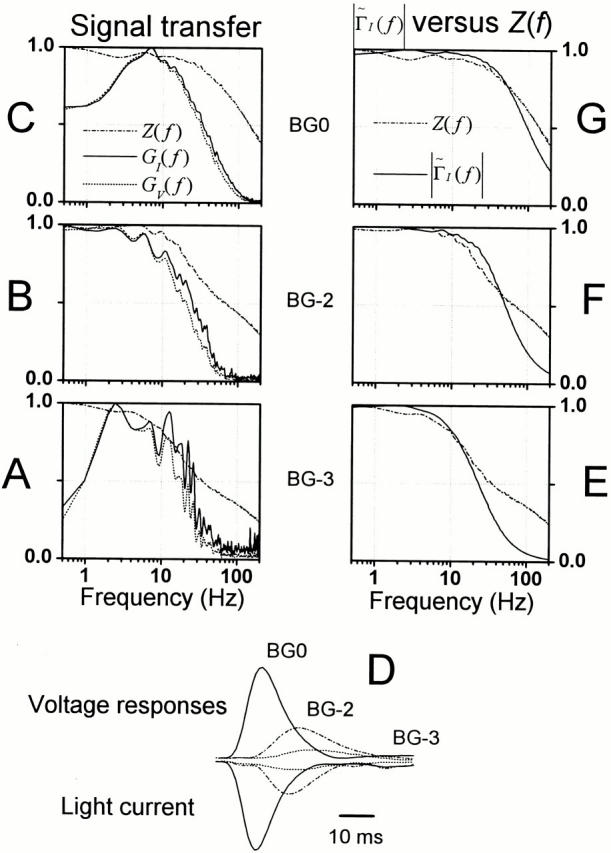
The light current frequency response, TI(f ), is then calculated between the contrast stimulus, c(t), and the current signal, sI(t) (i.e., the mean 〈rI(t)i〉). Fig. 10 (A–C) shows the normalized gain parts of the photoreceptor impedance (Z(f )), light-current (GI(f )), and voltage response (GV(f )) frequency responses at three different mean light intensities. The high impedance photoreceptor membrane acts as a low-pass filter for the phototransduction signal, effectively filtering the high frequency content of the light current, which might also include high frequency ion channel noise. This inevitably makes the voltage response slightly slower than the corresponding light current. The membrane dynamics speeds progressively when the mean light increases, so that its cut-off frequency is always much higher than that of the light current, and only under the dimmest (Fig. 10 A) conditions does the membrane significantly limit the frequency response of the voltage signal. Furthermore, the high mean impedance in dim light conditions causes small changes in the light current to charge relatively larger voltage responses than those under brighter conditions as seen in the corresponding voltage, kV(t), and light current, kI(t), impulse responses (Fig. 10 D).
Figure 10.
General comparison of the transduction signal and noise and membrane bandwidth at different adapting backgrounds. (A–C) The dynamics of the corresponding light current, voltage response, and membrane impedance displayed as their normalized gain. (A) Under dim conditions, the light current is noisy and the low passing membrane removes the high frequency noise, producing slow voltage responses to light contrasts. When the mean light intensity is increased, both the transduction cascade and photoreceptor membrane allows faster signaling leading to accelerated voltage responses (B and C). The corresponding impulse responses (D), calculated from the same data, show how the light current and voltage responses quicken with increasing mean light intensity, but the light current is always peaking before its respective voltage response. Because of the large membrane impedance under dim conditions, the small light currents can charge relatively large voltage responses. The responses are normalized by the maximum value of each series. (E–G) The transduction bump noise, ΓI˜f, was calculated by deconvolving the photoreceptor membrane impedance, Z(f ), from the respective voltage bump noise, ΓV˜f. From dim light conditions (E and F) to the bright adapting backgrounds (G) ΓI˜f shows a considerable overlap with the corresponding membrane impedance.
To establish how effectively the photoreceptor membrane filters the transduction noise, we calculated the phototransduction bump noise by removing (deconvolving) the photoreceptor impedance, Z(f ) from the Γ-distribution estimate of the normalized bump voltage noise spectrum, |ΓV(f )|, measured at the same mean light intensity level:
 |
26 |
Fig. 10 (E–G) compares the normalized photoreceptor impedance to the corresponding normalized spectra of the phototransduction bump noise, Γ̃I f, which now presents the minimum phase shape of the elementary transduction event, i.e., light-current bump, at three different adapting backgrounds. Although the membrane impedance's cut-off frequency is much higher than the corresponding light current signal, GI(f ), at all light intensity levels, the corresponding phototransduction bump noise spectrum, Γ̃I f, and membrane impedance, Z(f ), show considerable overlap. These findings indicated that the transfer characteristics of the photoreceptor membrane serve a dual function. By tuning to the mean light intensity levels, the photoreceptor membrane provides a fast conduction path to the phototransduction signal and concurrently; and improves the reproducibility of the photoreceptor voltage responses by removing the high frequency noise in the light current, associated with the shortening of the bump duration (compare with Fig. 5 H).
DISCUSSION
The results presented here characterize the light adaptation dynamics of Drosophila photoreceptors in unprecedented detail. The experiments, in which photoreceptor voltage was modulated with dynamic contrast and current stimuli at various mean light intensity levels, allowed us to quantify the increase in signaling efficiency with light adaptation and demonstrate that it is the product of the following three factors: (1) bump compression of several orders of magnitude; (2) fast but relatively constant bump timing; and (3) accelerated membrane dynamics. In the following discussion, we attempt to relate these findings to the current ideas of the Drosophila phototransduction and then go on to consider their functional significance in terms of coding strategies.
Phototransduction in Drosophila occurs through a phospholipase C–mediated and Ca2+-regulated reaction cascade, where light-activated rhodopsin leads to sequential activation of a heterotrimeric G-protein and eye-specific PLC. This hydrolyzes the minor membrane phospholipid, PtdIns(4,5)P2 to generate InsP3 and diacylglycerol (DAG) leading finally to the opening of the light-sensitive channels. Although a large number of fly phototransduction mutants have been identified and analyzed, much of the molecular interactions inside the pathway are incompletely understood. In particular, events linking activation of PLC to the opening of the light-sensitive channels still remain enigmatic: recent evidence suggests that InsP3 is not involved (Acharya et al. 1997; Hardie and Raghu 1998; Raghu et al. 2000), suggesting that PtdIns(4,5)P2, DAG, or its metabolites may be the key messenger(s) of excitation (Chyb et al. 1999; Raghu et al. 2000). However, there is general consensus that events determining the response latency occur largely at or upstream of PLC, whereas events determining bump shape and amplitude are generated downstream of PLC. This is because hypomorphic mutations of PLC and G-protein affect quantum bump latency but not bump shape (Pak et al. 1976; Scott et al. 1995; Scott and Zuker 1998). Recently, it has been demonstrated that many proteins central to the phototransduction cascade are coupled into a supramolecular signaling complex, through association with the PDZ-domain scaffold protein, INAD, including PLC and at least one of the two types of light-sensitive channel, (Trp) (Shieh and Zhu 1996; Huber et al. 1996; Tsunoda et al. 1997; Scott and Zuker 1998; Montell 1999). It has been speculated that this may minimize diffusional delays involved in excitation (Scott and Zuker 1998; Montell 1999), though experimental verification of this proposal is lacking.
Light Adaptation Affects the Bump Waveform but Has a Relatively Small Influence on Bump Timing
It is widely accepted that the steady-state photoreceptor potential represents a summation of single photon–evoked elementary voltage responses, i.e., quantum bumps. In line with previous formulations (compare with Wong and Knight 1980) we applied shot noise analysis to reconstruct the bump event rate, effective duration and mean amplitude from the photoreceptor voltage noise at different adapting backgrounds. In agreement with the earlier Drosophila studies (Wu and Pak 1978) we found that the average size of the bumps decreases markedly and their time course becomes briefer as the mean light is increased. Since bump rate rose linearly with intensity up to intensities of BG-2 or -1, this means that, in keeping with other preparations, the reduction in bump amplitude and duration is the major process underlying the reduction in the absolute gain associated with adaptation, which is therefore presumably mediated downstream of PLC. The overall bump amplitude, estimated via noise analysis in combination with Campbell's theorem, decreases ∼50–100-fold over the measured range of intensities, which does not include the fully dark-adapted state. An ∼3-fold reduction can be directly attributed to ohmic behavior because of the decreased membrane resistance and electromotive driving force as the membrane depolarized but, after taking these factors into account, the estimated reduction in light current is still ∼15–30-fold. This presumably represents a reduction in the number of channels contributing to a bump and/or their open probability. However, since only ∼15 channels are believed to be open at the peak of the fully dark-adapted bump (Henderson et al. 2000), a decrease in the single-channel conductance may also be required to account for the overall reduction. Indeed, a mechanism for this has been suggested previously, namely a voltage-dependent block by extracellular Mg2+ ions, which intensifies over this range of voltages (Hardie and Mojet 1995).
According to the adapting bump model (Wong et al. 1980), the photoreceptor response is predicted by the convolution of the average bump waveform with the bump latency distribution. A novel feature of our analysis was the derivation of the bump latency distribution over the full range of adapting intensities, by deconvolving the bump dynamics from the signal. As described in the results, we performed this analysis using three semi-independent methods, all of which confirmed that the latency distribution was relatively constant at different mean light intensity levels, with at most an ∼5-ms shift in the peak of the distribution and an ∼10-ms shift in the absolute latency (Fig. 7). The bump latency distribution also includes the photoreceptor dead-time, i.e., the time from a light impulse to the appearance of the voltage response. This was derived independently from the phase plots and was again found to show only a modest, approximately twofold reduction (from 20 to 10 ms) over the 104 range of background intensities. As has been pointed out previously (French 1980), the long latency cannot arise from a simple diffusional process of some second messenger, and is independent of the conductance changes leading to the voltage response. The fact that a highly adaptive bump shape coincides with the relative invariability in the corresponding latency distribution reinforces the concept that they represent two independent processes in the phototransduction machinery.
Role of Ca2+ as Messenger of Adaptation
Numerous studies have shown that calcium is the major mediator of adaptation in invertebrate and vertebrate photoreceptors (for reviews see Hardie and Minke 1995; Montell 1999; Pugh et al. 1999). It is the obvious candidate for regulating bump shape and size as well as the modest changes in latency. Indeed, a recent study showed that Drosophila bump waveform and latency were both profoundly, but independently, modulated by changing extracellular Ca2+ (Henderson et al. 2000). In Drosophila, the vast majority, if not all, of the light-induced Ca2+ rise is due to influx through the highly Ca2+ permeable light-sensitive channels (Peretz et al. 1994; Ranganathan et al. 1994; Hardie 1996; but see Cook and Minke 1999). Recently, Oberwinkler and Stavenga 1999(2000) estimated that the calcium transients inside microvilli of blowfly photoreceptors reached values in excess of 100 μM, which then rapidly (<100 ms) declined to a lower steady state, probably in the 10–50-μM range; similar steady-state values have been measured in Drosophila photoreceptor cell bodies after intense illumination (Hardie 1996). Hardie 1991a; Hardie 1995a demonstrated that Ca2+ mediated a positive, facilitatory Ca2+ feedback on the light current, followed by a negative feedback, which reduced the calcium influx through light-sensitive channels. Stieve and co-workers (1986) proposed that in Limulus photoreceptors, a similar type of Ca2+-dependent cooperativity at light-sensitive channels is responsible for the high early gain. Caged Ca2+ experiments in Drosophila have demonstrated that the positive and negative feedback effects both take place on a millisecond time scale, suggesting that they may be mediated by direct interactions with the channels (Hardie 1995b), possibly via Ca2+-calmodulin, CaM, as both Trp and Trpl channel proteins contain consensus CaM binding motifs (Phillips et al. 1992; Chevesich et al. 1997). Another potential mechanism includes phosphorylation of the channel protein(s) by Ca2+-dependent protein kinase C (Huber et al. 1996) since null PKC mutants show defects in bump termination and are unable to light adapt in the normal manner (Ranganathan et al. 1991; Smith et al. 1991; Hardie et al. 1993). However, until the identity of the final messenger of excitation is known, it would be premature to conclude that these are the only, or even major, mechanisms by which Ca2+ affects the light-sensitive conductance.
The Photoreceptor Membrane Does Not Limit the Speed of the Phototransduction Cascade
To characterize how the dynamic membrane properties were adjusted to cope with the light adaptational changes in signal and noise, we deconvolved the membrane from the contrast-induced voltage signal and noise data to reveal the corresponding phototransduction currents. This allowed us to compare directly the spectral properties of the light current signal and noise to the corresponding membrane impedance. At all adapting backgrounds, we found that the cut-off frequency of the photoreceptor membrane greatly exceeds that of the light current signal. Therefore, the speed of the phototransduction reactions, and not the membrane time constant, limits the speed of the resulting voltage responses. By contrast, we found a close spectral overlap between the high frequency roll-off of the light current noise and the membrane impedance at all the tested light intensity levels. Overall, these results suggest that the increase in the signaling bandwidth of the photoreceptor membrane with the mean light intensity functions to accommodate any acceleration in the phototransduction kinetics while simultaneously filtering the increasing high frequency phototransduction noise. Suppression of photon shot noise by membrane filtering also has been reported in photoreceptors of the crane fly Tipula (Laughlin 1996); however, the strategy there appeared rather different since the membrane in Tipula also significantly limits the frequency range of the light current signal.
These adaptive membrane dynamics result from the dynamic interaction between a variety of light- and voltage-sensitive ion channels. As previously described, Drosophila photoreceptors express at least three different voltage-sensitive potassium channels (slow delayed rectifier conductance [IKs], fast transient A-current [IA], and a delayed rectifier with intermediate kinetics [IKf]), each with different activation and inactivation kinetics (Hevers and Hardie 1995). In addition, two classes of light-sensitive channels (Trp and Trpl), each with a characteristic voltage dependence, contribute to the overall light-induced lowering of the membrane impedance. Specific channel mutants will have the potential to analyze the functional roles of such individual channel species in detail.
The idea of matching the dynamic membrane properties by voltage-sensitive ion channels to natural signal conditions is not new and has been explored in both fast and slow flying insects (Laughlin and Weckström 1993; Weckström and Laughlin 1995; Laughlin 1996). However, our study was unique in the sense that we could derive an accurate representation of the transduction current dynamics and correlate these with the membrane dynamics in the same photoreceptor. The data are also the first to show that the skewness of the photoreceptor voltage responses to Gaussian contrast stimulation at bright adapting backgrounds is not caused by the voltage-sensitive membrane, but reflects either the opening dynamics of the light-sensitive channels or some compressive nonlinearity early in the phototransduction cascade. As the skewness of the responses mirrors the skewness of the contrast distribution in natural scenery (Laughlin 1981), it should be beneficial to implement this feature in the early transduction rather than in later signal shaping to keep the coding machinery as energetically efficient as possible.
The Photoreceptor Signaling Works Competently within the Imposed Physical Limits
The photoreceptor responses are a product of individual bump waveforms and their timing, i.e., the bump latency distribution. In near darkness and in dim light conditions, photoreceptors are adapted to processing signals of low signal-to-noise ratio, where the sparse and random arrival of photons restricts the signal fidelity. The enzymatic reactions transduce and amplify the single photon absorptions into voltage fluctuations, which vary in their size and timing, but can be separated reliably as discrete events. As pointed out by many (see van Hateren 1992), the general coding task here appears to be to detect and count the photons rather than to characterize the light stimulus. Applying the classical Shannon expression (), we can make approximate calculations of the information content of the light stimulus at certain intensity levels knowing that the light itself is a Poisson process having a defined SNR Υ=Y at all stimulus frequencies, and limiting the bandwidth to cover the photoreceptor's operational range (see ). This allows us to compare the photoreceptor's information capacity estimates at a certain mean light intensity (Y) to the theoretical maximum over the bandwidth of the photoreceptor's operation:
 |
27 |
where sV and nV are photoreceptor voltage signal and noise variance over the bandwidth, W (Shannon 1948). Or similarly for the light stimulus:
 |
28 |
Because the adapting background of BG-4 contained ∼300 photons/s, we have log2300+1=4.2 bits distributed over the photoreceptor signal bandwidth, say 70 Hz (Fig. 5 A). The information content is 294 bits/s, indicating that every counted photon carries a bit. However, with light adaptation, the photoreceptor is shifting from counting photons to integrating them into a neural image. The irregular arrival of photons makes the neural integration noisy, and the estimated photoreceptor information capacity from the average photoreceptor SNRV of 0.152 (Fig. 4 G) gives 14 bits/s. This is close to the photoreceptor information capacity calculated between the signal and noise power spectra at the same adapting background (Fig. 5 E, which varied from 15 to 34 bits/s). Whereas at the bright adapting background of BG0, the estimated LED output was 3 × 10⁶ photons/s. Yet, the photoreceptors could only detect a tenth of them (possibly because of the activated pupil mechanism; Fig. 5 I). This gives the information content for BG0:
 |
Again, from the corresponding mean photoreceptor SNRV of 7.7, we have log2[8.7] · 70 = 218 bits/s, close to the measured average of 216 bits/s (Fig. 5 E). This simple comparison between the information content of the light stimulus and the corresponding information capacity of the Drosophila photoreceptors suggests that the efficiency to code light information into a neural signal increases with the adapting background: from 5% under dim conditions to 17% during bright illumination.
Because imprecision either in the bump timing or summation can smear the voltage responses, any variability in one of these processes reduces the photoreceptor information capacity. It appears that, at low mean light intensity levels, the variability of the signal mostly reflects changes in the bump shape. On the other hand, when the physical limitations imposed by low numbers of photons vanish at brighter adapting backgrounds, the visual coding strategy changes accordingly. When the number of bumps is very large and the bumps themselves very small, the speed of synchronizing a large population of bumps becomes precision limiting. Although the bump shape can in principle be reduced to some extent by intensifying the mean light intensity level, the speed limit imposed by the dead-time in phototransduction prevents the signal bandwidth to grow accordingly. This restricts the time course of the voltage responses and starts to cause saturation of the photoreceptor information capacity at high light intensities.
What is the maximum number of photons that can be processed during intense light adaptation at 25°C? Following Hamdorf 1979, Howard et al. 1987, and Hochstrate and Hamdorf 1990, we assume that each microvillus is a transduction unit, and that a second photon being absorbed by a single microvillus within the dead-time cannot be detected. Either it will have no effect or, at best, it may shorten the latency of the bump as suggested to occur in Calliphora by Hamdorf and Kirschfeld 1980. The measured 10-ms dead-time would, therefore, restrict the bump rate to ∼100 events/s/microvillus. From anatomical measurements of microvilli, we estimate that each rhabdomere has ∼30,000 microvilli. This would mean that the phototransduction machinery saturate at levels of 3 × 10⁶ absorbed photons/s (as suggested by recordings in the Drosophila mutants that lack the screening pigment; Juusola, M., and R.C. Hardie, manuscript in preparation). Here, the maximum rate of photon absorption appeared to saturate ∼0.1–0.2 of this theoretical maximum, at 3–5 × 10⁵ photons/s. However, this is almost certainly because of the activation of the intracellular pupil mechanism, which limits the amount of light that is absorbed by the visual pigment. Furthermore, the photoreceptors were clearly not truly saturated in that a natural contrast modulation of 0.32 around this mean photon absorption rate was still translated into unattenuated contrast responses that had a mean information capacity of 216 ± 61 bits/s (n = 14). The information capacity varied somewhat from one photoreceptor to another and was ∼0.2–1/3 of the maximum information transfer rate measured under similar illumination in blowflies (Calliphora vicina; de Ruyter van Steveninck and Laughlin 1996a; Juusola et al. 1996), which have approximately three times more microvilli in their rhabdomere (Hardie 1985).
Comparison of bump waveform and latency distribution clearly indicates that the latter is the main determinant of the shape of the light-adapted impulse response and, consequently, represents the major constraint on the overall frequency response of the photoreceptor signal. By contrast, the bump duration reaches values of <10 ms. This generates high frequencies, which are negligibly represented in the signal power spectra, thereby allowing the associated stochastic noise to be filtered by the membrane impedance without a significant loss of information. Our current understanding of phototransduction suggests that bump latency is determined by events up to and including activation of PLC and may, for example, represent the time required for the accumulation of a significant amount of second messenger to reach the threshold for channel activation. It is interesting to speculate whether the broad latency distribution is an unavoidable constraint of the stochastic behavior of the underlying biochemical machinery or whether in fact it is designed to provide the photoreceptor with a particular frequency response optimized to its visual ecology and metabolic demands (van Hateren 1992; Laughlin et al. 1998). Certainly, faster flying flies such as Calliphora have evolved significantly faster response kinetics; however, this comes with a price; namely lower membrane impedance and, consequently, greater energetic costs in restoring the ionic equilibria (Laughlin et al. 1998). What factors determine the variability in bump latencies are unknown. However, the relatively long and finite dead-time and skewed Gaussian shape of the latency dispersion exclude a simple first-order stochastic model, which would be expected to generate an exponential distribution of latencies. It is also not known, for example, whether the latency dispersion derives from different microvilli having different characteristic latencies or whether a given microvillus would generate quantum bumps with variable latencies to successive photons. Interestingly, the bump amplitude, which also shows stochastic variations, appears to be much more reproducible than the bump intervals in trains of bumps recorded after activation of one rhodopsin in a single microvillus (Scott and Zuker 1998).
Acknowledgments
We thank Doekele Stavenga and Hugh Robinson for critical reading of the manuscript and Gonzalo Garcia de Polavieja for discussions. Special thanks to Mick Swann and Chris Askham for taking part in designing and building up the new set-up.
This work was supported by grants from The Royal Society, Wellcome Trust, Academy of Finland, and Oskar Öfflund Foundation (to M. Juusola), and the Biotechnology and Biological Sciences Research Council (to R.C. Hardie).
References
- Acharya J.K., Jalink K., Hardy R.W., Hartenstein V., Zuker C.S. InsP(3) receptor is essential for growth and differentiation but not for vision in Drosophila . Neuron. 1997;18:881–887. doi: 10.1016/s0896-6273(00)80328-1. [DOI] [PubMed] [Google Scholar]
- Anderson J., Laughlin S.B. Photoreceptor performance and the co-ordination of achromatic and chromatic inputs in the fly visual system. Vision Res. 2000;40:13–31. doi: 10.1016/s0042-6989(99)00171-6. [DOI] [PubMed] [Google Scholar]
- Bendat J.S., Piersol A.G. Random dataanalysis and measurement procedures 1971. John Wiley & Sons, Inc; New York: pp. 566 pp [Google Scholar]
- Bracewell R.N. The Fourier transform and its applications 2000. McGraw-Hill; New York: pp. 616 pp [Google Scholar]
- Chevesich J., Kreuz A., Montell C. Requirement for the PDZ domain protein, INAD, for localization of the TRP store operated channel to a signaling complex. Neuron. 1997;18:95–105. doi: 10.1016/s0896-6273(01)80049-0. [DOI] [PubMed] [Google Scholar]
- Chyb S., Raghu P., Hardie R.C. Polyunsaturated fatty acids activate the Drosophila light-sensitive channels TRP and TRPL. Nature. 1999;397:255–259. doi: 10.1038/16703. [DOI] [PubMed] [Google Scholar]
- Cook B., Minke B. TRP and calcium stores in Drosophila phototransduction. Cell Calcium. 1999;25:161–171. doi: 10.1054/ceca.1998.0018. [DOI] [PubMed] [Google Scholar]
- de Ruyter van Steveninck R.R., Laughlin S.B. The rate of information transfer in graded-potential neurons and chemical synapses Nature. 379 1996. 642 645a [Google Scholar]
- de Ruyter van Steveninck R.R., Laughlin S.B. Light adaptation and reliability in blowfly photoreceptors Int. J. Neural Sys 7 1996. 437 444b [DOI] [PubMed] [Google Scholar]
- Dodge F.A., Knight B.W., Toyoda J. Voltage noise in Limulus visual cells. Science. 1968;160:88–90. doi: 10.1126/science.160.3823.88. [DOI] [PubMed] [Google Scholar]
- Franceschini N., Kirschfeld K. Le contrôle automatique du flux lumineux dans l'oeil composé des Diptères. Biol. Cybernetics. 1976;21:181–203. [Google Scholar]
- French A.S. Phototransduction in the fly compound eye exhibits temporal resonances and a pure time delay. Nature. 1980;283:200–202. doi: 10.1038/283200a0. [DOI] [PubMed] [Google Scholar]
- Haag J., Borst A. Encoding of visual motion information and reliability in spiking and graded potential neurons. J. Neurosci. 1997;17:4809–4819. doi: 10.1523/JNEUROSCI.17-12-04809.1997. [DOI] [PMC free article] [PubMed] [Google Scholar]
- Hamdorf K. The physiology of invertebrate visual pigments. In: Autrum H., editor. Handbook of Sensory Physiology. Vol. VII/6A. Springer-Verlag; Berlin: 1979. pp. 145–224. [Google Scholar]
- Hamdorf K., Kirschfeld K. “Prebumps”evidence for double hits at functional subunits in a rhabdomeric photoreceptor. Z. Naturforsch. 1980;35:173–174. [Google Scholar]
- Hardie R.C. Functional organisation of the fly retina. Progr. Sens. Physiol. 1985;5:1–79. [Google Scholar]
- Hardie R.C. Whole cell recordings of the light induced current in dissociated Drosophila photoreceptorsevidence for feedback by calcium permeating the light-sensitive channels Proc. R. Soc. Lond. B 245 1991. 203 210a [Google Scholar]
- Hardie R.C. Voltage-sensitive potassium channels in Drosophila photoreceptors J. Neurosci. 10 1991. 3079 3095b [DOI] [PMC free article] [PubMed] [Google Scholar]
- Hardie R.C. Photolysis of caged Ca2+ facilitates and inactivates but does not directly excite light-sensitive channels in Drosophila photoreceptors J. Neurosci. 15 1995. 889 902a [DOI] [PMC free article] [PubMed] [Google Scholar]
- Hardie R.C. Effects of intracellular Ca2+ chelation on the light response in Drosophila photoreceptors J. Comp. Physiol. A. 177 1995. 707 721b [DOI] [PubMed] [Google Scholar]
- Hardie R.C. INDO-1 measurements of absolute resting and light-induced Ca2+ concentration in Drosophila photoreceptors. J. Neurosci. 1996;16:2924–2933. doi: 10.1523/JNEUROSCI.16-09-02924.1996. [DOI] [PMC free article] [PubMed] [Google Scholar]
- Hardie R.C., Minke B. Phosphoinositide-mediated phototransduction in Drosophila photoreceptorsthe role of Ca2+ and Trp. Cell Calcium. 1995;18:256–274. doi: 10.1016/0143-4160(95)90023-3. [DOI] [PubMed] [Google Scholar]
- Hardie R.C., Mojet M.H. Magnesium-dependent block of the light-activated and Trp-dependent conductance in Drosophila photoreceptors. J. Neurophysiol. 1995;74:2590–2599. doi: 10.1152/jn.1995.74.6.2590. [DOI] [PubMed] [Google Scholar]
- Hardie R.C., Raghu P. Activation of heterologously expressed Drosophila TRPL channels. Ca2+ is not required and InsP3 is not sufficient. Cell Calcium. 1998;24:153–163. doi: 10.1016/s0143-4160(98)90125-7. [DOI] [PubMed] [Google Scholar]
- Hardie R.C., Peretz A., Suss-Toby E., Rom-Glas E.A., Bishop S.A., Selinger Z., Minke B. Protein-kinase-C is required for light adaptation in Drosophila photoreceptors. Nature. 1993;363:634–637. doi: 10.1038/363634a0. [DOI] [PubMed] [Google Scholar]
- Harris F.J. On the use of the windows for harmonic analysis with the discrete Fourier transform. Proceedings of Institute of Electrical and Electronic Engineers. 1978;66:51–84. [Google Scholar]
- Henderson S.R., Reuss H., Hardie R.C. Single photon responses in Drosophila photoreceptors and their regulation by Ca2+ . J. Physiol. 2000;524:179–194. doi: 10.1111/j.1469-7793.2000.00179.x. [DOI] [PMC free article] [PubMed] [Google Scholar]
- Hevers W., Hardie R.C. Serotonin modulates the voltage dependence of delayed rectifier and Shaker potassium channels in Drosophila photoreceptors. Neuron. 1995;14:845–856. doi: 10.1016/0896-6273(95)90228-7. [DOI] [PubMed] [Google Scholar]
- Hochstrate R., Hamdorf K. Microvillar components of light adaptation in blowflies. J. Gen. Physiol. 1990;95:891–910. doi: 10.1085/jgp.95.5.891. [DOI] [PMC free article] [PubMed] [Google Scholar]
- Howard J., Blakeslee B., Laughlin S.B. The intracellular pupil mechanism and the maintenance of photoreceptor signal to noise ratios in the blowfly Lucilia cuprina . Proc. R. Soc. Lond. B. 1987;23:415–435. doi: 10.1098/rspb.1987.0053. [DOI] [PubMed] [Google Scholar]
- Huber A., Sander P., Gobert A., Bähner M., Hermann R., Paulsen R. The transient receptor potential protein (Trp), a putative store-operated Ca2+ channel essential for phosphoinositide-mediated photoreception, for a signalling complex with NorpA, InaC and InaD. EMBO (Eur. Mol. Biol. Organ.) J. 1996;15:7036–7045. [PMC free article] [PubMed] [Google Scholar]
- Johnson E.C., Pak W.L. Electrophysiological study of Drosophila rhodopsin mutants. J. Gen. Physiol. 1986;88:651–673. doi: 10.1085/jgp.88.5.651. [DOI] [PMC free article] [PubMed] [Google Scholar]
- Juusola M. Measuring complex admittance and receptor current by single electrode voltage-clamp. J. Neurosci. Methods. 1994;53:1–6. doi: 10.1016/0165-0270(94)90137-6. [DOI] [PubMed] [Google Scholar]
- Juusola M., French A.S. The efficiency of sensory information coding by mechanoreceptor neurons. Neuron. 1997;18:959–968. doi: 10.1016/s0896-6273(00)80335-9. [DOI] [PubMed] [Google Scholar]
- Juusola, M., and R.C. Hardie. 2000. Light adaptation in Drosophila photoreceptors: II. Rising temperature increases the bandwidth of reliable signaling. J. Gen. Physiol. 27–41. [DOI] [PMC free article] [PubMed]
- Juusola M., Kouvalainen E., Järvilehto M., Weckström M. Contrast gain, signal-to-noise ratio and linearity in light adapted blowfly photoreceptors. J. Gen. Physiol. 1994;104:593–621. doi: 10.1085/jgp.104.3.593. [DOI] [PMC free article] [PubMed] [Google Scholar]
- Juusola M., Weckström M., Uusitalo R.O., Korenberg M., French A.S. Nonlinear models of the first synapse in the light-adapted fly retina. J. Neurophysiol. 1995;74:2538–2547. doi: 10.1152/jn.1995.74.6.2538. [DOI] [PubMed] [Google Scholar]
- Juusola M., French A.S., Uusitalo R.O., Weckström M. Information processing by graded potential transmission through tonically active synapses. Trends Neurosci. 1996;19:292–297. doi: 10.1016/S0166-2236(96)10028-X. [DOI] [PubMed] [Google Scholar]
- Kouvalainen E., Weckström M., Juusola M. Determining photoreceptor signal-to-noise ratio in the time and frequency domains with a pseudorandom stimulus. Vision Neurosci. 1994;95:1221–1225. doi: 10.1017/s095252380000701x. [DOI] [PubMed] [Google Scholar]
- Laughlin S.B. A simple coding procedure enhances a neurone's information capacity. Z. Naturforsch. 1981;36:910–912. [PubMed] [Google Scholar]
- Laughlin S.B. Matched filtering by a photoreceptor membrane. Vision Res. 1996;36:1529–1541. doi: 10.1016/0042-6989(95)00242-1. [DOI] [PubMed] [Google Scholar]
- Laughlin S.B., Weckström M. Fast and slow photoreceptorsa comparative study of the functional diversity of coding and conductances in the Diptera . J. Comp. Physiol. A. 1993;172:593–609. [Google Scholar]
- Laughlin S.B., de Ruyter van Steveninck R.R., Anderson J.C. The metabolic cost of neural information. Nat. Neurosci. 1998;1:36–41. doi: 10.1038/236. [DOI] [PubMed] [Google Scholar]
- Lillywhite P.G., Laughlin S.B. Transducer noise in a photoreceptor. Nature. 1979;227:569–572. doi: 10.1038/277569a0. [DOI] [PubMed] [Google Scholar]
- Montell C. Visual transduction in Drosophila . Annu. Rev. Cell Dev. Biol. 1999;15:231–268. doi: 10.1146/annurev.cellbio.15.1.231. [DOI] [PubMed] [Google Scholar]
- Oberwinkler J., Stavenga D.G. Light dependence of calcium and membrane potential measured in blowfly photoreceptors in vivo. J. Gen. Physiol. 1999;112:113–124. doi: 10.1085/jgp.112.2.113. [DOI] [PMC free article] [PubMed] [Google Scholar]
- Oberwinkler J., Stavenga D.G. Calcium transients in the rhabdomeres of dark- and light-adapted fly photoreceptor cells. J. Neurosci. 2000;20:1701–1709. doi: 10.1523/JNEUROSCI.20-05-01701.2000. [DOI] [PMC free article] [PubMed] [Google Scholar]
- Pak W.L., Ostroy S.E., Deland M.C., Wu C.-F. Photoreceptor mutant of Drosophilais protein involved in intermediate steps of phototransduction? Science. 1976;194:956–959. doi: 10.1126/science.824732. [DOI] [PubMed] [Google Scholar]
- Payne R., Howard J. Response of an insect photoreceptora simple log-normal model. Nature. 1981;290:415–416. [Google Scholar]
- Peretz A., Sandler C., Kirschfeld K., Hardie R.C., Minke B. Genetic dissection of light-induced Ca2+ influx into Drosophila photoreceptors. J. Gen. Physiol. 1994;104:1057–1077. doi: 10.1085/jgp.104.6.1057. [DOI] [PMC free article] [PubMed] [Google Scholar]
- Phillips A.M., Bull A., Kelly L.E. Identification of a Drosophila gene encoding a calmodulin-binding protein with homology to Trp phototransduction gene. Neuron. 1992;8:631–642. doi: 10.1016/0896-6273(92)90085-r. [DOI] [PubMed] [Google Scholar]
- Pugh E.N., Jr., Nikonov S., Lamb T.D. Molecular mechanisms of vertebrate photoreceptor light adaptation. Curr. Opin. Neurobiol. 1999;9:410–418. doi: 10.1016/S0959-4388(99)80062-2. [DOI] [PubMed] [Google Scholar]
- Raghu P., Usher K., Jonas S., Chyb S., Polyanovsky A., Hardie R.C. Constitutive activity of the light-sensitive channels TRP and TRPL in the Drosophila diacylglycerol kinase mutant, rdgA. Neuron. 2000;26:169–179. doi: 10.1016/s0896-6273(00)81147-2. [DOI] [PubMed] [Google Scholar]
- Ranganathan R., Bacskai B.J., Tsien R.Y., Zucker C.S. Cytosolic calcium transientsspatial localization and role in Drosophila photoreceptor cell function. Neuron. 1994;13:837–848. doi: 10.1016/0896-6273(94)90250-x. [DOI] [PubMed] [Google Scholar]
- Ranganathan R., Harris G.L., Stevens C.F., Zucker C.S. A Drosophila mutant defective in extracellular calcium-dependent photoreceptor deactivation and rapid desensitisation. Nature. 1991;354:230–232. doi: 10.1038/354230a0. [DOI] [PubMed] [Google Scholar]
- Roebroek J.G.H., Stavenga D.G. On the effective density of the pupil mechanism in fly photoreceptors. Vision Res. 1990;8:1235–1242. doi: 10.1016/0042-6989(90)90178-n. [DOI] [PubMed] [Google Scholar]
- Ruderman D.L., Bialek W. Statistics of natural imagesscaling in the woods. Phys. Rev. Lett. 1994;73:814–817. doi: 10.1103/PhysRevLett.73.814. [DOI] [PubMed] [Google Scholar]
- Sayeed O., Benzer S. Behavioral genetics of thermoregulation and hygrosensation in Drosophila . Proc. Nat. Acad. Sci. USA. 1996;93:6079–6084. doi: 10.1073/pnas.93.12.6079. [DOI] [PMC free article] [PubMed] [Google Scholar]
- Scott K., Zuker C.S. Assembly of the Drosophila phototransduction cascade into a signalling complex shapes elementary responses. Nature. 1998;395:805–808. doi: 10.1038/27448. [DOI] [PubMed] [Google Scholar]
- Scott K., Becker A., Sun Y., Hardy R., Zuker C.S. G(alpha) protein function in vivogenetic dissection of its role in photoreceptor cell physiology. Neuron. 1995;15:919–927. doi: 10.1016/0896-6273(95)90182-5. [DOI] [PubMed] [Google Scholar]
- Shannon C.E. A mathematical theory of communication. Bell Syst. Tech. J. 1948;27:623–656. [Google Scholar]
- Shieh B.H., Zhu M.Y. Regulation of the TRP Ca2+ channel by INAD in Drosophila photoreceptors. Neuron. 1996;16:991–998. doi: 10.1016/s0896-6273(00)80122-1. [DOI] [PubMed] [Google Scholar]
- Skingsley D.R., Laughlin S.B., Hardie R.C. Properties of histamine-activated chloride channels in the large monopolar cells of the dipteran compound eyea comparative study. J. Comp. Physiol. A. 1995;176:611–623. [Google Scholar]
- Smith D.P., Ranganathan R., Hardy R.W., Marx J., Tsuchida T., Zuker C.S. Photoreceptor deactivation and retinal degeneration mediated by a photoreceptor-specific protein-kinase-C. Science. 1991;254:1478–1484. doi: 10.1126/science.1962207. [DOI] [PubMed] [Google Scholar]
- Stieve H., Schnakenberg J., Huhn A., Reuss H. An automatic gain control in the Limulus photoreceptor. In: Lutgau H.C., editor. Progress in Zoology. Membrane Control of Cellular Activity. Vol 33. Gustav Fisher; Stuttgart: 1986. pp. 367–376. [Google Scholar]
- Strausfeld N.J. Beneath the compound eyeneuroanatomical analysis and physiological correlates in the study of insect vision. In: Stavenga D.G., Hardie R.C., editors. Facets of Vision. Springer-Verlag; Berlin: 1989. pp. 317–359. [Google Scholar]
- Theunissen F., Roddey J.C., Stufflebeam S., Clague H., Miller J.P. Information theoretic analysis of dynamical encoding by four primary sensory interneurons in the cricket cercal system. J. Neurophysiol. 1996;75:1345–1364. doi: 10.1152/jn.1996.75.4.1345. [DOI] [PubMed] [Google Scholar]
- Tsunoda S., Sierralta J., Sun Y.M., Bodner R., Suzuki E., Becker A., Socolich M., Zucker C.S. A multivalent PDZ-domain protein assembles signaling complexes in a G-protein-coupled cascade. Nature. 1997;388:243–249. doi: 10.1038/40805. [DOI] [PubMed] [Google Scholar]
- van Hateren J.H. Theoretical predictions of spatiotemporal receptive fields of fly LMCs and experimental validation. J. Comp. Physiol. A. 1992;171:157–170. [Google Scholar]
- Weckström M., Kouvalainen E., Juusola M. Measurement of cell impedance in frequency domain using discontinuous current clamp and white noise modulated current injection Pflügers Arch 421 1992. 469 472b [DOI] [PubMed] [Google Scholar]
- Weckström M., Juusola M., Laughlin S.B. Presynaptic enhancement of signal transients in photoreceptor terminals in the compound eye Proc. R. Soc. B. Lond. 250 1992. 83 89a [Google Scholar]
- Weckström M., Laughlin S.B. Visual ecology and voltage-gated ion channels in insect photoreceptors. Trends Neurosci. 1995;18:17–21. doi: 10.1016/0166-2236(95)93945-t. [DOI] [PubMed] [Google Scholar]
- Wong F., Knight B.W. Adapting-bump model for eccentric cells of Limulus . J. Gen. Physiol. 1980;76:539–557. doi: 10.1085/jgp.76.5.539. [DOI] [PMC free article] [PubMed] [Google Scholar]
- Wong F., Knight B.W., Dodge F.A. Dispersion of latencies in photoreceptors of Limulus and the adapting-bump model. J. Gen. Physiol. 1980;76:517–537. doi: 10.1085/jgp.76.5.517. [DOI] [PMC free article] [PubMed] [Google Scholar]
- Wu C-F., Pak W.L. Light-induced voltage noise in the photoreceptor of Drosophila melanogaster . J. Gen. Physiol. 1978;71:249–268. doi: 10.1085/jgp.71.3.249. [DOI] [PMC free article] [PubMed] [Google Scholar]