

Abstract
It is known that an increase in both the mean light intensity and temperature can speed up photoreceptor signals, but it is not known whether a simultaneous increase of these physical factors enhances information capacity or leads to coding errors. We studied the voltage responses of light-adapted Drosophila photoreceptors in vivo from 15 to 30°C, and found that an increase in temperature accelerated both the phototransduction cascade and photoreceptor membrane dynamics, broadening the bandwidth of reliable signaling with an effective Q10 for information capacity of 6.5. The increased fidelity and reliability of the voltage responses was a result of four factors: (1) an increased rate of elementary response, i.e., quantum bump production; (2) a temperature-dependent acceleration of the early phototransduction reactions causing a quicker and narrower dispersion of bump latencies; (3) a relatively temperature-insensitive light-adapted bump waveform; and (4) a decrease in the time constant of the light-adapted photoreceptor membrane, whose filtering matched the dynamic properties of the phototransduction noise. Because faster neural processing allows faster behavioral responses, this improved performance of Drosophila photoreceptors suggests that a suitably high body temperature offers significant advantages in visual performance.
Keywords: vision, retina, information, neural coding, graded potential
INTRODUCTION
Animals live in a noisy and changeable environment with a variety of internal noise sources also present in the nervous system. Yet, with adequate stimulus conditions, their responses are usually both reliable and accurate. How robust is the underlying neural code, and can it be influenced by general physical factors like temperature? In the visual system, the flow of information starts from an intricate network of photoreceptors and interneurons, many of which use graded potentials (analogue signals) for their communication. This communication has its limitations even in its initial stages. If photoreceptors cannot code incoming light information into voltage responses larger than their own intrinsic voltage noise, higher order neurons in the brain cannot usefully process the signals they are receiving, and the action potentials they generate will carry little information. Because of their intrinsic noise and limited dynamic range, photoreceptors also face the problem of gain control. They must have a high gain to respond to small light contrasts and, yet, be able to accommodate large stimulus changes associated with changes in mean illumination. The reliability of this complex gain control, which involves both the phototransduction cascade and the cell membrane (including voltage-sensitive conductances), may also be prone to temperature-sensitive changes in the reaction kinetics (Lamb 1984).
Most animals, including insects and other invertebrates, cannot thermoregulate, but still are active over a wide range of temperatures. Studies in toads have emphasized how cooling can improve performance at absolute threshold by reducing the rate of thermal isomerization of rhodopsin (Aho et al. 1988). However, warming can also enhance performance since this accelerates the response kinetics and, hence, improves temporal resolution (Lamb 1984). In invertebrate photoreceptors, the time course of both the impulse and elementary responses (i.e., quantum bumps) accelerates with warming (French and Järvilehto 1978; Wong et al. 1980; Roebroek et al. 1990; Tatler et al. 2000). Although the response dynamics of invertebrate photoreceptors are sensitive to normal fluctuations in body temperature, the effects of temperature on their signaling and coding efficiency have not been studied thoroughly.
Our previous study of the signaling efficiency in Drosophila photoreceptors (see Juusola and Hardie 2000, in this issue) provided compelling evidence that the photoreceptor membrane does not restrict the speed of voltage responses, and that there are two separate processes operating in the phototransduction cascade, whose adaptive partnership defines the signaling fidelity of the photoreceptor (namely, the average bump waveform and its timing). The photoreceptor responses are simply a convolution of these processes (Wong and Knight 1980; Henderson et al. 2000). By using a combined noise and signal analysis, we could isolate one from the other and investigate their individual dynamics at different mean light intensity levels. We discovered that most of the adaptive changes in the size of the photoreceptor voltage responses results from a logarithmic reduction in the bump waveform, whereas the speed of the voltage responses is limited by the timing delays in the reactions responsible for the latency dispersion of the bumps. The fact that bump latencies are only marginally affected by light adaptation leads to a direct restriction in the bandwidth of the photoreceptor signals and, hence, the information capacity. The results are consistent with the suggestion that each of the 3 × 10⁴ rhabdomeral microvilli represents an individual transduction unit (Howard et al. 1987; Hochstrate and Hamdorf 1990; Postma et al. 1999).
Physical chemistry tells us that the speed of chemical reactions can be increased by increasing the number of effective hits between the molecules taking part in the reaction. This can be achieved by increasing the concentration of the reactants or catalysts, or by increasing the thermal energy. The speed of chemical reactions approximately doubles with a 10°C rise in temperature; expressed as a Q10 of 2. Our results from Drosophila photoreceptors at 25°C (see Juusola and Hardie 2000, in this issue) suggested that the speed of the reactions limiting the bump latency is saturated, thus, implying that the concentrations of the reactants and catalysts cannot be elevated by light adaptation. If this is true, then the only plausible way of improving the signaling fidelity is to increase the photoreceptor temperature. More specifically, if the processes behind the light-induced voltage noise (i.e., the average bump waveform), have a Q10 smaller than the processes behind the signal timing dynamics (i.e., bump latency distribution), or the effects of noise are limited by temperature-sensitive filtering, then the information capacity of the photoreceptors will increase with warming.
We have studied the response and membrane properties of light-adapted Drosophila photoreceptors in vivo over a 15°C temperature range using linear signal analysis with natural-like contrast and current stimulation similar to those of our companion paper (see Juusola and Hardie 2000, in this issue). We found that warming light-adapted Drosophila photoreceptors increases their quantum efficiency and accelerates both the phototransduction cascade and cell membrane dynamics. The bump waveform, which is primarily responsible for noise processes on the cell membrane, is relatively temperature insensitive, whereas the bump latency distribution speeds dramatically by warming the photoreceptors. The faster and more precise timing of a larger number of bumps increases the size of the voltage responses to contrast stimuli, hence, expanding the bandwidth of reliable signaling and dramatically increasing the photoreceptor information capacity with a Q10 of 6.5.
MATERIALS AND METHODS
Flies, wild-type red-eyed Drosophila melanogaster (Oregon), were taken from a laboratory culture and reared at 25°C. Intracellular voltage responses of green-sensitive R1-6 photoreceptors to light and current stimuli were recorded over a range of temperatures from 15 to 30°C. The recording procedures, light and current stimulation, and data analysis are explained in the companion paper (see Juusola and Hardie 2000, in this issue).
Recording Criteria
Only photoreceptors with saturating impulse responses (Vmax) over 40 mV, minimum input resistance of 100 MΩ, and resting potential in the dark below −50 mV were selected for this study. These photoreceptors allowed stable recordings sometimes for several hours and, therefore, were used in a number of different experiments, each of which was repeated with a minimum of three cells, unless stated otherwise. However, we found the recording criteria to be temperature- dependent. In cooler temperatures, the photoreceptors required a significantly longer time to recover from the previous light exposure. Consequently, when a dark recovery period was kept constant, the light responses of a cool photoreceptor were often smaller than those measured in the same cell in warmer temperatures. The impulse responses were largest in a temperature range from 22 to 27°C (50.2 ± 9.3 mV, n = 30). Altogether, the data were collected from 51 photoreceptors. All the statistics are given as mean ± SD.
RESULTS
Impulse Responses of Dark-adapted Photoreceptors at Different Temperatures
The photoreceptor voltage responses to light impulses were first studied after 10–30 min of dark adaptation. Fig. 1 A shows typical voltage responses to a saturating light flash at different temperatures. Warming accelerated the voltage responses, producing an earlier peak. The responses also terminated more rapidly at higher temperatures.
Figure 1.

Voltage responses of dark-adapted Drosophila photoreceptors to a saturating light impulse and light step at various temperatures. (A) Responses to a 1-ms light flash of 104 photons. The time to peak and width of the responses decreases with increasing temperature. (B) The onset of an adapting light background of BG0 (3 × 10⁶ photons/s) triggers saturating light responses, whose adaptation time course and plateau potential are temperature-dependent. The recordings are from the same photoreceptor at 18 and 28°C, respectively.
Light Adaptation Is Highly Temperature-sensitive
Fig. 1 B shows typical voltage responses of a photoreceptor to a prolonged light pulse at 28 and 18°C, both recorded after a 2-min dark adaptation period. Soon after the onset of the light pulse, the photoreceptor rapidly depolarizes from the dark-adapted resting potential (around −65 mV) to values close to zero, before declining in a multiphasic fashion to a much lower plateau potential. The decline of the responses from the initial transient to the lower steady-state potential, which is reached after ∼10–20 s of continuous illumination, reflects the processes of light adaptation. Not only the timing and the shape of the initial voltage transients, but also the steady-state potential depends on temperature. At the brightest adapting background of 3 × 10⁶ photons/s (BG0) the magnitude of the steady-state potential varies from 5–15 mV at 16°C to 20–40 mV at warmer temperatures.
The temperature also greatly affects the voltage responses to contrast steps of light-adapted photoreceptors. Fig. 2 A shows averaged contrast responses of two different photoreceptors recorded at BG0 at 29 and 24°C, respectively. Although light increments (positive contrasts) produce smaller responses than light decrements of the same amplitude, warming increases and accelerates voltage responses to any contrast stimulus. The faster time course of the contrast responses with warming is accompanied by accelerated photoreceptor membrane dynamics. This is shown in Fig. 2 B, which compares current-evoked voltage responses of the same cells at the same temperatures. Small depolarizing current pulses (up to 0.3 nA) produce voltage responses showing strong outward rectification because of the activation of voltage-sensitive potassium channels (Hardie 1991; Hevers and Hardie 1995). Hyperpolarizing pulses evoke slower responses, reaching voltages below the dark adaptation resting potential, which resemble RC charging. The time courses of these events are distinctively temperature-sensitive, however.
Figure 2.

Voltage responses of light-adapted Drosophila photoreceptors to light contrast and current steps. The recordings are from two photoreceptors at two different temperatures, namely 29 and 24°C, at steady illumination with BG0. The steady-state potential in the two photoreceptors was −40 and −46 mV. (A) During prolonged light adaptation, depolarizing and hyperpolarizing photoreceptor responses were evoked by light increments and decrements, respectively, i.e., contrast steps (from c = −1 to c = +1), which showed nonlinear rectification with temperature-dependent characteristics. The voltage responses at 24°C are smaller and slower than those at 29°C. (B) The membrane properties of the photoreceptors were studied by injecting current pulses (from −0.2 to ±0.3 nA). Judged by the speed of the voltage responses, the photoreceptor membrane allows faster signaling at higher temperatures. The time courses of the current-induced voltage response are always faster than those elicited by light at the same temperature, indicating that neither the recording system nor the cell membrane is limiting the time course of the photoreceptor light responses. The contrast responses are averaged 30 times, and the current responses are averaged 5 (29°C) and 10 times 24°C).
These findings were confirmed and further characterized in recordings from single light-adapted photoreceptors using more natural, time-dependent light and current stimuli, i.e., white noise–modulated light contrasts and current injections at various temperatures. By applying both signal and shot noise analysis to the data, we could characterize the temperature-induced changes in the photoreceptor signal and noise dynamics and compare the filtering dynamics of the photoreceptor membrane to those of the phototransduction cascade.
In the next paragraph, we show: (I) how the light-adapted signal and noise dynamics of photoreceptor voltage responses change with temperature; (II) how the filtering properties of the photoreceptor membrane are tuned by the temperature; and (III) how the adaptive co-processing by the phototransduction cascade and membrane refines the photoreceptor signaling.
Light Adaptation and Photoreceptor Signaling at Different Temperatures
Light-adapted Drosophila photoreceptors produce slightly variable voltage responses to repeated presentations of an identical light contrast stimulus (Juusola and Hardie 2000). To find out whether this variability depends on the ambient temperature, we recorded photoreceptor responses to a dynamically modulated wideband light contrast stimulus at different temperatures. Averaging the individual voltage responses, rV(t)i, yields the photoreceptor signal, sV(t), whereas the noise, nV(t)i, follows by taking the difference between the individual responses and the signal:
 |
1 |
Voltage Responses to Dynamic Contrast Sequences at Bright Background Light
The signal and noise dynamics of light-adapted photoreceptors were studied using a 10-s-long Gaussian contrast stimulus at BG0. The stimulus was spectrally white up to ∼200 Hz and had a mean value of 0.32 (Juusola and Hardie 2000). Therefore, it both covered the operational frequency range of Drosophila photoreceptors and mimicked the light fluctuations in a fly's natural environment (Laughlin 1981). Fig. 3 illustrates the key findings from a single photoreceptor at four temperatures (18, 22, 25, and 29°C) with a summary of the corresponding signal and noise statistics from 34 photoreceptors.
Figure 3.
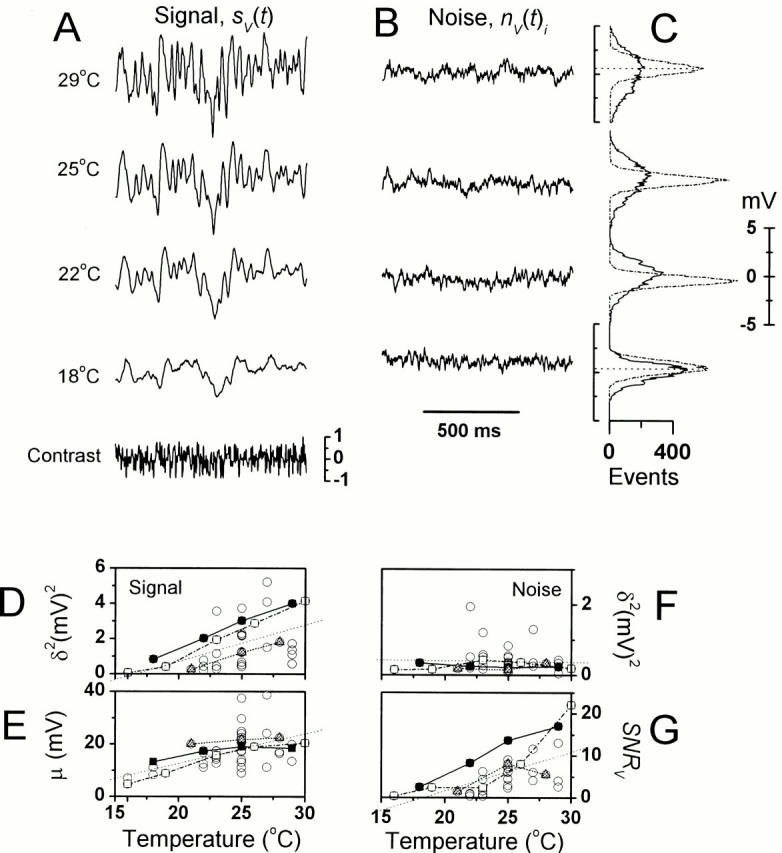
Photoreceptor responses to dynamically modulated contrasts at BG0 at different temperatures. (A) The waveforms of the voltage signal, sV(t), and (B) the corresponding voltage noise, nV(t)i. (C) The noise had a Gaussian distribution (dots) at all temperatures, whereas the signal distribution (continuous lines) changed from Gaussian at cool temperatures to increasingly skewed at higher temperatures. (D) The signal size (indicated here as its variance, δ 2) increases sometimes over 15-fold, and its mean (E) is elevated by over 20 mV as the temperature increases by >10°C. (F) The noise variance does not change significantly with warming. (G) The changes in the signal and noise variance led to a continuously improving photoreceptor (SNRV) with increasing temperature. (D–G) The black and white squares indicate the recordings from (. of Juusola and Hardie 2000, in this issue) two photoreceptors, whose signaling was studied over a 10°C temperature range. Closed triangles indicate a photoreceptor that was studied over a 7°C range. The thin, dotted lines in the figures represent the trend (i.e., the linear fits over all the data points).
The magnitude of the photoreceptor voltage signal, sV(t), increases ∼4–15 times (Fig. 3 A) when warmed from 18 to 29°C. This is accompanied by an increasing signal mean, μ (or the BG0-induced steady-state depolarization), from ∼5 mV to 20–25 mV above the dark-adapted resting potential (Fig. 3 E) and by changes in the signal probability distribution (Fig. 3 C, continuous line) from Gaussian at the coolest temperatures (≤18°C, including the cells in Fig. 3 D) to slightly negatively skewed at warmer temperatures (22, 25, and 29°C). In general, photoreceptors with the largest dark-adapted impulse responses also had the largest light-adapted steady-state potentials. Thus, the relation μ/Vmax increases with warming, from 13% at 16°C (n = 3) to 43% at 27°C (n = 4), confirming that cooling reduces the steady-state potential of light-adapted photoreceptors. By contrast, the size of the contrast-evoked voltage signals, sV(t), of light-adapted photoreceptors is not proportional to their dark-adapted impulse responses, and photoreceptors with Vmax of ∼70 mV produce an sV(t) similar to that of photoreceptors with Vmax of ∼40 mV.
The voltage signal (Fig. 3 A) increases with temperature, being in two cells less than the noise at temperatures below 16°C (Fig. 3D and Fig. F), but much greater under warmer conditions. Strikingly however, the average noise variance is virtually insensitive to the temperature (Fig. 3B and Fig. F) and its probability distribution (Fig. 3 C, dotted line) is Gaussian. Since the warming-induced changes in the signal overwhelm those of the noise, an increasing temperature improves the photoreceptor SNRV often >10-fold over the studied temperature range (Fig. 3 G). At least three (not necessary mutually exclusive) interpretations can be suggested to explain why both sV(t) and μ (steady-state potential) increase with warming, while nV(t)i does not. First, the quantum efficiency of photoreceptors (i.e., the probability of producing an elementary voltage response, quantum bump, from an absorbed photon) increases with warming. Thus, the observed larger contrast responses and the steady-state potential at warm temperatures would simply result from the summation of a larger number of bumps. Second, the intracellular pupil mechanism (Lo and Pak 1981) has temperature-dependent dynamics, so that in warmer temperatures a larger light flux would be allowed to enter the rhabdomeres. Again, more photons would sum up to produce larger voltage responses. Third, the synchronization of the bumps improves with warming. This would increase the time resolution of the voltage responses and expand the signaling bandwidth, so that sV(t) would enlarge with increasing temperature. To test these hypotheses, the corresponding signal and noise data were analyzed in the frequency domain.
The Signal and Noise Dynamics in Frequency Domain
Fig. 4 shows the signal and noise power spectra of light-adapted Drosophila photoreceptors, and related functions at different temperatures. Because the photoreceptor signal power spectrum (Fig. 4 A) is calculated from the contrast-evoked voltage signals, it contains information about the mean bump waveform and its latency, whereas the noise power spectrum (Fig. 4 B), portraying the mean of the coding errors, is largely light-induced voltage noise (i.e., bump voltage noise; Juusola and Hardie 2000). Warming increases the photoreceptor signal power, |〈S V(f )〉|2(Fig. 4 A), and extends its bandwidth, whereas the power and shape of the corresponding voltage noise, |〈N V(f )〉|2 (Fig. 4 B), changes relatively little. Assuming that the instrumental noise and light-induced voltage noise are independent but additive, we can estimate the bump voltage noise power, |〈B V(f )〉|2 (Fig. 4 F), at different temperatures by subtracting the photoreceptor voltage noise power spectrum measured in the dark, from the photoreceptor voltage noise power spectra, |〈N V(f )〉|2, measured at the adapting background of BG0 at different temperatures. Then, by fitting a single Lorentzian to the obtained bump voltage noise power spectra, |〈B V(f )〉|2:
 |
2 |
we obtain two parameters, n and τ (Wong et al. 1980; Juusola and Hardie 2000). These are used to calculate the average bump waveform (Fig. 4 G),
 |
3 |
and the effective duration, T (Fig. 4 H), of the bump,
 |
4 |
Figure 4.

The photoreceptor response dynamics at BG0 at different temperatures. (A) The signal power spectra, |〈SV( f )〉|2, (B) noise power spectra, |〈NV(f )〉|2, and (C) SNRV(f ) calculated via the FFT (see Juusola and Hardie 2000). (D) The information at different temperatures, log2[SNRV(f ) + 1], and (E) the information capacity, the integral of the information over all frequencies (Juusola and Hardie 2000). (F) The bump noise power (continuous lines) was isolated by subtracting the photoreceptor noise power spectrum, measured at darkness, from the power spectrum, measured at the BG0, and fitted with single Lorentzians (dotted lines). This gives us the two parameters (n and τ) for calculating the bump shape (G) and the effective bump duration (H) at BG0 (the symbols indicate the photoreceptors as previously described). The bump event rate (I) was estimated as described in the text ().
The mean bump amplitude, α (used for scaling the bump waveforms in Fig. 4 G), is estimated from Campbell's theorem (Wong and Knight 1980):
 |
5 |
where σ 2 is the noise variance and μ is the mean membrane potential. The bump rate, λ (Fig. 4 I), is given by (Wong and Knight 1980):
 |
6 |
The derived light-induced voltage noise power, |〈B V(f )〉|2 (Fig. 4 F), appears to be virtually independent of the temperature. Accordingly, the effective bump duration (Fig. 4 G) shows, at most, a marginal decrease with warming. Although the bump amplitude (Fig. 4 H) appears to decrease slightly upon warming, this cannot account for the increased steady-state potential, or for the much higher SNRV(f ) (Fig. 4 C) and information content (Fig. 4 D) of the photoreceptor voltage responses. The Q10 for bump duration (T) and amplitude (α) is 1.2 ± 0.2 and 1.8 ± 0.1, respectively (n = 2). On the other hand, the average bump rate, λ (Fig. 4 I), increases with warming (Q10 = 4.0 ± 0.2, n = 2). The quantum efficiency of light-adapted Drosophila photoreceptors, hence, increases with temperature, and this may be at least partially responsible for the observed increase in the light-induced steady-state potential at temperatures above 18°C.
We found that, on average, a 10°C warming leads to 6.5 ± 2.8-fold increase in the photoreceptor information capacity (n = 3; Fig. 4D and Fig. E). Since the average bump rate at different recording temperatures can vary >10-fold (Fig. 4 I), so that some photoreceptors with rates <105 bumps/s are still able to have information capacities >300 bits/s, it is very unlikely that the huge increase in the photoreceptor information capacity is solely due to the summation of a larger number of bumps. Presumably, the accelerated bump timing dynamics, as seen in the expanding signal bandwidth (Fig. 4 A), is also contributing.
Frequency Response Analysis
The temperature dependence of the photoreceptor signal power spectrum suggests that photoreceptors can follow higher contrast stimulus frequencies at higher temperatures, but this provides no details about the underlying mechanisms. To characterize how warming influences the signaling dynamics, we calculated the photoreceptor frequency response at different temperatures.
The acceleration of signaling dynamics is apparent in the photoreceptor contrast gain, GV(f ) (Fig. 5 A). The 3-dB cut-off frequency shifts towards higher frequencies (Q10 = 2.3 ± 0.3, n = 3; Fig. 5 B), and the corresponding phase, PV(f ) (Fig. 5 C), lags the stimulus less at higher temperatures. Superficially these heat-induced changes in the signal dynamics resemble light adaptation from very dim to very bright mean light, including a significant increase in the absolute contrast gain (Juusola and Hardie 2000). Because the experimental phase functions, PV(f ), differ from the corresponding minimum phase functions, Pmin(f ), the light-adapted photoreceptors exhibit a pure time delay (Juusola and Hardie 2000). The duration of this so-called photoreceptor dead-time (Fig. 5 D), computed from the difference between PV(f ) and Pmin(f ), decreases more than threefold in a 10°C temperature increase (Q10 = 3.1 ± 0.1, n = 3).
Figure 5.

Frequency responses of light-adapted photoreceptors at different temperatures. According to the increasing gain function (A), the photoreceptor voltage responses to light contrast modulation becomes larger and faster with an increase in temperature. (B) The acceleration of the voltages can be seen from the temperature-dependent shift in their cut-off frequency; Q10 = 2.4. (C) This is also seen in the phase of the frequency response functions, PV(f ), which indicates that the photoreceptor voltage responses lags the stimulus less at warmer temperatures. Since the minimum phase function, Pmin(f ), calculated from the gain part of the frequency response function differs from the measured phase, PV(f ), the voltage response to a light stimulus contains a pure time delay or dead-time (D). The photoreceptor dead-time at bright illumination is reduced by warming from values above 20 ms at below 20°C to ∼5 ms at 30°C; Q10 = 3.1. The photoreceptor voltage responses are linear as revealed by both (E) the measured, γexp 2 f, and (F) the estimated, γSNR 2 f, coherence function. (G) The linear impulse responses, i.e., first order Wiener kernels, are larger and faster at warmer temperatures. (H) The temperature-induced increase in the photoreceptor's signal processing speed can be quantified as a change in the time-to-peak (tp) values; Q10 = 2.5.
The photoreceptor coherence function, γexp 2 f (Fig. 5 E), is close to unity at all the tested temperatures, reconfirming the earlier findings that the responses of insect photoreceptors to dynamic contrast stimuli are linear (Leutscher-Hazellhoff 1975; French 1980; Juusola et al. 1994; Juusola and Hardie 2000). Accordingly, the coherence function, γSNR 2 f, which was estimated from the photoreceptor signal-to-noise ratio (see Juusola and Hardie 2000, in this issue), is also close to unity over the signal bandwidth (Fig. 5 F), thus, demonstrating the high reproducibility of the photoreceptor voltage responses to contrast modulation.
The effect of warming on the photoreceptor's signaling speed is also clearly seen in the first order Wiener kernels, kV(t) (Fig. 5 G). These impulse responses calculated via inverse FFT (see Juusola and Hardie 2000, in this issue) are larger, briefer, and show a reduced latency and shortened time to peak (tp) at higher temperatures. tp reduces from values >40 ms at <18°C to 13 ms at 30°C (Fig. 5 H), constituting a Q10 = 2.5 ± 0.2 (n = 3).
Bump Latency Distribution Changes with Temperature
The photoreceptor voltage responses to contrast stimulation at a particular mean light intensity level are generated by a summation of bumps. If the average waveform of the bumps is very short and small, the speed and time resolution of the voltage response depends critically on the synchronization of the bumps, i.e., their timing (see Juusola and Hardie 2000). Since the bump waveform, bV(t), changes only modestly with warming (Fig. 4 H), the greatly improved temporal resolution of the corresponding voltage responses is presumably caused by faster and more precise bump timing (i.e., the bump latency distribution, l(t)) narrows with increasing temperature. To verify this, we estimated the bump latency distribution, l(t), by deconvolving the bump shape, bV(t), from the corresponding impulse response, kV(t) (see Juusola and Hardie 2000, in this issue). This was done at different temperatures; first, by using simple equations to fit both the impulse response and the bump shape so as to minimize the effects of noise. Fig. 6 (A–C) shows how the fitted log-normal expressions of the impulse responses, k V;norm(t) (Fig. 5 G), the corresponding Γ-distribution–fitted bump waveforms, ΓV(t) (Fig. 4 G), and the calculated latency distributions, respectively, vary with temperature. Fig. 6 D shows the normalized bump latency distribution. The bumps appear earlier and in greater synchrony at higher temperature levels. The same is confirmed by calculating the bump latency, l(t), from the photoreceptor frequency responses, TV(f ), and the corresponding voltage noise spectra, |〈NV(f )〉| (Fig. 6 E; see also Juusola and Hardie 2000, in this issue):
 |
7 |
Figure 6.

Bump latency distribution at the adapting background of BG0 at different with temperatures. Removing the bump shape from the corresponding impulse response by deconvolution reveals the timing of the elementary responses, i.e., the bump latency distribution. (A) The log-normal approximations of the photoreceptor impulse responses, (B) the normalized Γ(t)-distribution fits of the bump waveform, and (C) the corresponding bump latency distributions at different temperatures. The normalized bump latency distributions (D) and those calculated from recorded voltage and light data as explained in (E) and (F) at different recording temperatures. Warming shortens and narrows the dispersion of bump latencies.
The bump latency distribution was also calculated by deconvolving (denoted by ⊗ in ) the ΓV(t) bump waveforms from the real impulse response data, kV(t) (Fig. 6 F):
 |
8 |
All the methods revealed that warming shortens the bump latency distribution and diminishes its width. The corresponding average Q10 for the latency distribution, which was calculated from the peak time and half-width values, are 3.4 ± 0.2 and 3.5 ± 0.5 (n = 3), respectively, coinciding with the Q10 of the dead-time and similar to previously reported Q10 values for the bump latency distribution in Limulus photoreceptors (Wong et al. 1980). Such a high value is a strong indication that the latency is not limited by diffusion, but suggests that the enzymatic steps of phototransduction determine its time course.
Cell Membrane during Natural-like Stimulation
In our companion paper (see Juusola and Hardie 2000, in this issue), we showed that the bump latency and not the filtering properties of the photoreceptor membrane limit the speed of the photoreceptor voltage response. The present paper shows that increasing the temperature reduces the bump timing delays (Fig. 6 D). Thus, the question arises whether the photoreceptor membrane dynamics are accelerated to allow transmission of the faster phototransduction signals, or whether the time constant of the photoreceptor membrane might limit the speed of the voltage responses at warmer temperatures. To investigate how the temperature dependence of the voltage responses is related to the dynamic properties of the membrane, we recorded photoreceptor voltage responses to both Gaussian current injections and contrast stimulation at different temperatures in single cells (Fig. 7).
Figure 7.

Voltage signals evoked by Gaussian current injection (A) and contrast (B) at different recording temperatures, and examples of the corresponding voltage noise traces. Both the current and contrast stimulation lasted 10 s and were repeated a minimum of 10 times. (C) The probability density distributions of the signal to light contrast (black areas) and current injection (scattered dots with Gaussian fits) at the adapting background of BG0 at 22, 25, and 29°C. The background light depolarizes the photoreceptor ∼15 to 20 mV above the resting potential at darkness (0 mV in C). The responses to light contrast are increasingly skewed, but they are Gaussian to a constant current injection. (D) The power spectra of the photoreceptor voltage noise, |〈NV(f )〉|2, at different temperature remain relatively unchanged, regardless of the Gaussian contrast (superscript C) and current (superscript I) modulation of the membrane potential.
Warming Accelerates Both Light Responses and Photoreceptor Membrane
Fig. 7 A shows samples of 1 s of the photoreceptor voltage signal and noise evoked by 10-s-long current modulation at different temperatures. Increasing the temperature reduces the amplitude modulation of the voltage signal. In the particular photoreceptor of Fig. 7, warming from 22 to 29°C reduces the signal variance by 26%. Since the current stimulus is unchanged, the diminishing average responses at higher temperatures result from reduced membrane impedance. The variance of the voltage noise is small, compared with the signal, and unaffected by the temperature in the studied range. These findings are compared with those of contrast stimulation at the same test temperatures (Fig. 7 B). In contrast to the current stimulation and in line with the previous experiments (Fig. 3D and Fig. F), the photoreceptor signals to light contrast stimulation increase with the temperature. Again, the variance of the photoreceptor voltage noise has no obvious temperature dependence.
Fig. 7 C shows typical probability distributions of voltage signals to dynamic contrast stimulation and current injection, ≪N V C f≫2 and ≪N V I f≫2, respectively at the test temperatures. Warming broadens the signal distribution and increases its skewness to Gaussian light contrast, but symmetrically reduces the depolarizing and hyperpolarizing voltage signals to Gaussian current injection. This confirms our previous findings (see Juusola and Hardie 2000) that the response rectification during light contrast stimulation is not caused by the voltage-sensitive membrane (Fig. 2), but is due to some asymmetry in the phototransduction cascade's response to light increments and decrements (for a first suggestion of this mechanism in Calliphora photoreceptors see Juusola 1993).
Between 3 and 200 Hz, the photoreceptor voltage noise power spectrum appears not to be affected by temperature and current-induced voltage modulation (Fig. 7 D), indicating that the processes responsible for the bump shape are fully determined by the adapting light background. Consequently, although different in size, the voltage responses to dynamic light contrast and current stimulation at BG0 are equally reproducible, as seen in their highly similar noise power spectra, ≪N V C f≫2 and ≪N V I f≫2, respectively. However, the noise power in the low frequency range below 3 Hz is the highest at 29°C (Fig. 4 B). During some experiments at higher temperatures, we observed that the center of the photoreceptor's receptive field shifted sporadically, causing slow fluctuations in the steady-state potential and, thus, affecting the power of the low frequency voltage noise. These movements may be due to an increased rate of intracapsular muscle activity at higher temperatures.
The effects of increased temperature on the photoreceptor membrane are very similar to those of increasing light adaptation shown in our companion paper (see Juusola and Hardie 2000, in this issue). Fig. 8 (A and B) shows that warming reduces the mean photoreceptor membrane impedance and that its bandwidth is extended to higher frequencies. The photoreceptor impedance closely approximates a minimal phase system (Fig. 8 C). Therefore, the estimated photoreceptor dead-time should not be affected by charging the light current into voltage responses. According to the near-unity coherence values (>0.98; Fig. 8D and Fig. E), the light-adapted photoreceptor membrane produces linear voltage responses to current injection. The normalized impedance (Fig. 8 F) and the normalized gain of the light responses (Fig. 8 G) show that warming accelerates both the membrane impedance and the light responses. At all tested temperatures, the bandwidth of the membrane impedance is much broader than that of the light responses, as was also found previously for all different states of light adaptation (Juusola and Hardie 2000). The Q10 values for the 3-dB cut-off frequency of the membrane impedance and the light responses are ∼1.7 and ∼2.3, respectively, in the photoreceptor of Fig. 8 (F and G).
Figure 8.

The photoreceptor impedance, Z(f ), which was calculated from the injected current and the resulting voltage responses, is reduced (A, gain), speeded (B, 3 dB cut-off frequency) and lagged the stimulus less (C, phase) when shifting towards higher frequencies with increasing temperature. The membrane operates linearly over the studied frequency range, as judged by the close to unity coherence: (D) γexp 2 f and in (E) γSNR 2 f. Both the normalized impedance (F) and the gain of the contrast-induced voltage signals (G) show a gradual shift of their bandwidth towards high frequencies; the cut-off frequency of the impedance was always higher than that of the light responses, at all recording temperatures.
Temperature-sensitive Signal and Noise Properties of Light Current
Because light-adapted photoreceptors respond to both the dynamic contrast and current stimulation with linear voltage responses, we can derive the output of the phototransduction cascade (light current), rI(t)i, by deconvolving the contrast-induced voltages, rV(t)i, from the membrane impedance impulse response, z(t), measured in the same cell at the same mean light and temperature (see Juusola and Hardie 2000, in this issue):
 |
9 |
The light current frequency response, TI(f ), is calculated from the contrast stimulus, c(t), and the deconvolved current response, rI(t)i(as shown in Juusola and Hardie 2000, in this issue). Fig. 9 (A–C) compares the gain parts of the frequency responses of the photoreceptor membrane impedance, Z(f ) (dash/dotted line), light current, GI(f ) (continuous line), and voltage responses, GV(f ) (short dots), at three different temperatures. The high impedance membrane clearly acts as a low-pass filter for the light current, filtering specifically the high frequency content of the phototransduction signal, which is dominated by the bump voltage noise. Warming progressively adjusts the filtering properties of the membrane so that the cut-off frequency of its impedance never significantly limits the frequency response of the voltage signal. The higher mean impedance under cool conditions, results in small light currents charging relatively larger voltage responses compared with the situation at warmer temperatures (Fig. 9 D).
Figure 9.
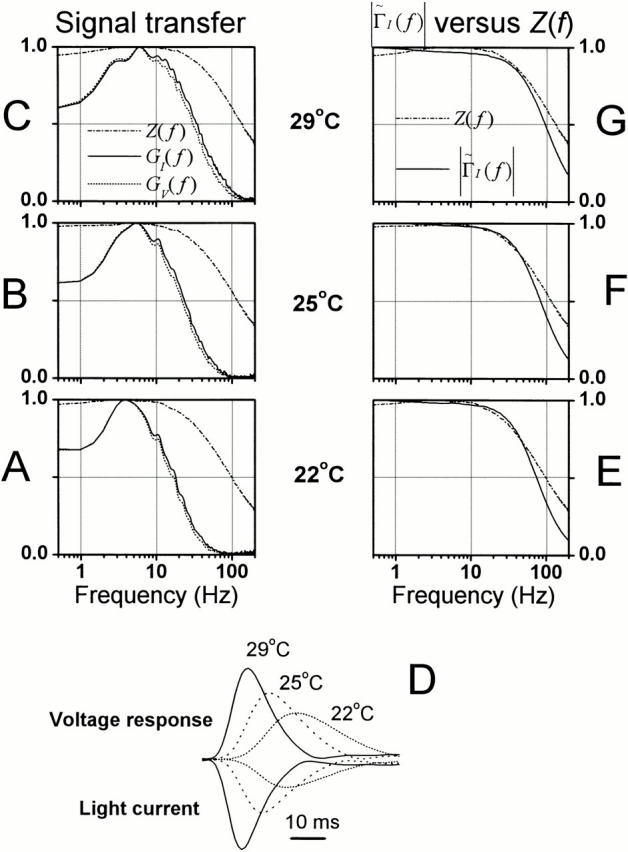
General comparison of the phototransduction signal and noise and membrane bandwidth at BG0 at different temperatures. (A–C) The dynamics of light current, voltage responses to light, and membrane impedance are displayed as their normalized frequency responses: GI(f ), GV(f ), and Z(f ), respectively. At BG0, regardless of the tested temperature the light current was smooth and had a much narrower bandwidth than the corresponding photoreceptor membrane. As the temperature is increased, both the phototransduction cascade and photoreceptor membrane allows faster signaling leading to accelerated voltage responses (i.e., GI(f ) hardly differs from GV(f )). The corresponding impulse responses (D), calculated from the same data, show how the light current and voltage responses quickens with warming, but the light current is always peaking before its corresponding voltage response. Because of the large membrane impedance at 22°C, the ratio between the corresponding light current and voltage response is larger than at warmer temperatures, where the photoreceptor impedance is less. The responses are normalized by the maximum value of each series. (E–G) The phototransduction bump noise, Γ̃I f, was calculated by deconvolving the photoreceptor membrane Z(f ) from the respective voltage bump noise, Γ̃V f, measured at different temperatures. From 22°C to 29°C Γ̃I f shows a considerable overlap with the corresponding membrane impedance indicating that the temperature-dependent shift in the membrane bandwidth effectively matches the temperature-dependent speed of the noise generating phototransduction processes.
The phototransduction noise spectrum, Γ̃I f, is estimated by deconvolving the normalized bump noise spectrum, Γ̃V f, with the corresponding membrane impedance, Z(f ):
 |
10 |
Given that the Fourier transform of ΓI(t) is its minimum phase representation in the frequency domain (Wong and Knight 1980), we can compare the normalized Γ̃I f at different temperatures to the corresponding normalized membrane impedance function, Z(f ) (Fig. 9, E–G). In general, warming shifts the bandwidth of Γ̃I f in tune with Z(f ) so that they overlap at all the test temperatures (Fig. 8, E–G; Juusola and Hardie 2000).
As the timing of the bumps becomes faster and more precise (as seen in the bump latency distribution, Fig. 6) and the changes in the bump waveform are matched by the temperature-sensitive filtering by the photoreceptor membrane (Fig. 9), the bandwidth of reliable signaling and the photoreceptor information capacity improves with warming (Fig. 10 A). The information capacity increases from values of below 50 bits/s at dim illumination (Fig. 10 A) or cool temperature conditions (Fig. 4 E) to >400 bits/s during 0.32 dynamic contrast stimulation at BG0 at 29°C. Since the quantum efficiency of the light-adapted photoreceptors drops at cool temperatures, possibly because of some saturation related processes (see discussion), we also calculated the Q10 for the average information capacity estimates at different mean light intensity levels at 25 and 29°C (where the estimated photoreceptor bump rates (r) for the same adapting backgrounds are very similar). We found that the Q10 for information capacity appears to be roughly independent of the adapting background (Fig. 10 B), and, hence, its high value does not result from some light-dependent saturation phenomenon, but is largely due to the increased speed of the phototransduction reactions.
Figure 10.
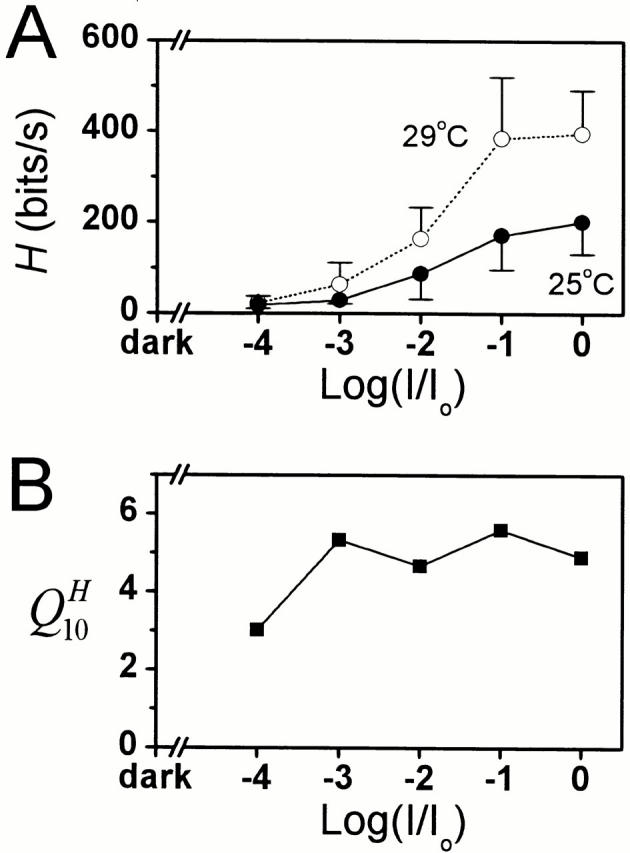
The photoreceptor information capacity increases with mean light intensity and temperature. (A) The photoreceptor information capacity at 25 and 29°C measured at different adapting backgrounds of 3 × 10² (BG-4) to 3 × 10⁶ (BG0) photons/s (n = 5 in both temperatures). Increasing the photoreceptor temperature by 4° about doubles its information capacity. (B) This data was also used for calculating the Q10 for information capacity at different mean light intensity levels. The consistently high Q10 indicates that the large improvement in photoreceptor signaling is not a consequence of some saturation-related processes at bright light conditions, but reflects the increased speed and precision of the phototransduction reactions.
DISCUSSION
The rate of photon absorption and the dynamics of the phototransduction machinery and the photoreceptor membrane together set the limits for the information capacity of photoreceptor voltage responses, and ultimately for the temporal resolution of neural images affecting visual behavior. Comparative studies of insect photoreceptors suggest that their phototransduction and membrane dynamics are tuned to accommodate the statistical properties of rapidly moving images encountered in the natural habitat (McCann and MacGinitie 1965; Laughlin and Weckström 1993; Weckström and Laughlin 1995). We find in Drosophila photoreceptors the fidelity of this neural code highly temperature-sensitive, with the different processes behind the signal and noise dynamics having distinctively different Q10 values.
In the next paragraphs, we will first summarize the general effects of temperature on the photoreceptor responses, compare these to the relevant literature, suggest possible mechanisms behind them, and correlate them to more general neural coding schemes.
Response Dynamics at Cold and Warm Temperatures
In cold environments (below 20°C), photoreceptor signaling is badly impaired. The light-induced steady-state potential is lower (Fig. 3 E), although the bump amplitude (Fig. 4 G) and duration (Fig. 4 H) increase slightly with cooling. The bandwidth of the signal-to-noise ratio and its absolute values (Fig. 4 C), even at low frequencies, are greatly reduced (sometimes >10-fold). Since the photon density is high (BG0) and the linear photoreceptor membrane filters the signal and noise of the light current equally (Fig. 9), cooling must increase the variability in the bump dynamics in some fundamental way. Indeed, we find that the two most crucial elements of the neural code, the rate of events, and their timing precision, are jeopardized. Thus, cooling not only reduces the quantum efficiency (Fig. 4 I), but it also smears out the latency distribution of the bumps in time (Fig. 6 D), so that the light contrasts produce smaller and less synchronized responses (Fig. 5 G).
In warm environments (above 25°C), photoreceptors produce large responses with little noise. Warming slightly reduces the average shape and size of the bumps (Fig. 4 G), yet, more importantly, it increases the effective rate of bump production (Fig. 4 I), shortens the time delays in phototransduction (i.e., the bump latency distribution; Fig. 6 D), and accelerates the photoreceptor membrane dynamics (Fig. 8 F). As photoreceptor signaling is faster and has a higher quantum efficiency, the phototransduction cascade can generate faster and larger receptor currents, which are accommodated by the accelerated membrane characteristics so that the resulting voltage responses are more reproducible.
Sensitivity to Temperature
The temperature sensitivity of biochemical reactions is expressed by Q10, which is the fractional increase in their speed per 10°C. In vertebrate photoreceptors, Q10 values of light response kinetics are ∼2 (Lamb 1984). In invertebrate photoreceptors, the reported Q10 values vary from 2.5 for frequency responses at low temperatures (French and Järvilehto 1978) in blowfly Calliphora to Q10 values of 4 for bump latency dispersion in Limulus (Wong et al. 1980). Recently, Tatler et al. 2000 measured Q10 values of 1.9 for the corner frequency of blowfly Calliphora voltage responses in the light-adapted state and over 3 in the dark-adapted state. We find similar values in light-adapted Drosophila photoreceptors, where the Q10 for the time to peak (tp) of the impulse responses and the corner frequency of the frequency responses is 2.5 and 2.3, respectively.
Our study is unique in the sense that we could isolate the effects of temperature on the phototransduction signal and noise and the filtering properties of the photoreceptor membrane by applying combined shot noise and signal analysis. This investigation reveals that the phototransduction processes related to the signal timing and the quantum efficiency (QE) are highly temperature-sensitive. The Q10 values for the dead-time, bump latency distribution, and the bump rate are 3.1, 3.5, and 4.0, respectively. On the other hand, the stochastic processes responsible for the voltage noise of light-adapted photoreceptors and the filtering properties of the membrane are less temperature-sensitive. Here, in contrast to findings of Roebroek et al. 1990 who reported a high Q10 of 2.5 for bump duration in Calliphora photoreceptors, we found that the light-adapted Drosophila photoreceptors have a relatively temperature-insensitive voltage noise power spectrum giving a Q10 for the effective bump duration and bump amplitude 1.2 and 1.8, respectively. Similarly, the Q10 for the corresponding corner frequency of the membrane impedance is only modest, 1.7, an intermediate value between the signaling and noise-generating processes. The dynamic interaction between the corresponding bump timing, waveform, and filtering processes, each having a different Q10 value, results in the coding fidelity of the photoreceptor voltage responses improving with increasing temperature, as seen in an effective Q10 estimate for information capacity of 6.5. Such a conspicuously high value reflects, in part, its derivation from the integral (area) of the SNRV(f ), and demonstrates how critical the operating temperature is for this most fundamental measure of coding efficiency in the nervous system.
Early Enzymatic and Late Diffusion Reactions
In our companion article on signaling dynamics in Drosophila photoreceptors at 25°C (see Juusola and Hardie 2000, in this issue), we demonstrated that increasing the mean light intensity shortens and reduces the size of the average bump waveform, but leaves the bump latency distribution relatively unaffected. Following the reasoning of Wong et al. 1980 in Limulus photoreceptors, we attribute the bump timing and waveform dynamics to two independent stages in the phototransduction cascade, whose convolution defines the photoreceptor response. Because hypomorphic Drosophila mutations of PLC and G-protein affect the bump latency but not the bump shape (Pak et al. 1976; Scott et al. 1995; Scott and Zuker 1998), events determining the timing of the response are believed to occur largely at, or upstream of, PLC, whereas events determining the bump shape and amplitude are generated downstream of PLC and mediated by intracellular calcium. Our present findings reinforce the separability of bump waveform and latency in the light- adapted state by showing that the former is relatively temperature insensitive, while the latter is highly dependent on temperature. A plausible explanation is that the speed of the calcium-mediated bump shape dynamics under fully light-adapted conditions is saturated with the high intracellular calcium level, whereas the time course of the earlier transduction reactions relating to bump timing is still very susceptible to even small changes in temperature. The very different Q10 of the bump latency distribution and bump shape suggests that the early phototransduction processes responsible for the timing of the elementary responses are enzymatic, whereas the latter membrane-bound reactions responsible for the amplification of the responses are diffusion limited.
Reduction of the Quantum Efficiency
An unexpected finding of this study is the high temperature sensitivity of bump production rate in bright light conditions. What kind of processes could reduce the effective QE of light-adapted photoreceptors? Saturation of the available transduction units, possibly individual microvilli, has been shown to occur under very bright daylight conditions in Calliphora (Howard et al. 1987), yet, the numbers do not add up here for Drosophila photoreceptors. Knowing that a photoreceptor rhabdomere consists of 30,000 microvilli, each containing a complete transduction cascade with the signaling speed limit set by the photoreceptor dead-time (Juusola and Hardie 2000), we can calculate the maximum signaling rate of a photoreceptor at BG0 (with the mean light flux of 3 × 10⁶ photons/s). At 18°C, the photoreceptor dead-time of 25 ms restricts the bump rate of a microvillus to 40 photons/s. Therefore 30,000 microvilli, each coding 40 photons/s, can maximally process 1.2 × 10⁶ photons/s. Since this is ∼10–30 times the estimated rate of the photons absorbed at the same temperature (30,000–100,000 photons/s), it is very unlikely that the phototransduction machinery is operating right at its saturation level. Another evidence for this conclusion comes from the information capacity recordings at different mean light intensity levels (Fig. 10 A). We find a similarly steep temperature dependence of information capacity at the adapting backgrounds of BG-3 and BG-2, where the number of photons per second absorbed is less than the number of transduction units.
Further experiments will be required to determine the cause of the unexpected loss of QE at lower temperatures. It does not appear to occur at the level of the visual pigment, since the dark-adapted QE appears to be unaffected by cooling to 15°C (Hardie, R.C., unpublished observations); but, it might represent saturation/exhaustion of some limiting step in the phototransduction pathway such as the PLC substrate (PIP2), which must be continually recycled via a multi-enzyme resynthesis process.
Temperature-dependent Limitations on the Speed of the Voltage Responses
Because of the high cut-off frequency of the photoreceptor membrane, the speed of the photoreceptor voltage responses is not significantly limited by the membrane over the tested temperature range, but is set by the delays in the phototransduction cascade. However, since the Q10 for the membrane corner frequency is 1.7 and the Q10 of latency processes is over 3, in high temperatures the filtering effect by the membrane on the light current becomes gradually more important, but not limiting. On the other hand, at 35°C, the extrapolated average bump duration would be 7.5 ms, which is ∼60% larger than the estimated half-width of the latency distribution of 4.3 ms. Hence, at such high temperatures, the speed of the light current would depend at least as much on the average bump duration as it does on the bump timing.
Benefits of Accelerated Responses
Previous studies in toads on the effect of temperature on visual performance have emphasized how cooling can improve performance by reducing the rate of thermal isomerizations of rhodopsin, thereby lowering the absolute detection threshold (Aho et al. 1988). Although this may be true under dark-adapted conditions when spontaneous bumps set the absolute limit to detection, the present study demonstrates how warming results in a massive improvement in SNRV and information capacity under generally more relevant light-adapted conditions. In the cool of the night, the heavily low-passed signaling system provides good amplification for objects coded by low numbers of photons, so that they can be separated from the background, but the accelerated photoreceptor dynamics are beneficial for high temporal resolution in the hot daytime. Improved temporal resolution gives behavioral advantages to an animal and may improve its survival odds. Therefore, it is not surprising to find that some invertebrates may benefit from the body fluid circulation, which cause part of the heat produced by the thoracial muscles to enter and heat up the head (and hence retinae) above the ambient temperature. Hoverflies, moths, and dragonflies can maintain a head temperature above 30°C, even when the ambient temperature is below 20°C (Heinrich 1993; Tatler et al. 2000).
Conclusion
In summary, we have provided a comprehensive description of the temporal resolving capability in Drosophila photoreceptors under natural conditions and, to our knowledge, the first analysis of the effects of temperature on information capacity in the nervous system. Although it has often been reported that temperature accelerates the kinetics of light responses (Wong et al. 1980; Lamb 1984), a priori, the conclusion that this improves signaling efficiency is by no means certain: the final voltage response represents a finely tuned balance between multiple components within the phototransduction cascade together with the passive and active properties of the plasma membrane. For example, the membrane impedance function speeds up in parallel with the phototransduction cascade, so that at no point does it seriously compromise the bandwidth of the light current. If this was not the case, the membrane would have seriously reduced the information capacity; e.g., if the membrane impedance determined at 17°C (Fig. 8 B) is convolved with the light current responses at 29°C (Fig. 9 C), then the estimated information capacity would be reduced fivefold. A future challenge will be to analyze how the different components of the cascade and membrane interact to produce this finely tuned performance. Drosophila is an excellent model in which to attempt this analysis because of the opportunities for genetic manipulation of the various elements including cascade enzymes, and both light- and voltage-sensitive ion channels.
Acknowledgments
We thank Andrew French, Hugh Robinson, and Matti Weckström for their comments in the initial stages of this work, Doekele Stavenga for critical reading of the final draft, and Simon Laughlin for discussions and drawing our attention to the relevant literature on visual ecology. Special thanks to Mick Swann and Chris Askham for taking part in designing and building the new set-up.
This work was supported by grants from The Royal Society, Academy of Finland, Wellcome Trust and Oskar Öfflund Foundation (to M. Juusola), and Biotechnology and Biological Sciences Research Council (to R.C. Hardie).
References
- Aho A.C., Donner K., Hyden C., Larsen L.O., Reuter T. Low retinal noise in animals with low body-temperature allows high visual sensitivity. Nature. 1988;334:348–350. doi: 10.1038/334348a0. [DOI] [PubMed] [Google Scholar]
- French A.S. Phototransduction in the fly compound eye exhibits temporal resonances and a pure time delay. Nature. 1980;283:200–202. doi: 10.1038/283200a0. [DOI] [PubMed] [Google Scholar]
- French A.S., Järvilehto M. The dynamic behaviour of photoreceptor cells in the fly in response to random (white noise) stimulation at a range of temperatures. J. Physiol. 1978;274:311–322. doi: 10.1113/jphysiol.1978.sp012149. [DOI] [PMC free article] [PubMed] [Google Scholar]
- Hardie R.C. Voltage-sensitive potassium channels in Drosophila photoreceptors. J. Neurosci. 1991;10:3079–3095. doi: 10.1523/JNEUROSCI.11-10-03079.1991. [DOI] [PMC free article] [PubMed] [Google Scholar]
- Heinrich B. The hod-blooded insects 1993. Springer-Verlag; Berlin: pp. 600 pp [Google Scholar]
- Henderson S.R., Reuss H., Hardie R.C. Single photon responses in Drosophila photoreceptors and their regulation by Ca2+ . J. Physiol. 2000;524:179–194. doi: 10.1111/j.1469-7793.2000.00179.x. [DOI] [PMC free article] [PubMed] [Google Scholar]
- Hevers W., Hardie R.C. Serotonin modulates the voltage dependence of delayed rectifier and Shaker potassium channels in Drosophila photoreceptors. Neuron. 1995;14:845–856. doi: 10.1016/0896-6273(95)90228-7. [DOI] [PubMed] [Google Scholar]
- Hochstrate P., Hamdorf K. Microvillar components of light adaptation in blowflies. J. Gen. Physiol. 1990;95:891–910. doi: 10.1085/jgp.95.5.891. [DOI] [PMC free article] [PubMed] [Google Scholar]
- Howard J., Blakeslee B., Laughlin S.B. The intracellular pupil mechanism and the maintenance of photoreceptor signal to noise ratios in the blowfly Lucilia cuprina . Proc. R. Soc. Lond. B. 1987;23:415–435. doi: 10.1098/rspb.1987.0053. [DOI] [PubMed] [Google Scholar]
- Juusola M. Linear and non-linear contrast coding in light adapted blowfly photoreceptors. J. Comp. Physiol. A. 1993;172:511–521. [Google Scholar]
- Juusola, M., and R.C. Hardie. 2000. Light adaptation in Drosophila photoreceptors: I. Response dynamics and signaling efficiency at 25°C. J. Gen. Physiol. 3–25. [DOI] [PMC free article] [PubMed]
- Juusola M., Kouvalainen E., Järvilehto M., Weckström M. Contrast gain, signal-to-noise ratio and linearity in light adapted blowfly photoreceptors. J. Gen. Physiol. 1994;104:593–621. doi: 10.1085/jgp.104.3.593. [DOI] [PMC free article] [PubMed] [Google Scholar]
- Lamb T.D. Effects of temperature-changes on toad rod photocurrents. J. Physiol. 1984;346:557–578. doi: 10.1113/jphysiol.1984.sp015041. [DOI] [PMC free article] [PubMed] [Google Scholar]
- Laughlin S.B. A simple coding procedure enhances a neurone's information capacity. Z. Naturforsch. 1981;36:910–912. [PubMed] [Google Scholar]
- Laughlin S.B., Weckström M. Fast and slow photoreceptorsa comparative study of the functional diversity of coding and conductances in the Diptera . J. Comp. Physiol. A. 1993;172:593–609. [Google Scholar]
- Leutscher-Hazellhoff J.T. Linear and nonlinear performance of transducer and pupil in Calliphora retinular cells. J. Physiol. 1975;246:333–350. doi: 10.1113/jphysiol.1975.sp010893. [DOI] [PMC free article] [PubMed] [Google Scholar]
- Lo M.-V., Pak W.L. Light-induced pigment granule migration in the retinular cells of Drosophila melanogaster . J. Gen. Physiol. 1981;77:155–175. doi: 10.1085/jgp.77.2.155. [DOI] [PMC free article] [PubMed] [Google Scholar]
- McCann G.D., MacGinitie G.F. Optomotor response studies of insect vision. Proc. R. Soc. Lond. B. 1965;163:269–401. doi: 10.1098/rspb.1965.0074. [DOI] [PubMed] [Google Scholar]
- Pak W.L., Ostroy S.E., Deland M.C., Wu C.-F. Photoreceptor mutant of Drosophilais protein involved in intermediate steps of phototransduction? Science. 1976;194:956–959. doi: 10.1126/science.824732. [DOI] [PubMed] [Google Scholar]
- Postma M., Oberwinkler J., Stavenga D.G. Does Ca2+ reach millimolar concentrations after single photon absorption in Drosophila photoreceptor microvilli? Biophys. J. 1999;77:1811–1823. doi: 10.1016/S0006-3495(99)77026-8. [DOI] [PMC free article] [PubMed] [Google Scholar]
- Roebroek J.G.H., van Tjonger M., Stavenga D.G. Temperature dependence of receptor potential and noise in fly (Calliphora erythocephala) photoreceptor cells. J. Insect Physiol. 1990;36:499–505. [Google Scholar]
- Scott K., Becker A., Sun Y., Hardy R., Zuker C.S. G(alpha) protein function in vivogenetic dissection of its role in photoreceptor cell physiology. Neuron. 1995;15:919–927. doi: 10.1016/0896-6273(95)90182-5. [DOI] [PubMed] [Google Scholar]
- Scott K., Zuker C.S. Assembly of the Drosophila phototransduction cascade into a signalling complex shapes elementary responses. Nature. 1998;395:805–808. doi: 10.1038/27448. [DOI] [PubMed] [Google Scholar]
- Tatler B., O'Carroll D.C., Laughlin S.B. Temperature and the temporal resolving power of fly photoreceptors. J. Comp. Physiol. A. 2000;186:399–407. doi: 10.1007/s003590050439. [DOI] [PubMed] [Google Scholar]
- Weckström M., Laughlin S.B. Visual ecology and voltage-gated ion channels in insect photoreceptors. Trend. Neurosci. 1995;18:17–21. doi: 10.1016/0166-2236(95)93945-t. [DOI] [PubMed] [Google Scholar]
- Wong F., Knight B.W. Adapting-bump model for eccentric cells of Limulus . J. Gen. Physiol. 1980;76:539–557. doi: 10.1085/jgp.76.5.539. [DOI] [PMC free article] [PubMed] [Google Scholar]
- Wong F., Knight B.W., Dodge F.A. Dispersion of latencies in photoreceptors of Limulus and the adapting-bump model. J. Gen. Physiol. 1980;76:517–537. doi: 10.1085/jgp.76.5.517. [DOI] [PMC free article] [PubMed] [Google Scholar]