

Abstract
The Hedgehog pathway transcription factor Gli1 induces transformation of epithelial cells via induction of Snail, a repressor of E-cadherin (E-cad). E-cad is normally complexed with β-catenin at the cell membrane. Loss of E-cad during developmental epithelial–mesenchymal transitions can switch β-catenin from its role at adherens junctions to its role in nuclear transcription. During tumorigenesis it is unclear which pathways trigger this switch. In the current study, gain- and loss-of-function approaches identified E-cad as a selective inhibitor of transformation by Gli1, and Snail knockdown was rescued by downregulation of E-cad. Gli1 induced relocalization of β-catenin from the cell membrane to the nucleus. The ability of wild-type or mutant alleles of E-cad to modulate transformation by Gli1 correlated with their ability to regulate localization of β-catenin. Inhibition of Wnt-β-catenin signaling by dominant negative Tcf4 selectively blocked in vitro transformation by Gli1. In Gli1-transgenic mice, infiltrating skin tumor cells expressed active, unphosphorylated β-catenin. Our studies identify E-cad as a selective suppressor of transformation by Gli1 and point to the Sonic Hedgehog–Gli1 pathway as a key regulator of the β-catenin switch in epithelial cells and cancers.
Keywords: Hedgehog, Snail, Gli1, E-cadherin, β-catenin, epithelial-mesenchymal transition
Introduction
Deregulated Sonic Hedgehog (Shh) signaling is implicated in the initiation, progression and/or maintenance of many human tumors, including cutaneous basal cell carcinoma (BCC), pancreatic cancers and prostate cancers (Hooper and Scott, 2005). Key effectors of Shh signaling include zinc-finger proteins of the Gli family. In mouse epidermal cells or in rat kidney epithelial cells immortalized with adenovirus E1A (i.e., RK3E cells), Gli1 rapidly induces transcription of Snail, a zinc-finger protein that represses transcription of E-cadherin and promotes the epithelial–mesenchymal transition (EMT) (Louro et al., 2002; Barrallo-Gimeno and Nieto, 2005; Li et al., 2006). Snail short-hairpin RNAs (shRNAs) or a dominant-negative (DN) allele blocked transformation of RK3E cells by Gli1, whereas exogenous Snail cooperated with Gli1 to induce transformation (Li et al., 2006).
E-cadherin (E-cad) is a type I integral membrane protein that localizes to adherens junctions and mediates Ca2+-dependent, cell–cell adhesion (Cavallaro and Christofori, 2004; Nelson and Nusse, 2004; Gumbiner, 2005; Brembeck et al., 2006). The C terminus of E-cad is linked to α-catenin and the actin cytoskeleton through association with β-catenin. In addition to its role in cell–cell adhesion, β-catenin is a nuclear effector of Wnt signaling, inducing cell proliferation and transformation. Wnt signals inhibit glycogen synthase kinase (GSK3β), which normally phosphorylates the N terminus of β-catenin and targets it for degradation (Nelson and Nusse, 2004; Bienz, 2005; Brembeck et al., 2006). The increased β-catenin then translocates to the nucleus where it associates with the DNA-binding proteins Lef/Tcf. In this complex, the C terminus of β-catenin mediates the transactivation of Wnt pathway targets such as Cyclin D1.
Participation of β-catenin in cell–cell adhesion or Wnt signaling is determined by competitive binding of β-catenin to α-catenin and the actin network versus Wnt signaling components in the cytoplasm (Gottardi and Gumbiner, 2004; Nelson and Nusse, 2004; Bienz, 2005; Gumbiner, 2005; Brembeck et al., 2006). Switching of β-catenin from cell adhesion to Wnt signaling can be induced by tyrosine phosphorylation of β-catenin, which promotes binding to BCL9–2 instead of α-catenin. In response to Wnt signaling in the primitive streak, fibroblast growth factor induces an EMT through regulation of Snail and E-cad, leading to rapid accumulation of cytosolic β-catenin (Ciruna and Rossant, 2001). Loss of E-cad during tumor progression could likewise promote Wnt signaling (Nelson and Nusse, 2004; Bienz, 2005). However, E-cad loss-of-function in tumor cells is not often associated with increased β-catenin signaling and specific contexts in which the cadherin-bound pool of β-catenin is released for signaling remain poorly understood (van de Wetering et al., 2001; Gottardi and Gumbiner, 2004; Nelson and Nusse, 2004; Gumbiner, 2005).
The Hedgehog family member Indian Hedgehog can suppress Wnt–β-catenin signaling in colonic epithelial cells, and Gli1 may contribute to this effect (van den Brink et al., 2004; Akiyoshi et al., 2006). However, in other contexts Wnt signaling can be a downstream effector of Shh. In Drosophila imaginal discs, wingless is directly regulated by the Gli homologue Ci (Von Ohlen et al., 1997). In Xenopus animal caps, induction of Wnt8 and Wnt11 is important for Gli2-mediated alteration of the posterior mesoderm (Mullor et al., 2001). Human BCCs have constitutive Shh pathway signaling and show increased levels of Wnt2b and Wnt5a and increased levels of nuclear β-catenin (Bonifas et al., 2001; El Bahrawy et al., 2003; Saldanha et al., 2004; Hooper and Scott, 2005). As observed for Shh pathway genes such as Gli1, β-catenin promotes follicle-like tumors or BCCs in transgenic mice (Alonso and Fuchs, 2003; Nicolas et al., 2003). In the current study, we identify E-cad as a selective suppressor of transformation by Gli1, identify a positive feedback loop in which Snail maintains Gli1 expression and suggest a model in which Gli1 acts through Wnts and Snail to induce the β-catenin switch during epithelial transformation.
Results
DN Tcf4 inhibits transformation by Gli1 but not by other genes
To investigate the role of E-cad and Wnt signaling in the cellular response to Gli1, we utilized in vitro transformation of immortalized rat kidney cells, an epithelial model previously used for analysis of mechanisms of transformation by β-catenin, γ-catenin, Notch and Jagged1 (Kolligs et al., 1999, 2000; Ascano et al., 2003). Tcf alleles lacking the N-terminal, β-catenin-binding sequence, such as Tcf4ΔN31, act as DNs and effectively inhibit Wnt signaling (Kolligs et al., 1999, 2000). Compared with parental RK3E cells, Gli1-induced foci in RK3E–Tcf4ΔN31 were reduced by 85% (mean no. of foci/dish: RK3E–Tcf4ΔN31, 12.8; RK3E, 85.7; Figure 1a and b). Quantification was performed on stained dishes by counting foci >0.5 mm in diameter. As controls, ErbB2 induced 31.0 and 29.0 foci/dish, whereas H-Ras induced 93.0 and 97.0 foci/dish in RK3E and RK3E–Tcf4ΔN31, respectively (Figure 1a and b). The inhibitory effect of Tcf4ΔN31 on Gli1 in these cells was similar to that observed when activated β-catenin was the transforming agent (Kolligs et al., 1999).
Figure 1.

Inhibition of Gli1-mediated transformation by DN Tcf4. (a) Parental RK3E or RK3E-Tcf4ΔN31 cells were transfected with vectors for Gli1 or ErbB2 or with pBABE-puro control. Cells were fixed and stained 2 weeks later. (b) Transformation efficiency was determined by counting foci. Two experiments were performed in duplicate and standard deviation (s.d.) bars are shown. (c) Induction of Wnt transcripts in response to Gli1 in RK3E cells. Semi-quantitative RT–PCR analysis was applied to cells that conditionally express Gli1 in response to tet (RTOG10 cells, lanes 1–4), to parental RK3E cells (lane 5) and to Gli1-transformed RK3E cells (lane 6). Snail, a direct transcriptional target (Louro et al., 2002; Li et al., 2006), served as a positive control and Gapdh served as a control for mRNA input.
Rapid induction of multiple Wnts by Gli1
Wnt ligands such as Wnt2b are expressed in Gli1-transformed RK3E cells, in Gli1-induced skin tumors or in human BCCs (Bonifas et al., 2001; Mullor et al., 2001; Louro et al., 2002). To temporally correlate Gli1 activity with Wnt transcript levels, we used RTOG10 cells, a clone of RK3E that contains a tetracycline (tet)-inducible Gli1 allele (Li et al., 2006). Microarray analysis of these cells identified Wnt4 and Wnt7b as early responses to Gli1 (3 h, data not shown). By semi-quantitative reverse transcription–polymerase chain reaction (RT–PCR), transcripts of Wnt7b were induced by 3 h (Figure 1c, lanes 1–4), similar to the direct transcriptional target Snail (Li et al., 2006). Induction of Wnt4 was slight at 3 h and prominent at 6 h, whereas Wnt2b was induced between 3 and 6 h (Louro et al., 2002). These Wnts were also increased in Gli-C cells, a Gli1-transformed clone of RK3E (Figure 1c, lanes 5–6) (Louro et al., 1999).
Gli1 induces the accumulation of transcriptionally active β-catenin in cell nuclei
To determine whether or not Gli1 can alter the localization of β-catenin, we analysed cells by immunofluorescence. In RK3E cells, β-catenin was at the cell periphery and did not appreciably overlap the nuclei (Figure 2a, β-cat/4,6-diamidino-2-phenylindole (DAPI)) or the actin cytoskeleton (β-cat/phalloidin). In contrast, Gli-C cells showed reduced staining at the cell periphery and prominent, diffuse staining of the cytoplasm and nucleus, similar to cells with activated Wnt signaling (Kolligs et al., 2000) (Figure 2a, lower panels).
Figure 2.

Activation of β-catenin signaling in response to Gli1 in vitro and in vivo. (a) β-catenin (β-cat, shown in red) was detected in RK3E and Gli-C by indirect immunofluorescence. Nuclei were stained with DAPI (shown in blue) and the cytoplasm was stained with phalloidin (in green). Scale bars, 5 μ. (b) Cytosolic and nuclear proteins were isolated from the indicated cell lines by sequential extraction. β-catenin was detected by immunoblotting. As a control for loading and to demonstrate successful fractionation, filters were reprobed with antibodies to β-tub, a cytoplasmic protein, and Lamin B1, a nuclear protein. (c) Topflash (WT Tcf4-binding sites) or Fopflash (mutated sites) reporter constructs were transfected into RK3E cells or cells transformed by Gli1 (Gli-C) or Notch1. Data were normalized using a Renilla luciferase internal control and Fopflash activity in RK3E cells was set to 1.0. Two experiments were performed in triplicate. Bars, s.d. (d) HEK293 cells were transfected with Topflash or Fopflash, a Renilla luciferase control, and the indicated amount of a Gli1 vector. After normalization to the Renilla control, the Fopflash activity for vector-transfected cells (0.0 μg Gli1) was set to 1.0. Bars, s.d. (e) Antibody that detects the active, unphosphorylated form of β-cat was used to stain paraffin sections of BCC-like skin lesions from Gli1 transgenic mice (Li et al., 2006). Staining was detected using a brown chromogen. Normal mouse IgG served as negative control and arrows indicate the dermo-epidermal junction. Scale bar, 100 μ.
We used immunoblot analysis to analyse the nuclear and cytoplasmic pools of β-catenin (Figure 2b). Compared with RK3E cells, Gli-C cells showed increased nuclear β-catenin consistent with the immunostaining analysis above. Overall levels of β-catenin were similar in these two lines (data not shown).
To test whether this increased nuclear β-catenin is active in transcription, we used a Tcf-responsive reporter. Tcf activity was observed in Gli-C cells but not in RK3E cells or Notch1-transformed cells, a control (Figure 2c). In addition, transfection of HEK293 cells with pcDNA3.1-HA-Gli1 induced Tcf activity (Figure 2d).
Nuclear β-catenin is increased in human BCCs (El Bahrawy et al., 2003; Saldanha et al., 2004). We stained sections of BCC-like lesions induced by tet on Gli1 (Li et al., 2006) using an antibody to the active, unphosphorylated form of β-catenin. The superficial epithelium stained weakly, whereas the more infiltrative basaloid cells stained prominently (Figure 2e). This pattern is opposite to the pattern of E-cad in these lesions (Li et al., 2006). As Gli1 is uniformly induced by tet in the epidermis (Huang et al., 2005; Li et al., 2006), the apparent restriction of Gli1 effects to infiltrating cells may reflect post-translational regulation. In contrast, antibody to total β-catenin uniformly stained the tumor cells (not shown).
Enforced expression of E-cad suppresses Gli1-mediated transformation
RK3E cells stably transduced with a mouse E-cad retroviral vector showed increased expression of a species that comigrates with the endogenous protein (Figure 3a). RK3E–E-cad cells were similar to vector cells in cell morphology and growth rate (not shown). To assess the effect on transformation, we co-transfected vectors for Gli1 or ErbB2 with E-cad or empty vector (Figure 3b and c). E-cad suppressed Gli1-mediated transformation by 83%, (mean no. of foci/dish: Gli1 + Vector, 17.8; Gli1 + E-cad, 3.0), but showed no effect on ErbB2 (ErbB2 + Vector, 16.0; ErbB2 + E-cad, 16.7). As observed for Tcf4ΔN31, E-cad functions as a selective suppressor of transformation by Gli1.
Figure 3.
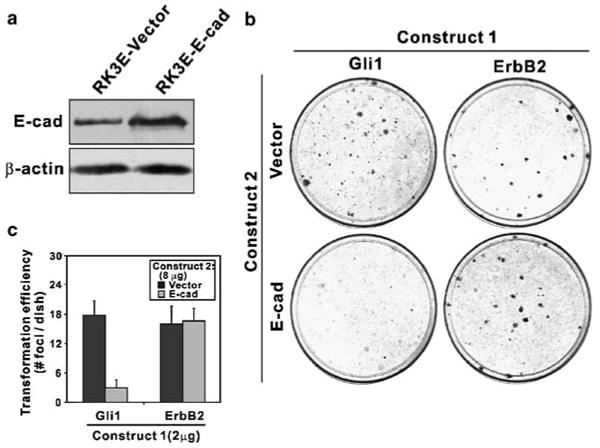
Suppression of Gli1-mediated transformation by E-cad. (a) E-cad was detected by immunoblot analysis following retroviral transduction of an E-cad vector or a control and selection in culture. β-Actin served as a control for loading. (b) The indicated plasmids (Construct 1, Construct 2) were cotransfected into RK3E cells and transformed foci were scored at 2–3 weeks. Assays were performed twice in triplicate. (c) Quantitation of the assays shown in (b). Bars, s.d.
E-cad loss-of-function promotes transformation by Gli1
shRNAs that target rat E-cad were expressed in RK3E cells (see Supplementary Tables 1 and 2). Immunoblot analysis of early passage, G418-resistant cells derived from pooled colonies showed that E-cadsh1 or E-cadsh2 suppressed E-cad (Figure 4a). Based upon the size and number of colonies obtained using the E-cad shRNAs versus control (not shown), E-cad knockdown had little effect on the cell growth rate, as previously shown using Snail vector (Li et al., 2006). Whether these E-cad-low cells show other properties of malignant cells in vitro or in vivo has not been studied.
Figure 4.
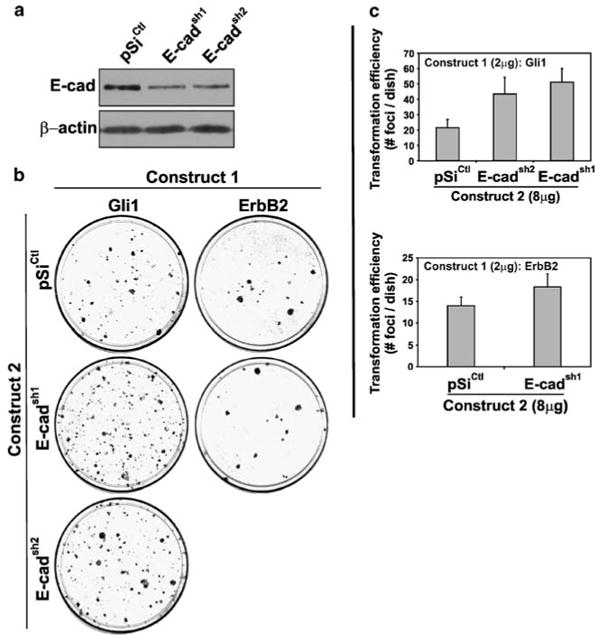
E-cad loss-of-function promotes Gli1-mediated transformation. (a) Immunoblot analysis of E-cad in cells expressing the indicated shRNA. RK3E cells were transfected by electroporation with pSilencer vectors that express shRNAs under control of the U6 promoter. Cells were selected in G418 before preparation of whole cell extracts. β-Actin served as a control for loading. (b) Gli1 or ErbB2 vectors (Construct 1) were transfected into RK3E cells together with shRNA vectors (Construct 2). Transformed foci were scored at 2–3 weeks. Assays were performed twice in triplicate. (c) Quantitation of the assays shown in (b). Bars, s.d.
When co-transfected with Gli1 or ErbB2, E-cadsh1 or E-cadsh2 promoted the outgrowth of Gli1-transformed cells (mean no. of foci/dish: Gli + pSiCtl, 21.6; Gli1 + E-cadsh1, 51.2; Gli1 + E-cadsh2, 43.4; Figure 4b and c). In contrast, the efficiency of ErbB2-induced transformation showed little change (Figure 4b and c).
Snail loss-of-function is rescued by downregulation of E-cad
Snail shRNAs induce E-cad in Gli-C cells and block Gli1 transformation (Li et al., 2006). When co-transfected with Snash3 vector (Li et al., 2006), E-cadsh2 and E-cadsh1 promoted Gli1 transformation by three-fold and fivefold relative to pSiCtl (mean number of foci/dish: Gli1 + Snash3 + pSiCtl, 6.0; Gli1 + Snash3 + E-cadsh2, 20.8; Gli1 + Snash3 + E-cadsh1, 30.8; Figure 5a and b). Thus, suppression of E-cad is a major mechanism by which Snail contributes to transformation by Gli1.
Figure 5.

E-cad loss-of-function is sufficient to promote Gli1-mediated transformation when Snail is suppressed. (a) The indicated quantities of Gli1 and shRNA vectors were transfected into RK3E cells and transformed foci were scored at 2–3 weeks. Assays were performed twice in triplicate. (b) Quantitation of the assays shown in (a). Bars, s.d.
The transformation suppressor activity of E-cad requires β-catenin binding
E-cadΔβ–cat, containing a 35 amino-acid deletion in the C terminus, fails to interact with β-catenin but retains the cell–cell adhesion function (Figure 6a) (Gottardi et al., 2001). E-cadcyto is a fusion of the E-cad cytoplasmic domain to the extracellular and transmembrane domains of the IL2R (Gottardi et al., 2001). Similar constructs are inactive in cell–cell adhesion. In SW480 colorectal carcinoma cells, E-cadcyto inhibits Wnt signaling and blocks cell growth, perhaps by trapping β-catenin in the cytosol.
Figure 6.

Analysis of functionally impaired mutants of E-cad in cell growth and transformation. (a) RK3E cells were transduced by retroviruses encoding E-cadcyto, E-cadΔβ–cat or empty vector, and E-cad was detected by immunoblot. As a control for loading, Lamin B1 was bound to the same filter. Molecular weight (MW) markers are indicated on the right. (b) The indicated plasmids were transfected into RK3E using Lipofectamine and transformed foci were scored at 2–3 weeks. One experiment was performed using five replicates. (c) Quantitation of the transformation assays shown in (b). Bars, s.d. (d) Cells stably transduced with the indicated constructs were plated at 1 × 10³ cells per dish and colonies were selected for 9 days. To assess colony size and number, cells were fixed and incubated in Wright's stain. (e) The morphology of live cells was examined by phase contrast microscopy. Arrowheads indicate the edge of an area of Gli1 cells with a transformed morphology. Scale bars, 50 μm.
Unlike wild-type (WT) E-cad, E-cadΔβ–cat did not block transformation by Gli1 (mean no. of foci/dish: Gli1 + Vector, 21.0; Gli1 + E-cadΔβ–cat, 20.6; Gli1 + E-cad, 3.0; Figure 6b and c), indicating that β-catenin binding is required. Unexpectedly, E-cadcyto induced 2.9-fold more foci when co-transfected with Gli1 (mean foci/dish, 61.2 versus 21.0; Figure 6b and c). E-cadcyto did not promote cell growth independent of Gli1, as indicated by the colony size and number and cell morphology of transfected cells (Figure 6d and e).
Gli1 activity correlates with nuclear localization of β-catenin
We next determined how regulators of Gli1 transformation affect β-catenin (Figure 7a). RK3E cells were stably transduced with E-cad, E-cadcyto, Snail or a control retrovirus ((−) Gli1), and then transduced with a Gli1 retrovirus ((+) Gli1). Nuclear and cytosol extracts were prepared 14 days later. Gli1 promoted nuclear localization of β-catenin in settings where it is active in transformation, including vector cells, E-cadcyto cells and Snail cells (Figure 7a, compare upper and middle panels, lanes 5, 7 and 8). In E-cad cells, where Gli1 activity is suppressed, nuclear localization of β-catenin was not increased (Figure 7a, compare upper and middle panels, lane 6). E-cadcyto and Snail, which augment transformation by Gli1, also promoted nuclear expression of β-catenin (Figure 7a, compare lanes 5, 7 and 8, upper panels). In the absence of Gli1, β-catenin levels were similar in all lines except for E-cadcyto cells, which accumulated β-catenin in the cytoplasm (Figure 7a, middle panel, lane 3). When transduced with Gli1, E-cadcyto cells showed accumulation of β-catenin in the cytoplasm and nucleus (Figure 7a, upper panel, compare lanes 3 and 1, compare lanes 7 and 5). Thus, E-cadcyto increased the signaling-competent pool of β-catenin independent of Gli1. Unexpectedly, Snail cells showed increased Gli1 in the nucleus and cytoplasm (Figure 7a, lower panel, lanes 4 and 8).
Figure 7.

Modulation of β-catenin nuclear localization during transformation by Gli1. (a) RK3E cells were transduced with the retroviral constructs E-cad, E-cadcyto, Snail or vector. These cells were cultured in selective media and then transduced with a Gli1 retroviral vector. Cells stably expressing Gli1 ((+) Gli1) were compared with cells carrying only the first transgene ((−) Gli1). Cytosolic and nuclear fractions were analysed by immunoblot using the antibodies indicated to the left. β-tub or Lamin B1 were utilized as loading controls for cytosolic or nuclear extracts, respectively (Control). (b) Analysis of Wnt-β-catenin-induced transcripts. Semi-quantitative RT–PCR assays utilized Gapdh as a control for mRNA input. (c) Induction of the β-catenin switch by Gli1 in epithelial cells. Arrows indicate inductions and crossbars denote repression or reduced activity. Solid lines indicate direct effects and dashed lines represent indirect effects (e.g., regulation of mTOR by GSK3β) or else effects that are not yet characterized as direct or indirect.
By semi-quantitative RT–PCR, the Wnt targets Cyclin D1 and Twist2 were induced in Gli-C cells, whereas c-Myc was diminished (Figure 7b). Indeed, c-Myc is not upregulated by β-catenin in RK3E cells (Kolligs et al., 1999) and the expression profiles of RK3E cells transformed by c-Myc or Gli1 are distinct (Louro et al., 2002). As γ-catenin induces c-Myc in RK3E (Kolligs et al., 2000), our results suggest that Gli1 signals through β-catenin rather than γ-catenin.
Discussion
In the current study, we identified regulation of E-cad as a mechanism by which Snail promotes transformation by Gli1. This conclusion was supported by the ability of E-cad shRNAs to rescue Gli1 activity following Snail knockdown. E-cad suppresses Gli1 activity by binding to β-catenin. β-catenin activity or nuclear localization was promoted by Gli1 in several settings and was required for transformation by Gli1, but not by ErbB2 or H-Ras, as indicated by use of DN Tcf4. This result was supported by the ability of E-cadcyto to stabilize β-catenin and to promote Gli1-mediated transformation. As Gli1 fails to completely suppress E-cad during epithelial transformation, other mechanisms that suppress E-cad might cooperate with Gli1 during tumor progression.
Loss of E-cad expression is observed in human carcinomas, including BCC (Cavallaro and Christofori, 2004; Li et al., 2006). Although E-cad's role as an invasion suppressor is well-established (Cavallaro and Christofori, 2004; Brembeck et al., 2006), its ability to suppress tumor cell growth or oncogene-induced transformation in vitro is less studied.
The Shh and Wnt pathways interact at multiple levels and coordinate developmental transitions in mammals (Nusse, 2003). GSK3β acts in the Wnt pathway but also regulates Hedgehog signaling, including the Gli1-target gene Snail (Zhou et al., 2004; Bachelder et al., 2005; Yook et al., 2005; Price, 2006). Wnt and Shh signals play distinct roles in the development of hair follicles in the skin (Alonso and Fuchs, 2003; Silva-Vargas et al., 2005; Brembeck et al., 2006). Wnt signals initiate hair bud and follicle formation, whereas Shh signals potentiate the Wnt effects and are required for the subsequent proliferation/migration of bud or follicle cells.
Our studies support the idea that Shh–Gli signaling can feed back into the Wnt pathway (Figure 7c). In addition to directly inducing Snail transcription (Louro et al., 2002), Gli1 induces transcription of at least three Wnt family members, Wnt2b, Wnt4 and Wnt7b. As Snail alone does not induce nuclear localization of β-catenin, coinduction of Snail and Wnts by Gli1 may synergize to switch β-catenin from cell adhesion to nuclear signaling. Wnt signaling to GSK3β can further promote Snail transcription and stabilize the protein (Zhou et al., 2004; Bachelder et al., 2005; Yook et al., 2005). Snail promoted expression of Gli1 in our studies, probably by a post-transcriptional mechanism. This induction generates two positive feedback loops: Gli1 → Snail → Gli1 and Gli1 → Wnt → GSK3β → Snail → Gli1 (Figure 7c).
Wnt-mediated inhibition of GSK3β activates the mammalian target of rapamycin (mTOR) kinase, identifying rapamycin and related inhibitors of mTOR as antagonists of malignant cells with active Wnt signaling (Inoki et al., 2006) (Figure 7c). This signaling may explain how Gli1 activates mTOR and how mTOR inhibitors block transformation by Gli1, as we showed previously (Louro et al., 1999). In summary, our studies identify Shh–Gli1-expressing epithelial cells as a setting in which Snail-induced EMT and increased cell growth are linked by the dual roles of β-catenin.
Materials and methods
Expression vectors
WT E-cad (Genbank X06115) was released from pEM2 (Nagafuchi et al., 1987) by digestion with StuI and EcoRV. The blunted 3.3 kb fragment was ligated to BstXI adaptors and then inserted into the same site of the MMLV retroviral vector pCTV3B, which confers resistance to hygromycin. E-cadcyto and E-cadΔβ–cat plasmids were provided by Cara Gottardi (Northwestern University, Chicago, IL, USA) and the inserts were cloned into the pBABE-puro. For targeting of rat E-cad, hairpin fragments (Supplementary Table 1) were ligated to pSilencer 2.1-U6 neo (Ambion, Austin, TX, USA), electroporated into XL1-Blue cells (Stratagene, La Jolla, CA, USA) and verified by sequencing. The constructs pSnash3, encoding an shRNA against Snail, and pSiCtl, containing a hairpin sequence without similarity to mammalian cDNAs, were reported previously (Li et al., 2006).
Cell culture and transfection
To generate RK3E cells stably expressing E-cad, E-cadcyto and E-cadΔβ–cat, retroviral transduction and antibiotic selection was performed as described (Foster et al., 1999). Vector cells and Snail cells were generated previously by the same methods using pBABE-puro or pBABE-puro-Snail (Li et al., 2006). To introduce Gli1, each of these lines were transduced with the neo vector pLJD-HA-Gli1 (Louro et al., 2002). RK3E–Tcf4ΔN31 cells were generated previously by Fearon and colleagues by retroviral transduction of RK3E cells, followed by mass selection in G418.
Transformation assays were performed following lipid-mediated transfection of 10.0 μg of plasmid into 70% confluent cells (Li et al., 2006). Cells were fixed and incubated in Wright's stain at 2–3 weeks post-transfection. Expression vectors for Gli1 (pLTR6) (Ruppert et al., 1991), ErbB2 (Li et al., 2006) or H-Ras (pHO6T1) were transfected directly into RK3E or RK3E-Tcf4ΔN31 cells. For cotransfection experiments, 2.0 μg of Gli1 or ErbB2 vector were cotransfected with a total of 8.0 μg of the indicated plasmid(s). For colony morphology analysis, cells were plated in 10 cm tissue culture dishes and selected for 9 days in G418 (400 μg/ml) or puromycin (80 μg/ml).
For analysis of shRNA-mediated E-cad knockdown, RK3E cells were transfected by electroporation of pSilencer constructs (protocol available upon request). Populations of cells were selected for 2 weeks in 400 μg/ml of G418 and whole cell extracts were prepared for immunoblot analysis.
Subcellular fractionation and immunoblot analysis
Fractionation was performed by sequential extraction of cytosolic and nuclear proteins in non-ionic detergent as described (Jian et al., 2006). Antibodies to β-catenin (BD Biosciences, San Jose, CA, USA, no. 610153, used at 0.5 μg/ml), β-tubulin (β-tub) (Sigma-Aldrich, St Louis, MO, USA, no. T0198, 0.55 μg/ml), Lamin B1 (GeneTex, San Antonio, TX, USA, no. GTX16048, 0.1 μg/ml) and Gli1 (Li et al., 2006) were used to detect proteins. For analysis of E-cad, whole cell extracts were prepared by application of hot Laemlli buffer to cells. Sodium dodecyl sulfate extracts were quantitated by amido black staining of spotted samples. E-cad antibody (BD Biosciences no. 610181) was used at 0.1 μg/ml and β-actin antibody (Sigma no. A5316) was used at 0.26 μg/ml. Bound antibodies were detected by chemiluminescence (Pierce, Rockford, IL, USA).
Other materials and methods
Descriptions of the luciferase reporter assays, mRNA expression assays, immunostaining assays and digital imaging are available at the Oncogene website as Supplementary Information.
Supplementary Material
Supplementary Information accompanies the paper on the Oncogene website (http://www.nature.com/onc).
Acknowledgments
We thank Eric Fearon and Frank Kolligs for Tcf4ΔN31 cells, and Bert Vogelstein, M Takeichi, Robert Kay and Cara J Gottardi for plasmids. This work was supported by Grants CA094030 and CA065686 from the US National Cancer Institute.
Abbreviations
- Shh
Sonic Hedgehog
- EMT
epithelial-mesenchymal transition
- DN
dominant-negative
- WT
wild-type
- BCC
basal cell carcinoma
- shRNA
short-hairpin RNA
References
- Akiyoshi T, Nakamura M, Koga K, Nakashima H, Yao T, Tsuneyoshi M, et al. Gli1, downregulated in colorectal cancers, inhibits proliferation of colon cancer cells involving Wnt signalling activation. Gut. 2006;55:991–999. doi: 10.1136/gut.2005.080333. [DOI] [PMC free article] [PubMed] [Google Scholar]
- Alonso L, Fuchs E. Stem cells in the skin: waste not, Wnt not. Genes Dev. 2003;17:1189–1200. doi: 10.1101/gad.1086903. [DOI] [PubMed] [Google Scholar]
- Ascano JM, Beverly LJ, Capobianco AJ. The C-terminal PDZ-ligand of JAGGED1 is essential for cellular transformation. J Biol Chem. 2003;278:8771–8779. doi: 10.1074/jbc.M211427200. [DOI] [PubMed] [Google Scholar]
- Bachelder RE, Yoon SO, Franci C, Garcia de Herreros A, Mercurio AM. Glycogen synthase kinase-3 is an endogenous inhibitor of Snail transcription: implications for the epithelial–mesenchymal transition. J Cell Biol. 2005;168:29–33. doi: 10.1083/jcb.200409067. [DOI] [PMC free article] [PubMed] [Google Scholar]
- Barrallo-Gimeno A, Nieto MA. The Snail genes as inducers of cell movement and survival: implications in development and cancer. Development. 2005;132:3151–3161. doi: 10.1242/dev.01907. [DOI] [PubMed] [Google Scholar]
- Bienz M. Catenin: a pivot between cell adhesion and Wnt signalling. Curr Biol. 2005;15:R64–R67. doi: 10.1016/j.cub.2004.12.058. [DOI] [PubMed] [Google Scholar]
- Bonifas JM, Pennypacker S, Chuang PT, McMahon AP, Williams M, Rosenthal A, et al. Activation of expression of hedgehog target genes in basal cell carcinomas. J Invest Dermatol. 2001;116:739–742. doi: 10.1046/j.1523-1747.2001.01315.x. [DOI] [PubMed] [Google Scholar]
- Brembeck FH, Rosario M, Birchmeier W. Balancing cell adhesion and Wnt signaling, the key role of beta-catenin. Curr Opin Genet Dev. 2006;16:51–59. doi: 10.1016/j.gde.2005.12.007. [DOI] [PubMed] [Google Scholar]
- Cavallaro U, Christofori G. Cell adhesion and signalling by cadherins and Ig-CAMs in cancer. Nat Rev Cancer. 2004;4:118–132. doi: 10.1038/nrc1276. [DOI] [PubMed] [Google Scholar]
- Ciruna B, Rossant J. FGF signaling regulates mesoderm cell fate specification and morphogenetic movement at the primitive streak. Dev Cell. 2001;1:37–49. doi: 10.1016/s1534-5807(01)00017-x. [DOI] [PubMed] [Google Scholar]
- El Bahrawy M, El Masry N, Alison M, Poulsom R, Fallowfield M. Expression of beta-catenin in basal cell carcinoma. Br J Dermatol. 2003;148:964–970. doi: 10.1046/j.1365-2133.2003.05240.x. [DOI] [PubMed] [Google Scholar]
- Foster KW, Ren S, Louro ID, Lobo-Ruppert SM, McKie-Bell P, Grizzle W, et al. Oncogene expression cloning by retroviral transduction of adenovirus E1a-immortalized rat kidney RK3E cells: transformation of a host with epithelial features by c-MYC and the zinc-finger protein GKLF. Cell Growth Differ. 1999;10:423–434. [PubMed] [Google Scholar]
- Gottardi CJ, Gumbiner BM. Distinct molecular forms of beta-catenin are targeted to adhesive or transcriptional complexes. J Cell Biol. 2004;167:339–349. doi: 10.1083/jcb.200402153. [DOI] [PMC free article] [PubMed] [Google Scholar]
- Gottardi CJ, Wong E, Gumbiner BM. E-cadherin suppresses cellular transformation by inhibiting beta-catenin signaling in an adhesion-independent manner. J Cell Biol. 2001;153:1049–1060. doi: 10.1083/jcb.153.5.1049. [DOI] [PMC free article] [PubMed] [Google Scholar]
- Gumbiner BM. Regulation of cadherin-mediated adhesion in morphogenesis. Nat Rev Mol Cell Biol. 2005;6:622–634. doi: 10.1038/nrm1699. [DOI] [PubMed] [Google Scholar]
- Hooper JE, Scott MP. Communicating with Hedgehogs. Nat Rev Mol Cell Biol. 2005;6:306–317. doi: 10.1038/nrm1622. [DOI] [PubMed] [Google Scholar]
- Huang CC, Liu Z, Li X, Bailey SK, Nail CD, Foster KW, et al. KLF4 and PCNA identify stages of tumor initiation in a conditional model of cutaneous squamous epithelial neoplasia. Cancer Biol Ther. 2005;4:1401–1408. doi: 10.4161/cbt.4.12.2355. [DOI] [PMC free article] [PubMed] [Google Scholar]
- Inoki K, Ouyang H, Zhu T, Lindvall C, Wang Y, Zhang X, et al. TSC2 integrates Wnt and energy signals via a coordinated phosphorylation by AMPK and GSK3 to regulate cell growth. Cell. 2006;126:955–968. doi: 10.1016/j.cell.2006.06.055. [DOI] [PubMed] [Google Scholar]
- Jian H, Shen X, Liu I, Semenov M, He X, Wang XF. Smad3-dependent nuclear translocation of beta-catenin is required for TGF-beta1-induced proliferation of bone marrow-derived adult human mesenchymal stem cells. Genes Dev. 2006;20:666–674. doi: 10.1101/gad.1388806. [DOI] [PMC free article] [PubMed] [Google Scholar]
- Kolligs FT, Hu G, Dang CV, Fearon ER. Neoplastic transformation of RK3E by mutant β-catenin requires deregulation of Tcf/Lef transcription but not activation of c-myc expression. Mol Cell Biol. 1999;19:5696–5706. doi: 10.1128/mcb.19.8.5696. [DOI] [PMC free article] [PubMed] [Google Scholar]
- Kolligs FT, Kolligs B, Hajra KM, Hu G, Tani M, Cho KR, et al. Catenin is regulated by the APC tumor suppressor and its oncogenic activity is distinct from that of beta-catenin. Genes Dev. 2000;14:1319–1331. [PMC free article] [PubMed] [Google Scholar]
- Li X, Deng W, Nail CD, Bailey SK, Kraus MH, Ruppert JM, et al. Snail induction is an early response to Gli1 that determines the efficiency of epithelial transformation. Oncogene. 2006;25:609–621. doi: 10.1038/sj.onc.1209077. [DOI] [PMC free article] [PubMed] [Google Scholar]
- Louro ID, Bailey EC, Li X, South LS, McKie-Bell PR, Yoder BK, et al. Comparative gene expression profile analysis of GLI and c-MYC in an epithelial model of malignant transformation. Cancer Res. 2002;62:5867–5873. [PubMed] [Google Scholar]
- Louro ID, McKie-Bell P, Gosnell H, Brindley BC, Bucy RP, Ruppert JM. The zinc-finger protein GLI induces cellular sensitivity to the mTOR inhibitor rapamycin. Cell Growth Differ. 1999;10:503–516. [PubMed] [Google Scholar]
- Mullor JL, Dahmane N, Sun T, Altaba A. Wnt signals are targets and mediators of Gli function. Curr Biol. 2001;11:769–773. doi: 10.1016/s0960-9822(01)00229-9. [DOI] [PubMed] [Google Scholar]
- Nagafuchi A, Shirayoshi Y, Okazaki K, Yasuda K, Takeichi M. Transformation of cell adhesion properties by exogenously introduced E-cadherin cDNA. Nature. 1987;329:341–343. doi: 10.1038/329341a0. [DOI] [PubMed] [Google Scholar]
- Nelson WJ, Nusse R. Convergence of Wnt, beta-catenin, and cadherin pathways. Science. 2004;303:1483–1487. doi: 10.1126/science.1094291. [DOI] [PMC free article] [PubMed] [Google Scholar]
- Nicolas M, Wolfer A, Raj K, Kummer JA, Mill P, van Noort M, et al. Notch1 functions as a tumor suppressor in mouse skin. Nat Genet. 2003;33:416–421. doi: 10.1038/ng1099. [DOI] [PubMed] [Google Scholar]
- Nusse R. Wnts and Hedgehogs: lipid-modified proteins and similarities in signaling mechanisms at the cell surface. Development. 2003;130:5297–5305. doi: 10.1242/dev.00821. [DOI] [PubMed] [Google Scholar]
- Price MA. CKI, there's more than one: casein kinase I family members in Wnt and Hedgehog signaling. Genes Dev. 2006;20:399–410. doi: 10.1101/gad.1394306. [DOI] [PubMed] [Google Scholar]
- Ruppert JM, Vogelstein B, Kinzler KW. The zinc-finger protein GLI transforms rodent cells in cooperation with adenovirus E1A. Mol Cell Biol. 1991;11:1724–1728. doi: 10.1128/mcb.11.3.1724. [DOI] [PMC free article] [PubMed] [Google Scholar]
- Saldanha G, Ghura V, Potter L, Fletcher A. Nuclear beta-catenin in basal cell carcinoma correlates with increased proliferation. Br J Dermatol. 2004;151:157–164. doi: 10.1111/j.1365-2133.2004.06048.x. [DOI] [PubMed] [Google Scholar]
- Silva-Vargas V, Lo CC, Giangreco A, Ofstad T, Prowse DM, Braun KM, et al. Beta-catenin and Hedgehog signal strength can specify number and location of hair follicles in adult epidermis without recruitment of bulge stem cells. Dev Cell. 2005;9:121–131. doi: 10.1016/j.devcel.2005.04.013. [DOI] [PubMed] [Google Scholar]
- van de Wetering M, Barker N, Harkes IC, van der HM, Dijk NJ, Hollestelle A, et al. Mutant E-cadherin breast cancer cells do not display constitutive Wnt signaling. Cancer Res. 2001;61:278–284. [PubMed] [Google Scholar]
- van den Brink GR, Bleuming SA, Hardwick JC, Schepman BL, Offerhaus GJ, Keller JJ, et al. Indian Hedgehog is an antagonist of Wnt signaling in colonic epithelial cell differentiation. Nat Genet. 2004;36:277–282. doi: 10.1038/ng1304. [DOI] [PubMed] [Google Scholar]
- Von Ohlen T, Lessing D, Nusse R, Hooper JE. Hedgehog signaling regulates transcription through cubitus interruptus, a sequence-specific DNA-binding protein. Proc Natl Acad Sci USA. 1997;94:2404–2409. doi: 10.1073/pnas.94.6.2404. [DOI] [PMC free article] [PubMed] [Google Scholar]
- Yook JI, Li XY, Ota I, Fearon ER, Weiss SJ. Wnt-dependent regulation of the E-cadherin repressor Snail. J Biol Chem. 2005;280:11740–11748. doi: 10.1074/jbc.M413878200. [DOI] [PubMed] [Google Scholar]
- Zhou BP, Deng J, Xia W, Xu J, Li YM, Gunduz M, et al. Dual regulation of Snail by GSK-3β-mediated phosphorylation in control of epithelial–mesench-ymal transition. Nat Cell Biol. 2004;6:931–940. doi: 10.1038/ncb1173. [DOI] [PubMed] [Google Scholar]
Associated Data
This section collects any data citations, data availability statements, or supplementary materials included in this article.
Supplementary Materials
Supplementary Information accompanies the paper on the Oncogene website (http://www.nature.com/onc).